Evolution of a pyrocumulonimbus event associated with an extreme wildfire in Tasmania, Australia
←
→
Page content transcription
If your browser does not render page correctly, please read the page content below
Nat. Hazards Earth Syst. Sci., 20, 1497–1511, 2020
https://doi.org/10.5194/nhess-20-1497-2020
© Author(s) 2020. This work is distributed under
the Creative Commons Attribution 4.0 License.

Evolution of a pyrocumulonimbus event associated with an extreme
wildfire in Tasmania, Australia
Mercy N. Ndalila1 , Grant J. Williamson1 , Paul Fox-Hughes2 , Jason Sharples3 , and David M. J. S. Bowman1
1 School of Natural Sciences, University of Tasmania, Hobart, TAS 7001, Australia
2 Bureau of Meteorology, Hobart, TAS 7001, Australia
3 School of Science, University of New South Wales, Canberra, ACT 2601, Australia

Correspondence: Mercy N. Ndalila (mercy.ndalila@utas.edu.au)

Received: 24 October 2019 – Discussion started: 19 December 2019
Revised: 30 March 2020 – Accepted: 18 April 2020 – Published: 27 May 2020

Abstract. Extreme fires have substantial adverse effects on       ciated with pyroCb development. Our findings have implica-
society and natural ecosystems. Such events can be associ-        tions for fire weather forecasting and wildfire management,
ated with the intense coupling of fire behaviour with the at-     and they highlight the vulnerability of south-east Tasmania
mosphere, resulting in extreme fire characteristics such as py-   to extreme fire events.
rocumulonimbus cloud (pyroCb) development. Concern that
anthropogenic climate change is increasing the occurrence of
pyroCbs globally is driving more focused research into these
meteorological phenomena. Using 6 min scans from a nearby         1   Introduction
weather radar, we describe the development of a pyroCb
during the afternoon of 4 January 2013 above the Forcett–         Anthropogenic climate change is increasing the occurrence
Dunalley fire in south-eastern Tasmania. We relate storm de-      of dangerous fire weather conditions globally (Jolly et al.,
velopment to (1) near-surface weather using the McArthur          2015; Abatzoglou et al., 2019), leading to high-intensity
forest fire danger index (FFDI) and the C-Haines index, the       wildland fires. For instance, climate projections suggest a
latter of which is a measure of the vertical atmospheric sta-     pronounced increase in the risk of extreme fire events in Aus-
bility and dryness, both derived from gridded weather reanal-     tralia, with a 15 %–70 % increase in the number of days con-
ysis for Tasmania (BARRA-TA); and (2) a chronosequence            ducive to extreme wildfire by 2050 in most locations (Hen-
of fire severity derived from remote sensing. We show that        nessy et al., 2005), although the models show inconsisten-
the pyroCb rapidly developed over a 24 min period on the          cies in the trajectory and variability of future fire weather,
afternoon of 4 January, with the cloud top reaching a height      especially in eastern and south-eastern Australia (Clarke et
of 15 km. The pyroCb was associated with a highly unsta-          al., 2011; Clarke and Evans, 2019). While fire weather is
ble lower atmosphere (C-Haines value of 10–11) and severe–        most often understood as a surface phenomenon (for ex-
marginally extreme (FFDI 60–75) near-surface fire weather,        ample, through surface temperature, wind speed, and rel-
and it formed over an area of forest that was severely burned     ative humidity), atmospheric processes such as instability,
(total crown defoliation). We use spatial patterns of elevated    wind shear, and mesoscale conditions can also drive ex-
fire weather in Tasmania and fire weather during major runs       treme fire development. Definitions of extreme wildfires vary
of large wildfires in Tasmania for the period from 2007 to        (e.g. Sharples et al., 2016), but the associated behaviour
2016 to geographically and historically contextualise this py-    includes rapid spread ( > 50 m min−1 ), high fireline inten-
roCb event. Although the Forcett–Dunalley fire is the only        sity (> 10 000 kW m−1 ), long distance spotting, erratic be-
known record of a pyroCb in Tasmania, our results show that       haviour, and impossibility of control, often with the asso-
eastern and south-eastern Tasmania are prone to the conjunc-      ciated development of violent pyroconvection (Tedim et al.,
tion of high FFDI and C-Haines values that have been asso-        2018). In some cases, violent pyroconvection can manifest as
                                                                  pyrocumulonimbus clouds (pyroCb), the tops of which can

Published by Copernicus Publications on behalf of the European Geosciences Union.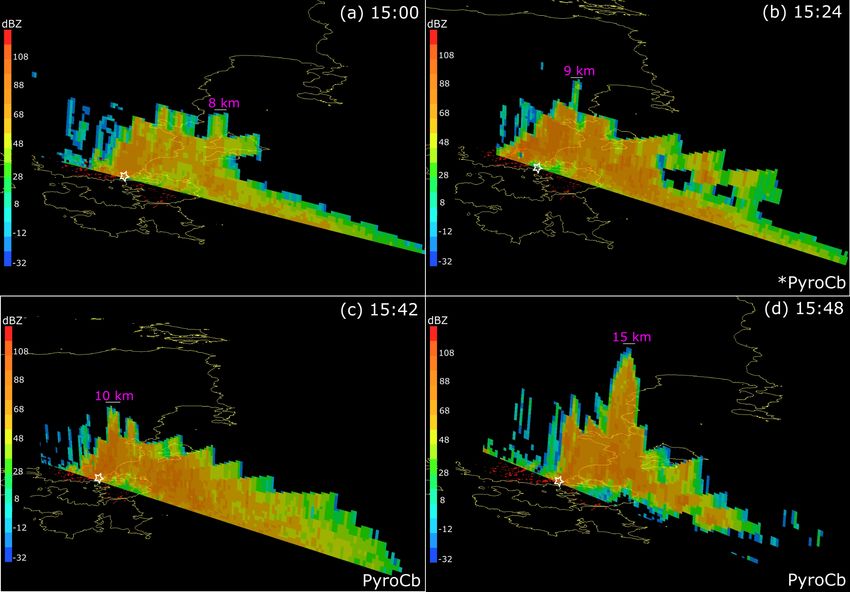
1498                    M. N. Ndalila et al.: Evolution of a pyrocumulonimbus event associated with an extreme wildfire

reach the upper troposphere and lower stratosphere, and can       possible (Yeo et al., 2015; Di Virgilio et al., 2019). High
inject aerosols into altitudes where they can be transported      C-Haines values imply drier and more unstable atmospheric
for thousands of kilometres and, hence, affect global climate     conditions, which favour the lifting of the heated air higher
(Trentmann et al., 2006; Fromm et al., 2010; Peterson et al.,     into the atmosphere. In particular, a large air temperature
2018). Violent convection is defined here as strong, highly       lapse in the atmosphere favours the maintenance of strong
turbulent and deep convection.                                    convection and increases the likelihood of pyroCb develop-
   PyroCbs lead to highly erratic fire behaviour due to strong    ment. The role of tropospheric temperature and moisture in
updraughts and downdraughts, the possibility of associated        pyroCb dynamics is exemplified in the inverted-V thermody-
whirlwinds and tornadoes, and rapid fire growth due to            namic profile (Peterson et al., 2017). The profile shows a dry
heightened ember generation, long-range spotting, and cloud       and warm near-surface environment in which the tempera-
to ground lightning strikes (Cunningham and Reeder, 2009;         ture decreases adiabatically with altitude to the top of the
Fromm et al., 2010; Tory and Thurston, 2015; Lareau and           mixed layer (∼ 3 km), where relative humidity is higher. Al-
Clements, 2016; Dowdy and Pepler, 2018). Specifically,            titudes immediately above the mixed layer are usually drier,
downdraughts can cause erratic fire spread, driven by sudden      and this dry air can mix to the surface in strong convective
wind gusts impacting the surface in multiple directions, en-      downdraughts, increasing surface fire behaviour (McRae et
dangering firefighters near the pyroCb (Johnson et al., 2014;     al., 2015). Further, higher mid-troposphere moisture can in-
Potter and Hernandez, 2017) and frustrating the accurate pre-     teract with weaker wind shear and a high temperature lapse
diction of fire behaviour. Local surface processes can amplify    rate to produce strong convective updraughts (Peterson et al.,
fire behaviour; for instance, eddies in steep lee-facing slopes   2017).
can cause lateral fire spread and mass spotting in down-             Here, we describe the evolution of a pyroCb event in
wind areas, which is a process known as fire channelling or       south-eastern Tasmania that developed on 4 January 2013
vorticity-driven lateral spread (VLS; Sharples et al., 2012).     during the Forcett–Dunalley fire (Ndalila et al., 2018). We
   PyroCbs are comparatively poorly understood meteoro-           use the Mt Koonya Doppler weather radar to document
logical phenomena, as they have rarely been observed or           the temporal evolution of the pyroCb as well as to relate
studied world-wide until recently (Fromm et al., 2010). In        storm development to near-surface fire behaviour using the
Australia, pyroCbs have been confirmed during at least 85         McArthur forest fire danger index (FFDI) and to vertical at-
fire events (Rick McRae, personal communication, 2020),           mospheric stability and dryness using the C-Haines index,
with more than one event occurring over a single fire in some     both of which are derived from gridded weather reanaly-
instances. The most significant events have produced plumes       sis for Tasmania (BARRA-TA). To understand how fire be-
that have reached the upper troposphere–lower stratosphere        haviour may have influenced the storm, we also associated
(UTLS) region. Insights into pyroCb development have re-          the development of the pyroCb to a map of the temporal
lied on weather radar (McRae, 2010; Fromm et al., 2012;           progression of fire severity derived from remote sensing and
Johnson et al., 2014; Peace et al., 2017; McCarthy et al.,        field observations (Ndalila et al., 2018) and terrain analysis
2019; Terrasson et al., 2019) that provides high temporal         based on a digital terrain model. Finally, we contextualise
resolution imagery of the pyroconvection, although, impor-        the pyroCb event by determining (i) the FFDI and C-Haines
tantly, it does not accurately detect the exact extent of en-     values associated with large wildfires in Tasmania within the
trained gaseous and fine particulate emissions because it is      period covered by the available BARRA meteorological re-
sensitive to larger particles such as rain and ice crystals;      analysis (2007–2016) and (ii) the geographic patterns of days
therefore, weather radar can fortuitously detect pyrometeors      with concurrent elevated C-Haines and FFDI values in Tas-
such as ash, scorched debris, and embers (McCarthy et al.,        mania.
2019).
   An important correlate of pyroCb formation is atmo-
spheric instability and moisture (Luderer et al., 2006; Rosen-    2     Methods
feld et al., 2007; Fromm et al., 2010; Lareau and Clements,
2016; Di Virgilio et al., 2019). A fire weather index com-        2.1    Study area
monly used in Australia to monitor meteorological condi-
tions in the lower atmosphere is the continuous Haines in-        The Forcett–Dunalley fire occurred on the Forestier and Tas-
dex (C-Haines; Mills and McCaw, 2010). This index is a            man peninsulas in the south-east of Tasmania (Fig. 1a), a
modification of the Haines index (Haines, 1988), which is         temperate island state to the south of Australia (Fig. 1a). This
routinely used in the US, but has been adapted to suit the        region has a cool moist climate and an elevation reaching
frequent hot and dry summer conditions in Australia. The          600 m a.s.l. (above sea level; Fig. 1d). The fire was reported
C-Haines index provides a measure of the potential for er-        at 14:00 LT (local time) on 3 January 2013, and it ignited
ratic fire behaviour, based on the air temperature lapse and      from a smouldering stump from an unextinguished campfire.
moisture content between two lower tropospheric levels, and       On 4 January, south-east Tasmania recorded dangerous fire
typically ranges from 0 to 13, although values above 13 are       weather conditions, resulting in a large uncontrollable fire

Nat. Hazards Earth Syst. Sci., 20, 1497–1511, 2020                                https://doi.org/10.5194/nhess-20-1497-2020
M. N. Ndalila et al.: Evolution of a pyrocumulonimbus event associated with an extreme wildfire                                1499

                                                                       2.2     Meteorology of the fire

                                                                       2.2.1    PyroCb development

                                                                       We used Doppler weather radar to track the evolution of
                                                                       the pyroCb during the period of erratic fire behaviour. As
                                                                       most weather radars do not detect all components of a smoke
                                                                       plume, especially particles smaller than 100 µm (Jones and
                                                                       Christopher, 2010), we will refer to the signatures present in
                                                                       the radar data as “the plume”, which will also encompass the
                                                                       pyroCb cloud. Pyroconvective plumes typically contain some
                                                                       precipitation (and in extreme cases, glaciation from pyroCb)
                                                                       at high altitudes, as well as larger smoke particles (some of
                                                                       which can be water-coated). In this study, we assume that
                                                                       the highest radar returns (plume injection) during the period
                                                                       of violent convection represent the top of the pyroCb. This
                                                                       is justified, as McRae et al. (2015) also show that stronger
                                                                       radar returns at the highest altitudes during deep pyroconvec-
                                                                       tion events are mostly from hydrological features (ice crystal
                                                                       and rain) rather than non-hydrological components (ash and
                                                                       debris).
                                                                          We examined radar data for the period from 3 to 18 Jan-
                                                                       uary 2013 from the Mt Koonya C-band (5 cm wavelength)
                                                                       weather radar (Fig. 1d) operated by the Australian Bureau of
                                                                       Meteorology (Soderholm et al., 2019). The radar’s proximity
                                                                       and uninterrupted view of the Forcett–Dunalley fireground
                                                                       made it ideal for tracking the pyroCb. The radar is located
                                                                       at a height of 515 m, 46 km east-south-east of Hobart on the
Figure 1. Location of the Forcett–Dunalley fireground in south-        Tasman Peninsula, and its scan strategy contains 14 elevation
eastern Tasmania: (a) annual rainfall (in millimetres) and elevation   angles, scanning through 360◦ within each angle. The radar
(in metres) across Tasmania, and the location of major fires in the    is 24 km from Dunalley, where the lowest (0.5◦ ) elevation
2013 fire season, including Forcett–Dunalley (1); (b) photographs      scan height is about 750 m, whereas the highest scan (32◦ )
of a pyrocumulonimbus cloud above Dunalley township, taken on          is around an elevation of 25 km at a distance of 40 km from
the afternoon (at around 15:55 LT) of 4 January 2013. (c) Domi-
                                                                       the radar. The radar has a 1◦ beam width, a 250 m radial res-
nant vegetation on the Forestier and Tasman peninsulas based on
TASVEG 3.0, an integrated vegetation map of Tasmania. Eucalyp-
                                                                       olution, an effective range of 150 km, and primarily provides
tus (Euc.) is the major vegetation type in the region. (d) Elevation   6 min reflectivity and velocity scans of the plume/pyroCb. In
and mean annual rainfall (dotted lines) across the two peninsulas,     this study, a minimum reflectivity of 11 dBZ was used to de-
derived from WorldClim dataset (Hijmans et al., 2005). The loca-       tect the plume boundary. The time zone used is Australian
tions of the Dunalley township and Mt Koonya weather radar are         eastern daylight time, which is referred to as local time (LT)
indicated on the map.                                                  in this paper.
                                                                          The 3-D radar scans from 12:30 to 23:00 LT on 4 January
                                                                       were used to describe the pyroCb as they represent the pe-
that led to the development of a pyrocumulonimbus (Fig. 1b)            riod of peak fire behaviour. In the later periods, smoke had
from around 15:24 LT and caused the near-complete destruc-             considerably reduced and was not visible on the radar. Radar
tion of Dunalley township (Fig. 1d). By the time of contain-           files were first processed by converting the raw polar coordi-
ment on 18 January, the fire had burnt 20 200 ha, mostly com-          nates to Cartesian coordinates. We used the Integrated Data
prising native vegetation and rural lands (Fig. 1c). A detailed        Viewer (IDV; Unidata, 2018) and ArcGIS 10.3 (ESRI, 2015)
description of the fire and the associated broader meteorolog-         to detect and analyse radar returns in 2-D and 3-D displays,
ical and environmental conditions have been provided in pre-           where the 2-D plan view of the radar indicates the horizon-
vious reports/studies (Bureau of Meteorology, 2013; Fawcett            tal extent of the dense plume, including embers, ash, and the
et al., 2014; Marsden-Smedley, 2014; Ndalila et al., 2018).            pyroCb. Within IDV, a vertical cross-section through the 3-D
                                                                       plumes was used to estimate the maximum injection height
                                                                       (cloud top) at each 6 min timestamp of the radar data. ArcGIS
                                                                       software was used to measure the horizontal length and the
                                                                       size (area and perimeter) of the 2-D view of the plume, based

https://doi.org/10.5194/nhess-20-1497-2020                                      Nat. Hazards Earth Syst. Sci., 20, 1497–1511, 2020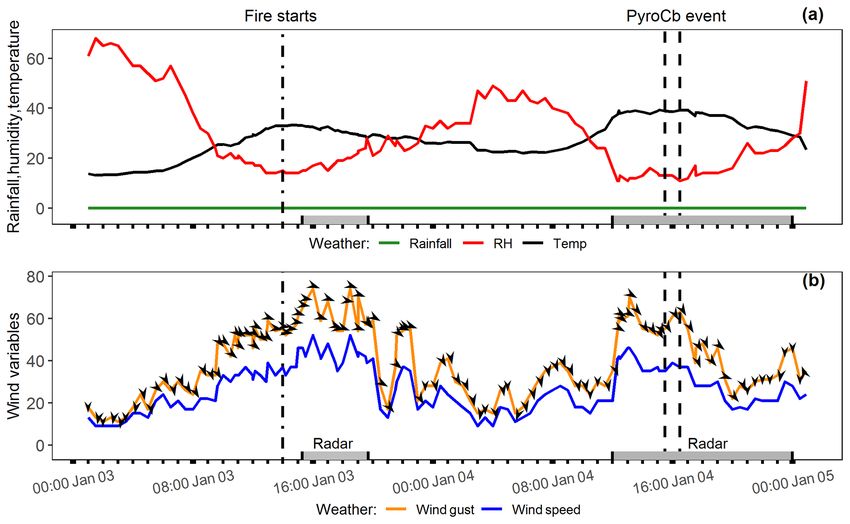
1500                    M. N. Ndalila et al.: Evolution of a pyrocumulonimbus event associated with an extreme wildfire

on the lowest elevation angle of the radar. We compared
the temporal variation of plume/cloud development with the
time series of mapped fire severity and the progression of         CA = (T850 − T700 ) /2 − 2, and                            (1)
fire weather (FFDI and C-Haines) to determine any congru-          CB = (T850 − DT850 ) /3 − 1;
ence between pyroCb dynamics and fire weather, area burnt,
                                                                   if (T850 − DT850 ) > 30, then (T850 − DT850 ) = 30;
and fire severity patterns during the period of erratic fire
behaviour. The chronosequence of fire severity was derived         if CB > 5, then CB = 5 + (CB − 5)/2;                       (2)
from a previous study (Ndalila et al., 2018) from the inter-       CH = CA + CB                                               (3)
section of a fire severity map with fire progression isochrones
within the fireground. Fire severity was based on the differ-      Here, CA is a temperature lapse term, T850 is the air temper-
ential normalised burn ratio (dNBR; Key and Benson, 2006)          ature at an atmospheric height of 850 hPa (or 1.3 km), T700
analysis of pre- and post-fire 30 m resolution Landsat 7 satel-    is the air temperature at a height of 700 hPa (around 3 km),
lite images. A detailed description of fire severity assess-       DT850 is the dewpoint temperature at a height of 850 hPa,
ments is provided by Ndalila et al. (2018).                        CB is a dewpoint depression term, and CH is the continuous
                                                                   Haines index (or C-Haines).
2.2.2   C-Haines analysis
                                                                   2.2.3    Vorticity-driven lateral fire spread
We obtained gridded weather reanalysis data from the Bu-
reau of Meteorology Atmospheric high-resolution Regional           We also determined whether the period of rapid cloud/plume
Reanalysis for Australia (BARRA), downscaled for the Tas-          development coincided with local surface dynamics, which
manian sub-domain (BARRA-TA) to a 1.5 km spatial resolu-           likely enhanced fire behaviour. Specifically, the effect of
tion (Su et al., 2019). BARRA combines numerical weather           vorticity-driven lateral spread (VLS) on fire behaviour was
forecasts with observational data to produce realistic depic-      tested. VLS is an atypical fire spread arising from the inter-
tions of surface meteorology and atmospheric conditions.           action between strong winds and terrain which creates lee-
We extracted hourly air temperature and dewpoint temper-           slope eddies that interact with the fire to cause lateral fire
ature at different air pressure levels (1000 hPa at the sur-       propagation, an increase in fire intensity, and mass spotting
face to 150 hPa in the lower stratosphere) as well as the pre-     downwind of the lateral spread zone (Sharples et al., 2012).
calculated hourly McArthur FFDI for the period of the fire         VLS-prone areas were defined according to the criteria from
and the period of BARRA data available at the time of the          Sharples et al. (2012): lee-facing slopes steeper than 15◦
study (January 2007–October 2016). Extraction, conversion,         where the slopes are facing to approximately 40◦ of the direc-
and general BARRA analysis was performed using R soft-             tion that the wind is blowing towards. A wind direction layer
ware (version 3.4.0; R Core Team, 2017).                           (mostly north-westerly) at 16:00 LT on 4 January (the period
   At each grid cell in Tasmania, the C-Haines index was           around peak plume height) was extracted from the BARRA
calculated from the hourly estimates of air temperature and        dataset and resampled to correspond to the spatial resolution
dewpoint temperature at relevant atmospheric levels (850 and       of the digital elevation model (33 m) that was provided by
700 hPa) based on Eqs. (1)–(3). We preferred the BARRA             the Tasmanian Department of Primary Industries, Parks, Wa-
product over radiosonde data when calculating the C-Haines         ter and Environment. Both layers were combined using the
index because of (1) a possible geographic drift of the            aforementioned criteria, resulting in a binary map where ar-
weather balloon as it rises through the atmosphere, result-        eas fulfilling the VLS criteria were assigned a value of one
ing in inconsistencies in locations where data were recorded;      and all other areas were assigned zero.
(2) availability of balloon data only twice a day at a sin-
gle location, which is unrepresentative of many regions; and       2.3     Spatiotemporal context of fire weather in Tasmania
(3) the BARRA product combines other data sources such
                                                                   2.3.1    Weather conditions during large Tasmanian fires
as satellite observations to model air temperature and mois-
ture. Nevertheless, we validated our C-Haines values using         We compared FFDI and C-Haines values during the Forcett–
the radiosonde data for Hobart Airport, thereby establishing       Dunalley fire and values associated with other large Tas-
a correlation of 0.74 between the two datasets. Our calculated     manian fires between 2007 and 2016 (the period of avail-
hourly C-Haines values as well as the extracted hourly FFDI        able BARRA data). A total of 77 fires, of varying ignition
for Tasmania were then aggregated to maximum daily values.         sources, were identified in the Tasmania Fire Service fire
Temporal maps of the daily C-Haines distribution were then         history database as being over 500 ha in size, and having a
produced for the first 3 d of the fire, between 3 and 5 January.   known ignition date. Of the 77 fires, 18 did not have recorded
                                                                   end dates, and these were operationally specified as being
                                                                   4 weeks later, which was an arbitrary cut-off to capture the
                                                                   most likely major growth (or “run”) of the fire that typically
                                                                   occurs at or near the start of fires (e.g. the 2009 Victorian

Nat. Hazards Earth Syst. Sci., 20, 1497–1511, 2020                                 https://doi.org/10.5194/nhess-20-1497-2020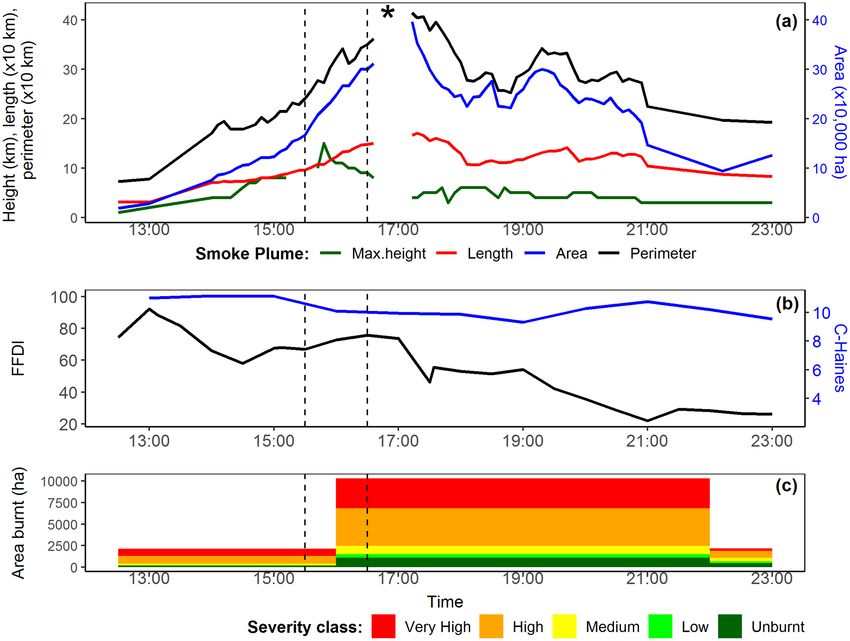
M. N. Ndalila et al.: Evolution of a pyrocumulonimbus event associated with an extreme wildfire                          1501

fires; Cruz et al., 2012). The assumption is that these runs     riod of violent pyroconvection between 15:24 and 16:30 LT
result in peak fire intensities that most likely drive strong    (Fig. 2). Winds were mostly north-westerly, with no notice-
convections. We subsequently produced a scatterplot of the       able change in the wind direction during the pyroCb pe-
highest daily FFDI for the duration of each of the fires and     riod. However, a southerly change was observed at around
the associated C-Haines value. These data were overlaid on       00:00 LT on 5 January, well after the Forcett–Dunalley py-
a density map of C-Haines and FFDI values for all cells (and     roCb had already dissipated.
days) in Tasmania during the entire BARRA period to pro-
vide background weather conditions for Tasmania.                 3.1.2   Synoptic weather

2.3.2    Elevated fire weather in Tasmania                       On 3 January, a combination of (1) a high-pressure sys-
                                                                 tem to the north-east of Tasmania and (2) a cold front
To provide a geographic context for the Forcett–Dunalley         and pre-frontal trough approaching from the west directed
fire, the spatial patterns of days conducive to extreme fire     a freshening dry and hot northerly airstream over the is-
behaviour in Tasmania were mapped by determining counts          land – favourable conditions for elevated fire danger (Bu-
of days that exceeded combined C-Haines and FFDI thresh-         reau of Meteorology, 2013). By 08:00 LT on 4 January, the
olds of 9 and 25 respectively, and then aggregating them         high-pressure system had moved slowly eastward, while the
to fire season (October–March) and non-fire season (April–       trough had progressed closer to western Tasmania (Fig. S1
September). These thresholds were defined to correspond          in the Supplement). This period coincided with moderate
to an elevated fire weather day (95th percentile) based on       north-westerly winds in most locations in the state, except
weather conditions at Hobart Airport, which represents the       for the south-east (general area surrounding Dunalley) which
broader air mass in south-eastern Tasmania. For example,         recorded stronger winds and an elevated fire danger. The fire
the FFDI threshold is close to the 95th percentile (FFDI 31)     danger steadily increased towards midday (the start of the
observed during the 1998–2005 fire seasons (Marsden-             first fire progression isochrone in Fig. 3c); by 15:00 LT, the
Smedley, 2014). We chose to use FFDI to describe near-           leading edge of the trough was much closer to the west of
surface fire weather across the state, but we acknowledge that   Tasmania. An increase in the pressure gradient brought about
for some fuel types (e.g. moorlands) that occur in Tasmania      gusty conditions and a catastrophic fire danger in some loca-
(Marsden-Smedley and Catchpole, 1995), other indices such        tions in south-east Tasmania, causing erratic fire behaviour
as the grassland/moorland fire danger index may be more          of the Forcett–Dunalley fire. During that time, the trough
suitable. It is worth noting that the maximum daily FFDI cal-    crossed western Tasmania. By 17:00 LT, when the pyroCb
culated at the Hobart Airport station was always higher than     had likely dissipated (Fig. 3a), the pre-frontal trough was
the daily gridded FFDI extracted from the BARRA product          crossing Tasmania and the fire danger subsequently reduced
(compare the maximum FFDI of 92 recorded at the station          due to decreasing temperatures and winds. The trough con-
with the FFDI of 68.7 from the BARRA model on 4 Jan-             tinued to move eastwards, and it crossed south-east Tasmania
uary).                                                           after 23:00 LT, leading to a westerly to south-westerly wind
                                                                 change by 00:00 LT on 5 January. The front passed over the
                                                                 state in the early morning of 5 January and caused lightning
3     Results
                                                                 and limited showers across Tasmania. A detailed analysis of
3.1     Fire weather during the fire                             the synoptic weather patterns driving this event are provided
                                                                 in Bureau of Meteorology (2013).
3.1.1    Surface fire weather
                                                                 3.1.3   PyroCb development in the atmosphere
Dangerous fire weather conditions in south-east Tasmania
were observed from 3 to 4 January 2013. At 14:00 LT              On 4 January, the plume height from radar scans gradu-
on 3 January when the fire was reported, Hobart Airport          ally increased from around 1 km a.s.l. at 13:00 LT to 8 km at
recorded 33 ◦ C (the maximum temperature for 3 January),         around 15:00 LT and then rapidly rose to the maximum in-
a minimum relative humidity (RH) of 15 %, and strong             jection height of 15 km (lower stratosphere) between 15:24
north-westerly winds that reached 37 km h−1 and gusted to        and 15:48 LT (Figs. 3a, 4), representing the peak of pyrocon-
55 km h−1 (Fig. 2). The smoke plume was detectable by            vection. During the period of violent pyroconvection, thun-
weather radar between 15:18 and 19:00 LT. The weather con-       derstorms developed and moved in a south-easterly direc-
ditions deteriorated on 4 January, with extreme maximum          tion towards the Tasman Sea, causing two lightning strikes,
temperatures (reaching 40 ◦ C), strong winds (35–46 km h−1 ,     which were detected around 16:10 LT (Bureau of Meteorol-
gusts of 60–70 km h−1 ), and low RH (11 %) in the after-         ogy, 2013). Radar returns during the peak period (Fig. 4)
noon. At 12:00 LT, the Forcett–Dunalley plume was again          were likely due to glaciation within the pyroCb and precipi-
detectable by weather radar (Figs. 2, 3a), when values of the    tation at high altitudes, which then evaporated before reach-
weather variables peaked and were maintained during the pe-      ing the surface due to intense heat, while the cooled air mass

https://doi.org/10.5194/nhess-20-1497-2020                               Nat. Hazards Earth Syst. Sci., 20, 1497–1511, 2020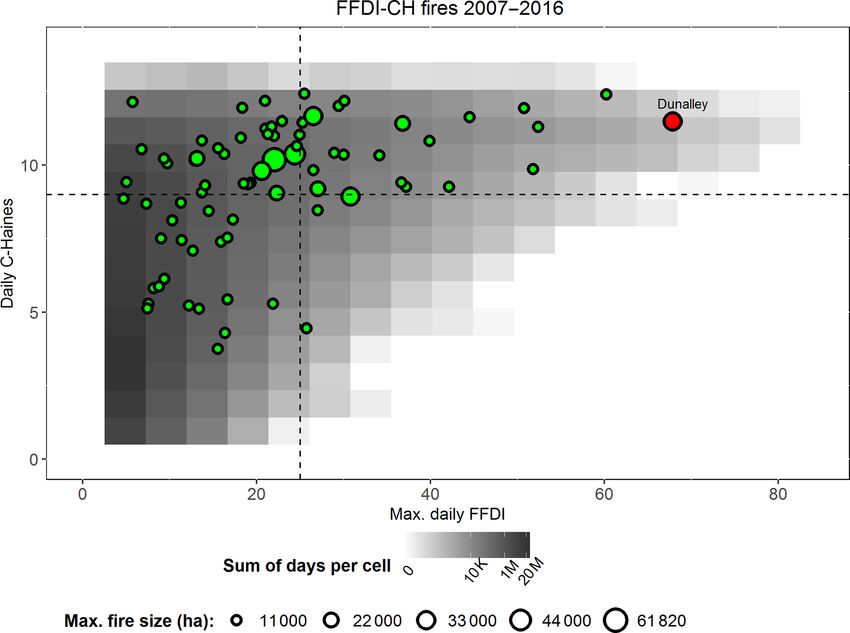
1502                       M. N. Ndalila et al.: Evolution of a pyrocumulonimbus event associated with an extreme wildfire

Figure 2. Time series of 30 min weather data obtained from 3 to 4 January 2013 at Hobart Airport. (a) Rainfall (mm), relative humidity
(RH; %), and air temperature (◦ C). (b) Wind variables, including wind speed (km h−1 ), wind gust (km h−1 ), and wind direction (as cardinal
direction). The arrows point in the direction that the wind is blowing to. The vertical lines represent the time of the start of the fire and the
period of the pyroCb event. The periods of the radar detection of the plume for the 2 d are also shown on the graphs.

Figure 3. Plume dimensions, fire weather, and fire severity traces during the evolution of a pyroCb on the afternoon of 4 January. (a) The
6 min variation of plume dimensions during peak fire behaviour. The asterisk (∗ ) represents the period (16:42–17:06 LT) with missing weather
radar data. (b) The FFDI trace obtained from Hobart Airport weather station, and the C-Haines computed from the BARRA product during
the corresponding period of smoke plume growth. (c) The temporal pattern of fire severity, adapted from Ndalila et al. (2018). Black vertical
lines in the three graphs represent the period of violent pyroconvection.

Nat. Hazards Earth Syst. Sci., 20, 1497–1511, 2020                                          https://doi.org/10.5194/nhess-20-1497-2020
M. N. Ndalila et al.: Evolution of a pyrocumulonimbus event associated with an extreme wildfire 1503
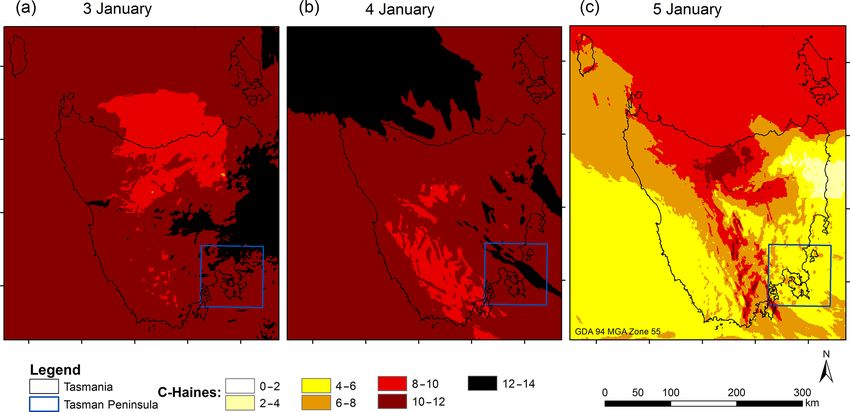
from evaporation descended towards the surface as convec- 3.1.4 Spatiotemporal variation of C-Haines
tive outflows, generating gusty and erratic surface winds. The
cloud top then decreased to around 7 km at 16:42 LT, after During the development of the pyroCb, the maximum daily
which the pyroCb likely dissipated and the plume subse- FFDI and gridded C-Haines on 4 January at Hobart Airport
quently stabilised at heights of 3 km (Fig. 3a). Atmospheric were consistently high (92 and 11.1 respectively). During
instability and the pyroCb dynamics are confirmed by at- the following days, both of these indices markedly declined
mospheric soundings from BARRA for 15:00–16:00 LT on (Fig. S5); indeed, for the entire month of January 2013, there
4 January (Fig. S2) and a time series of the 850–500 hPa air was a statistically significant moderate correlation (r = 0.5,
temperature lapse rate on 4 January (Fig. S3). The soundings p < 0.05) between these fire weather indices, although the
show the air temperature at the tropopause (∼ 12 km, below FFDI lagged C-Haines by around a day. At a state-wide scale,
the pyroCb height) to be −50 ◦ C, supporting the observation from 3 to 4 January, the whole of Tasmania displayed danger-
of the electrification of the pyroCb. Electrification/lightning ous fire weather, particularly south-eastern Tasmania, which
typically occurs at temperatures around or below −20 ◦ C recorded high C-Haines values (Fig. 5). Especially on the
(Williams, 1989). The 850–500 hPa lapse rate gives an in- Tasman Peninsula, C-Haines was mostly within the range of
dication of the (in)stability of the lower half of the tropo- 10–12 for both days (peaking at 12–14), but it moderated
sphere (1.3–5.5 km a.s.l.), with lapse rates of > 7.5 ◦ C km−1 to 4–6 on 5 January after a south-westerly wind change at
considered as very unstable lower atmosphere (Peterson et around 00:00 LT as a result of a pre-frontal trough crossing
al., 2014). south-eastern Tasmania. A complete description of the over-
For the horizontal plume dimensions (length, area, and all meteorological conditions, including the aerological dia-
perimeter), there was a lagged response to the effect of in- grams, can be found in the Supplement.
tense fire activity that occurred at around 15:24 LT. While a
maximum in cloud height was observed at 15:48 LT, other 3.2 Contextualising the Forcett–Dunalley pyroCb
plume metrics peaked at around 17:13 LT (Fig. 3a). Plume
3.2.1 Fire weather in large Tasmanian fires
length is defined as the horizontal distance between the ori-
gin of the plume and its farthest extent. The Forcett–Dunalley fire had amongst the highest levels of
The period of drastic increase in the height of the pyroCb elevated fire weather (gridded FFDI and C-Haines of 68 and
cloud was associated with elevated FFDI values of 60–75 (se- 11.5 respectively) of all of the 77 large (> 500 ha) Tasmanian
vere, 50–74, to marginally extreme, 75, fire danger classes), fires that occurred between 2007 and 2016 (Fig. 6). These
elevated gridded C-Haines values of 10–11.1 at Hobart Air- values represent the 99th percentile of daily FFDI and C-
port (Fig. 3b), a large area burnt (approximately 10 000 ha), Haines values for the grid cell in Dunalley that had the high-
and the highest proportion of burning of the two highest fire est daily FFDI during the fire. Figure 6 also shows the fire
severity (total crown defoliation) categories in dry Eucalyp- weather associated with all of these fires overlaid on the bi-
tus forests (Fig. 3c). The isochrone leading up to the peak in variate density distribution of the FFDI and C-Haines for all
fire behaviour accounted for 10 % of total area burnt across days in the available record. The figure shows that despite be-
all vegetation types within the entire fire perimeter, the peak ing correlated, the probability of the concurrence of elevated
period contributed 46 %, and the last isochrone on 4 January C-Haines and FFDI values across Tasmania is low. Further,
contributed 9 % of total area burnt (Fig. 3c). Evidence of the the scatterplot suggests that high FFDI values (> 25) do not
effect of vorticity-driven lateral spread on the fire behaviour influence large fire occurrence as much as high C-Haines val-
was not strong. The analysis of the precursor terrain condi- ues (> 9), and that most large fire events (52 fires or 68 %)
tions only revealed small patches of VLS-prone areas near occur within lower FFDI and C-Haines thresholds (15 and
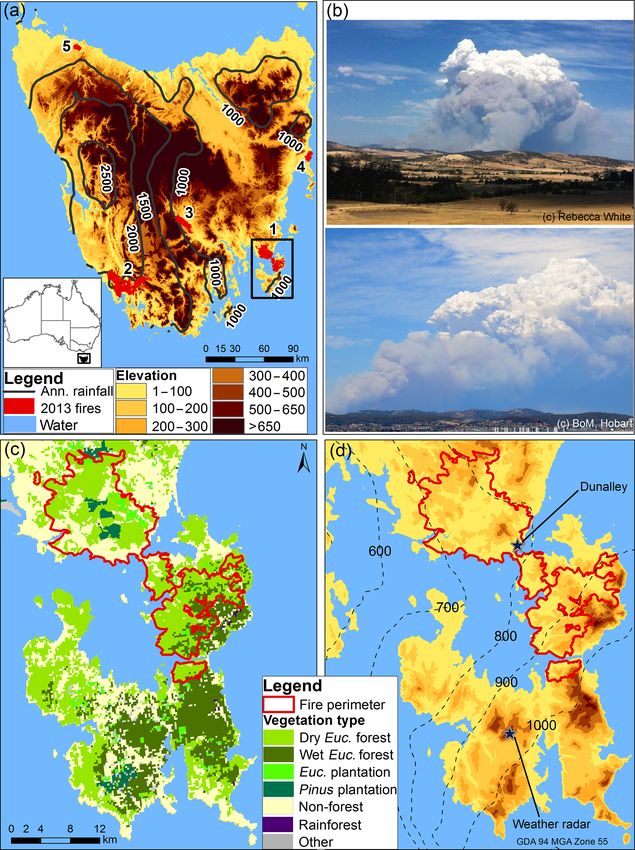
Dunalley township (Figs. 4, S4). However, we are not able to 7 respectively). Notably, the Forcett–Dunalley fire is an out-
rule out VLS occurrence on parts of the terrain that were not lier and the only known fire to have produced a pyroCb in
resolved by the DEM and which may have played a part in Tasmania.
the evolution of the plume. Indeed, the lateral development
of the upwind edge of the plume in Fig. S4 suggests lat- 3.2.2 Spatiotemporal variability of elevated fire
eral development of the fire, similar to that associated with weather
VLS in other fires (McRae et al., 2015). The majority of
the plume area (> 70 %) extended over the Tasman Sea in During the fire season (October–March), eastern Tasma-
a south-easterly direction from the location of the fire, under nia and the Bass Strait islands (Flinders and King islands)
the influence of above-surface winds (Fig. 4). The period of are prone to combined elevated C-Haines and FFDI val-
the pyroCb in Fig. 4 is defined by very high radar returns, ues (Fig. 7), particularly so for south-east Tasmania. Out-
with reflectivity values of 48–88 dBZ representing the most side the fire season, only south-eastern Tasmania is exposed
intense parts of the pyroCb. This strong reflectivity is indica- to the risk of elevated C-Haines and FFDI values. There is
tive of high quantities of ash and larger-sized hydrometeors no trend in elevated fire weather detectable in the existing
such as ice crystals at higher elevations. BARRA weather record across Tasmania (Fig. S6); however,
https://doi.org/10.5194/nhess-20-1497-2020 Nat. Hazards Earth Syst. Sci., 20, 1497–1511, 20201504 M. N. Ndalila et al.: Evolution of a pyrocumulonimbus event associated with an extreme wildfire Figure 4. Areas prone to vorticity-driven lateral spread (VLS; in red) overlaid with a 3-D rendering of the vertical cross-section of plumes from the radar reflectivity for specific times during peak fire behaviour. Higher reflectivity values (dBZ > 48) in all maps represent the most intense parts of the plume (and the pyroCb which occurred from around 15:24 to 16:30 LT). The asterisk in Fig. 4b represents the likely initiation period of the pyroCb. Dunalley township is represented by a white star. A malfunction in radar for the 15:30 and 15:36 LT timestamps resulted in plume information only being available at the lowest elevation angle of the radar scan; therefore, these data are not shown. Figure 5. Spatiotemporal distribution of maximum daily C-Haines values for Tasmania for 3–5 January 2013. The blue square indicates the location of the Tasman Peninsula. Nat. Hazards Earth Syst. Sci., 20, 1497–1511, 2020 https://doi.org/10.5194/nhess-20-1497-2020
M. N. Ndalila et al.: Evolution of a pyrocumulonimbus event associated with an extreme wildfire                                                1505

Figure 6. Scatterplot of the maximum daily FFDI and associated daily C-Haines values (corresponding to the time of the highest FFDI) of
each of the 77 large (> 500 ha) wildfires overlaid on the density of all days in the period of the BARRA data. The density scale has been
log-transformed to allow for better visualisation, while the fires have been stratified into different fire size classes. The vertical and horizontal
lines represent thresholds of elevated FFDI (25) and C-Haines (9) respectively. The Forcett–Dunalley fire (in red) is a clear outlier when
compared to other fires (in green). (“K” in the legend represents thousand, and “M” represents million.)

as longer reanalysis datasets become available, the examina-                 fire, which was among the 2009 Victorian “Black Saturday”
tion of longer trends may also become possible.                              fires – the most destructive of all known Australian fires –
                                                                             had extensive pyroCb activity in the late afternoon, around
                                                                             17:00 LT (Dowdy et al., 2017). PyroCbs are typically short-
4   Discussion                                                               lived events that mature in less than 1 h, as was the case for
                                                                             the Forcett–Dunalley fire, although some can last for mul-
We have described the evolution of the only known pyroCb to                  tiple hours, such as the 2003 Canberra fires (Fromm et al.,
have occurred in Tasmania. Our study opportunistically used                  2006) and the 2017 Pacific Northwest wildfires in the north-
weather radar to track violent pyroconvection, which reached                 western US and British Columbia (Peterson et al., 2018). The
a peak height of 15 km in less than 1 h during the afternoon                 Forcett–Dunalley pyroCb achieved a height of 15 km, which
on 4 January. We were able to associate this rapid escalation                is similar to that reported in other Australian events, includ-
of the fire with a previously developed fire severity map and                ing the 2003 Canberra fires (14 km; Fromm et al., 2006), the
a digital terrain model of the fireground (Ndalila et al., 2018).            2006 Wollemi fire in New South Wales (14 km; Fromm et al.,
Analysis of gridded weather data in Tasmania for the period                  2012), the 2009 Black Saturday fires (∼ 13 km; Cruz et al.,
from 2007 to 2016 showed that this event is an outlier in                    2012), the 2016 Waroona fire in Western Australia (14 km;
elevated FFDI and C-Haines values. Below, we discuss these                   Peace et al., 2017), the 2017 Sir Ivan fire in New South Wales
findings with respect to the known drivers of pyroCbs as well                (12 km; Terrasson et al., 2019), and the recent 2019 Vic-
as how it relates to previous pyroCb events in Australia and                 torian fires (Mike Fromm, unpublished data). Further, two
globally.                                                                    lightning strikes from the Forcett–Dunalley pyroCb were ob-
   The Forcett–Dunalley firestorm developed in the late af-                  served to the south-east of Dunalley, over the Tasman Sea.
ternoon – a pattern similar to all reported Australian py-                   A majority of the Australian pyroCbs have been observed
roCbs (Fromm et al., 2006; Dowdy et al., 2017; Peace et                      to generate lightning, which in some cases started new fires
al., 2017; Terrasson et al., 2019), except the 2006 Grose Val-               well ahead of the fire front (Peace et al., 2017); for example,
ley pyroCb in New South Wales (Fromm et al., 2012) and a                     the Kinglake fire produced several lightning clusters, which
second Waroona pyroCb event (Peace et al., 2017), which                      ignited a new fire 100 km downwind of the fire (Dowdy et
occurred in the late morning. For instance, the Kinglake                     al., 2017). The 2003 Canberra pyroCb did not produce light-

https://doi.org/10.5194/nhess-20-1497-2020                                           Nat. Hazards Earth Syst. Sci., 20, 1497–1511, 2020
1506 M. N. Ndalila et al.: Evolution of a pyrocumulonimbus event associated with an extreme wildfire Figure 7. Spatial distribution of mean days per year with both elevated C-Haines (> 9) and FFDI (> 25) values for (a) the fire season (October–March) and (b) the non-fire season (April–September), intersected by the operational fire management boundaries for Tasmania. ning, but it is notable for being the only confirmed case in in the Sir Ivan fire in eastern Australia. Further research is Australia that produced a genuine tornado (peak diameter of required to properly understand the potential influence of 400–500 m) which led to extensive vegetation damage along mid-tropospheric moisture in driving pyroCb development in its path (McRae et al., 2013). Australia. The Forcett–Dunalley fire and other known Australian py- PyroCb development has been shown to be influenced by roCbs share characteristics of events in North America in critical fire weather events. For instance, nocturnal foehn terms of height (> 12 km; Diner et al., 2004; Fromm et al., winds occurred the night preceding pyroCb development in 2005; Dahlkötter et al., 2014), lightning activity (Rosen- both of the Forcett–Dunalley and Grose Valley fire cases. feld et al., 2007; Johnson et al., 2014), and time of occur- These warm, dry winds disrupt the fuel moisture recovery rence (Rosenfeld et al., 2007; Peterson et al., 2017), although phase that usually occurs overnight, thereby priming the some events have been reported to have lasted up to 5 h landscape with drier fuels the following day (McRae et al., (Ansmann et al., 2018; Peterson et al., 2018). North Amer- 2015). PyroCb development can also be influenced by the ican studies have also highlighted the clear role that mid- passage of troughs or wind changes such as cold fronts or tropospheric moisture plays in driving pyroCb development sea breezes (Mills and McCaw, 2010; Peace et al., 2017; Ter- in the western US and Canada (Trentmann et al., 2006; Pe- rasson et al., 2019). Troughs provide a thermodynamic en- terson et al., 2017), but this role does not appear as clear- vironment more favourable for moist convection in general, cut in Australian pyroCbs. Indeed, a number of Australian and the added lift from wind changes is thought to give py- pyroCb events exhibit a distinct lack of midlevel moisture roCb formation a boost. Recent research (Tory et al., 2018) in their associated atmospheric profiles, such as the 2003 also highlights the potential role that a wind change may play Canberra fire (Fromm et al., 2006) and the 2013 Wambe- in enhancing pyroCb development by lowering the plume long fire (Wagga Wagga sounding for 13 January 2013 on condensation height, through the entrainment of cooler and http://weather.uwyo.edu/upperair/sounding.html, last access: moister air. However, the Forcett–Dunalley pyroCb estab- 28 February 2020). However, in this study, the mid- to upper- lished itself well before the arrival of the wind change, as level moisture was higher during the time preceding pyroCb was the case with a number of other notable Australian py- formation on 4 January (Fig. S2a), with a total precipitable roCbs such as the Grose Valley fire (McRae et al., 2015). water of 23 mm indicating a moist lower atmosphere (Webb Extreme fire weather in eastern Tasmania reflects the and Fox-Hughes, 2015). Additionally, Terrasson et al. (2019) combination of the (1) dominance of flammable vegeta- report on the effect of a change in moisture between the tion, mainly composed of Eucalyptus forest and woodlands; low- and upper-levels (brought by a cold front) on the de- (2) foehn-like winds (Fox-Hughes et al., 2014; Grose et velopment of a pyroCb and enhancement of fire behaviour al., 2014); and (3) pre-frontal troughs and cold fronts that Nat. Hazards Earth Syst. Sci., 20, 1497–1511, 2020 https://doi.org/10.5194/nhess-20-1497-2020
M. N. Ndalila et al.: Evolution of a pyrocumulonimbus event associated with an extreme wildfire                                  1507

cause elevated fire danger and rapid changes in fire spread            mania being particularly vulnerable, given the concentration
(Sharples et al., 2010; Cruz et al., 2012; Bureau of Meteo-            of high C-Haines values identified in this study.
rology, 2013; Fox-Hughes et al., 2014; Grose et al., 2014).               Turbulence associated with winds and terrain has been
South-east Tasmania is particularly prone to foehn winds in            suggested as an important factor contributing to pyroCb for-
pre-frontal environments, making the region vulnerable to              mation via the amplification of fire through processes such
wind direction changes that cause fire flanks to become fire           as mass spotting, topographic channelling of winds, and
fronts, thereby rapidly escalating the size of fires. Our anal-        vorticity-driven lateral spread (VLS; Sharples et al., 2012).
ysis has shown that the Forcett–Dunalley fire was affected             Previous studies have linked abrupt increases in plume height
by these meteorological factors, had the highest levels of el-         with VLS; these include the 2003 Canberra fires (Sharples
evated fire weather of all the Tasmanian fires between 2007            et al., 2012) and the 2006 Grose Valley fire (McRae et al.,
and 2016, and was the only event to have produced a py-                2015). In these studies, VLS was confirmed based on the ob-
roCb. An important framework to understand the Forcett–                servation of rapid lateral expansion of the plume (McRae,
Dunalley fire is the analysis of fire weather conditions during        2010). However, this study did not find strong evidence of the
40 pyroCb events in south-eastern Australia conducted by Di            effect of VLS on fire behaviour, as indicated by small patches
Virgilio et al. (2019); the above-mentioned analysis showed            of VLS-prone areas near Dunalley township (Fig. S4). There-
that the environmental conditions conducive to pyroCb de-              fore, it is possible that the pyroCb attained its maximum
velopment are extreme C-Haines conditions (10–13.7) and                height without the influence of VLS. However, this inter-
a very high to catastrophic near-surface fire danger (FFDI             pretation should be taken with caution as VLS possibly oc-
25–150) occurring over forested and rugged landscapes. The             curred but data constraints (especially the spatial resolution
Forcett–Dunalley pyroCb event is consistent with these ob-             of the DEM and wind direction) may have precluded its ac-
servations, occurring under elevated C-Haines (10–11) and a            curate determination. Mapping of the Forcett–Dunalley fire
severe–extreme FFDI (60–75) on undulating/rugged terrain               by Ndalila et al. (2018) showed that areas subjected to the
that supported long unburnt, dry Eucalyptus fuels. Di Vir-             highest fire intensities were broadly aligned with undulat-
gilio et al. (2019) suggest that extreme FFDI and C-Haines             ing terrain and long unburnt dry Eucalyptus forest which un-
values may not lead to pyroCb development if there is a lack           der the influence of strong winds produced an ember storm
of deep flaming, due to factors such as elevated fuel mois-            that impacted the coastal township of Dunalley situated in
ture, low fuel loads, or fire suppression activities. This sug-        the lee of the low hills. During this period (at 15:25 LT on
gests that the heavy fuel loads that resulted in a large area          4 January), the rate of fire spread was reported to be around
burnt at high severity in the Forcett–Dunalley fire (Ndalila           50 m min−1 (or 3 km h−1 ), which then reduced to 1.9 km h−1
et al., 2018) may have contributed to the development of the           between 17:30 and 20:00 LT, and by the time of the next fire
pyroCb.                                                                isochrone at 22:00 LT, when fire severity had significantly re-
   Mainland Australia, and especially the south-eastern re-            duced (Fig. 3), the rate of spread was 1 km h−1 (Marsden-
gion, experiences a greater number of days with elevated               Smedley, 2014). It must be acknowledged that the role of
FFDI and C-Haines values than Tasmania (Dowdy and Pe-                  downdraught and mass spotting underneath the plume dur-
pler, 2018). The FFDI/C-Haines distribution in the above-              ing the period of extreme fire behaviour is hard to infer
mentioned region shows pyroCbs occurring over a wide                   without additional data sources on fire behaviour (such as
range of FFDI values but under more limited extreme val-               infra-red/multispectral linescans) and high-resolution cou-
ues of C-Haines (Di Virgilio et al., 2019). In Tasmania, how-          pled fire–atmosphere modelling (Peace et al., 2015).
ever, we found that a fire weather environment conducive to               This study hinges on the application of weather radars
pyroCb occurrence is likely to have high concurrent values             to track the evolution of a pyroCb. It is worth noting that
of C-Haines and FFDI (Fig. 6), a conjunction that occurs               weather radars are not perfectly suited for all fires due to
rarely, although this may change with the projected warm-              their limited geographic range (relative to satellite observa-
ing climate in Australia (Dowdy, 2018; Di Virgilio et al.,             tions) and their inability to detect microscale cloud parti-
2019). It is worth noting that the FFDI/C-Haines distribu-             cles (< 100 µm). Nonetheless, radars remain a reliable data
tion for Tasmania reveals that high FFDI values (> 25) do              source that can provide near-real time monitoring of strong
not influence large fire occurrence as much as high C-Haines           pyroconvection, as evidenced by previous pyroCb studies in
values (> 9), which is consistent with the findings of Di              Australia and globally (Rosenfeld et al., 2007; Fromm et al.,
Virgilio et al. (2019). Climate modelling in Australia sug-            2012; Lareau and Clements, 2016; Dowdy et al., 2017; Peace
gests that climate change may lead to an increased risk of             et al., 2017; Lareau et al., 2018; Terrasson et al., 2019). This
strong pyroconvection, particularly in the spring months in            study did not analyse radial velocity from the Doppler radar;
south-eastern Australia (Dowdy and Pepler, 2018; Di Vir-               therefore, future research on the Forcett–Dunalley fire and
gilio et al., 2019). Within Tasmania, climate models point to          other fires should consider using that information to provide
increased FFDI values and longer fire seasons (Fox-Hughes              a more quantitative analysis of the thunderstorm, drawing
et al., 2014; Grose et al., 2014); hence, it is likely that the risk   upon previous work in Australia (McCarthy et al., 2019; Ter-
of pyroCbs will increase, with eastern and south-eastern Tas-          rasson et al., 2019). A feature of our study was linking plume

https://doi.org/10.5194/nhess-20-1497-2020                                    Nat. Hazards Earth Syst. Sci., 20, 1497–1511, 2020
1508                    M. N. Ndalila et al.: Evolution of a pyrocumulonimbus event associated with an extreme wildfire

evolution to fire severity mapping – an approach that has re-     4 January 2013. We have shown that the pyroCb was asso-
ceived limited attention. Duff et al. (2018) conducted one of     ciated with elevated fire weather conditions as well as with
the few studies and used statistical models to link the radar-    strong interactions between weather, terrain, and the fire it-
detected plume volume to fire growth, and they found that         self, which caused dynamic fire behaviour and the near-
radar return volume (above a threshold of 10 dBZ) was a ro-       destruction of Dunalley township. We have discussed the
bust predictor of fire-area change. These results appear con-     known drivers of pyroCbs and how the Forcett–Dunalley py-
sistent with the present findings, particularly with the cor-     roCb relates to previous pyroCb events in Australia and glob-
relation between rapid plume development and the horizon-         ally. An analysis of fire weather in previous large wildfires in
tal growth of the fire. Other Australian studies linking fire     Tasmania between 2007 and 2016 suggests that the Forcett–
behaviour to radar-detected plume development include Mc-         Dunalley fire experienced among the highest levels of ele-
Carthy et al. (2018) and Terrasson et al. (2019).                 vated fire weather of all the large fires in Tasmania, and it
   The present study is the first in Tasmania that has utilised   was the only event to have produced a pyroCb to date. A
geographically comprehensive fire weather information both        spatiotemporal analysis of fire weather in Tasmania shows
at the near-surface and the lower atmosphere to determine the     that eastern (particularly south-eastern) Tasmania is subject
spatiotemporal variation of elevated fire weather in the state.   to more days of elevated fire weather than the west, high-
One opportunity for further research is to examine long-term      lighting the vulnerability of this region to extreme fire events.
trends in elevated fire weather as longer weather reanalysis      This information is crucial for fire weather forecasting and
datasets for Tasmania (1990–2019) become available. The           fire management and planning.
influence of climate change on the spatial and seasonal dy-
namics of C-Haines is particularly important for comparison
with projected changes in south-eastern Australia conducted       Data availability. The gridded weather reanalysis data for Tasma-
by Di Virgilio et al. (2019).                                     nia (BARRA-TA) for the period from 2007 to 2016 are provided
   Our analysis contributes to improving the prediction of ex-    upon registration with the reanalysis helpdesk at the Bureau of Me-
treme fire behaviour (Tory and Thurston, 2015). Indeed, in        teorology (BoM) via the following link: http://www.bom.gov.au/
                                                                  research/projects/reanalysis/ (Su et al., 2019). Weather radar data
this context, it is interesting to know if the Forcett–Dunalley
                                                                  (in ODIM HDF5 format) are publicly available for noncommer-
pyroCb could have been predicted with existing informa-
                                                                  cial use via the Open Radar Data program at BoM: http://dapds00.
tion. We suggest it is conceivable that the Forcett–Dunalley      nci.org.au/thredds/catalog/rq0/catalog.html (last access: 4 October
pyroCb blow-up between 15:24 and 16:30 LT on 4 January            2019; Soderholm et al., 2019). The upper air (radiosonde) data
2013 could have potentially been predicted 12–18 h in ad-         are also available from BoM as two daily observations (at 09:00
vance. Further, on the evening of 3 January, the Phoenix          and 21:00 local standard time). Global radiosonde data can be ob-
fire behaviour model predicted that the fire would reach          tained from the University of Wyoming interactive mapping por-
Dunalley at approximately 15:00 LT on 4 January (Bureau           tal (http://weather.uwyo.edu/upperair/sounding.html; University of
of Meteorology, 2013); this was around the time that the          Wyoming 2020). The fire history dataset for Tasmania as well as
fire reached Dunalley (15:24–15:48 LT) following the pre-         the fire management area (FMA) boundary data for Tasmania are
dicted path, which was confirmed by plume/pyroCb dynam-           available from unpublished records held by Tasmania Fire Service;
                                                                  the 33 m digital elevation model is available from the Tasmanian
ics (Fig. 4) and witness reports. The conditions surround-
                                                                  Department of Primary Industries, Parks, Water and Environment
ing the pyroCb event are entirely consistent with those high-     (DPIPWE), but was originally derived from the WorldClim dataset
lighted in the Blow-Up Fire Outlook (BUFO) model (McRae           (Hijmans et al., 2005).
and Sharples, 2013, 2014). In essence, the BUFO model as-
sesses the likelihood of a fire exhibiting deep flaming in an
atmospheric environment conducive to rapid plume growth.          Supplement. The supplement related to this article is available on-
Retrospective application of the BUFO model to the Forcett–       line at: https://doi.org/10.5194/nhess-20-1497-2020-supplement.
Dunalley case yields the BUFO pathway summarised in
Fig. S7. It is initiated by the presence of an uncontrolled
fire in an elevated near-surface fire weather, combined with a    Author contributions. MNN, GJW, PFH, JS, and DMJSB designed
wind speed of > 25 km h−1 over rugged forested landscapes,        the experiments. PFH provided meteorological datasets. MNN anal-
with dead fuel moisture below 5 %, in a potential VLS-prone       ysed the data, and GJW developed the R code for the extraction and
land form, and under extreme values of atmospheric instabil-      conversion of the gridded weather reanalysis (BARRA-TA) prod-
ity and dryness (C-Haines ≥ 10).                                  uct and the weather radar dataset. MNN prepared the paper with
                                                                  contributions from all co-authors.

5   Conclusion
                                                                  Competing interests. The authors declare that they have no conflict
                                                                  of interest.
This study provides an analysis of pyroCb dynamics and
fire weather during an extreme fire event in Tasmania on

Nat. Hazards Earth Syst. Sci., 20, 1497–1511, 2020                                https://doi.org/10.5194/nhess-20-1497-2020
M. N. Ndalila et al.: Evolution of a pyrocumulonimbus event associated with an extreme wildfire 1509
Acknowledgements. We would like to thank Tom Remenyi of the Diner, D. J., Fromm, M. D., Torres, O., Logan, J. A., Martonchik,
University of Tasmania and the reanalysis team at the Bureau of J. V., Kahn, R. A., Moroney, C. M., Mazzoni, D. M., and Aver-
Meteorology (BoM) for facilitating online access to the BARRA- ill, C.: New Satellite Observations of Upper Tropospheric/Lower
TA product, Joshua Soderholm of BoM for providing additional Stratospheric Aerosols: Case Studies over the U.S. and Canada,
weather radar datasets for this project, and Kevin Tory of BoM for AGU Fall Meeting Abstracts, 1 December 2004, San Francisco,
his advice on some meteorological aspects of the study. We are also California, USA, 2004.
grateful to Rick McRae of the ACT Emergency Services Agency Di Virgilio, G., Evans, J. P., Blake, S. A. P., Armstrong, M., Dowdy,
for assistance with the BUFO analysis. The support from the Uni- A. J., Sharples, J., and McRae, R.: Climate Change Increases the
versity of Tasmania, and the end-user support from Sam Ferguson Potential for Extreme Wildfires, Geophys. Res. Lett., 46, 8517–
of Tasmania Fire Service, through BNHCRC funding, is gratefully 8526, https://doi.org/10.1029/2019gl083699, 2019.
acknowledged. Dowdy, A. J.: Climatological Variability of Fire Weather
in Australia, J. Appl. Meteorol. Clim., 57, 221–234,
https://doi.org/10.1175/jamc-d-17-0167.1, 2018.
Financial support. This research has been supported by the Aus- Dowdy, A. J. and Pepler, A.: Pyroconvection Risk in Australia:
tralian Research Council Linkage grant (grant no. LLP130100146) Climatological Changes in Atmospheric Stability and Surface
and the Bushfire and Natural Hazards Cooperative Research Centre Fire Weather Conditions, Geophys. Res. Lett., 45, 2005–2013,
(BNHCRC). https://doi.org/10.1002/2017gl076654, 2018.
Dowdy, A. J., Fromm, M. D., and McCarthy, N.: Pyrocumu-
lonimbus lightning and fire ignition on Black Saturday in
Review statement. This paper was edited by Ricardo Trigo and re- southeast Australia, J. Geophys. Res.-Atmos., 122, 7342–7354,
viewed by Paulo Fernandes and two anonymous referees. https://doi.org/10.1002/2017jd026577, 2017.
Duff, T. J., Chong, D. M., and Penman, T. D.: Quantifying
wildfire growth rates using smoke plume observations de-
rived from weather radar, Int. J. Wildland Fire, 27, 514–524,
References https://doi.org/10.1071/WF17180, 2018.
ESRI: ArcGIS Desktop Release 10.3, Environmental Systems Re-
Abatzoglou, J. T., Williams, A. P., and Barbero, R.: Global search Institute, Redlands, CA, USA, 2015.
Emergence of Anthropogenic Climate Change in Fire Fawcett, R. J. B., Webb, M., Thurston, W., Kepert, J. D., and Tory,
Weather Indices, Geophys. Res. Lett., 46, 326–336, K. J.: Modelling the fire weather of the Dunalley, Tasmania fire
https://doi.org/10.1029/2018gl080959, 2019. of January 2013: an ACCESS case study, CAWCR Research Let-
Ansmann, A., Baars, H., Chudnovsky, A., Mattis, I., Veselovskii, ters, Centre for Australian Weather and Climate Research, Mel-
I., Haarig, M., Seifert, P., Engelmann, R., and Wandinger, U.: bourne, Victoria, Australia, 36–40, 2014.
Extreme levels of Canadian wildfire smoke in the stratosphere Fox-Hughes, P., Harris, R., Lee, G., Grose, M., and Bindoff, N.:
over central Europe on 21–22 August 2017, Atmos. Chem. Future fire danger climatology for Tasmania, Australia, using a
Phys., 18, 11831–11845, https://doi.org/10.5194/acp-18-11831- dynamically downscaled regional climate model, Int. J. Wildland
2018, 2018. Fire, 23, 309–321, https://doi.org/10.1071/WF13126, 2014.
Bureau of Meteorology: 2013 Tasmanian Bushfires Inquiry, Hobart, Fromm, M., Bevilacqua, R., Servranckx, R., Rosen, J., Thayer,
Tasmania, Australia, 2013. J. P., Herman, J., and Larko, D.: Pyro-cumulonimbus in-
Clarke, H. and Evans, J. P.: Exploring the future change space for jection of smoke to the stratosphere: Observations and im-
fire weather in southeast Australia, Theor. Appl. Climatol., 136, pact of a super blowup in northwestern Canada on 3–
513–527, https://doi.org/10.1007/s00704-018-2507-4, 2019. 4 August 1998, J. Geophys. Res.-Atmos., 110, D08205,
Clarke, H. G., Smith, P. L., and Pitman, A. J.: Regional sig- https://doi.org/10.1029/2004jd005350, 2005.
natures of future fire weather over eastern Australia from Fromm, M., Tupper, A., Rosenfeld, D., Servranckx, R., and McRae,
global climate models, Int. J. Wildland Fire, 20, 550–562, R.: Violent pyro-convective storm devastates Australia’s capital
https://doi.org/10.1071/WF10070, 2011. and pollutes the stratosphere, Geophys. Res. Lett., 33, 05815,
Cruz, M. G., Sullivan, A. L., Gould, J. S., Sims, N. C., Ban- https://doi.org/10.1029/2005GL025161, 2006.
nister, A. J., Hollis, J. J., and Hurley, R. J.: Anatomy of Fromm, M., Lindsey, D. T., Servranckx, R., Yue, G., Trickl, T.,
a catastrophic wildfire: The Black Saturday Kilmore East Sica, R., Doucet, P., and Godin-Beekmann, S.: The Untold Story
fire in Victoria, Australia, For. Ecol. Manage., 284, 269–285, of Pyrocumulonimbus, B. Am. Meteorol. Soc., 91, 1193–1209,
https://doi.org/10.1016/j.foreco.2012.02.035, 2012. https://doi.org/10.1175/2010BAMS3004.1, 2010.
Cunningham, P. and Reeder, M. J.: Severe convective storms Fromm, M. D., McRae, R. H. D., Sharples, J. J., and Kablick, G.
initiated by intense wildfires: Numerical simulations of pyro- P.: Pyrocumulonimbus pair in Wollemi and Blue Mountains Na-
convection and pyro-tornadogenesis, Geophys. Res. Lett., 36, tional Parks, 22 November 2006, Aust. Meteorol. Ocean., 62,
L12812, https://doi.org/10.1029/2009GL039262, 2009. 117–126, 2012.
Dahlkötter, F., Gysel, M., Sauer, D., Minikin, A., Baumann, R., Grose, M. R., Fox-Hughes, P., Harris, R. M. B., and Bindoff, N. L.:
Seifert, P., Ansmann, A., Fromm, M., Voigt, C., and Weinzierl, Changes to the drivers of fire weather with a warming climate –
B.: The Pagami Creek smoke plume after long-range transport a case study of southeast Tasmania, Climatic Change, 124, 255–
to the upper troposphere over Europe – aerosol properties and 269, https://doi.org/10.1007/s10584-014-1070-y, 2014.
black carbon mixing state, Atmos. Chem. Phys., 14, 6111–6137,
https://doi.org/10.5194/acp-14-6111-2014, 2014.
https://doi.org/10.5194/nhess-20-1497-2020 Nat. Hazards Earth Syst. Sci., 20, 1497–1511, 2020You can also read