The Ascidia Ciona robusta Provides Novel Insights on the Evolution of the AP-1 Transcriptional Complex - Frontiers
←
→
Page content transcription
If your browser does not render page correctly, please read the page content below
ORIGINAL RESEARCH
                                                                                                                                             published: 03 August 2021
                                                                                                                                        doi: 10.3389/fcell.2021.709696

                                            The Ascidia Ciona robusta Provides
                                            Novel Insights on the Evolution of the
                                            AP-1 Transcriptional Complex
                                            Pina Marotta 1,2 , Federica Salatiello 3 , Luca Ambrosino 2 , Federica Berruto 3 ,
                                            Maria Luisa Chiusano 2,4 and Annamaria Locascio 3*
                                            1
                                             Stazione Zoologica Anton Dohrn, Department of Integrative Marine Ecology, Naples, Italy, 2 Stazione Zoologica Anton
                                            Dohrn, Department of Research Infrastructures for Marine Biological Resources, Naples, Italy, 3 Stazione Zoologica Anton
                                            Dohrn, Department of Biology and Evolution of Marine Organisms, Naples, Italy, 4 Department of Agriculture, Università degli
                                            Studi di Napoli Federico II, Portici, Italy

                                            The Activator Protein-1 transcription factor family (AP-1) transcriptional complex is
                                            historically defined as an early response group of transcription factors formed by dimeric
                                            complexes of the Jun, Fos, Atf, and Maf bZIP proteins that control cell proliferation
                                            and differentiation by regulating gene expression. It has been greatly investigated in
                                            many model organisms across metazoan evolution. Nevertheless, its complexity and
                                            variability of action made its multiple functions difficult to be defined. Here, we place
                         Edited by:
               Stephanie Bertrand,
                                            the foundations for understanding the complexity of AP-1 transcriptional members in
   UMR 7232 Biologie Intégrative des        tunicates. We investigated the gene members of this family in the ascidian Ciona robusta
   Organismes Marins (BIOM), France         and identified single copies of Jun, Fos, Atf3, Atf2/7, and Maf bZIP-related factors that
                        Reviewed by:        could have a role in the formation of the AP-1 complex. We highlight that mesenchyme
                       Pedro Martinez,
        University of Barcelona, Spain      is a common cellular population where all these factors are expressed during embryonic
                     Simona Candiani,       development, and that, moreover, Fos shows a wider pattern of expression including
             University of Genoa, Italy
                                            also notochord and neural cells. By ectopic expression in transgenic embryos of Jun
                 *Correspondence:
                 Annamaria Locascio
                                            and Fos genes alone or in combination, we investigated the phenotypic alterations
            annamaria.locascio@szn.it       induced by these factors and highlighted a degree of functional conservation of the
                                            AP-1 complex between Ciona and vertebrates. The lack of gene redundancy and the
                     Specialty section:
          This article was submitted to
                                            first pieces of evidence of conserved functions in the control of cell movements and
  Evolutionary Developmental Biology,       structural organization exerted by these factors open the way for using Ciona as a helpful
                 a section of the journal
                                            model system to uncover the multiple potentialities of this highly complex family of bZIP
   Frontiers in Cell and Developmental
                                 Biology    transcription factors.
            Received: 14 May 2021           Keywords: Jun, Fos, bZIP protein, mesenchyme, transcription factor, notochord
            Accepted: 12 July 2021
          Published: 03 August 2021
                               Citation:    INTRODUCTION
                 Marotta P, Salatiello F,
Ambrosino L, Berruto F, Chiusano ML         It is now commonly recognized that the complexity of organisms does not always directly
   and Locascio A (2021) The Ascidia
                                            correlate with the number of genes in its genome. Genetic diversity is often ensured by more
Ciona robusta Provides Novel Insights
          on the Evolution of the AP-1
                                            sophisticated control and interactions among the already available factors (Levine and Tjian, 2003;
              Transcriptional Complex.      Van Nimwegen, 2003; Ranea et al., 2005). One of the best ways of creating a wider possibility of
       Front. Cell Dev. Biol. 9:709696.     regulatory responses is through the formation of transcription factor (TF) dimers, with specific
      doi: 10.3389/fcell.2021.709696        DNA-binding properties, that allows the definition of novel control circuits (Klemm et al., 1998).

Frontiers in Cell and Developmental Biology | www.frontiersin.org                  1                                           August 2021 | Volume 9 | Article 709696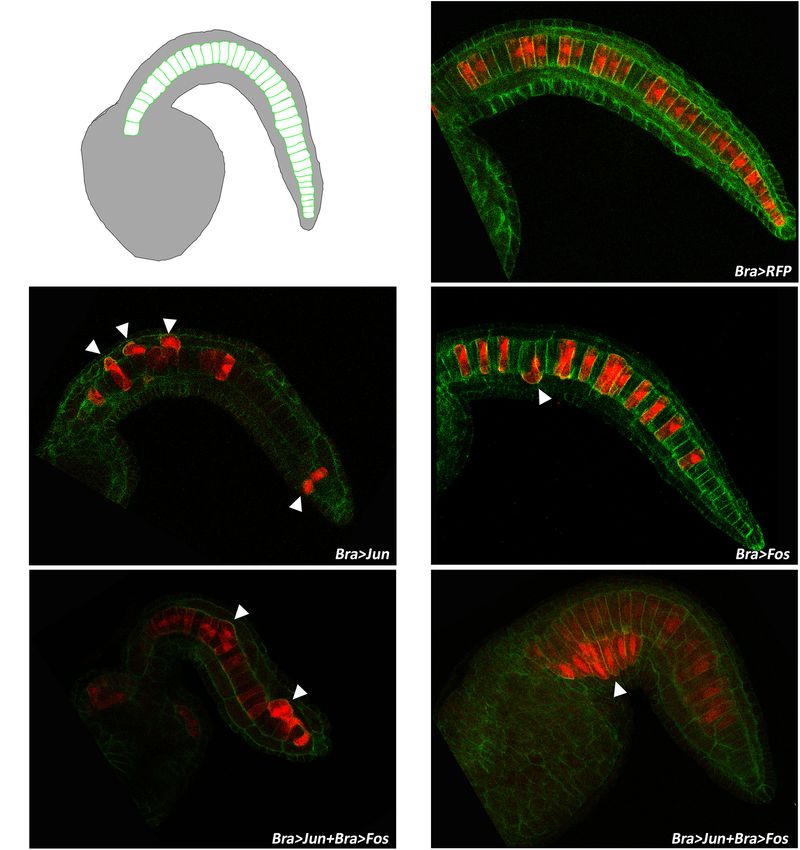
Marotta et al.                                                                                                  The Ciona AP-1 Transcriptional Complex

To understand animal evolution, it is important to delineate how              including cytokines, growth factors, and stress signals, in a
DNA binding and protein interactions of dimerizing TFs evolved.               variety of cellular events involved in normal and neoplastic
Jun and Fos, belonging to the bZIP proteins, are dimerizing                   development, such as proliferation, differentiation, apoptosis,
factors found in all eukaryotes and are the most common                       and transformation (Karin et al., 1997). Moreover, as a general
components of the Activator Protein-1 TF family (AP-1).                       rule derived from all studies, the AP-1 family members must be
    The AP-1 complex collectively describes a group of                        present in a well-defined asset to coordinate and ensure proper
structurally and functionally related TFs of the Jun (Jun,                    development or physiology of the organism.
JunB, and JunD) and Fos protein families (Fos, FosB, Fra-1,                       In light of the great complexity of this family of factors,
and Fra-2) and some members of the Atf (Atf, Atf-2, and                       investigating their function in specific cell types and animal
Atf-3) and Jdp (Jdp-1 and Jdp-2) subfamilies. These factors                   models suitable for transgenesis and reverse genetic approaches
share structural similarities and form homo- and heterodimeric                could be very useful to broaden the knowledge on their
complexes among them. Each of these proteins is differentially                multiple functions and mechanisms of action. Ciona robusta
expressed and regulated, determining that every cell type has                 is an excellent model for genetic and embryonic studies—
a complex different mixture of AP-1 dimers with different                     thanks to its rapid development, traceable cell lineage, and the
functions (reviewed by Wagner, 2001). The Jun proteins exist                  availability of an efficient electroporation method for transgenic
both as homo- and heterodimers, while the Fos proteins form                   experiments. Furthermore, its phylogenetic position at the base
stable heterodimers with Jun and the other AP-1 proteins.                     of vertebrate origin before the 2R duplication and its complete
All the combinations of AP-1 complexes bind a consensus                       and annotated genomic sequence pose this simple chordate to
sequence along the DNA (50 -TGAG/CTCA30 ), known as                           the forefront of the model organisms available for functional
the 12-O–tetradecanoylphorbol-13-acetate (TPA)-responsive                     and regulatory studies. Most notably is that Ciona possesses
element (TRE) (Angel and Karin, 1991), and control both basal                 the basic developmental features of vertebrates driven by non-
and inducible transcription of several genes containing the                   duplicated gene families.
AP-1-binding sites in their regulatory sequences.                                 The ascidian bZIP factors have been identified and classified
    During evolution, various layers of AP-1 complexity have                  by Yamada et al. (2003) in 2003. In this work, all the known
appeared such as gene duplications and differences between bZIP               human bZIP genes were confirmed to have similarity vs. both
members and changes in their co-localization and interaction.                 the C. robusta genome and its cDNA/EST collections. With
This diversification, together with the emergence of different                this analysis, 26 candidate genes were identified representing an
downstream target genes, greatly contributed to extend their                  almost complete set of bZIP genes in Ciona, and among them, one
mechanisms of action.                                                         Jun gene and one Fos gene were identified, respectively (Yamada
    About AP-1 functional evolution, in Drosophila, Fos is crucial            et al., 2003). Next, Imai et al. (2004) analyzed the expression
for dorsal closure (Zeitlinger et al., 1997), and in Caenorhabditis           profile of most of the ascidian TFs during Ciona embryonic
elegans, it is necessary for cell invasion through the basement               development. They found that Jun and Fos are expressed in
membrane during vulvar development (Sherwood et al., 2005).                   the B7.7 mesenchyme line at the early gastrula stage and in
Among vertebrates, specific roles have been assigned to c-Fos and             its descendants (Imai et al., 2004). Afterward, José-Edwards
c-Jun in skeletal and bone morphogenesis, where loss of these                 et al. (2011) identified a second Fos member expressed in the
genes in mice causes osteopenia and defective bone remodeling                 mesenchyme from the 110-cell stage and transiently in initial
(Wang et al., 1992; Kenner et al., 2004). In particular, c-Jun is             tailbud notochord cells.
required for axial skeletogenesis by regulating notochord survival                Some pieces of information are available in the literature about
and intervertebral disc formation (Behrens et al., 2003), and c-Fos           Ciona Jun and Fos expression, but no data are reported on the
is expressed in both nucleus pulposus cells (Lee et al., 2007) and            other AP-1 members, and hypotheses on their functions have
chordomas (Schwab et al., 2009). Furthermore, several in vitro                been formulated only on the basis of phylogenetic similarities
and in vivo studies pointed to an important role of the AP-1                  with vertebrates (José-Edwards et al., 2011). Jun was identified
complex for hematopoiesis specification in different vertebrate               in Ciona as a target of the Erk signaling, an evolutionarily
species, such as the mouse (Eferl et al., 1999; Lichtinger et al.,            conserved key pathway that regulates a wide variety of cellular
2012; Pereira et al., 2013; Goode et al., 2016; Obier et al., 2016),          processes, including proliferation, differentiation, apoptosis, and
Xenopus (Lee et al., 2012), and zebrafish (Wei et al., 2014; Li et al.,       stress responses under both normal and neoplastic conditions
2015). However, none of these studies has completely identified               (Kobayashi et al., 2018). All these functionalities are typically
the whole molecular mechanisms responsible for these effects,                 controlled by the AP-1 complex in other species, therefore
also because of the number of AP-1 family members and their                   suggesting that Ciona is a good model to investigate its functional
highly variable dimeric composition, that are also depending on               and regulatory evolution (Amoutzias et al., 2006).
specific cellular contexts.                                                       We have here further investigated the AP-1 complex in the
    To date, genetically modified mice harboring genetic                      ascidian C. robusta and analyzed its members’ composition
disruption and/or transgenic overexpression as well as                        and their expression patterns during embryonic development.
mutant cells isolated from these animals have represented                     We, then, investigated in transgenic embryos the effects of Jun
the major source to understand the regulatory functions of                    and Fos notochord-specific overexpression, giving, for the first
AP-1 subunits. They have highlighted how AP-1 mediates gene                   time, an indication of their functional role in the structural
regulation in response to a plethora of physiological stimuli,                organization of the cells.

Frontiers in Cell and Developmental Biology | www.frontiersin.org         2                                     August 2021 | Volume 9 | Article 709696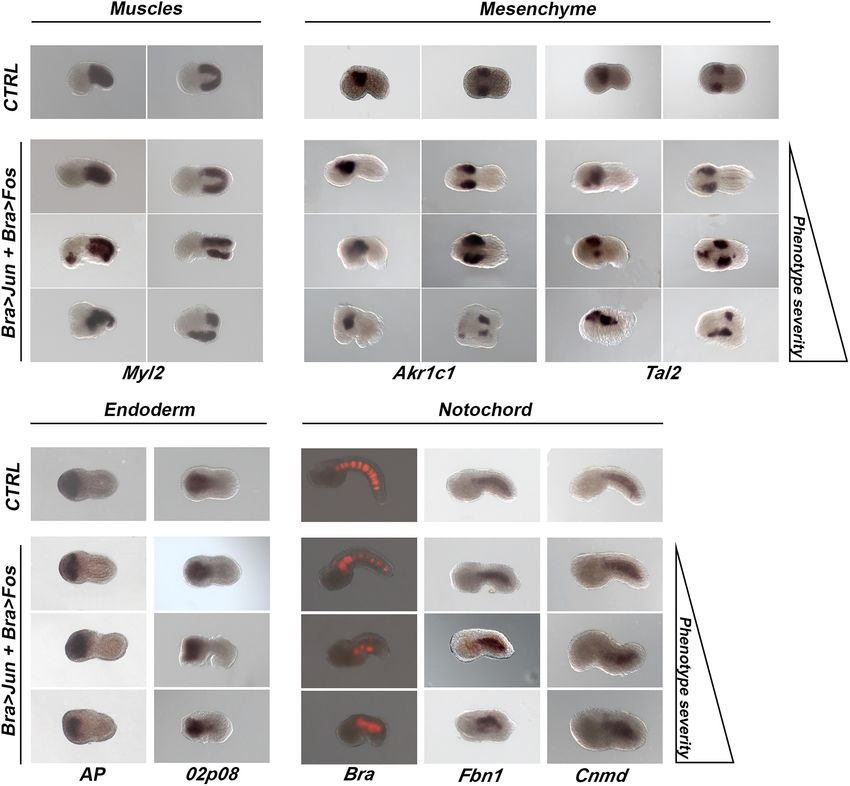
Marotta et al.                                                                                             The Ciona AP-1 Transcriptional Complex

MATERIALS AND METHODS                                                     Isolation of AP-1 Member Transcripts
                                                                          The full-length coding sequences (CDSs) of Jun and
Animals                                                                   Fos, corresponding to the Ciona transcript models
Adult specimens of C. robusta were collected in the Gulf of               KH.C5.610.v1.A.SL1-1         and      KH.C11.314.v2.A.ND1-1,
Taranto, Italy, by handpicking at low depth, and transported in           respectively, were amplified by PCR using as template the
seawater tanks to the facility of Stazione Zoologica Anton Dohrn          cDNA derived from mRNA poly(A)+ from a mix of Ciona
(SZN). Animals were acclimatized at ∼18◦ C for 2–3 days in open           embryos at tailbud stages (D’Aniello et al., 2011) and from the
system tanks and fed every day with a Shellfish Diet 1,800TM              Fos clone of the Gateway-compatible Unigene collection (gift
Instant Algae . Subsequently, they were exposed to continuous
                 R
                                                                          of Dr. Anna Di Gregorio). Similarly, the Atf3 full-length cDNA
lighting for a few days to accumulate mature gametes and to               corresponding to the transcript model KH.L5.5.v1.A.ND1-1 and
prevent gamete spawning. Embryos were staged following the                its 3’-untranslated region (UTR) was amplified. Regarding Maf
developmental timeline established by Hotta et al. (2007).                transcript (KH.C7.294.v1.A.SL1-1), only the sequence covering
                                                                          the last 1,432 bp of the CDS and the first 446 bp of its 3’-UTR
                                                                          was amplified. All the PCR fragments were cloned in the pCR            R

Paralog Prediction, Network                                               II-TOPO vector (Thermo Fisher Scientific) and sequenced. The
Construction, and Functional Annotation                                   primers are listed in Supplementary Table 1.
Jun and Fos transcription factor gene IDs (778972 and 778607,
respectively) were retrieved from the NCBI Gene partition
(Brown et al., 2015). The protein sequences of C. robusta assembly        Construct Preparation
GCF_000224145.3 annotation release 104 were downloaded from               The pBra > Titf1 construct (Spagnuolo and Di Lauro, 2002) was
the RefSeq partition at NCBI (O’Leary et al., 2016). An all-vs.-all       used to prepare the constructs used for the co-electroporation
similarity search of the entire C. robusta protein collection was         experiments. It contains 790 bp of the promoter region of Ciona
performed using the BLASTp program of the BLAST package                   Brachyury gene (Bra) directing notochord-specific patterns of
(Camacho et al., 2009), setting an E-value cutoff at 10−3 .               expression in both primary and secondary lineages (Corbo et al.,
Based on the detected similarity relationships, proteins were             1997), the Ciona endodermal marker Titf1 gene, and the SV40
grouped in networks of paralogs according to the procedure                poly-A signal. To generate Bra > Jun and Bra > Fos, the Titf1
described in Ambrosino et al. (2018) using the Network X                  gene was removed, by digesting the vector with BamHI/MluI,
package (Hagberg et al., 2008). A filtering step was introduced           and replaced with the Jun and Fos full-length cDNAs, amplified
to select different E-value thresholds (e−10 , e−15 , and e−30 )          from their respective pCR II-TOPO clones (see Supplementary
                                                                                                     R

that led to the construction of distinct networks of paralogs at          Table 1 for primer sequences).
different cutoff settings. A complete updating of the functional             To generate Bra > RFP and Bra > LacZ, the Bra promoter
annotation of the C. robusta protein collection was performed             was excised from the pBra > Titf1 construct and inserted into
with the software InterProScan (version 5.33) (Jones et al., 2014).       the RFP Zeller vector (Zeller et al., 2006) or in the pBlueScript
UniProt proteins with the InterPro domains related to Jun, Fos,           II KS 1,230 (gift of R. Krumlauf, Stowers Institute, Kansas City,
ATF3, and ATF2 were retrieved by keyword search performed on              United States), which contains the LacZ reporter gene and SV40
InterPro public database. Sequence similarity searches, using the         poly-A sequences.
detected C. robusta Jun, Fos, Atf3, and Atf2 protein members
as probe queries, were performed by scanning the entire non-
redundant protein database (nr) with the BLASTp web resource.             Transgenesis in Ciona robusta
Sequences from Tunicata, Cephalochordata, and Hemichordata,               Constructs were electroporated into fertilized eggs as previously
together with sequences from the echinoderm Strongylocentrotus            described (Locascio et al., 1999). Briefly, Ciona eggs were
purpuratus (sea urchin) as out-group, were retrieved. Moreover,           deprived of the chorion and of follicular cells and fertilized.
sequences from the model species Homo sapiens, Danio rerio,               The exceeding sperm was washed out through several passages
and Drosophila melanogaster as reference species of Vertebrata            in filtered seawater (FSW) then immediately transferred in
and Protostomia were retrieved from the NCBI Gene partition.              a solution containing 0.77 M mannitol and plasmid DNA.
Multiple alignments of the retrieved sequences were performed             Electroporations were performed in 0.4-cm cuvettes using a
with MAFFT software v7.397 (default parameters) (Katoh and                Bio-Rad Gene Pulser II at constant 50 V and 500–800 µ F.
Standley, 2013). Alignments were cleaned with TrimAl v1.4                     The transgenic embryos were reared up to early neurula (stage
(Capella-Gutiérrez et al., 2009) using a 0.25 gap threshold, 0.25         14), mid tailbud I (stage 21), initial tailbud (stage 17/18), early
residue overlap threshold, and sequence overlap ranging from              tailbud I (stage 19), and late tailbud I (stage 23) stages, fixed
50 to 75%. Maximum likelihood trees were constructed with                 and treated for subsequent analyses [e.g., whole-mount in situ
FastTree v2.1.11 (Price et al., 2010) using default parameters.           hybridization (WISH), phalloidin staining].
The visualization of the phylogenetic trees was performed with                Transgenic experiments for morphological observations of the
Interactive Tree of Life (iTOL) v4 (Letunic and Bork, 2019).              effects of 10, 20, and 40 µg of Jun and Fos overexpression in
Pieces of information about the domains contained in the                  notochord precursors were carried out twice and in biological
multiple alignments were retrieved through the graphic summary            triplicate. Subsequent transgenic experiments were carried out
of the NCBI BLAST web portal.                                             in biological triplicate and repeated at least seven times. The

Frontiers in Cell and Developmental Biology | www.frontiersin.org     3                                     August 2021 | Volume 9 | Article 709696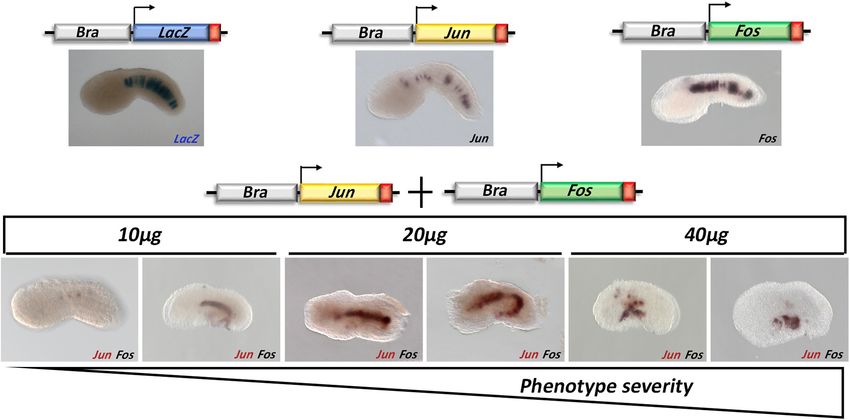
Marotta et al.                                                                                               The Ciona AP-1 Transcriptional Complex

reported percentages of positive signals correspond to the total          RESULTS
of five independent electroporations.
                                                                          Searching for AP-1 Gene Members in
Embryo Staining and Microscopy                                            Ciona robusta Genome
LacZ Staining
                                                                          The entire protein collection of C. robusta has undergone
Bra > LacZ transgene expression was visualized by detection of
                                                                          a comprehensive functional annotation to better characterize
β-galactosidase activity as previously described (D’Aniello et al.,
                                                                          all the genes classified as bZIP members related to Jun and
2011). After staining, embryos were washed in 1 × phosphate-
                                                                          Fos (hereafter called AP-1 members). An all-against-all protein
buffered saline (PBS), and imaging capture was made with a Zeiss
                                                                          sequence similarity search was performed on the entire protein
Axio Imager M1 microscope. A minimum of 100 embryos was
                                                                          collection of C. robusta. This analysis led to the construction of
analyzed in at least six different electroporations.
                                                                          networks of paralogs that were calculated based on three different
Phalloidin Staining                                                       e-value thresholds with the aim to identify sets of paralog proteins
Transgenic embryos were fixed for 30 min in MEM-PFA [4%                   based on different similarity cutoffs. The use of more stringent
paraformaldehyde (PFA), 0.1 M MOPS pH 7.4, 0.5 M NaCl, 1 mM               e-value cutoffs, indeed, defines a smaller number of paralogy
EGTA pH 8.0, 2 mM MgSO4 in H2 O], then washed four times for              relationships between proteins, obtaining a larger number of
20 min in PBT (1 × PBS-0.01% Triton X-100). They were then                networks, when compared to paralog detections that employ less
incubated at room temperature (RT) in PBT2 + 1:100 Alexa Fluor            stringent e-value thresholds. This permits to define subgroupings
635 phalloidin (Thermo Fisher Scientific) for 4 h and rinsed for          of more similar proteins within groups of less similar protein-
5 min in PBT. Afterward, embryos were washed four times for               encoding genes (i.e., in networks of computationally predicted
20 min, alternating PBT and 1 × PBS. Embryos were imaged with             paralogs defined at less stringent e-value thresholds).
a Leica TCS SP8X confocal laser scanning using the HC PL APO                  The results of the performed functional annotation analysis
CS2 40 × /0.85 dry objective.                                             were considered in light of the networks of paralog organization
                                                                          in order to identify all those containing the members of the AP-
Whole-Mount in situ Hybridization                                         1 family. As represented in Figure 1, members of Fos, Atf3, and
Single WISH and double WISH were carried out as previously                Maf (a gene named LOC778711 that in this study we called Maf
described (Christiaen et al., 2009). Briefly, wild-type embryos for       because it encodes a protein with a bZIP Maf motif) are grouped
in situ experiments were obtained by in vitro fertilization and           within the same network of paralogs when using the less stringent
fixed at the desired stages in 4% PFA, 0.1 M MOPS pH 7.5, and             e-value cutoff (e−10 ), while Jun and Atf2 members show a distinct
0.5 M NaCl at 4◦ C overnight.                                             organization. Moving to a more stringent cutoff (e-value at e−15 ),
    The Fos probe was generated from the 63M13 clone found                the Maf member splits from the Fos/Atf3 group. The use of the
in the Ciona intestinalis Gateway-compatible Unigene collection           more stringent e-value threshold (e−30 ), finally, discriminates
(Beckman Coulter Genomics, Grenoble, France) (gift from Dr.               also Fos from Atf3 members.
A. Di Gregorio, New York University College of Dentistry, NY,                 A search of all the detected C. robusta AP-1 family members in
United States). For the synthesis of Jun, Atf3, and Maf probes,           the Gene Partition at the NCBI site revealed that Fos, Atf3, Atf2,
their corresponding TOPO-TA clones were used.                             Jun, and Maf proteins are isoforms each encoded by a single gene.
    The characterization of the mutant embryos by WISH                    In particular, we detected four protein isoforms encoded by the
was performed using notochord-, endoderm-, muscle-, and                   Fos gene, four isoforms encoded by Atf3, two isoforms encoded
mesenchyme-specific genes chosen for their definite expression            by Atf2, and single proteins encoded by Jun and Maf, respectively
pattern on the base of the data reported in ANISEED at the initial        (Supplementary Table 2). A similar search on the considered
tailbud stage (Brozovic et al., 2018). In particular, the following       model species revealed the presence of multiple copies of Jun and
gene models were considered: KH.C3.225 and KH.C13.35                      Fos genes in Vertebrata, i.e., three genes related to Jun family (Jun,
[human Fibrillinn (FBN1) and Chondromodulin (CNMD)                        JunB, and JunD) and four genes related to Fos family (Fos, FosB,
orthologs, respectively) for the notochord, KH.L141.45 for the            FosL1, and FosL2) in H. sapiens; six Jun genes (Jun, JunBa, JunBb,
endoderm, KH.C8.859 [human myosin light chain 2 (MYL2)                    JunD, JunDP2a, and JunDP2b) and seven Fos genes (FosAa,
ortholog] for the muscles, and KH.C1.222 and KH.C5.202                    FosAb, FosB, FosL1A, FosL1B, FosL2, and FosL2L) in D. rerio.
[human aldo-keto reductase family 1 member C1 (AKR1C1) and                In the considered model from the Protostomia D. melanogaster,
TAL bHLH transcription factor 2 (TAL2) orthologs, respectively]           all the considered AP-1 family members are encoded by a single
for the mesenchyme. The clones corresponding to all these                 gene. Details about the number of protein isoforms encoded by
genes were found in the Ciona Gene Collection (Satou et al.,              these genes are reported in Supplementary Table 2.
2002) with, respectively, the following IDs: R1CiGC02k18,                     To verify the consistency of the results obtained in
R1CiGC05o23, R1CiGC02p08, R1CiGC24p06, R1CiGC01b11,                       C. robusta and to provide a rough overview of what is
and R1CiGC11k01.                                                          available about the AP-1 family members on the reference
    A Zeiss Axio Imager M1 was used for embryo image                      protein databases, we interrogated InterPro web portal to
capture. Pictures were edited with Adobe Photoshop CS6,                   retrieve all the Uniprot proteins having functional annotation
and adjustments, where applied, were only for clarity without             related to Jun, Fos/Atf3/Maf, and Atf2 in all chordate species.
affecting any essential part of the image.                                By this approach, we obtained 565 different chordate species

Frontiers in Cell and Developmental Biology | www.frontiersin.org     4                                      August 2021 | Volume 9 | Article 709696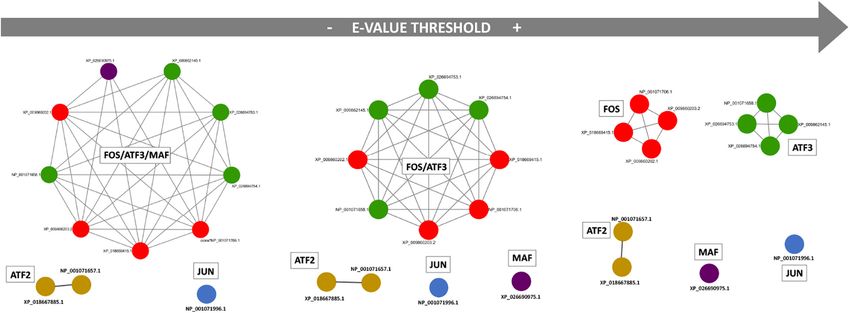
Marotta et al.                                                                                                                The Ciona AP-1 Transcriptional Complex

having 1,993 Jun-related proteins, six of which were protein                          In particular, the following can be easily recognized: a three-leaf
isoforms from tunicates; 572 different chordate species having                        branch for Tunicata followed by a cluster of seven leaves for
5,505 Fos/Atf3/Maf-related proteins, 10 of which were from                            Vertebrata; a three-leaf branch including Cephalochordata and
tunicates; 511 chordate species having 1,007 Atf2-related protein                     single leaves of Echinodermata, Hemichordata, and Protostomia
entries, three of which were from tunicates. All the results are                      sequences. The only exception to the clusterization of sequences
summarized in Supplementary Table 3, and they highlight the                           from the same taxon is represented by sequences from the
widespread presence of AP-1 family proteins among chordates.                          tunicate Oikopleura dioca and zebrafish (D. rerio), i.e., the two Jun
   The selection of the sequences to be included in the                               dimerization proteins 2 (JUNdp2a and JUNdp2b). The unrooted
phylogenetic analysis was done by performing sequence                                 phylogenetic tree generated from the collected Fos sequences
similarity searches of the reference NCBI gene sequences of                           (Supplementary Figure 6) showed a similar behavior. Again,
C. robusta Jun, Fos, Atf3, Atf2, and Maf protein members as                           we observed a Tunicata branch (with two leaves) related in the
probe queries against the entire non-redundant protein database                       phylogenetic tree to a cluster of Vertebrata sequences including
(nr). The probe queries included the reference or the longest                         multiple copies from human and zebrafish and to a three-leaf
isoform for each gene. The best hit for each detected species                         branch of Cephalochordata. Also in this case, we can observe for
among the Tunicata, Cephalochordata, and Hemichordata,                                Oikopleura and for the FOSL2L gene from zebrafish a position
together with the echinoderm S. purpuratus as out-group, was                          in the tree that is distant from other tunicate or vertebrate
retrieved. The sequences from the model species H. sapiens,                           sequences and more closely related to leaves of Hemichordata,
D. rerio, and D. melanogaster were selected as reference species                      Echinodermata, and Protostomia (Supplementary Figure 6).
of Vertebrata and Protostomia. Most importantly, no significant                          Since we were not able to detect in other species robust
hit related to the Maf probe sequence was detected in the other                       homologs of the C. robusta Maf gene, we decided to include
species, probably revealing a species-specific protein.                               the sequence of its encoded protein in the phylogenetic analysis
   The multiple alignments performed with the collected Jun                           related to another member of the AP-1 family. As inferred by our
sequences (Supplementary Figure 1) highlighted the presence                           paralog analysis performed on the entire Ciona protein collection,
of the conserved domains “bzip_Jun” (cd14696) and “Jun-like                           Maf resulted in the same network of paralogs of Fos- and Atf3-
transcription factor” (pfam03957). Accordingly, the retrieved Fos                     related protein isoforms when using the less stringent e-value
sequences (Supplementary Figure 2) showed the presence of                             cutoff (Figure 1). We tried to perform a new phylogenetic tree
the conserved domain “bZIP_Fos” (cd14721), and the ATF3 and                           including Maf protein sequence among Atf3 and Fos sequences.
ATF2 sequences (Supplementary Figures 3, 4) highlighted the                           Only the set of Atf3 sequences enabled the conservation of Maf
presence of the conserved domains “bZIP_ATF3” (cd14722) and                           sequence in the multiple alignment after the trimming step. This
“bZIP_ATF2” (cd14687), respectively. As expected, all proteins                        was probably due to the marked difference between the lengths of
grouped in each alignment showed the presence of the conserved                        Maf and Fos sequences. The tree generated from the retrieved
domains “bZIP transcription factor” (pfam00170) and “basic                            Atf3 sequences, including the Maf sequence from C. robusta
region leucine zipper” (smart00338).                                                  (Supplementary Figure 7), showed the presence of three main
   The unrooted phylogenetic tree generated from the collected                        ATF3 branches with Tunicata ATF3 sequences rather distant
Jun sequences (Supplementary Figure 5) highlighted the                                from the rest of the considered sequences that are, respectively
presence of a certain sequence conservation under each taxon.                         a two-leaf branch of Vertebrata close to a two-leaf branch of

  FIGURE 1 | Ciona robusta bZIP members related to Jun and Fos when similarity threshold changes. Networks of paralogs were detected at different e-value
  thresholds: (A) e−10 ; (B) e−15 ; (C) e−30 . Each node in the network represents a protein, and each gray edge represents a paralogy relationship. FOS member
  isoforms are shown in red, ATF3 in green, ATF2 in light brown, MAF in purple, JUN in blue.

Frontiers in Cell and Developmental Biology | www.frontiersin.org                 5                                            August 2021 | Volume 9 | Article 709696
Marotta et al.                                                                                             The Ciona AP-1 Transcriptional Complex

Cephalochordata and a second branch with leaves of sequences               faculty might be postulated. To corroborate this hypothesis,
from Protostomia, Echinodermata, and Hemichordata. The                     we focused our functional analysis on Jun and Fos members.
position of C. robusta Maf sequence between Cephalochordata                The Jun proteins exist as homodimers and heterodimers,
and D. melanogaster in the phylogenetic tree probably indicates            while the Fos proteins are historically considered able
an ancestral separation of this sequence that soon diverged from           to form stable heterodimers with Jun proteins, although
the other related sequences of the ATF3 family. The tree generated         it has been demonstrated that, in peculiar conditions,
from the collected Atf2 sequences (Supplementary Figure 8)                 they can also homodimerize. We, hence, assayed their
showed a three-leaf branch of tunicates close to a two-leaf branch         activity by overexpression of their CDSs during notochord
including Oikopleura dioica and D. melanogaster. More distant              development under the control of the Brachyury promoter
in the tree, we can observe the presence of Atf2 sequences from            (Bra > Jun, Bra > Fos constructs). This tissue-specific
Hemichordata and Echinodermata, followed by the considered                 expression would permit to avoid possible interference by
Cephalochordata and Vertebrata taxa.                                       other members of this family, and it is already reported in
   The phylogenetic analysis revealed in all the four considered           other species as a territory with functional significance for Jun
classes an ancestor behavior of AP-1 members of Tunicata                   and Fos activity.
subphylum with respect to the other considered sequences.                     Different concentrations of Bra > Jun and Bra > Fos
An exception to this behavior is represented by the sequences              constructs (10, 20, and 40 µg) alone or in combination
from Oikopleura, a tunicate with peculiar genomic features that            were assayed by electroporation. The transgenic embryos were
make it closer to Protostomia in the phylogenetic trees rather             reared up to the mid tailbud I (stage 21), following the
than other tunicates (Supplementary Figures 5, 6, 8). The                  notochord cell intercalation, and Jun and Fos overexpression was
performed analyses highlighted, moreover, the presence of single           evaluated by WISH. Compared to the control (Bra > LacZ),
gene copies in tunicates opposed to gene amplification of Jun              the overexpression in the notochord cells of Jun and Fos alone
and Fos members in Vertebrata subphylum (Supplementary                     apparently did not influence the proper development of the
Figures 5, 6). Zebrafish in particular has undergone extra-                embryos (Figures 3A–C).
duplication events of its genome, as resulted from the number                 Conversely, Jun and Fos co-electroporation resulted in a scale
of copies of Jun and Fos genes (Supplementary Table 2).                    of abnormal phenotypes proportional to the amount of DNA
                                                                           used (Figures 3D–I) and ranging from “wt-like” in which all the
Expression of AP-1 Members During                                          structures of the embryo were perfectly recognizable (Figure 3D)
Embryonic Development                                                      to a completely aberrant one (Figures 3H,I).
                                                                              Intra-electroporation variability was probably also linked
Few data on Ciona Fos and Jun factors are currently available in
                                                                           to the stochastic nature of the method, where the variable
the literature. We hence proceeded with a comparative analysis
                                                                           amount of DNA that enters the fertilized eggs during
of the expression profiles of the AP-1 gene members during
                                                                           electroporation is random and unpredictable. Within this
the embryonic development at neurula, early tailbud, and late
                                                                           scenario, as the quantity of electroporated DNA increases,
tailbud stages (stages 15, 19, and 23, respectively). We assayed
                                                                           the percentage of severely defective embryos increases
by WISH Jun, Fos, Atf3, and Maf expression, except for Atf2/7
                                                                           too (Table 1). Indeed, WISH analyses on these embryos
of which we were unable to amplify a valid riboprobe. As
                                                                           revealed that Jun and Fos expression in notochord cells was
shown in Figure 2, we obtained very similar expression profiles
                                                                           barely detectable in the wt-like tailbuds. Hence, depending
in specific mesenchymal populations. As already reported in
                                                                           on the level of overexpression induced in the notochord
ANISEED database1 and by Imai et al. (2004), Jun is expressed
                                                                           cells, three groups of embryonic phenotypes have been
in a pair of B-cell mesenchymal cells from neurula to tailbud
                                                                           distinguished (Table 1): a first, almost normal, group of
stages (Figures 2D–F); the same narrow signal is detectable for
                                                                           embryos with a nearly perfect development (Figure 3D); a
Atf3 and Maf (Figures 2J–O), although Atf3 appears later at
                                                                           second, moderately defective, group specifically displaying
tailbud stage 19. According to single-cell transcriptomic analyses
                                                                           various tail alterations (Figures 3E,F); and finally, a third,
(Cao et al., 2019), Fos staining shows a relatively stronger and
                                                                           severely defective, group exhibiting a deep displacing
broader signal in the mesenchymal cells at neurula and tailbud
                                                                           of the notochord and severe alterations throughout the
stages (Figures 2G,H) with a very transient signal in notochord
                                                                           whole embryo (Figures 3G–I and Table 1). It is worth
precursors at the neurula stage (José-Edwards et al., 2011; data
                                                                           noting that the development of Bra > Jun + Bra > Fos
not shown). A novel, not previously reported, and symmetric Fos
                                                                           embryos proceeds as in control embryos up to the
signal is clearly visible in the anterior part of the nervous system
                                                                           neurula stage, although Brachyury promoter starts to be
at late tailbud I stage (Figure 2I).
                                                                           active at the 64-cell stage (Corbo et al., 1997). Therefore,
                                                                           only the formation of tailbud embryos is affected, that
Functional Analysis of Jun and Fos                                         is, in correspondence to notochord elongation and cell
Transcription Factors                                                      intercalation stage.
Since our WISH experiments show an overlapping profile of                     Together, these results confirm the ability of the Jun/Fos
the ascidian AP-1 gene expression, their heterodimerization                heterodimeric complex to influence notochord development and
                                                                           seem to indicate that, in Ciona, this complex can influence the
1
    http://www.aniseed.cnrs.fr/                                            transcriptional regulation of developmental genes.

Frontiers in Cell and Developmental Biology | www.frontiersin.org      6                                   August 2021 | Volume 9 | Article 709696
Marotta et al. The Ciona AP-1 Transcriptional Complex
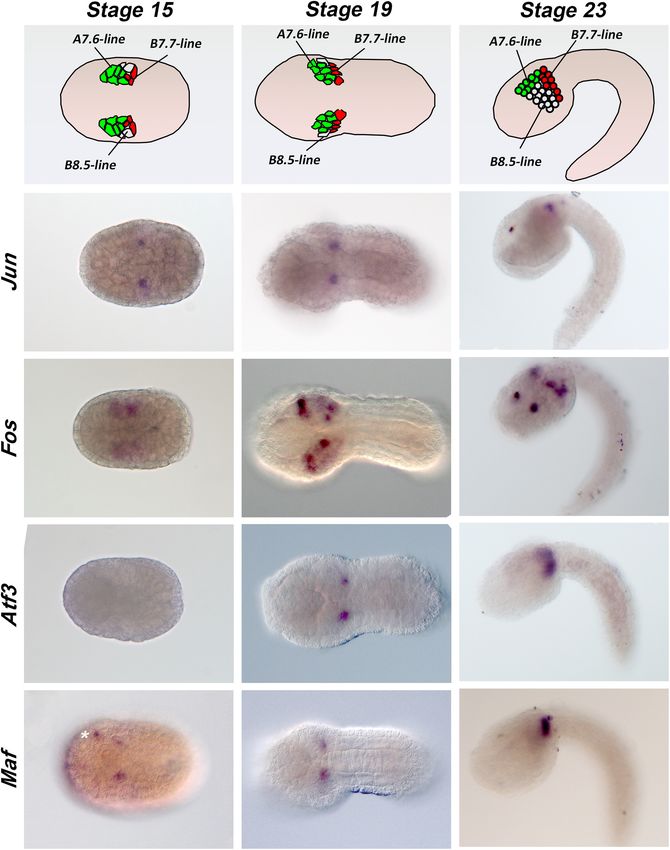
FIGURE 2 | Expression patterns of Ciona AP-1 transcription factors during embryonic development. (A–C) Schematic representation of mesenchymal cells in stage
15, 19, and 23 embryos. (D–O) Whole-mount Ciona embryos hybridized in situ with antisense RNA probes against the Jun (D–F), Fos (G–I), Atf3 (J–L), and Maf
(M–O) genes, as indicated on the left side of each row. Developmental stages are indicated at the top of each column: stage 15, early neurula; stage 19, early
tailbud I; stage 23, late tailbud I. White asterisk indicates an unspecific signal. Stage 15 and 19 embryos are in a dorsal view, and stage 23 embryos are in a lateral
view; anterior is on the left.
Characterization of Bra > Jun and severity. We assayed by WISH experiments the expression
Bra > Fos Transgenic Tailbud Embryos of muscle-, mesenchyme-, endoderm-, and notochord-specific
markers selected from the ANISEED database for their definite
Bra > Jun and Bra > Fos overexpression in the notochord
and specific expression pattern (Brozovic et al., 2018).
precursor cells induces progressively more severe alterations
with increasing Jun and Fos concentrations. We, then, evaluated
the differentiation levels of the various embryonic tissues on Muscles and Mesenchyme
transgenic tailbud embryos (stage 17/18) electroporated with The overexpression of Jun and Fos in notochord cells appeared
10 µg of Bra > Jun and Bra > Fos DNA and split out in not to affect the differentiation of muscle and mesenchymal cells,
three separate groups according to their apparent phenotype as far as could be seen by examination, in the manipulated
Frontiers in Cell and Developmental Biology | www.frontiersin.org 7 August 2021 | Volume 9 | Article 709696Marotta et al. The Ciona AP-1 Transcriptional Complex
FIGURE 3 | Functional analysis of Jun and Fos during Ciona robusta development. (A) Brachyury promoter (Bra) specifically drives the expression of a transgene in
the notochord cells; fertilized eggs electroporated with Bra > LacZ (A), Bra > Jun (B), and Bra > Fos (C) and reared up to the mid tailbud I stage (S21) were
checked for the transgene expression through β-galactosidase assay staining (Bra > LacZ) or whole-mount in situ hybridization (WISH) using Jun (brown staining)-
and Fos (black staining)-specific probes. (D–I) Jun and Fos double WISH on tailbud embryos co-electroporated with Bra > Jun and Bra > Fos. Increasing amounts
of Bra > Jun and Bra > Fos go at the same pace with the growing severity of the phenotype; double WISH experiments show that the transgenes are less
expressed in the most wt-like embryos (D). For all embryos, the anterior is on the left and the dorsal on the top.
TABLE 1 | Percentages of phenotypic alterations as a function of the amount of Bra > Jun and Bra > Fos in Notochord
Bra > Jun and Bra > Fos electroporated DNA.
Organization
Bra > Jun + Bra > Fos Normal Moderately Severely The effects of the overexpression of Jun and Fos on the
defective defective
differentiation of notochord cells were first explored by
10 µg 30% 60% 10% WISH of the expression of two different markers exclusively
20 µg 20% 35% 45% expressed in this tissue: Fibrillin 1 (Fbn1) (Sakai et al., 1986)
40 µg 2% 38% 60% and Chondromodulin (Cnmd) (Shukunami and Hiraki, 2001;
Figures 4G,H). Furthermore, the activity of the Bra promoter was
also assayed by tri-electroporation with Bra > Jun and Bra > Fos
of the Bra > RFP construct containing the red fluorescent protein
tailbud embryos of the global expression of the muscle-specific
(RFP) downstream of the Bra promoter (Corbo et al., 1997;
gene, Myosin Light Chain 2 (Myl2) (Macera et al., 1992;
Figure 4F). From these analyses emerged that the expression
Figures 4A,A’), and of two mesenchyme-specific genes, Aldo-
of the examined notochord markers shows the same pattern
Keto Reductase Family 1 Member C1 (Akr1c1) (Ciaccio and Tew,
as in the controls independently from their phenotype severity
1994; Figures 4B,B’) and TAL BHLH Transcription Factor 2
and that notochord cell differentiation is not affected. Regardless
(Tal2) (Xia et al., 1991; Figures 4C,C’).
of the grade of progressive disorganization in the different
phenotypes, by terminal deoxynucleotidyl transferase dUTP nick
Endoderm end labeling (TUNEL) assay, we also observed that notochord
To assess the correct endoderm differentiation, control and alterations were not caused by the induction of apoptosis
co-electroporated tailbuds were tested for the expression (data not shown) and that the number of notochord cells was
of two endodermal markers, the alkaline phosphatase comparable to that of the controls. These results suggest that
(AP) and a gene, not yet annotated, identified with the the Jun and Fos could be involved in the structural organization
ID KH2012:KH.L141.45, that here we refer to as 02p08. of the notochord but not in its specification, proliferation, and
The first was evaluated through an AP activity assay differentiation.
(Figure 4D), the other one by WISH (Figure 4E). These To deeply explore the effects of Bra > Jun and Bra > Fos
tests showed that the Bra-directed overexpression of Jun and expression on the notochord morphology, transgenic embryos
Fos did not affect the differentiation and localization of the were left to develop until the late tailbud I stage (stage 23), when
endodermal cells. the notochord cell intercalation is completed, but before lumen
Frontiers in Cell and Developmental Biology | www.frontiersin.org 8 August 2021 | Volume 9 | Article 709696Marotta et al. The Ciona AP-1 Transcriptional Complex FIGURE 4 | Tissue differentiation in transgenic embryos (stage 17/18) co-electroporated with 10 µg of Bra > Jun and Bra > Fos constructs. (A,A’) Muscle differentiation; whole-mount in situ hybridization (WISH) experiments with the muscle marker gene Myosin Light Chain 2 (Myl2). (B–C’) Mesenchyme differentiation; WISH experiments with mesenchyme markers (B,B’) Aldo-Keto Reductase Family 1 Member C1 (Akr1c1); (C,C’) TAL BHLH Transcription Factor 2 (Tal2). (D,E) Endoderm differentiation. (D) Alkaline phosphatase (AP) assay to detect the endogenous AP enzymatic activity. (E) WISH experiment with the endoderm-specific gene KH2012:KH.L141.45. (F–H) Notochord differentiation. (F) Fluorescent images showing reporter gene [red fluorescent protein (RFP)] expression under the control of the Brachyury (Bra) promoter in embryos tri-electroporated with 10 µg of Bra > Jun, Bra > Fos, and Bra > RFP. (G,H) WISH experiments with the notochord markers (G) Fibrillin 1 (Fbn1) and (H) Chondromodulin (Cnmd). CTRL, Bra > RFP control embryos; Bra > Jun + Bra > Fos, co-electroporated embryos. In each column, embryos have been placed according to the progressive severity of the phenotype: normal (top), mild (middle), and severe (bottom) alterations. For all embryos, the anterior is on the left. (A–C,F–H) Lateral view; (A’,B’C’,D,E), dorsal view. formation (Figure 5A), and then, the transgenes were observed those electroporated with Jun and Fos together (Supplementary under a fluorescence microscope (Figures 5B–F). For this Table 4). As annotated in Table 2, the electroporation efficiencies, analysis, we again used 10 µg of Bra > Jun and Bra > Fos alone or evaluated based on Jun/Fos embryo RFP expression, were in combination and added in all assays the Bra > RFP construct as comparable in all samples, ranging from 83.15% of the control an internal control to selectively evaluate the correct formation of Bra > RFP embryos to 92.31% of the tri-electroporated. Among electroporated notochord cells. Furthermore, phalloidin staining the fully developed embryos, we then evaluated notochord of the embryos was used to define cell membrane profiles of the impairment and considered normal only the notochords with a notochord. Number counting of RFP-positive embryos evidenced perfect alignment of all cells. Following electroporation of the a notable decrease, almost by half, of developed embryos among Bra > RFP construct, control larvae displayed the wild-type Frontiers in Cell and Developmental Biology | www.frontiersin.org 9 August 2021 | Volume 9 | Article 709696
Marotta et al.                                                                                                                The Ciona AP-1 Transcriptional Complex

  FIGURE 5 | Intercalation defects in tailbud embryos overexpressing Jun and Fos. (A) Schematic representation of notochord cell organization in the late tailbud
  embryo (stage 23). (B) Confocal microscopy of a stage 23 control embryo electroporated with Bra > RFP. (C,D) Stage 23 embryos co-electroporated with
  Bra > RFP and either Bra > Jun or Bra > Fos, respectively. (E,F) Embryos at the same stage, co-electroporated with Bra > RFP and Bra > Jun plus Bra > Fos
  showing altered organization of notochord cells along the tail. White arrowheads evidence misaligned cells. Red, red fluorescent protein (RFP) staining; green,
  phalloidin staining.

notochord phenotype (Figures 5A,B). In Jun and Fos transgenic                          4–5 consecutive cells were electroporated as demonstrated by
embryos, we observed two types of statistically significant                            their RFP-positive signal (Figures 5E,F). Conversely, we never
alterations in notochord cells. In particular, about 11% of                            observed single or in blocks misalignments in the notochord
Bra > Fos and 23% of Bra > Jun embryos displayed single                                when there were no consecutive cells electroporated. Cell
notochord cell misalignments (Figures 5C,D). This incorrect                            misalignment equally involved anterior and posterior notochord
positioning of single notochord cells increases to 30% in                              cells (Figures 5E,F), thus revealing an equal impact of Jun and
Bra > Jun plus Bra > Fos co-electroporated embryos (Table 2).                          Fos on notochord cells deriving from primary and secondary
Notably, a second more severe misalignment of notochord cells                          lineages, respectively.
was mostly specific for Jun and Fos co-electroporated samples.                            The 23% of single-cell alterations in embryos electroporated
In 29% of Jun/Fos embryos, we observed a displacement of                               with Jun might be easily explained if we consider the
groups of notochord cells (Figures 5E,F). This wider notochord                         homodimerization ability of this TF. Conversely, 11% of
disorganization has always been identified when no less than                           misalignments in embryos overexpressing Fos could be

Frontiers in Cell and Developmental Biology | www.frontiersin.org                 10                                           August 2021 | Volume 9 | Article 709696
Marotta et al.                                                                                                          The Ciona AP-1 Transcriptional Complex

TABLE 2 | Percentages of notochord alterations observed in Bra > Jun and Bra > Fos transgenic embryos.

Constructs                            Electroporation                 Fully                                     Notochord phenotypes
                                      efficiency %                  developed
                                                                    embryos N.
                                                                                                Normal                 Single cell                Blocks of
                                                                                                 (%)                   alteration                    cells
                                                                                                                           (%)                    alteration
                                                                                                                                                      (%)

BRA > RFP                                 83.15%                       178                      67.98%                   2.70%                      0.68%
BRA > Fos                                 91.35%                       104                      72.11%                  11.58%                      1.05%
BRA > Jun                                 88.55%                       131                      62.93%                  23.27%                      6.03%
BRA > Jun + BRA > Fos                     92.31%                       104                      32.29%                  30.21%                     29.17%

presumably the consequence of the formation of Fos homodimers                         Uniprot databases and performed phylogenetic analyses of the
or heterodimers with unknown factor/s. Whichever is the most                          retrieved sequences.
correct hypothesis, these complexes seem in any case less                                 The genomic locus assignment of each protein sequence
effective than Jun/Fos combined activity, and further studies                         revealed the presence of single gene copies for each Ciona AP-
will be necessary to verify if the phenotype derives from the                         1 factor. In particular, single Jun, Fos, Atf2, and Atf3 members
formation of Jun–Fos heterodimers.                                                    and an additional Ciona-specific Maf member evidenced less
    In particular, the observed partial convergence of notochord                      redundancy for this bZIP family in ascidians and the presence
cells to form two adjacent and opposing rows (Figures 4, 5E,F)                        of a highly conserved core of AP-1 members that was formed in
is very similar to the knockdown phenotype of Fibronectin                             the last common ancestor of chordates.
(Fn) gene (Segade et al., 2016). Fn gene is required for                                  Individual members of each family may have different
proper notochord intercalation in Ciona and, as well as in                            biological functions during the formation of the embryonic
Jun/Fos transgenic embryos, its functional perturbation does                          tissues. By comparative analysis of these gene expression profiles
not disrupt sheath integrity and defective cells do not escape                        during Ciona development, it was evident that they all show a
into adjoining tissues (Figures 5E,F). Given this similarity                          common and restricted pattern in the B7.7 mesenchyme line
in phenotypes, to assess if Jun and Fos co-expression can                             (Figure 2). In C. robusta and savigny, it was demonstrated
affect notochord intercalation through the negative regulation                        that this line gives rise to tunic and blood cells (Tokuoka
of Fn, we analyzed the expression of this gene by WISH                                et al., 2005). In this regard, different in vitro and in vivo
on transgenic embryos (Supplementary Figure 9). The result                            molecular genetic approaches have demonstrated the many roles
was that Fn expression does not change in any of the                                  of AP-1 (Fos/Jun) TF in the development and differentiation of
embryos with Jun and Fos ectopic expression alone or                                  hematopoietic precursor cells (reviewed in Liebermann et al.,
in combination (Supplementary Figures 9B–E). Fn expression                            1998). However, none of these studies has completely identified
remains unaltered even in severely defective phenotypes in which                      the whole molecular mechanisms responsible for these effects
the notochord cells did not intercalate and are still placed in two                   also because of the number of AP-1 family members and their
separate rows (Supplementary Figure 9E).                                              highly variable dimeric composition. The presence of single
    Taken together, these data suggest that the overexpression of                     gene copies for Ciona Fos, Jun, AT3, and Maf factors and their
Jun and Fos affects notochord cell intercalation but not through                      common expression in embryonic mesenchyme cells that will
Fn regulation.                                                                        give rise to blood cells reveal interesting potentialities about the
                                                                                      different combinations of dimeric factors they can form and their
                                                                                      possible conserved function in hematopoiesis. In this regard,
DISCUSSION                                                                            ascidians with their not duplicated number of AP-1 members
                                                                                      may represent an excellent experimental system to explore the
Despite all the existing data, it is difficult to draw a clear                        evolution of AP-1 mechanisms of action in hematopoiesis.
picture about the general physiological role for the AP-                                  A wider Fos expression profile, not only in mesenchymal
1 transcriptional complex in cellular processes and in the                            cells but also in notochord and neural precursors of the
embryonic development. Based on the literature, it is quite                           sensory vesicle, indicates that Fos may have functions that
obvious that the abundance of different AP-1 members within                           are Jun/Atf/Maf-independent and suggests that it may form
given cell types, as well as cell lineages, differentiation stage,                    homodimers or heterodimers with other than AP-1 factors
microenvironment, and type of stimulus, has a large impact on                         (Szalóki et al., 2015).
how AP-1 modulates the determination of cells to proliferate,                             Although we still do not know which are the partners
differentiate, or die by apoptosis.                                                   of Fos in the notochord and its mechanism of action, our
   To better characterize in C. robusta the predicted paralogs of                     results after Jun and Fos ectopic expression in notochord
the AP-1 family members and their evolutionary relationships,                         cells evidenced that Fos and Jun alone can induce narrowed
we searched for sequence similarities in the NCBI and                                 alterations limited to single cells, while only the combined

Frontiers in Cell and Developmental Biology | www.frontiersin.org                11                                     August 2021 | Volume 9 | Article 709696
Marotta et al. The Ciona AP-1 Transcriptional Complex
presence of both factors induces structural disorganization we evidenced the presence of non-duplicated AP-1 gene
and severe impairment of cellular intercalation. This result is members and placed the foundations for understanding the
perfectly in agreement with the expression of Fos only in the complexity of the AP-1 transcriptional family during embryonic
initial differentiation of the notochord cells and evidenced how development in ascidians.
important is its downregulation so that correct intercalation can We contributed to understanding their potential function
occur. Further indirect evidence about the presence of AP-1 in controlling the correct structural organization of cells.
consensus motif in notochord cis-regulatory modules that are Full comprehension of Ciona AP-1 transcriptional complex
able to cooperate with Foxa2 in activating the expression of and of its role in mesenchyme differentiation and notochord
notochord-specific genes (José-Edwards et al., 2015) contributed intercalation could represent an important turning point to
to strengthening our conclusions. Our findings are in support understand their direct function in vertebrate erythropoiesis and
of a conserved and yet unexplored genetic program regulated notochord formation.
by Fos in notochord formation that additional information on Further comparative studies among ascidians and other
Ciona AP-1 mechanisms of action could help clarify. Similarly, chordates about AP-1 functional role in PCP movements
a fundamental role played by AP-1 complex was evidenced in could reveal interesting similarities as well as novel and
vertebrates for axial skeletogenesis, for proper histo-architecture significant differences in the mechanisms underlying chordate
of the epidermis, and for mesenchymal–epithelial cross-talk in axis elongation.
the skin (Angel and Szabowski, 2002; Behrens et al., 2003).
Interestingly, Jun/Fos-induced alterations in notochord cells
clearly resemble the phenotypes observed when the planar cell DATA AVAILABILITY STATEMENT
polarity (PCP) process is impaired. In vertebrates, the PCP
pathway is important for developmental processes in a number Publicly available datasets were analyzed in this study. This data
of organs and tissues as in the control of convergence and can be found here: http://www.aniseed.cnrs.fr/.
extension during gastrulation and in the control of the cell
behaviors that drive notochord intercalation (Wallingford et al.,
2000; Topczewski et al., 2001). Interfacing the results obtained in AUTHOR CONTRIBUTIONS
ascidians and vertebrates on the PCP pathway and its connection
with the AP-1 complex, interesting hypotheses of functional PM, FS, and FB did the molecular experiments. LA did
conservation can be applied. Key components mediating cell– the bioinformatics analyses. PM, FS, LA, and AL drafted
cell communication in the PCP vertebrate signaling pathway the manuscript and prepared the figures. AL supervised
include the Wnt non-canonical pathway, the transmembrane the experiments and edited and revised the manuscript.
protein Frizzled (Fz), and the cytoplasmic proteins Prickle (Pk) MC supervised the bioinformatics analyses and revised the
and Disheveled (Dsh), which culminate in the activation of c-Jun manuscript. All authors approved the manuscript for publication.
N-terminal kinase (JNK) and of the AP-1 complex to promote
actin cytoskeleton reorganization and cellular movements.
Comparatively, the ascidian Wnt5, Prickle, and Dsh mutants ACKNOWLEDGMENTS
result in loss of PCP signaling and of notochord cell intercalation
in the mediolateral axis (Keys et al., 2002; Jiang et al., 2005; We are grateful to Anna Di Gregorio for the Fos clone of
Niwano et al., 2009). In light of this conserved PCP pathway, the Gateway-compatible Unigene collection. Special thanks to
it will be highly interesting to investigate the involvement of Alessandro Amoroso for his help in construct preparation and
the AP-1 transcriptional complex in the ascidian PCP pathway transgenesis experiments. Our thanks to the RIMAR Department
and its role in axis elongation and cellular intercalation. To of the Stazione Zoologica Anton Dohrn and, in particular, to
this aim, it will be fundamental to identify the other putative the Molecular Biology and Sequencing and the Bioinformatics
AP-1 members responsible together with Fos for notochord Units for technical support; to the Confocal Microscopy and
correct development. Bioimaging Service; and to Alberto Macina, the Marine Biological
Resources and the IRM Units for animals fishing and husbandry.
CONCLUSION
SUPPLEMENTARY MATERIAL
The number of proteins forming the AP-1 complex and
their variable combination in specific tissues always strongly The Supplementary Material for this article can be found
impaired the ability to clarify their mechanism of action online at: https://www.frontiersin.org/articles/10.3389/fcell.2021.
during normal and neoplastic development. In this study, 709696/full#supplementary-material
REFERENCES relationships and specificities in gene annotations: an example for tomato and
grapevine. BMC Bioinformatics 19:435. doi: 10.1186/s12859-018-2420-y
Ambrosino, L., Ruggieri, V., Bostan, H., Miralto, M., Vitulo, N., Zouine, M., Amoutzias, G., Veron, A., Weiner, J., Robinson-Rechavi, M., Bornberg-Bauer, E.,
et al. (2018). Multilevel comparative bioinformatics to investigate evolutionary Oliver, S., et al. (2006). One billion years of bZIP transcription factor evolution:
Frontiers in Cell and Developmental Biology | www.frontiersin.org 12 August 2021 | Volume 9 | Article 709696Marotta et al. The Ciona AP-1 Transcriptional Complex
conservation and change in dimerization and DNA-binding site specificity. Mol. José-Edwards, D. S., Oda-Ishii, I., Kugler, J. E., Passamaneck, Y. J., Katikala, L.,
Biol. Evol. 24, 827–835. doi: 10.1093/molbev/msl211 Nibu, Y., et al. (2015). Brachyury, Foxa2 and the cis-regulatory origins of the
Angel, P., and Karin, M. (1991). The role of Jun, Fos and the AP-1 complex in notochord. PLoS Genet. 11:e1005730. doi: 10.1371/journal.pgen.1005730
cell-proliferation and transformation. BBA Rev. Cancer 1072, 129–157. doi: Karin, M., Liu, Z. G., and Zandi, E. (1997). AP-1 function and regulation. Curr.
10.1016/0304-419X(91)90011-9 Opin. Cell Biol. 9, 240–246. doi: 10.1016/S0955-0674(97)80068-3
Angel, P., and Szabowski, A. (2002). Function of AP-1 target genes in Katoh, K., and Standley, D. M. (2013). MAFFT multiple sequence alignment
mesenchymal-epithelial cross-talk in skin. Biochem. Pharmacol. 64, 949–956. software version 7: Improvements in performance and usability. Mol. Biol. Evol.
doi: 10.1016/S0006-2952(02)01158-9 30, 772–780. doi: 10.1093/molbev/mst010
Behrens, A., Haigh, J., Mechta-Grigoriou, F., Nagy, A., Yaniv, M., and Wagner, Kenner, L., Hoebertz, A., Beil, T., Keon, N., Karreth, F., Eferl, R., et al. (2004). Mice
E. F. (2003). Impaired intervertebral disc formation in the absence of Jun. lacking JunB are osteopenic due to cell-autonomous osteoblast and osteoclast
Development 130, 103–109. doi: 10.1242/dev.00186 defects. J. Cell Biol. 164, 613–623. doi: 10.1083/jcb.200308155
Brown, G. R., Hem, V., Katz, K. S., Ovetsky, M., Wallin, C., Ermolaeva, O., et al. Keys, D. N., Levine, M., Harland, R. M., and Wallingford, J. B. (2002). Control of
(2015). Gene: a gene-centered information resource at NCBI. Nucleic Acids Res. intercalation is cell-autonomous in the notochord of Ciona intestinalis. Dev.
43, D36–D42. doi: 10.1093/nar/gku1055 Biol. 246, 329–340. doi: 10.1006/dbio.2002.0656
Brozovic, M., Dantec, C., Dardaillon, J., Dauga, D., Faure, E., Gineste, M., et al. Klemm, J. D., Schreiber, S. L., and Crabtree, G. R. (1998). Dimerization as a
(2018). ANISEED 2017: Extending the integrated ascidian database to the regulatory mechanism in signal transduction. Annu. Rev. Immunol. 16, 569–
exploration and evolutionary comparison of genome-scale datasets. Nucleic 592. doi: 10.1146/annurev.immunol.16.1.569
Acids Res. 46, D718–D725. doi: 10.1093/nar/gkx1108 Kobayashi, K., Maeda, K., Tokuoka, M., Mochizuki, A., and Satou, Y. (2018).
Camacho, C., Coulouris, G., Avagyan, V., Ma, N., Papadopoulos, J., Bealer, K., et al. Controlling cell fate specification system by key genes determined from network
(2009). BLAST+: Architecture and applications. BMC Bioinformatics 10:4291. structure. Science 4, 281–293. doi: 10.1016/j.isci.2018.05.004
doi: 10.1186/1471-2105-10-421 Lee, C. R., Sakai, D., Nakai, T., Toyama, K., Mochida, J., Alini, M., et al. (2007). A
Cao, J., Spielmann, M., Qiu, X., Huang, X., Ibrahim, D. M., Hill, A. J., et al. (2019). phenotypic comparison of intervertebral disc and articular cartilage cells in the
The single-cell transcriptional landscape of mammalian organogenesis. Nature rat. Eur. Spine J. 16, 2174–2185. doi: 10.1007/s00586-007-0475-y
566, 496–502. doi: 10.1038/s41586-019-0969-x Lee, S. Y., Yoon, J., Lee, M. H., Jung, S. K., Kim, D. J., Bode, A. M., et al. (2012). The
Capella-Gutiérrez, S., Silla-Martínez, J. M., and Gabaldón, T. (2009). trimAl: a role of heterodimeric AP-1 protein comprised of JunD and c-Fos proteins in
tool for automated alignment trimming in large-scale phylogenetic analyses. hematopoiesis. J. Biol. Chem. 287, 31342–31348. doi: 10.1074/jbc.M112.387266
Bioinformatics 25, 1972–1973. doi: 10.1093/BIOINFORMATICS/BTP348 Letunic, I., and Bork, P. (2019). Interactive tree of life (iTOL) v4: recent updates
Christiaen, L., Wagner, E., Shi, W., and Levine, M. (2009). Whole-mount in situ and new developments. Nucleic Acids Res. 47, W256–W259. doi: 10.1093/nar/
hybridization on sea squirt (Ciona intestinalis) embryos. Cold Spring Harb. gkz239
Protoc. 4:db.rot5348. doi: 10.1101/pdb.prot5348 Levine, M., and Tjian, R. (2003). Transcription regulation and animal diversity.
Ciaccio, P. J., and Tew, K. D. (1994). cDNA and deduced amino acid sequences Nature 424, 147–151. doi: 10.1038/nature01763
of a human colon dihydrodiol dehydrogenase. BBA Bioenerg. 1186, 129–132. Li, P., Lahvic, J. L., Binder, V., Pugach, E. K., Riley, E. B., Tamplin, O. J., et al.
doi: 10.1016/0005-2728(94)90144-9 (2015). Epoxyeicosatrienoic acids enhance embryonic haematopoiesis and adult
Corbo, J. C., Levine, M., and Zeller, R. W. (1997). Characterization of a notochord- marrow engraftment. Nature 523, 468–471. doi: 10.1038/nature14569
specific enhancer from the Brachyury promoter region of the ascidian, Ciona Lichtinger, M., Ingram, R., Hannah, R., Müller, D., Clarke, D., Assi, S. A.,
intestinalis. Development 124, 589–602. doi: 10.1242/dev.124.3.589 et al. (2012). RUNX1 reshapes the epigenetic landscape at the onset of
D’Aniello, E., Pezzotti, M. R., Locascio, A., and Branno, M. (2011). Onecut is a haematopoiesis. EMBO J. 31, 4318–4333. doi: 10.1038/emboj.2012.275
direct neural-specific transcriptional activator of Rx in Ciona intestinalis. Dev. Liebermann, D. A., Gregory, B., and Huffman, B. (1998). AP-1 (Fos/Jun)
Biol. 355, 358–371. doi: 10.1016/j.ydbio.2011.05.584 transcription factors in hematopoietic differentiation and apoptosis (Review).
Eferl, R., Sibilia, M., Hilberg, F., Fuchsbichler, A., Kufferath, I., Guertl, B., et al. Int. J. Oncol. 12, 685–700. doi: 10.3892/ijo.12.3.685
(1999). Functions of c-Jun in liver and heart development. J. Cell Biol. 145, Locascio, A., Aniello, F., Amoroso, A., Manzanares, M., Krumlauf, R., and Branno,
1049–1061. doi: 10.1083/jcb.145.5.1049 M. (1999). Patterning the ascidian nervous system: structure, expression and
Goode, D. K., Obier, N., Vijayabaskar, M. S., Lie-A-Ling, M., Lilly, A. J., Hannah, transgenic analysis of the CiHox3 gene. Development 126, 4737–4748. doi:
R., et al. (2016). Dynamic gene regulatory networks drive hematopoietic 10.1242/dev.126.21.4737
specification and differentiation. Dev. Cell 36, 572–587. doi: 10.1016/j.devcel. Macera, M. J., Szabo, P., Wadgaonkar, R., Siddiqui, M. A. Q., and Verma, R. S.
2016.01.024 (1992). Localization of the gene coding for ventricular myosin regulatory light
Hagberg, A., Schult, D. A., and Swart, P. J. (2008). Exploring Network Structure, chain (MYL2) to human chromosome 12q23-q24.3. Genomics 13, 829–831.
Dynamics, and Function Using NetworkX. Available online at: http://conference. doi: 10.1016/0888-7543(92)90161-K
scipy.org/proceedings/SciPy2008/paper_2 (accessed March 25, 2021). Niwano, T., Takatori, N., Kumano, G., and Nishida, H. (2009). Wnt5 is required for
Hotta, K., Mitsuhara, K., Takahashi, H., Inaba, K., Oka, K., Gojobori, T., notochord cell intercalation in the ascidian Halocynthia roretzi. Biol. Cell 101,
et al. (2007). A web-based interactive developmental table for the Ascidian 645–659. doi: 10.1042/bc20090042
Ciona intestinalis, including 3D real-image embryo reconstructions: I. From O’Leary, N. A., Wright, M. W., Brister, J. R., Ciufo, S., Haddad, D., McVeigh, R.,
fertilized egg to hatching larva. Dev. Dyn. 236, 1790–1805. doi: 10.1002/dvdy.21 et al. (2016). Reference sequence (RefSeq) database at NCBI: current status,
188 taxonomic expansion, and functional annotation. Nucleic Acids Res. 44, D733–
Imai, K. S., Hino, K., Yagi, K., Satoh, N., and Satou, Y. (2004). Gene expression D745. doi: 10.1093/nar/gkv1189
profiles of transcription factors and signaling molecules in the ascidian embryo: Obier, N., Cauchy, P., Assi, S. A., Gilmour, J., Lie-A-Ling, M., Lichtinger, M.,
towards a comprehensive understanding of gene networks. Development 131, et al. (2016). STEM CELLS AND REGENERATION Cooperative binding of
4047–4058. doi: 10.1242/dev.01270 AP-1 and TEAD4 modulates the balance between vascular smooth muscle and
Jiang, D., Munro, E. M., and Smith, W. C. (2005). Ascidian prickle regulates both hemogenic cell fate. Development. 143, 4324–4340. doi: 10.1242/dev.139857
mediolateral and anterior-posterior cell polarity of notochord cells. Curr. Biol. Pereira, C. F., Chang, B., Qiu, J., Niu, X., Papatsenko, D., Hendry, C. E., et al.
15, 79–85. doi: 10.1016/j.cub.2004.12.041 (2013). Induction of a hemogenic program in mouse fibroblasts. Cell Stem Cell
Jones, P., Binns, D., Chang, H. Y., Fraser, M., Li, W., McAnulla, C., et al. (2014). 13, 205–218. doi: 10.1016/j.stem.2013.05.024
InterProScan 5: genome-scale protein function classification. Bioinformatics 30, Price, M. N., Dehal, P. S., and Arkin, A. P. (2010). FastTree 2 – approximately
1236–1240. doi: 10.1093/bioinformatics/btu031 maximum-likelihood trees for large alignments. PLoS One 5:e9490. doi: 10.
José-Edwards, D. S., Kerner, P., Kugler, J. E., Deng, W., Jiang, D., and Di Gregorio, 1371/JOURNAL.PONE.0009490
A. (2011). The identification of transcription factors expressed in the notochord Ranea, J. A. G., Grant, A., Thornton, J. M., and Orengo, C. A. (2005).
of Ciona intestinalis adds new potential players to the brachyury gene regulatory Microeconomic principles explain an optimal genome size in bacteria. Trends
network. Dev. Dyn. 240, 1793–1805. doi: 10.1002/dvdy.22719 Genet. 21, 21–25. doi: 10.1016/j.tig.2004.11.014
Frontiers in Cell and Developmental Biology | www.frontiersin.org 13 August 2021 | Volume 9 | Article 709696You can also read