Effect of Fecal Microbiota Transplantation Combined With Mediterranean Diet on Insulin Sensitivity in Subjects With Metabolic Syndrome - Frontiers
←
→
Page content transcription
If your browser does not render page correctly, please read the page content below
ORIGINAL RESEARCH
                                                                                                                                            published: 10 June 2021
                                                                                                                                   doi: 10.3389/fmicb.2021.662159

                                             Effect of Fecal Microbiota
                                             Transplantation Combined With
                                             Mediterranean Diet on Insulin
                                             Sensitivity in Subjects With
                                             Metabolic Syndrome
                                             Annefleur M. Koopen 1 , Eduardo L. Almeida 2 , Ilias Attaye 1 , Julia J. Witjes 1 ,
                                             Elena Rampanelli 1 , Soumia Majait 1 , Marleen Kemper 1 , Johannes H. M. Levels 1 ,
                                             Alinda W. M. Schimmel 1 , Hilde Herrema 1 , Torsten P. M. Scheithauer 1 , Werner Frei 2 ,
                                             Lars Dragsted 3 , Bolette Hartmann 4 , Jens J. Holst 4 , Paul W. O’Toole 2 , Albert K. Groen 1
                                             and Max Nieuwdorp 1,5*
                          Edited by:
                         Katia Sivieri,      1
                                              Department of Internal Medicine and (Experimental) Vascular Medicine, Amsterdam University Medical Center, Location
     São Paulo State University, Brazil      Academic Medical Center, Amsterdam, Netherlands, 2 APC Microbiome Ireland, School of Microbiology, University College
                       Reviewed by:          Cork, Cork, Ireland, 3 Department of Nutrition, Exercise and Sports, Faculty of Science, University of Copenhagen,
                 Elizabeth Hohmann,          Frederiksberg, Denmark, 4 Novo Nordisk Foundation Center for Basic Metabolic Research, Department of Biomedical
    Massachusetts General Hospital,          Sciences, University of Copenhagen, Copenhagen, Denmark, 5 Department of Internal Medicine, Diabetes Center,
                         United States       Amsterdam University Medical Center, Location VU University Medical Center, Amsterdam, Netherlands
                        Ellen E. Blaak,
    Maastricht University, Netherlands
                                             Background: Recent studies demonstrate that a Mediterranean diet has beneficial
                *Correspondence:
                   Max Nieuwdorp             metabolic effects in metabolic syndrome subjects. Since we have shown that fecal
     m.nieuwdorp@amsterdamumc.nl             microbiota transplantation (FMT) from lean donors exerts beneficial effects on insulin
                                             sensitivity, in the present trial, we investigated the potential synergistic effects on
                   Specialty section:
         This article was submitted to       insulin sensitivity of combining a Mediterranean diet with donor FMT in subjects with
                    Food Microbiology,       metabolic syndrome.
               a section of the journal
             Frontiers in Microbiology       Design: Twenty-four male subjects with metabolic syndrome were put on a
         Received: 31 January 2021           Mediterranean diet and after a 2-week run-in phase, the subjects were randomized
           Accepted: 29 April 2021
                                             to either lean donor (n = 12) or autologous (n = 12) FMT. Changes in the gut
          Published: 10 June 2021
                                             microbiota composition and bacterial strain engraftment after the 2-week dietary
                               Citation:
   Koopen AM, Almeida EL, Attaye I,          regimens and 6 weeks post-FMT were the primary endpoints. The secondary objectives
    Witjes JJ, Rampanelli E, Majait S,       were changes in glucose fluxes (both hepatic and peripheral insulin sensitivity),
               Kemper M, Levels JHM,
         Schimmel AWM, Herrema H,
                                             postprandial plasma incretin (GLP-1) levels, subcutaneous adipose tissue inflammation,
Scheithauer TPM, Frei W, Dragsted L,         and plasma metabolites.
  Hartmann B, Holst JJ, O’Toole PW,
  Groen AK and Nieuwdorp M (2021)            Results: Consumption of the Mediterranean diet resulted in a reduction in body weight,
              Effect of Fecal Microbiota     HOMA-IR, and lipid levels. However, no large synergistic effects of combining the diet
      Transplantation Combined With
         Mediterranean Diet on Insulin       with lean donor FMT were seen on the gut microbiota diversity after 6 weeks. Although
Sensitivity in Subjects With Metabolic       we did observe changes in specific bacterial species and plasma metabolites, no
                             Syndrome.
          Front. Microbiol. 12:662159.
                                             significant beneficial effects on glucose fluxes, postprandial incretins, or subcutaneous
    doi: 10.3389/fmicb.2021.662159           adipose tissue inflammation were detected.

Frontiers in Microbiology | www.frontiersin.org                                   1                                           June 2021 | Volume 12 | Article 662159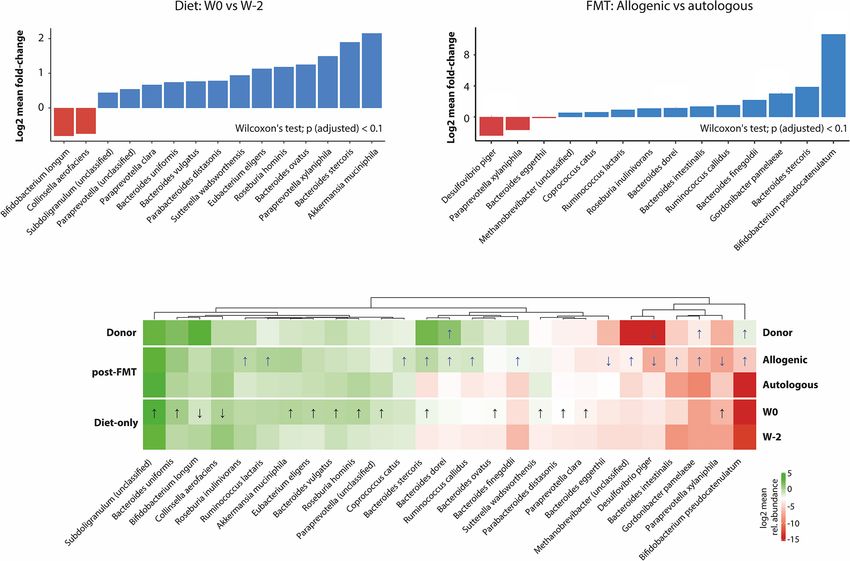
Koopen et al.                                                                                                        FMT Combined With Mediterranean Diet

                                             Conclusions: In this small pilot randomized controlled trial, no synergistic beneficial
                                             metabolic effects of combining a Mediterranean diet with lean donor FMT on glucose
                                             metabolism were achieved. However, we observed engraftment of specific bacterial
                                             species. Future trials are warranted to test the combination of other microbial
                                             interventions and diets in metabolic syndrome.
                                             Keywords: gut microbiota, fecal microbiota transplantation, mediterranean diet, metabolic syndrome, insulin
                                             sensitivity

INTRODUCTION                                                                      Ghosh et al., 2020). A recent randomized controlled trial
                                                                                  has investigated the effects of an 8-week adherence to a
With the continuous rise in obesity prevalence (NCD Risk                          Mediterranean diet in 82 obese subjects (Meslier et al., 2020).
Factor Collaboration, 2016a), the number of obese adults with                     In line with earlier studies, a beneficial effect on the plasma
metabolic syndrome and type 2 diabetes mellitus (DM2) has                         cholesterol levels was observed as well as a number of changes
quadrupled over the last decade (NCD Risk Factor Collaboration,                   in fecal microbiota, while the effect on insulin sensitivity was
2016b). The most important driver of metabolic syndrome is                        marginal. Although many studies have demonstrated that the
excess intestinal uptake of energy. Our gut microbiota is one                     type of diet has a great impact on the gut microbiota composition,
of the factors that play an important role in the regulation of                   none of these previous intervention studies combine modulation
energy harvest and storage, in which gut microbiota from obese                    of dietary intake with reestablishment of a healthy microbiome
subjects has been postulated to yield more energy from diet                       by means of lean donor FMT.
compared to gut microbiota from lean subjects (Bäckhed et al.,                        In the present study, we therefore hypothesized that a
2004; Turnbaugh et al., 2006). Colonization of germ-free mice                     Mediterranean diet may help beneficial microbes to better
with microbiota from obese littermates or obese humans has                        engraft, enabling long-term and greater effects after FMT.
been shown to cause an increase in body weight, demonstrating                     We thus performed lean healthy donor FMT preceded by a
that this obese phenotype is transmissible via fecal microbiota                   controlled Mediterranean diet and studied possible synergistic
transplantation (FMT) (Turnbaugh et al., 2006; Ridaura et al.,                    effects on the gut microbiota composition in subjects with
2013). In humans, several studies have demonstrated that the                      metabolic syndrome. Secondary objectives were intervention-
gut microbiota composition of healthy subjects differs from                       driven changes in both hepatic and peripheral insulin sensitivity,
that of subjects with metabolic syndrome and DM2 (Ley et al.,                     postprandial plasma concentrations of the incretin glucagon-
2006; Turnbaugh et al., 2006; Qin et al., 2012; Karlsson et al.,                  like peptide-1 (GLP-1), subcutaneous adipose tissue (AT)
2013; Castaner et al., 2018). Furthermore, we have previously                     inflammation, and plasma metabolites.
shown that transplantation of lean donor fecal microbiota can
transiently improve insulin sensitivity in obese subjects with
metabolic syndrome (Vrieze et al., 2012; Kootte et al., 2017).
In recent years, our group has also demonstrated that gut                         MATERIALS AND METHODS
microbiota diversity at baseline is an important determinant of
the engraftment of donor bacteria, which subsequently affects                     Study Population
the magnitude of metabolic response after FMT (Li et al., 2016;                   We recruited obese treatment-naive Caucasian male
Kootte et al., 2017).                                                             subjects (age, 21–65 years) with a body mass index (BMI)
   The composition of the gut microbiota is governed by a                         between 30 and 43 kg/m2 with otherwise normal health
complex interplay of many independent factors, such as exercise,                  via local newspaper advertisements. All subjects had to
concomitant medication use, aging, and diet (Dominguez-Bello                      meet the inclusion criteria of metabolic syndrome (Alberti
et al., 2010; Yatsunenko et al., 2012; Clarke et al., 2014; Falony                et al., 2006); requiring to meet at least three out of the
et al., 2016). Dietary composition and intake are considered                      following five criteria: fasting plasma glucose ≥ 5.6 mmol/L,
the most important contributing factors to the altered diversity                  triglycerides ≥ 1.7 mmol/L, waist circumference ≥ 102 cm,
of intestinal microbes (De Filippo et al., 2010; Gentile and                      high-density lipoprotein (HDL) cholesterol ≤ 1.04 mmol/L,
Weir, 2018). Indeed, prior data have clearly shown that the gut                   and/or blood pressure ≥ 130/85 mmHg. The main exclusion
microbiota rapidly changes after alterations in diet (David et al.,               criteria were the use of any type of medication, smoking, alcohol
2014; Zeevi et al., 2015), with an increase in gut microbiota                     abuse, a history of cardiovascular event or cholecystectomy, and
diversity upon a healthy (high-fiber) diet (Cotillard et al., 2013).              being unmotivated or unable to adhere to the diet. Moreover,
A Mediterranean diet is such a high-fiber diet that has been                      eligible FMT donors were healthy Caucasian men (age, 18–
associated with many beneficial health effects, such as reduced                   65 years) with a BMI between 18.5 and 25 kg/m2 . Donors
cardiovascular (Estruch et al., 2018) and DM2 risk (Salas-Salvadó                 were thoroughly screened as previously described (Kootte
et al., 2011; Haro et al., 2016). Also, beneficial changes in                     et al., 2017) for the presence of infectious diseases in blood
the microbiota composition after a Mediterranean diet have                        and feces and completed questionnaires regarding medical,
been reported (De Filippis et al., 2015; Haro et al., 2016;                       sexual, family and travel history, and bowel habits, as previously

Frontiers in Microbiology | www.frontiersin.org                               2                                      June 2021 | Volume 12 | Article 662159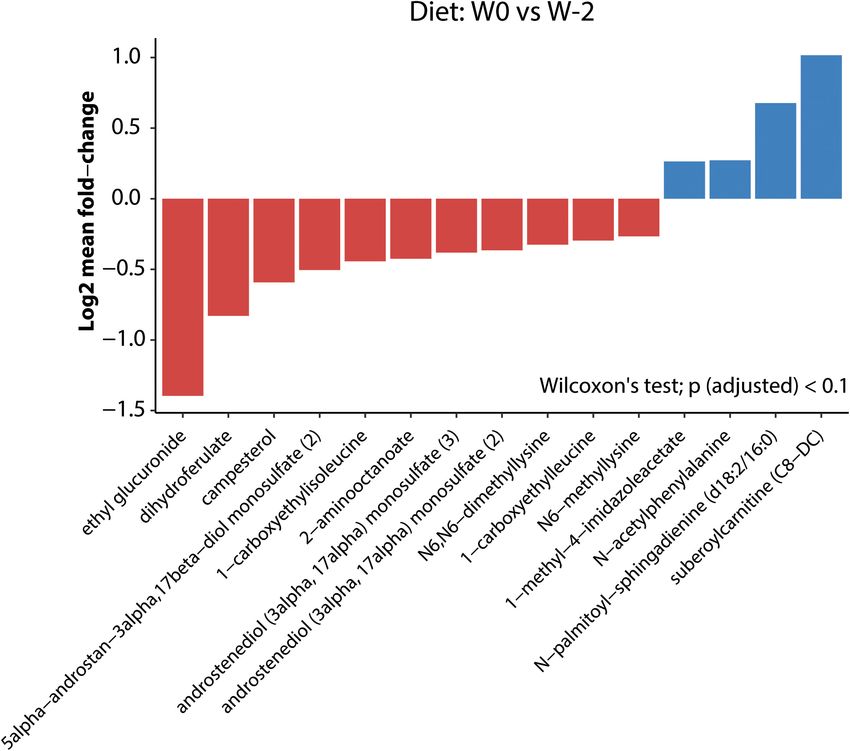
Koopen et al.                                                                                                           FMT Combined With Mediterranean Diet

described (Cammarota et al., 2017). Written informed consent                    All subjects visited the Amsterdam UMC clinical dietitian
was obtained from all subjects. The study was approved                       before they started the Mediterranean diet. During this intake,
by the local Institutional Review Board of the Amsterdam                     the subjects were counseled on the Mediterranean diet plus
University Medical Center (Amsterdam UMC) in Amsterdam,                      food boxes and received personal advice based on the online
the Netherlands, and conducted at the AMC in accordance with                 nutritional diary1 they completed beforehand. During the 2-week
the Declaration of Helsinki. The study was registered at the                 run-in period that followed, the decision was made whether a
Dutch Trial Register (NTR 5983).                                             subject could continue with the study based on motivation and
                                                                             adherence. During the diet phase, the subjects were asked to fill
Study Design                                                                 out the online food diary at three different time points for at least
The design of the study is presented in Figure 1. We conducted a             2 days (which were checked by the dietitian) and had telephone
double-blind randomized controlled single-center trial. All male             calls with the dietitian for at least two occasions and more if
metabolic syndrome subjects adhered to a Mediterranean diet                  necessary. The 3 days before the last visit, the subjects completed
for a total of 8 weeks with a 2-week run-in period (week −2                  the nutritional diary for a final time. From the online nutritional
to week 0). After these 2 weeks, the subjects were randomized                diary, the total energy, carbohydrate, protein, fiber, total fat, and
(using computerized randomization) to either an allogeneic FMT               saturated fat intakes were calculated for the pre-diet, during, and
(receiving the feces of a lean healthy donor) or autologous                  post-diet stages.
FMT (receiving their own feces). At weeks −2, 0, and 6 we
collected anthropomorphic data and blood and fecal samples.                  Mixed Meal Test
Three weeks after the FMT, we collected an additional fecal                  Mixed meal test (MMT) was performed at week 0 (study day 1)
sample, and at week 12 (6 weeks after cessation of the diet), the            and repeated at week 6. After an overnight fast, baseline blood
subjects visited our center for the last time to provide a final fecal       samples were drawn from an inserted intravenous catheter in a
sample. In week 0, we performed tests to determine postprandial              distal arm vein. Hereafter, the subjects immediately ingested a
lipid metabolism, subcutaneous adipose tissue inflammation, and              standardized liquid high-fat meal containing 626 kcal (61% fat,
insulin sensitivity, which we repeated at week 6. The sample size            33% carbohydrates, and 6% proteins) within 5 min, as previously
of n = 12 was based on data from our previous FMT clinical                   described (Reijnders et al., 2016; Kootte et al., 2017). For the next
trials in which absolute improvements in insulin sensitivity from            4 h, blood samples were drawn every 30 min for postprandial
26.2 to 45.3 µmol L−1 min−1 (Vrieze et al., 2012) and from 25.8              metabolism and were stored at −80◦ C. Before the start of the
to 28.8 µmol L−1 min−1 (Kootte et al., 2017) were observed                   MMT, abdominal subcutaneous adipose tissue was aspirated as
upon lean donor FMT.                                                         previously described (De Groot et al., 2019). All subjects provided
                                                                             a fecal sample for gut microbiota and short-chain fatty acid
Week −2: Start of Mediterranean Diet                                         (SCFA) analysis on this day or study day 2.
The Mediterranean diet guidelines used in this study were based
on the PREDIMED Study (Estruch et al., 2018), although adapted               Two-Step Hyperinsulinemic Euglycemic
slightly to Dutch settings in consultation with the clinical dietitian       Clamp
who was part of the research team. The diet contained the                    On the second study day of week 0 and week 6, a two-step
following components: two or more daily servings of vegetables,              hyperinsulinemic euglycemic clamp test with stable isotopes was
two or more daily servings of fresh fruits, three or more weekly             performed to measure hepatic and peripheral insulin sensitivity,
servings of legumes, two or more weekly servings of fish or                  as described previously (Vrieze et al., 2012; Kootte et al., 2017).
seafood, abundant use of olive oil for cooking and dressing dishes,          After an overnight fast, intravenous catheters were inserted into
and daily consumption of nuts. Negative recommendations                      a distal vein of both arms. One catheter was used for arterialized
were given about red meat, cream, butter, carbonated and/or                  venous blood withdrawal using a heated-hand box (60◦ C); the
sugared beverages, and pastries and industrial bakery products               other catheter was used for infusion of the glucose tracer, glucose,
(see Supplementary File 1). To enhance adherence to the                      and insulin. Prior to infusion, baseline blood samples were
Mediterranean diet, the subjects were provided food boxes                    drawn to determine background isotope enrichment. Hereafter, a
developed in collaboration with a Dutch food box company                     continuous infusion of [6,6-2 H2 ] glucose (prime, 11 µmol kg−1 ;
(de Krat, Amsterdam, Netherlands). The boxes were suited                     continuous, 0.11 µmol kg−1 min−1 ) was started and continued
for two adults so that meals for partners did not have to be                 until the end of the experiment. After blood withdrawal at 2 h
prepared separately, thereby facilitating compliance. The food               of equilibration, infusion of insulin (Actrapid; Novo Nordisk
boxes contained all the ingredients for five main meals, five                Farma B.V., Alphen aan den Rijn, Netherlands) at a rate of
times lunch, and extra supplementation of fruit, extra virgin olive          20 mU m−2 min−1 was started. Plasma glucose concentrations
oil (one bottle of 500 ml per week), and raw unsalted mixed                  were measured every 10 min and infusion of a 20% glucose
nuts (500 g per week). The recipes and contents of the boxes                 solution enriched with 1% [6,6-2 H2 ] glucose was started to
met our Mediterranean guidelines and were all checked by the                 maintain a plasma glucose concentration of 5 mmol/L. After
clinical dietitian. For the remaining 2 days of the week, subjects           2 h of insulin infusion, five repetitive blood samples were drawn
could prepare their own food, provided that they adhered to the              with an interval of 5 min to determine glucose enrichments,
Mediterranean guidelines provided by the dietitian. The same
held true for breakfast and any snacks.                                      1
                                                                                 https://mijn.voedingscentrum.nl/nl/eetmeter/

Frontiers in Microbiology | www.frontiersin.org                          3                                              June 2021 | Volume 12 | Article 662159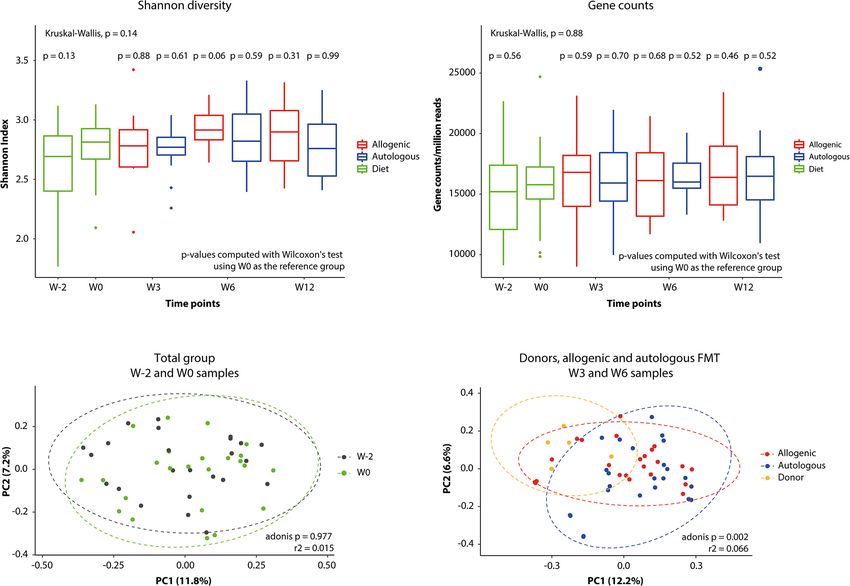
Koopen et al.                                                                                                                    FMT Combined With Mediterranean Diet

  FIGURE 1 | Study design. Overview of the study. All subjects adhered to the Mediterranean diet for 8 weeks (from W–2 to W6). After 2 weeks (W0), the subjects
  were randomized to autologous or allogeneic fecal microbiota transplantation. Before the start of the diet (W–2), the first fecal and blood samples were collected. At
  W0 (before fecal microbiota transplantation, FMT) and W6, we performed a mixed meal test, hyperinsulinemic euglycemic clamp, and a subcutaneous tissue biopsy.

glucoregulatory hormones, and free fatty acids. Hereafter, the                          protein lateral stalk, subunit P0). The primers for IL-10,
insulin infusion rate was increased to 60 mU m−2 min−1 and                              CCL2, CD68, CD11c, IRS1, TNF, and IL-6 are presented in
continued for another 2 h, after which five repetitive blood                            Supplementary Table 1.
samples were drawn again. Plasma samples were stored at
−80◦ C for later analyses. Resting energy expenditure (REE)                             Fecal Microbiota Transplantation
was measured using indirect calorimetry during the basal and                            Fecal microbiota transplantation was performed on the third
hyperinsulinemic state. Oxygen and carbon dioxide productions                           study day of week 0. Gastroduodenoscopy and the positioning of
were measured for 20 min using a ventilated hood system (Vmax                           the nasoduodenal tube and FMT on the third day of the first week
Encore 29; SensorMedics, Anaheim, CA, United States).                                   were all performed as described previously (Kootte et al., 2017).
                                                                                        Via gastroduodenoscopy, a nasoduodenal tube was placed and its
                                                                                        position was checked by an abdominal X-ray. Hereafter, bowel
Gene Expression of Subcutaneous                                                         lavage was started with infusion of (usually 2–3 L) dissolved
Tissue Biopsy                                                                           macrogol/electrolytes (Klean-Prep) through the nasoduodenal
At both week 0 and week 6, abdominal subcutaneous adipose                               tube to clean the intestines of fecal material. At this point, the
tissue was aspirated using a hollow needle and a 50-ml syringe.                         subject was randomized in a double-blinded fashion to receive
TriPure Isolation Reagent was used to isolate RNA according                             either the feces from the assigned lean donor (allogeneic FMT)
to the protocol of the manufacturer (Roche, Mannheim,                                   or his own feces (autologous FMT), both delivered as fresh fecal
Germany). SensiFAST cDNA Synthesis Kit (Bioline, London,                                sample the same morning. An independent colleague with access
United Kingdom) was used to prepare complementary DNA                                   to the randomization list made sure that the researcher used the
(cDNA) and SensiFAST SYBR No-ROX Kit (Bioline, London,                                  (blinded) container with the assigned feces. The feces was mixed
United Kingdom) was used to measure mRNA expression.                                    with a saline solution (0.9% NaCl) until fully homogenized and
The expression levels were normalized to RPLP0 (ribosomal                               sieved to remove all debris. The obtained homogenous solution

Frontiers in Microbiology | www.frontiersin.org                                     4                                             June 2021 | Volume 12 | Article 662159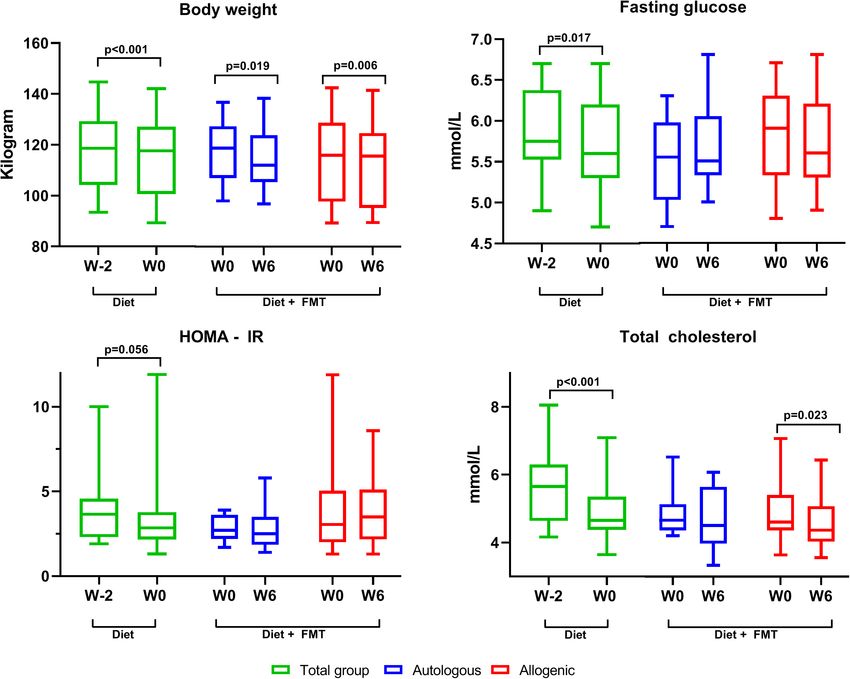
Koopen et al.                                                                                               FMT Combined With Mediterranean Diet

was subsequently stored in a sterile 500-ml bottle. After complete        Fecal Short-Chain Fatty Acid and Bile
bowel lavage, 500 ml of the dissolved fecal content was infused via       Acid Measurements
the nasoduodenal tube. All procedures (MMT, hyperinsulinemic
                                                                          Fecal SCFA levels were measured using high-performance liquid
clamp test, and subcutaneous tissue biopsy) were performed at
                                                                          chromatography (HPLC) with UV detection according to the
both week 0 and week 6, with the exception of the FMT.
                                                                          method of De Baere (De Baere et al., 2013). In addition, for all
                                                                          samples, the dry weights were determined after freeze drying a
Gut Microbiota Sequencing Analysis                                        homogenized fecal aliquot for 24 h. The SCFA measurements
DNA Extraction                                                            were corrected for the difference in the wet and dry weights
Genomic DNA was extracted from 0.25 g of fecal samples using              for each sample. We also measured the concentrations of seven
the repeat bead beating (RBB) method of Yu and Morrison2 ,                bile acids and the neutral sterols cholesterol, dihydrocholesterol,
with the following modifications. Three types of sterile zirconia         and coprostanol in the stool samples, as previously described
beads (Thistle Scientific, Glasgow, United Kingdom) were used             (Jakulj et al., 2016).
(0.5 g in total; one 3.0-mm bead, 0.1 g of 0.5-mm beads,
and 0.3 g of 0.1-mm beads). Fecal samples were homogenized                Plasma Metabolites and GLP1 Levels
three times for 60 s at maximum speed on a Mini-Beadbeater-               Untargeted metabolomics profiling was performed by Metabolon
24TM (Thistle Scientific, Glasgow, United Kingdom), with the              (Durham, NC, United States) using ultra high-performance
samples cooled on ice for 60 s in between bead-beating cycles.            liquid chromatography coupled to tandem mass spectrometry
The supernatants of two bead-beating rounds were pooled                   (UPLC-MS/MS), as previously described (Koh et al., 2018). This
and incubated with 350 µl of 7.5 M ammonium acetate                       resulted in 756 annotated plasma metabolites. Raw data were
(Sigma, St. Louis, MO, United States) on ice. The extraction              normalized and subsequently rescaled to set the median equal
proceeded as per the RBB protocol using Qiagen’s DNeasy          R

                                                                          to 1. Missing values, mainly caused by measurements below the
Blood & Tissue Kit (Qiagen, West Sussex, United Kingdom)                  detection limits, were imputed. With regard to plasma GLP-1, the
according to the manufacturer’s instructions for the final                concentrations were determined in postprandial samples in the
DNA purification (without the lysis steps and eluted in                   first 2 h of the mixed meal test (at 0, 30, and 120 min). The levels
100 µl of AE buffer).                                                     of total GLP-1 were measured by Holst group with ELISA (cat
                                                                          no. 10-1278-01; Mercodia, Sweden). All quality controls provided
DNA Library Preparation                                                   by the manufacturer were within the allowed limits. All samples
Genomic DNA was quantified using the Qubit dsDNA                          from the same individual were measured in the same assay run.
high-sensitivity assay kit (Invitrogen – Carlsbad, California,
United States). Samples were prepared for shotgun metagenomic
                                                                          Statistical Analysis
sequencing using the Illumina Nextera XT library preparation kit
                                                                          The clinical parameters measured were not normally distributed
and following the manufacturer’s instructions. Unique Nextera
                                                                          and are thus presented as medians and interquartile ranges.
XT 8-nt dual indices were used for multiplexing (Illumina,
                                                                          Non-parametric tests were used for statistical testing: Wilcoxon
San Diego, CA, United States). Libraries were pooled to an
                                                                          signed-rank test was used for within-group comparisons and the
equimolar concentration and sequenced by Edinburgh Genomics
                                                                          Mann–Whitney U test was used for between-group comparisons.
(Edinburgh, United Kingdom) using a 2 × 150-bp paired-end
                                                                          Postprandial results are described as incremental area under the
method on an Illumina NovaSeq 6000 platform and aiming to
                                                                          curves (iAUC). Statistical analyses were performed using SPSS
achieve ∼4–5 Gbp of sequencing data per sample.
                                                                          Statistics software, version 25. P-values < 0.05 were considered
   The raw reads were initially processed using the KneadData
                                                                          statistically significant.
tool (version 0.7.23 ) for read quality trimming, filtering,
                                                                             Statistical analyses of the microbiome and metabolome
and also the removal of potential contaminant reads with
                                                                          data were performed in R (R Core Team, 2020) using the
the recommended settings. Microbial community composition
                                                                          RStudio IDE (R Studio Team, 2020). Statistically significant
profiling was performed using the MetaPhlAn 2.0 pipeline
                                                                          differences between multiple groups were computed employing
(Truong et al., 2015), while the HUMAnN 2.0 pipeline (Franzosa
                                                                          the non-parametric Kruskal–Wallis’ test, with pairwise
et al., 2018) was employed for functional profiling and, more
                                                                          comparisons performed using the Wilcoxon’s test, using
specifically, for gene count determination. The resulting data
                                                                          the ggpubr package (version 0.4.0) (Kassambara, 2020). Multiple
from these pipelines were processed using R (version 4.0.2)
                                                                          hypothesis testing p-values were adjusted for false discovery
(R Core Team, 2020) in the RStudio IDE (version 1.3.1093)
                                                                          rate using the Benjamini and Hochberg method, as indicated.
(R Studio Team, 2020). Alpha diversity indices were computed
                                                                          Principal coordinates analysis plots were computed using
using the phyloseq (version 1.34.0) (McMurdie and Holmes,
                                                                          the ade4 package (version 1.7–16) (Thioulouse et al., 2018),
2013) and vegan (version 2.5–6) (Oksanen et al., 2017) packages,
                                                                          and statistically significant differences between groups were
and beta diversity was computed using Spearman’s distances
                                                                          determined employing permutational multivariate analysis
between samples.
                                                                          of variance (MANOVA) via the adonis function from the
                                                                          vegan package (Oksanen et al., 2017). Unless indicated
2
    https://doi.org/10.2144/04365ST04                                     otherwise, p-values < 0.05 were considered statistically
3
    https://github.com/biobakery/kneaddata                                significant. Plots were generated in R using the ggplot2

Frontiers in Microbiology | www.frontiersin.org                       5                                      June 2021 | Volume 12 | Article 662159
Koopen et al. FMT Combined With Mediterranean Diet
(version 3.3.2) (Wickham, 2016), ggpubr (Kassambara, 2020), The decrease in protein intake was not significant [from 90 (73–
and ComplexHeatmap (version 2.6.0) (Gu et al., 2016) packages. 115) to 81 g (75–94), p = 0.12] (Supplementary Table 2). When
the subjects who were later randomized to the allogeneic FMT
were compared with those in the autologous FMT group, no
RESULTS differences in the Mediterranean diet-induced changes in energy,
fat, saturated fat, carbohydrate, and fiber intakes were observed.
We included a total of 28 male metabolic syndrome subjects With regard to any effect on the gut microbiota composition
from November 2016 until September 2018, of whom four were due to the Mediterranean diet, the values for alpha diversity
excluded due to technical difficulties with clinical measurements (Shannon index) and gene counts are presented in Figures 3A,B.
(two subjects), non-compliance to the Mediterranean diet (one No effect of the Mediterranean diet on microbiota Shannon
subject), and withdrawal because of personal reasons before the diversity or metagenome gene count was detectable over the 2-
start of the diet (one subject). The baseline characteristics of week period from the start of the Mediterranean diet for the
the 24 randomized patients are presented in Table 1. There whole group (W−2 to W0, p = 0.12 and p = 0.56, respectively).
were no significant differences in baseline characteristics between Furthermore, no clear shift in the overall microbiome relatedness
subjects who later received an autologous or allogeneic FMT (beta diversity) was observed upon the Mediterranean diet (W−2
(Table 1). Moreover, we included five healthy subjects who served to W0; Figure 3C). Following FMT, however, we did observe a
as FMT donors in multiple metabolic syndrome subjects, with clustering according to the source of FMT (Figure 3D).
eventually a range of one to four recipients of allogeneic FMT Although we did not observe great changes in the overall
per single donor. microbial species richness and composition after 2 weeks
of Mediterranean diet, subsequent gut microbiota analysis
Adherence to Mediterranean Diet and demonstrated marked changes in fecal abundance of several
Effects on Gut Microbiota Composition species 2 weeks after the start of the Mediterranean diet
Macronutrient intake before, during, and after the Mediterranean (Figure 4A). Adherence to the Mediterranean diet resulted in
diet period were extracted from the self-reported online an increased abundance of several species, including Bacteroides
nutritional diaries (Figure 2 and Supplementary Table 2). The species, Akkermansia muciniphila, and SCFA butyrate-producing
total energy intake of the whole group during the first 2 weeks Roseburia hominis, as well as a reduced fecal abundance of
on Mediterranean diet was significantly reduced compared to Collinsella aerofaciens.
that of the habitual diet [from 2,193 (1,734–2,644) to 1,820 kcal Following allogeneic FMT (from W0 to W6), we observed
(1,602–2,009) daily, p = 0.01]. During the diet phase, the subjects in the recipient fecal microbiota an increase in several bacterial
consumed significantly less saturated fat [from 28 (19–39) to species, which were also present in the healthy donor microbiota
20 g (17–23), p = 0.01], with an unchanged total fat intake (Figure 4C). Moreover, a significant differential enrichment
[from 85 (68–109) to 81 g (66–100), p = 0.67]. The subjects in the gut microbial species was detected between the group
also significantly reduced their total amount of carbohydrates receiving autologous FMT or allogeneic donor FMT, with the
[from 216 (167–272) to 158 g (148–191), p = 0.01], but increased donor-derived microbiota being enriched in Bifidobacterium
their fiber intake [from 20 (17–25) to 24 g (23–28), p = 0.01]. pseudocatenulatum, Gordonibacter pamelaeae, and Bacteroides
TABLE 1 | Baseline characteristics at week−2 for the study subjects and separated by fecal microbiota transplantation (FMT) group.
Total group (n = 24) Autologous (n = 12) Allogeneic (n = 12)
Male gender (%) 100 100 100
Age (years) 51.5 (47–58.8) 52.5 (47.3–54.8) 50.5 (46.3–60.0)
Weight (kg) 118.7 (104.2–129.3) 119.6 (108.9–129.3) 116.2 (100.2–129.4)
BMI (kg/m2 ) 34.0 (31.8–37.3) 35.4 (32.7–40.0) 33.06 (30.8–37.2)
Waist circumference (cm) 120 (113–131) 121.5 (112.3–129.5) 118 (111.8–132.5)
Blood pressure: systolic (mmHg) 150 (138–89) 152 (144–172) 147 (132–156)
Blood pressure: diastolic (mmHg) 93 (89–105) 96 (91–110) 91 (84–102)
Fasting glucose (mmol/L) 5.8 (5.5–6.4) 5.90 (5.53–6.36) 5.75 (5.53–6.53)
Insulin (pmol/L) 102 (62–124) 104 (67.2–120.8) 91 (53.1–192.2)
HOMA-IR 3.7 (2.3–4.6) 3.65 (2.63–4.48) 3.55 (2.20–7.23)
HbA1c (mmol/mol) 40 (36–41) 39.5 (37–40) 40 (36–41)
Cholesterol: total (mmol/L) 5.7 (4.6–6.3) 5.97 (4.80–6.36) 5.16 (4.59–6.24)
Cholesterol: HDL (mmol/L) 1.3 (1.1–1.5) 1.28 (0.97–1.52) 1.32 (1.10–1.45)
Cholesterol: LDL (mmol/L) 3.6 (2.9–4.2) 4.08 (2.69–4.48) 3.12 (2.92–4.12)
Cholesterol: triglycerides (mmol/L) 1.3 (1.0–1.8) 1.35 (1.15–2.12) 1.32 (1.01–1.77)
Data are expressed as medians and interquartile ranges. There were no statistically significant differences in the baseline characteristic between subjects who later
received an autologous or allogeneic FMT.
Frontiers in Microbiology | www.frontiersin.org 6 June 2021 | Volume 12 | Article 662159Koopen et al. FMT Combined With Mediterranean Diet
FIGURE 2 | Changes in macronutrient intake following the Mediterranean diet. Changes in the daily macronutrient intake comparing the habitual diet (PRE) to the
Mediterranean diet (DIET). For comparison, a paired Wilcoxon signed-rank test was used. Only statistically significant p-values are shown. Box and whisker,
min–max.
dorei and deprived in Desulfovibrio piger with respect to both allogeneic and autologous FMT (8 weeks after starting the
autologous microbiota (Figures 4B,C). diet; Table 2).
Lastly, as low-grade systemic inflammation is an important
pathologic feature of insulin resistance and adiposity, we
Effect of Combining FMT With examined the impact of FMT on inflammation at the systemic
Mediterranean Diet on Metabolic (plasma) and local (subcutaneous adipose tissue biopsies)
Parameters levels. Independently of the source, FMT did not lead to
alterations in circulating C-reactive protein (CRP) and leukocyte
Changes in the metabolic parameters caused by the
count (Table 2), nor did it affect the expressions of the
Mediterranean diet alone (from W−2 to W0) and, subsequently,
inflammatory genes (IL6, IL10, CD68, CCL2, IRS1, CD11c, and
the addition of the FMT (from W0 to W6) are presented in
TNFA) within subcutaneous AT (Supplementary Table 1 and
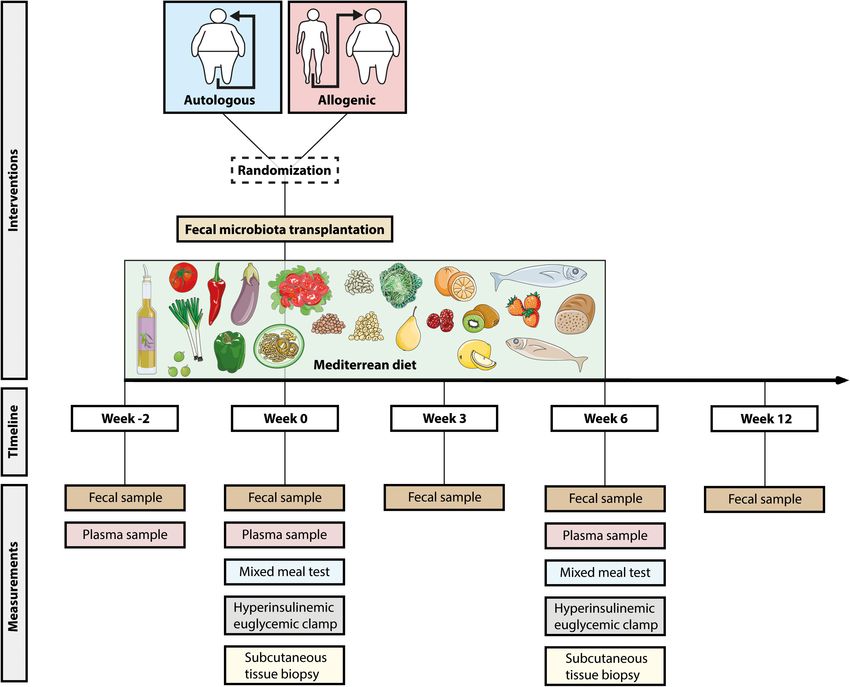
Table 2, with a subset of markers visualized in Figure 5. In
Supplementary Figure 1).
the first 2 weeks of the diet, before the FMT, the body weight
of the subjects significantly decreased [118.7 kg (104.2–129.3)
at baseline vs. 117.7 kg (100.6–127.1) after a 2-week diet, Effect of FMT on Insulin Sensitivity and Postprandial
p < 0.001]. Likewise, we found a significant reduction in the Metabolism
fasting blood glucose level [from 5.8 (5.5–6.4) to 5.6 mmol/L Next, we evaluated the impact of FMT interventions on
(5.3–6.2), p = 0.02], a numeric, but non-significant, decrease peripheral and hepatic insulin sensitivity. Peripheral insulin
in the fasting insulin levels [from 102 (62–124) to 83 (57–107), sensitivity, assessed as the insulin-induced glucose disposal rate
p = 0.25], and a borderline significant decrease in homeostatic (Rd ), was unaltered after either autologous or donor FMT
model assessment of insulin resistance (HOMA-IR) [from 3.7 (Supplementary Figure 2A): autologous Rd from 39.7 (33.2–
(2.3–4.6) to 2.8 (2.2–3.8), p = 0.056]. Moreover, total cholesterol, 53.1) to 44.4 µmol kg−1 min−1 (32.4–56.2, p = 0.88); allogeneic
high-density lipoprotein (HDL) cholesterol, and low-density Rd from 41.0 (24.0–48.3) to 41.7 µmol kg−1 min−1 (34.8–
lipoprotein (LDL) cholesterol were all significantly reduced 49.5, p = 0.48). Similarly, hepatic insulin sensitivity measured as
after 2 weeks of Mediterranean diet intake. Similarly, dietary insulin-mediated suppression of endogenous glucose production
intervention diminished the total leukocyte counts and the (EGP) did not change after autologous [from 72.9% (61.7–
systemic liver injury markers gamma-glutamyl transferase 81.4) to 65.2% (43.3–85.2, p = 0.35)] or allogeneic FMT
(GGT) and alkaline phosphatase (AP). After randomization [from 70.1% (62.9–75.4) to 67.2% (43.0–84.00, p = 0.53)]
to either an autologous or allogeneic FMT (from W0 to W6), (Supplementary Figure 2B).
both groups continued losing a significant amount of weight. We further performed correlation analysis to study the link
The glucose levels remained stable, as well as the insulin levels between the FMT-induced changes in metabolic markers (weight,
and HOMA-IR. There was a small but statistically significant cholesterol levels, HOMA-IR, fasting blood glucose, and Rd ) and
reduction in glycated hemoglobin HbA1c in the 6 weeks after the Bray–Curtis distance, a measure of microbiome dissimilarity
Frontiers in Microbiology | www.frontiersin.org 7 June 2021 | Volume 12 | Article 662159Koopen et al. FMT Combined With Mediterranean Diet
0.01
0.40
0.72
0.39
0.01
0.02
0.53
0.06
0.31
0.37
0.28
0.15
0.08
0.03
0.02
Effect of Mediterranean diet only (W−2 vs. W0, whole group) and with the addition of fecal microbiota transplantation (FMT) (W0 vs. W6, split into autologous FMT and allogeneic FMT). There were no significant
(from W0 to W6). We found a positive correlation between
p
the Bray–Curtis distances and the changes in Rd in only the
allogeneic FMT group (ρ = 0.622, p = 0.03; Supplementary
114.5 (95.1–124.4)
Figure 3), whereas no other significant correlations were
100 (57–149)
5.6 (5.3–6.2)
3.5 (2.2–5.1)
4.4 (4.0–5.1)
1.1 (0.9–1.3)
2.9 (2.4–3.4)
1.1 (0.8–1.3)
3.5 (1.1–6.0)
6.7 (4.7–8.7)
W6 (n = 12)
37 (36–40)
73 (62–84)
44 (25–60)
25 (23–26)
32 (20–44)
noted between variations in the metabolic markers and
Diet + allogeneic FMT
microbiota diversity.
Finally, we did not observe differences in the postprandial
triglyceride and GLP1 levels between week 0 and week 6 in either
the autologous or the allogeneic FMT group, measured during a
2-h mixed meal test (Supplementary Figures 4, 5).
115.8 (97.6–128.5)
5.9 (5.3–6.3)
3.0 (2.0–5.0)
4.6 (4.4–5.4)
1.1 (1.0–1.2)
3.0 (2.4–3.6)
1.2 (1.0–1.6)
2.7 (1.7–5.9)
6.5 (4.2–7.9)
W0 (n = 12)
86 (50–140)
40 (38–42)
73 (58–78)
49 (29–75)
27 (23–32)
37 (23–46)
Effect of Treatments on Fecal Bile Acids and
Short-Chain Fatty Acids
To measure fecal cholesterol elimination, the cholesterol and
bile acid levels were assessed in 24-h fecal samples at week −2,
week 0, and week 6 (Supplementary Table 3). After 2 weeks
0.01
0.62
0.46
0.64
0.01
0.50
0.43
0.07
0.66
0.25
0.06
0.24
0.86
0.02
0.2
p
of Mediterranean diet, we observed a substantial reduction
in the 24-h fecal excretion levels of cholesterol (p < 0.001),
dihydrocholesterol (p < 0.001), and coprostanol (p = 0.01; from
111.9 (105.3–123.7)
differences in any of the parameters between the autologous and allogeneic FMT groups. Significant differences (p < 0.05) emphazised in bold. W−2 to W0) (Supplementary Figure 6). However, neither form
5.5 (5.3–6.1)
2.5 (1.9–3.5)
4.5 (4.0–5.7)
1.2 (0.9–1.4)
3.1 (2.2–3.8)
0.9 (0.8–1.5)
2.5 (1.9–3.9)
5.5 (4.7–6.3)
W6 (n = 12)
69 (61–98)
36 (34–38)
74 (63–88)
27 (19–42)
26 (22–31)
30 (23–33)
Diet + autologous FMT
of FMT (autologous or allogeneic) induced further reductions
(from W0 to W6) (Supplementary Table 3). Furthermore, no
significant changes were detected in the fecal concentrations of
SCFA acetate, propionate, and butyrate at any of the three time
points (Supplementary Table 3).
118.6 (106.9–127.1)
Impact of Mediterranean Diet and FMT
5.6 (5.0–6.0)
2.7 (2.2–3.6)
4.7 (4.4–5.2)
1.1 (0.9–1.4)
3.1 (2.5–3.5)
1.3 (1.0–1.6)
2.6 (1.6–3.8)
6.2 (4.9–7.2)
W0 (n = 12)
81 (61–97)
38 (36–39)
74 (65–91)
30 (22–41)
26 (24–31)
33 (27–26)
Interventions on Plasma Metabolome
The Mediterranean diet induced significant changes in the
levels of several fasting plasma metabolites (from W−2 to W0;
Figure 6). For example, acetylphenylalanine, N-palmitoyl-
sphingoadenine, and suberoylcarnitine were significantly
0.01
0.02
0.05
0.01
0.01
0.01
0.96
0.01
0.01
0.01
0.16
0.28
0.2
0.2
0.5
p
increased after 2 weeks of Mediterranean diet. In contrast, ethyl
glucuronide, a metabolite of ethanol, was decreased. It is not clear
117.7 (100.6–127.1)
whether this ethanol may be of endogenous (microbial) source.
5.6 (5.3–6.2)
2.8 (2.2–3.8)
4.7 (4.4–5.4)
1.1 (1.0–1.2)
3.0 (2.5–3.6)
1.2 (1.0–1.6)
2.6 (1.6–4.0)
6.3 (4.7–7.3)
Interestingly, the plant sterol campesterol, as well as derivatives
W0 (n = 24)
83 (57–107)
39 (37–40)
74 (63–84)
37 (27–55)
26 (24–31)
33 (27–43)
TABLE 2 | Clinical parameters expressed as medians and interquartile ranges.
of plasma amino acid metabolites lysine, leucine, and isoleucine
were decreased upon Mediterranean diet. However, treatment
Diet only
with either autologous or allogeneic donor FMT did not
differentially affect the overall plasma metabolite composition
(Supplementary Figure 7). In contrast to the donor bacterial
118.7 (104.2–129.3)
strain engraftment, we did not see that specific metabolites were
W−2 (n = 24)
102 (62–124)
5.8 (5.5–6.4)
3.7 (2.3–4.6)
5.7 (4.6–6.3)
1.3 (1.1–1.5)
3.6 (2.9–4.2)
1.3 (1.0–1.8)
2.2 (1.2–5.3)
6.8 (5.5–7.6)
40 (36–41)
75 (68–96)
38 (34–61)
25 (21–28)
32 (22–39)
transferred by the donor FMT, nor did we observe significant
differences in the plasma metabolite levels at W6 between the
autologous and allogeneic FMT groups (data not shown).
DISCUSSION
Cholesterol: triglycerides (mmol/L)
In this double-blind randomized trial, we investigated the
Cholesterol: HDL (mmol/L)
Cholesterol: total (mmol/L)
Cholesterol: LDL (mmol/L)
potential synergistic effects of combining a Mediterranean diet
Fasting glucose (mmol/L)
with lean donor FMT on the gut microbiota composition,
Leukocytes (109 /L)
HbA1c (mmol/mol)
hepatic and peripheral insulin sensitivity, and plasma metabolites
Insulin (pmol/L)
in treatment-naive obese subjects with metabolic syndrome.
CRP (mg/L)
Weight (kg)
ASAT (U/L)
ALAT (U/L)
y-GT (U/L)
We confirm that a Mediterranean diet per se has a beneficial
HOMA-IR
AP (U/L)
effect on metabolic parameters and results in increased relative
abundances of several beneficial bacterial strains including
Frontiers in Microbiology | www.frontiersin.org 8 June 2021 | Volume 12 | Article 662159Koopen et al. FMT Combined With Mediterranean Diet
FIGURE 3 | Changes in gut microbiota global measures. Differences in fecal microbiota alpha diversity. (A) Shannon index values. (B) Normalized gene counts of
bacterial species. (C,D) Principal coordinates analysis (PCoA) plots graphically representing the microbiota compositional changes after (C) Mediterranean diet (from
W–2 to W0) and after (D) fecal microbiota transplantation (FMT) on top of the Mediterranean diet.
A. muciniphila. The combination of this diet with lean donor of healthy donor-derived bacterial strains, including increased
FMT seemingly resulted in the engraftment of some specific FMT B. pseudocatenulatum and G. pamelaeae as well as B. dorei, which
donor-derived bacterial species, including Bifidobacterium and are all linked to anti-inflammatory and beneficial metabolic
Bacteroides (primary endpoint), yet failed to improve insulin effects (Moya-Pérez et al., 2015; Selma et al., 2017; Yoshida
sensitivity (secondary endpoint). Therefore, further studies are et al., 2018; Sanchis-Chordà et al., 2019). In contrast, following
warranted to explore whether a longer adherence time to a donor FMT, decreased levels of the opportunistic pathogen
Mediterranean diet or other beneficial diets (e.g., vegan or low- D. piger often seen in DM2 were observed in recipients (Qin
protein diet) together with multiple healthy donor FMTs can et al., 2012; Doumatey et al., 2020). Despite the increased fiber
provide significant and durable clinical metabolic improvements intake, the Mediterranean diet did not result in increased fecal
to metabolic syndrome subjects. SCFA levels in this study. Although a Mediterranean diet has
Introduction of the Mediterranean diet was associated with previously been associated with higher fecal SCFA levels (De
alterations in specific fecal bacterial species including an increase Filippis et al., 2015), others corroborate our findings (Wu et al.,
in the levels of A. muciniphila. This well-studied bacterial species 2016; Meslier et al., 2020). Wu et al. (2016) proposed the concept
has previously been linked with improved glucose and cholesterol of a restrictive microbiota associated with westernized societies
metabolism (Dao et al., 2016; Depommier et al., 2019) as well as an explanation for the lack of increased SCFA formation
as healthy and Mediterranean diets (Liu et al., 2019; Rinott despite additional substrate intake. Moreover, the unchanged
et al., 2020). Moreover, the increase in the butyrate-producing fecal SCFA levels could be caused by an increased utilization or
R. hominis corroborates other studies on Mediterranean diets rapid absorption by the colonocytes (Sakata, 2019).
(Haro et al., 2016; Ghosh et al., 2020; Meslier et al., 2020; Our group previously demonstrated an increase in peripheral
Rinott et al., 2020) and also has been associated with beneficial insulin sensitivity (Rd ) upon lean donor FMT (Vrieze et al.,
effects on glucose homeostasis (Karlsson et al., 2013; Zhang 2012; Kootte et al., 2017) while subjects were adhering to their
et al., 2013; Meslier et al., 2020). The decrease in C. aerofaciens habitual (omnivorous) diet. To our surprise, we observed no
levels is in line with previous studies showing increased levels synergistic effect of combining Mediterranean diet with lean
associated with DM2 and high serum cholesterol (Lahti et al., donor FMT on metabolic parameters including peripheral and
2013; Lambeth et al., 2015) and low dietary fiber intake (Gomez- hepatic insulin sensitivity, although a large standard deviation
Arango et al., 2018). Upon FMT, we observed the engraftment (Supplementary Figure 2) was observed, suggesting responders
Frontiers in Microbiology | www.frontiersin.org 9 June 2021 | Volume 12 | Article 662159Koopen et al. FMT Combined With Mediterranean Diet FIGURE 4 | Alterations in the gut microbiota associated with treatments. (A) Significant changes (padjusted < 0.1) in the species relative abundance after the Mediterranean diet (W0 vs. W2). (B) Differences (padjusted < 0.1) between the allogeneic and autologous fecal microbiota transplantation (FMT) groups. (C) Heat map representing the log2-transformed 10% trimmed means of the bacterial species relative abundances in the different groups (donor, allogeneic FMT, autologous FMT, W0, and W–2). Only showing species with a statistically significant differential abundance between at least two groups (Wilcoxon’s test of significance with a padjusted < 0.1), after filtering out rare taxa (at least 0.01% abundance in at least 50% of the samples within each group). Statistically significant differential abundance values between W0 vs. W–2 (diet effect) are indicated with black arrows, while those between donor and allogeneic vs. autologous (W3, W6, and W12) (FMT effect) are indicated by blue arrows. Directionality of differential abundance (greater or less) is indicated either with an arrow pointing up or arrow pointing down, respectively. Interestingly, when comparing the donor and the allogeneic groups with the autologous group, some overlap is observed, including the direction of differential abundance, strongly indicating that these species could have been acquired from the donor group or are being antagonized by species acquired from the donor group. and non-responders upon this combined intervention. However, both hepatic and peripheral insulin sensitivity. We hypothesize the sample size precluded further post hoc analyses. Previous that the gut microbial system is “locked” after the introduction of data have demonstrated that the effect of a FMT is controlled a beneficial Mediterranean diet, precluding additional beneficial by the baseline microbiota composition (Li et al., 2016; Kootte metabolic effects of donor FMT. Indeed, a higher biodiversity et al., 2017) and that subjects with a low baseline diversity have in an ecosystem is associated with increased resilience, thus greater metabolic improvement upon interventions (Cotillard higher tolerance to environmental perturbations (in this case et al., 2013; Kootte et al., 2017; Yu et al., 2020). Despite the represented by engraftment of exogenous bacterial species) short-period of dietary intervention (as compared to other (Mosca et al., 2016). This hypothesis is underscored by the fact studies, e.g., those of Meslier et al. (2020) with 8 weeks of that only a few donor strains were able to engraft in the gut as Mediterranean diet intervention and Ghosh et al., 2020 with compared to other studies without dietary interventions prior to 1 year), the Mediterranean diet intake provoked clear changes FMT (Li et al., 2016). Finally, we observed a significant positive in the gut microbiota composition, whereas the introduction of correlation between the changes (between W0 and W6) in the a healthy donor microbiota resulted in modest changes in the Bray–Curtis distance, a measure of microbiome dissimilarity, microbiome and did not significantly increase the microbiome and insulin sensitivity (Rd changes) solely after lean donor FMT species diversity. and not in the autologous FMT group. This indicates that, Thus, we postulate that the diet-induced changes in the gut when the microbiota composition/diversity still exhibits room for microbiota (enrichment in the beneficial commensal species change, we do observe greater alterations in insulin sensitivity Bacteroides, A. muciniphila, and R. hominis) and metabolic after lean donor FMT. profiles (decrease in fasting glucose, cholesterol, body weight, Moreover, we cannot exclude that the difference in the effects and a trend toward lower HOMA-IR index) render the host less of allogeneic or autologous FMT is masked by the introduction susceptible to FMT-induced changes and therefore attenuates the of a “less diabetogenic” microbiota in the autologous FMT (previously observed) beneficial effect of a lean donor FMT on group after 2 weeks on Mediterranean diet. In line with this, Frontiers in Microbiology | www.frontiersin.org 10 June 2021 | Volume 12 | Article 662159
Koopen et al.                                                                                                                    FMT Combined With Mediterranean Diet

  FIGURE 5 | Changes in the clinical parameters. This figure shows changes in a subset of the clinically relevant parameters. In green are the changes in the first
  2 weeks after initiation of the Mediterranean diet (for the whole group, since the subjects were not yet randomized). In blue and red are the changes after autologous
  or allogeneic fecal microbiota transplantation (FMT), respectively. Box and whisker, min–max. Only statistically significant p-values are shown. There were no
  significant differences between the autologous and allogeneic groups.

Rinott et al. (2020) reported that autologous FMT utilizing                             lowered after 2 weeks of Mediterranean diet. In line with this,
fecal samples collected at the end of a 6-month Mediterranean                           previous studies also described a decrease in branched-chain
diet intervention ameliorated the metabolic profiles of obese                           amino acids after a Mediterranean or a vegan diet (Draper et al.,
dyslipidemic patients until 8 months afterward. Of note is that                         2018; Meslier et al., 2020).
the microbiome intervention in the present study consisted of                              Similarly to what we observed for the metabolic parameters
a single fresh (non-processed) duodenal lean donor FMT, in                              after FMT, no additive effects of FMT on plasma metabolome
line with previous studies from our group (Vrieze et al., 2012;                         were detected, indicating that the Mediterranean diet-induced
Kootte et al., 2017). More recent microbiota intervention studies                       changes in the metabolic profiles overrides the effect of donor
in obese populations, however, investigated the effect of oral                          bacterial species engraftment. The observed decrease in fecal
encapsulated (processed) feces, repeated transplantations, and                          plant sterol levels (most specifically campesterol) suggests a
the usage of multiple donors (Allegretti et al., 2020; Leong                            change in intestinal cholesterol absorption, which was surprising
et al., 2020; Yu et al., 2020). Although the metabolic effects                          in view of the major decrease in total sterol excretion. Although
in these studies were variable, the microbial shifts might be                           the Mediterranean diet is low in cholesterol, the observed
more pronounced and durable. Perhaps, in the present study, a                           decrease in the total sterol output was more than 1,000 mg/day
more robust microbiota intervention (e.g., multiple FMTs or lean                        (Supplementary Figure 4). As a normal cholesterol intake
donor FMTs prior to the dietary intervention) could have resulted                       amounts to around 300 mg/day, this changed intake cannot
in a more distinct effect of the lean donor microbiota on top of the                    account for the effect, and we therefore hypothesize that
rigorous change in diet.                                                                cholesterol synthesis itself must have decreased, accounting for
   It is known that different levels of plasma metabolites                              the decrease in the plasma levels of total cholesterol, LDL, and
corroborate with the changes in food intake. Hereof, the plasma                         HDL. In contrast to the recent study of Meslier et al. (2020), we
levels of lysine, leucine, and isoleucine derivatives (being the                        did not observe changes in the fecal bile acid output. Perhaps
amino acids mainly found in meat and cheese) were significantly                         a 2-week exposure to the Mediterranean diet was not enough

Frontiers in Microbiology | www.frontiersin.org                                    11                                             June 2021 | Volume 12 | Article 662159
Koopen et al.                                                                                                                 FMT Combined With Mediterranean Diet

  FIGURE 6 | Mediterranean diet-induced changes in plasma metabolites. Log2 mean fold changes in plasma metabolites that differ significantly (padjusted < 0.1)
  between W0 (before diet) and W2 (2 weeks after initiation of the Mediterranean diet).

to translate the decreased cholesterol synthesis to a decrease in                     clamps twice. Secondly, in line with our previous studies (Vrieze
bile acid synthesis.                                                                  et al., 2012; Kootte et al., 2017), we included Caucasian male
   Our study has several limitations. Firstly, a notable difference                   subjects only. Although this was done to minimize the well-
between our current and previous FMT studies is the insulin                           known effects of ethnicity and sex (hormones) on the gut
sensitivity prior to the administration of FMT (Vrieze et al.,                        microbiota composition (Deschasaux et al., 2018; Yoon and
2012; Kootte et al., 2017). Although these former studies had                         Kim, 2021), this may have reduced generalization to the general
comparable inclusion criteria and the metabolic profiles at                           population. Thirdly, although the subjects were monitored
baseline were largely comparable, the median Rd after 2 weeks                         by a hospital dietitian for dietary adherence, data on the
of Mediterranean diet just before applying donor FMT (week                            actual dietary intake were retrieved from self-reported online
0) was much higher in the current study (25.8 and 26.2 vs.                            nutritional diaries. Prior studies have demonstrated that self-
41.0 µmol kg−1 min−1 ), although still in the range found in                          administered dietary records may underestimate the energy
obese individuals (Vrieze et al., 2012; Ter Horst et al., 2015).                      intake in overweight and obese individuals (Lichtman et al.,
In line with the significant increase in HOMA-IR between week                         1990; Schoeller, 1995; Bedard et al., 2004; Freedman et al., 2014).
−2 and week 0, we can speculate that this higher Rd results                           However, as all dietary records were checked by the dietitian
from a 2-week Mediterranean diet consumption. Nonetheless,                            on the same week, abnormalities were discussed immediately
ideally, we should have determined insulin sensitivity at W−2                         with the subject and corrected if necessary. Finally, despite
as well (thus, before starting the Mediterranean diet) in order                       the fact that no total calorie restriction was promoted, we
to test this hypothesis; however, due to ethical restrictions, we                     observed a decrease in total energy intake in the first 2 weeks.
were only allowed to perform the hyperinsulinemic–euglycemic                          Although the total amount of weight loss in these weeks was

Frontiers in Microbiology | www.frontiersin.org                                  12                                            June 2021 | Volume 12 | Article 662159
Koopen et al.                                                                                                        FMT Combined With Mediterranean Diet

not that pronounced and other studies corroborate the beneficial          ACKNOWLEDGMENTS
metabolic health effects of the Mediterranean diet (including
non-calorie-restricted diets) (Salas-Salvadó et al., 2011; Estruch        We would like to thank J. A. Haverkamp (dietitian, Amsterdam
et al., 2018), the decreased total energy intake per se may have          UMC) for dietary assistance.
influenced the metabolic outcomes.

                                                                          SUPPLEMENTARY MATERIAL
CONCLUSION
                                                                          The Supplementary Material for this article can be found online
We confirm previous studies showing a beneficial effect of a              at:    https://www.frontiersin.org/articles/10.3389/fmicb.2021.
Mediterranean diet on metabolic markers and gut microbiota                662159/full#supplementary-material
composition in metabolic syndrome subjects. Although we
observed (donor FMT-induced) engraftment of some bacterial                Supplementary Figure 1 | Subcutaneous tissue inflammation. Change in gene
species in the feces on top of this diet, we did not observe              expression in subcutaneous adipose tissue between week 0 and week 6 for both
synergistic beneficial metabolic effects in this small randomized         the autologous and allogeneic FMT group. Each line represents an individual
                                                                          subject. None of the genes in our panel changed significantly (rest of the genes
controlled trial. Therefore, these data warrant further study             not shown). CCL2, chemokine-ligand 2; IL-10, interleukin-10; IRS1, insulin
by combining specific diets with more frequently administered             receptor substrate 1; CD11, cluster of Differentiation 11, TNF, tumor necrosis
and/or different microbiome interventions (like repeated FMTs,            factor; IL-6, interleukin-6, CD68, cluster of differentiation 68.
specific bacterial species, or donor selection) to optimize               Supplementary Figure 2 | Peripheral and hepatic insulin sensitivity. This figure
microbiota changes and potential metabolic effects. Alternatively,        shows changes in insulin sensitivity between weeks 0 and 6 for both the
given the previous indications that a low baseline microbiota             autologous and allogeneic treatment group. In both groups there were no
diversity results in a greater metabolic response, pretreatment           statistically significant changes in peripheral (Rd ) or hepatic (endogenous glucose
                                                                          production –EGP- suppression) insulin sensitivity. There were also no differences
with antibiotics before microbial intervention is still an
                                                                          between the autologous and allogeneic FMT group. Box and whisker,
interesting, although challenging, concept.                               10–90th percentile.

                                                                          Supplementary Figure 3 | Correlation change in Rd and Bray–Curtis distance.
                                                                          This figure depicts the positive correlation between Bray Curtis distance (a
DATA AVAILABILITY STATEMENT                                               measure of microbiome dissimilarity) and change in Rd (a measure of peripheral
                                                                          insulin sensitivity) in only the allogeneic FMT group (Rho 0.622, p = 0.03).

The data have been deposited at the European Nucleotide                   Supplementary Figure 4 | Postprandial triglycerides. This figure shows
Archive (ENA) under the accession number PRJEB44237.                      triglyceride excursions after mixed meal for week 0 and week 6 for both
                                                                          autologous and allogeneic FMT group (line plot, median + IQR). The box and
                                                                          whisker plots (min–max) on the right represent area under curves (AUC) for both
                                                                          groups at the different time points. There were no significant differences between
ETHICS STATEMENT                                                          the two groups and within the groups at any time point.

                                                                          Supplementary Figure 5 | Postprandial GLP-1. This figure shows GLP-1
The studies involving human participants were reviewed                    excursions after mixed meal for week 0 and week 6 for both autologous and
and approved by METC AMC (Amsterdam University                            allogeneic FMT group (line plot, median + IQR). The box and whisker plots
                                                                          (min–max) on the right represent area under curves (AUC) for both groups at the
Medical       Center,      Amsterdam,      Netherlands).    The
                                                                          different time points. There were no significant differences between the two
patients/participants provided their written informed consent to          groups and within the groups at any time point.
participate in this study.
                                                                          Supplementary Figure 6 | 24 h fecal sterol excretion. This figure shows 24-h
                                                                          fecal cholesterol, coprostanol and DiH-cholesterol excretion in the first 2 weeks of
                                                                          the Mediterranean diet (whole group). Box and whisker plots, min–max.

AUTHOR CONTRIBUTIONS                                                      Supplementary Figure 7 | Fecal microbiota transplantation (FMT) induced
                                                                          changes in plasma metabolome. Effect of treatment with either autologous (A) or
AK, AG, and MN designed the study. AK, IA, JW, WF, ER, JH,                allogeneic donor (B) FMT on overall plasma metabolite composition.
SM, MK, JL, AS, HH, TS, LD, BH, JH, and PO’T performed                    Supplementary Table 1 | Primers used to measure the relative expression of
the research. AK and EA performed the statistical analysis.               IL-10, CCL2, CD68, CD11c, IRS1, TNF, and IL-6.
AK, AG, and MN drafted the manuscript. All authors critically
                                                                          Supplementary Table 2 | Macronutrient intake before-, during- and after the
reviewed the manuscript.                                                  Mediterranean diet, assessed using self-reported only nutritional diaries.
                                                                          Diet-induced changes in energy, fat, saturated fat, carbohydrate and fiber intake
                                                                          did not significantly differ between the two FMT groups.

FUNDING                                                                   Supplementary Table 3 | Fecal bile acid, -cholesterol and -short chain fatty acid
                                                                          concentrations, expressed as medians and interquartile ranges. Effect of
                                                                          Mediterranean diet only (W−2 to W0, whole group) and with addition of FMT (W0
This study was supported by a JPI HDHL consortium grant                   to W6, split to autologous FMT and allogeneic FMT). There were no statistically
(DINAMIC; Diet-Induced Arrangement of the Gut Microbiome                  significant differences in any of the above parameters between the autologous and
for Improvement of Cardiometabolic Health 529051011).                     allogeneic group at any time point.

Frontiers in Microbiology | www.frontiersin.org                      13                                               June 2021 | Volume 12 | Article 662159
You can also read