A Novel Oral Arginase 1/2 Inhibitor Enhances the Antitumor Effect of PD-1 Inhibition in Murine Experimental Gliomas by Altering the ...
←
→
Page content transcription
If your browser does not render page correctly, please read the page content below
ORIGINAL RESEARCH
                                                                                                                                               published: 24 August 2021
                                                                                                                                          doi: 10.3389/fonc.2021.703465

                                              A Novel Oral Arginase 1/2 Inhibitor
                                              Enhances the Antitumor Effect of
                                              PD-1 Inhibition in Murine
                                              Experimental Gliomas by Altering
                                              the Immunosuppressive Environment
                                              Paulina Pilanc 1, Kamil Wojnicki 1, Adria-Jaume Roura 1, Salwador Cyranowski 1,2,
                                              Aleksandra Ellert-Miklaszewska 1, Natalia Ochocka 1, Bartłomiej Gielniewski 1,
                                              Marcin M. Grzybowski 3, Roman Błaszczyk 3, Paulina S. Stańczak 3, Paweł Dobrzański 3
                       Edited by:             and Bozena Kaminska 1*
                    Lukas Bunse,
                                              1 Laboratory of Molecular Neurobiology, Nencki Institute of Experimental Biology of the Polish Academy of Sciences,
    German Cancer Research Center
                 (DKFZ), Germany              Warsaw, Poland, 2 Postgraduate School of Molecular Medicine, Medical University of Warsaw, Warsaw, Poland,
                                              3 OncoArendi Therapeutics SA, Warsaw, Poland
                      Reviewed by:
                  Michael C. Burger,
Goethe University Frankfurt, Germany          Glioblastomas (GBM) are the common and aggressive primary brain tumors that are
                              Xin Yu,
               Amgen, United States           incurable by conventional therapies. Immunotherapy with immune checkpoint inhibitors is
                     Katharina Sahm,          not effective in GBM patients due to the highly immunosuppressive tumor
  University of Heidelberg, Germany
                                              microenvironment (TME) restraining the infiltration and activation of cytotoxic T cells.
                *Correspondence:
                                              Clinical and experimental studies showed the upregulation of expression of the arginase 1
                   Bozena Kaminska
           b.kaminska@nencki.edu.pl           and 2 (ARG1 and ARG2, respectively) in murine and human GBMs. The elevated arginase
                                              activity leads to the depletion of L-arginine, an amino-acid required for the proliferation of T
                   Specialty section:
                                              lymphocytes and natural killer cells. Inhibition of ARG1/2 in the TME may unblock T cell
         This article was submitted to
                 Cancer Immunity and          proliferation and activate effective antitumor responses. To explore the antitumor potential
                       Immunotherapy,         of ARG1/2 inhibition, we analyzed bulk and single-cell RNA sequencing (scRNA-seq) data
               a section of the journal
                 Frontiers in Oncology
                                              from human and murine gliomas. We found the upregulation of ARG1/2 expression in
           Received: 30 April 2021
                                              GBMs, both in tumor cells and in tumor infiltrating microglia and monocytes/
         Accepted: 02 August 2021             macrophages. We employed selective arginase inhibitors to evaluate if ARG1/2
         Published: 24 August 2021
                                              inhibition in vitro and in vivo exerts the antitumor effects. A novel, selective ARG1/2
                             Citation:
                                              inhibitor - OAT-1746 blocked microglia-dependent invasion of U87-MG and LN18 glioma
     Pilanc P, Wojnicki K, Roura A-J,
Cyranowski S, Ellert-Miklaszewska A,          cells in a Matrigel invasion assay better than reference compounds, without affecting the
            Ochocka N, Gielniewski B,         cell viability. OAT-1746 effectively crossed the blood brain barrier in mice and increased
        Grzybowski MM, Błaszczyk R,
      Stańczak PS, Dobrzański P and
                                              arginine levels in the brains of GL261 glioma bearing mice. We evaluated its antitumor
     Kaminska B (2021) A Novel Oral           efficacy against GL261 intracranial gliomas as a monotherapy and in combination with the
      Arginase 1/2 Inhibitor Enhances
                                              PD-1 inhibition. The oral treatment with OAT-1746 did not affect the immune composition
         the Antitumor Effect of PD-1
     Inhibition in Murine Experimental        of TME, it induced profound transcriptomic changes in CD11b+ cells immunosorted from
               Gliomas by Altering the        tumor-bearing brains as demonstrated by RNA sequencing analyses. Treatment with
   Immunosuppressive Environment.
             Front. Oncol. 11:703465.
                                              OAT-1746 modified the TME resulting in reduced glioma growth and increased antitumor
     doi: 10.3389/fonc.2021.703465            effects of the anti-PD-1 antibody. Our findings provide the evidence that inhibition of

Frontiers in Oncology | www.frontiersin.org                                          1                                        August 2021 | Volume 11 | Article 703465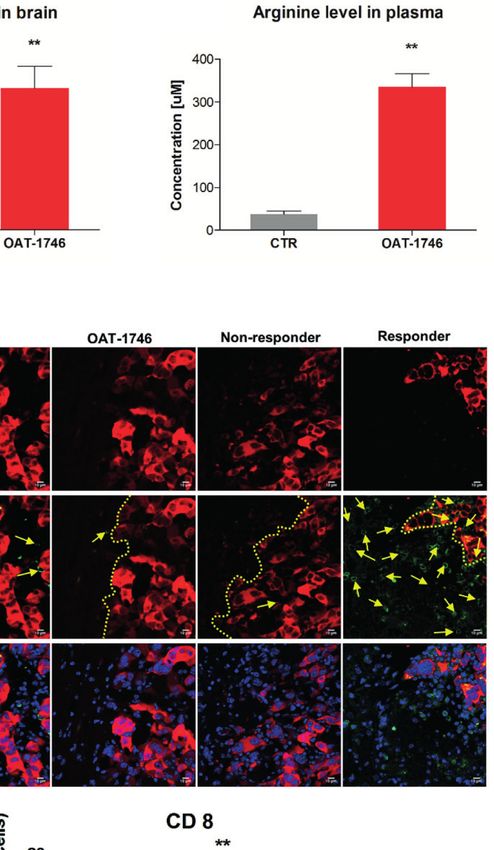
Pilanc et al.                                                                                      Arginase Inhibition Sensitizes Glioblastoma to Immunotherapy

                                              ARG1/2 activity in tumor cells and myeloid cells in the TME unblocks antitumor responses
                                              in myeloid cells and NK cells, and improves the efficacy of the PD-1 inhibition.
                                              Keywords: arginase inhibitor, tumor microenvironment, glioma associated microglia and macrophages, immune
                                              checkpoint inhibitor, immunotherapy

INTRODUCTION                                                                       progression and jointly with myeloid-derived suppressor cells
                                                                                   (MDSCs) modulate antitumor immune responses in multiple
Glioblastoma (GBM, WHO grade IV glioma) is the most                                ways (15).
common and aggressive primary brain tumor in adults. While                             Both malignant cells and tumor-infiltrating myeloid cells in
the available treatments may slow down the progression of GBM                      murine and human gliomas upregulate the expression of
and reduce neurological symptoms, the disease remains                              arginase (16, 17) and the resulting changes in the L-arginine
incurable. The standard treatment for GBM patients is surgical                     metabolism are one of the most prominent mechanisms
resection followed by radiation and oral chemotherapy with                         contributing to immunosuppression (18). There are two
temozolomide (TMZ). Despite improvements in imaging,                               arginase isoforms (ARG1 and ARG2), catalyzing the same
surgical techniques, radiotherapy and chemotherapy, GBM                            biochemical reaction, but differing in subcellular localization,
inevitably recurs and the prognosis of patients with GBM                           expression, and regulation. ARG1 is a cytosolic protein, while
remains poor, with a median overall survival of 15 months                          ARG2 is mainly localized in the mitochondria (19). Arginase
(1, 2). The ability of tumors to modify the surrounding                            catalyzes the hydrolysis of L-arginine to urea and L-ornithine,
microenvironment and evade the immune system is                                    thereby depleting extracellular L-arginine (20). T cells are
increasingly recognized as an important determinant of cancer                      auxotrophic for L-arginine and require this amino acid for the
progression and patient prognosis (3). GBMs are infiltrated with                    rapid and successive proliferation that follows T cell receptor
various myeloid cells which do not activate their proper                           activation of effector cells (21). Expression of ARG1 is a defining
functions but instead they are tumor supportive and create the                     feature of immunosuppressive myeloid cells that are highly
immunosuppressive tumor microenvironment (TME), poorly                             enriched in the TME, and the role of ARG1-expressing
infiltrated with cytotoxic T lymphocytes and natural killer                         MDSCs in altering T-cell responses in cancer patients is well
(NK) cells being frequently deficient in their antitumor                            established (22, 23). CB-1158, an arginase 1 inhibitor synthesized
activity (4).                                                                      at Calithera Biosciences blocked myeloid cell-mediated
    Immune checkpoint inhibitor-based therapies provided an                        suppression of T cell proliferation in vitro and reduced tumor
effective strategy to enhance antitumor immune responses in                        growth in several mouse models of non-CNS tumors (CT26,
many solid cancers (5). Programmed cell death 1 (PD-1, CD279),                     LLC, B16, and 4T1 tumors). The ARG1 inhibitor was effective as
an immune checkpoint surface receptor expressed on lymphocytes,                    a single agent or in combination with checkpoint blockade (anti-
is a mediator of immune suppression in a variety of tumors,                        PD-L1), adoptive T cell and NK cell transfer, and chemotherapy
including GBM (6). Binding of PD-1 with its ligands B7-H1 (PD-                     with gemcitabine. The treatment with CB-1158 increased tumor-
L1) or B7-DC (PD-L2) induces apoptosis or exhaustion of activated                  infiltrating CD8+ T cells and NK cells, inflammatory cytokines,
immune cells. Blockade of this interaction enhances the antitumor                  and expression of several interferon-inducible genes (24). CB-
activity of the immune system (7). While first studies of the adjuvant              1158 advanced to clinical trials for patients with non-CNS
therapy with pembrolizumab (a monoclonal antibody against                          malignancies (NCT02903914).
human PD-1) in GBM patients demonstrated some benefits (8),                             In the present study, we provide the compelling evidence that
further studies showed no survival improvement (9, 10). The recent                 OAT-1746, a novel and oral small-molecule inhibitor of ARG1/
results from a randomized phase III trial CheckMate143 with                        2, affects glioma-microglia interactions in vitro, accumulates in
nivolumab (an anti-PD-1 antibody) did not show the improved                        the brain and modulates the TME of murine intracranial
survival of patients with recurrent GBMs compared to those treated                 gliomas. We demonstrate that OAT-1746 works synergistically
with bevacizumab, an anti-VEGF-A antibody (11). Genomic and                        with PD-1 blockade and improves antitumor immune responses
transcriptomic analysis of GBM patients treated with anti-PD-1                     against gliomas.
antibodies revealed a significant enrichment of the
immunosuppressive transcriptomic signature in non-responders,
along with differences in T cell clonal diversity and tumor
microenvironment profiles (12). Growing evidence suggests that                      MATERIALS AND METHODS
the clinical response to immunotherapies is restricted by various
resistance mechanisms, such as a strong immunosuppression                          Glioma Cell Cultures
induced by the tumor infiltrating myeloid cells (13, 14).                           Human glioblastoma cell lines LN18, U87-MG (U87) (ATCC,
    Glioma-associated microglia and macrophages (GAMs)                             Manassas, VA) were cultured in Dulbecco’s modified Eagle’s
accumulate in malignant gliomas and are key drivers of tumor                       medium (DMEM) supplemented with 10% fetal bovine serum
invasion and immunosuppression. GAMs promote tumor                                 (FBS) (Gibco, MD, USA) and antibiotics (100 U/mL penicillin,

Frontiers in Oncology | www.frontiersin.org                                    2                                    August 2021 | Volume 11 | Article 703465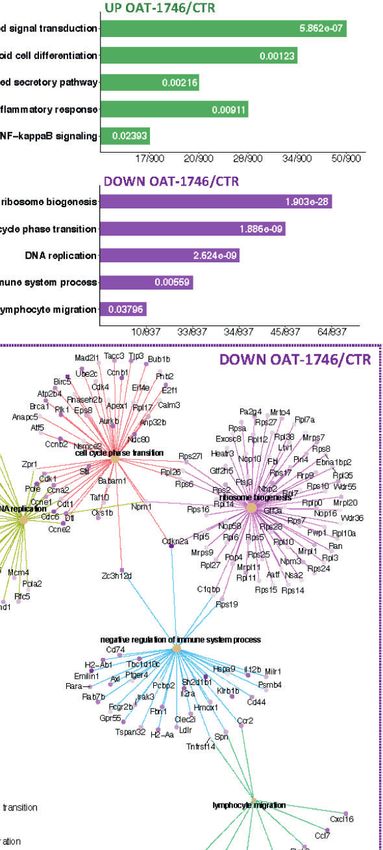
Pilanc et al.                                                                              Arginase Inhibition Sensitizes Glioblastoma to Immunotherapy

100 mg/mL streptomycin). GL261 tdTomato+luc+ murine glioma                 Membrane Insert, Corning, NY, USA) coated with the Growth
cells were cultured in DMEM with the addition of 10% FBS,                  Factor Reduced Matrigel™ Matrix (BD Biosciences, San Diego.
antibiotics and 100 mg/mL G418 (Invivogen, San Diego, CA,                  CA, USA). The Matrigel™ Matrix (50 µL of 1 mg/mL stock
USA). Cells were cultured in a humidified atmosphere CO2/air                solution diluted in fresh DMEM) was dried under sterile
(5%/95%) at 37°C (Heraeus, Hanau, Germany).                                conditions (37°C) for 5–6 h. The medium in BV2 cultures was
                                                                           replaced with fresh one 1 h before seeding glioblastoma cells onto
Microglial Cell Cultures                                                   the inserts, then LN18 and U87 glioblastoma cells were seeded at
Mouse immortalized microglial BV2 cells were cultured in                   2×10⁴/insert on Matrigel-covered membranes in a serum-
Dulbecco’s modified Eagle’s medium GlutaMAX™ (DMEM                          reduced medium (2% FBS). Untreated glioblastoma cells co-
GlutaMAX ™ ) supplemented with 2% fetal bovine serum                       cultured with or without BV2 cells served as positive and
(Gibco, MD, USA) and antibiotics (100 U/mL penicillin, 100                 negative controls, respectively. Cells were treated with the
mg/mL streptomycin) in a humidified atmosphere CO2/air (5%/                 arginase-1 inhibitors OAT-90, OAT-1617 and OAT-1746
95%) at 37°C (Heraeus, Hanau, Germany).                                    solved in PBS. The cultures were kept in incubator at 37°C
    Primary microglial cultures were prepared from cerebral                with humidified air containing 5% CO2. After 18 h cells were
cortices of P0–P2 C57BL/6J mice as described (25). Briefly,                 fixed in ice-cold methanol and cell nuclei stained with DAPI
after stripping off the meninges and enzymatic brain                       (4′,6-Diamidino-2-Phenylindole; 1 µg/mL, Sigma). The
dissociation the cells were collected and seeded onto the                  membranes from Transwell® inserts were cut out and images
culture flasks. After 48 h, cell cultures were washed three times           were acquired using a fluorescence microscope (Leica DM4000B,
with phosphate-buffered saline (PBS) to remove debris. Primary             10x lens) from the 5 independent fields (bottom; top; left; right
cultures were kept in DMEM supplemented with 10% FBS, 2                    side and the middle). Numbers of invading cells were counted
mM L-glutamine, 100 U/mL penicillin, and 100 µg/mL                         using the ImageJ software (NIH, Bethesda, MD, USA). All
streptomycin (Gibco, MD, USA). Microglia were isolated by                  experiments were performed three times, in duplicates.
gentle shaking for 1 h at 100 RPM at 37°C. Detached microglia
were collected by centrifugation, counted, and checked for                 Viability Assay
viability. Microglia cultures were used for experiments 48 h               Cell viability was assessed using MTT metabolism assay (U87
after seeding to ensure that the cells were quiescent.                     and BV2 cells) or MTS CellTiter 96® AQueous One Solution Cell
                                                                           Proliferation Assay (Promega) for the primary murine microglia
Recombinant Arginase Activity Assays                                       cultures. Cells were cultured either in 96-well plates (U87 at
The inhibitory activity towards hARG1 and hARG2 enzymes was                density of 1×10⁴) or 24-well plates (BV2 at density of 4×10⁴ and
assessed using recombinant enzymes biosynthesized using a                  primary microglia 8×10⁴) with the indicated concentrations of
prokaryotic expression system (E. coli) and purified by fast                the inhibitor or H2O (vehicle) for 24 h. MTT solution (Sigma
protein liquid chromatography (FPLC). Briefly, recombinant                  Aldrich) was added to each well to a final concentration of 0.5
enzymes were incubated with the tested compounds for 1 h at                mg/mL. After 1 h of incubation at 37°C, water-insoluble dark
37°C in the reaction buffer (100 mM sodium phosphate buffer, 130           blue formazan crystals were dissolved in DMSO. Optical
mM NaCl, 1 mg/mL BSA, pH 7.4) containing substrate (10 mM L-               densities (OD) were measured at 570 and 620 nm using a
arginine hydrochloride) and cofactor (200 µM MnCl2). The assay is          scanning multiwell spectrophotometer. The MTT assay was
based on the detection of urea, which is generated during the              performed according to the manufacturer’s protocol. All
conversion of L-arginine into L-ornithine catalyzed by arginases. To       measurements were carried out on three independent cell
visualize the product, we adding a mixture of reagent A (4 mM oPA,         passages, in triplicates.
50 mM boric acid, 1 M sulfuric acid, 0.03% Brij-35) and reagent B (4
mM NED, 50 mM boric acid, 1 M sulfuric acid, 0.03% Brij-35) in             Animals
equal proportions. The absorbance was measured at 515 nm. The              Male C57BL/6J mice (10-12 weeks at the beginning of the study)
urea production in the absence of any tested compound was                  were housed with free access to food and water, on a 12h/12h day
considered as maximal enzyme activity. The absorbance in the               and night cycle. All efforts have been made to minimize the
absence of arginase (background) was considered as zero activity.          number of animals and animals suffering. All research protocols
Two reference compounds OAT-81 (ABH, no. 222638-65-5) and                  conformed to the Guidelines for the Care and Use of Laboratory
OAT-90 (2-amino-6-borono-2-(2-(3-(2,4-dichlorophenyl)                      Animals (European and national regulations 2010/63/UE
propyloamino)ethyl) hexanoic acid, and two novel inhibitors                September 22, 2010 and Dz. Urz. UE L276/20.10.2010,
OAT-1617 and OAT-1746 (the last three synthesized at                       respectively). Animals were decapitated by a qualified
OncoArendi Therapeutics) were tested. Normalized values were               researcher. The First Warsaw Local Ethics Committee for
analyzed using GraphPad Prism 7.0 software and the IC50 values             Animal Experimentation approved the study (approval no.
were determined.                                                           562/2018).

Invasion Assays                                                            Determining Plasma L-Arginine and
BV2 cells were plated onto a 24-well plate at the density of 4×10⁴.        Drug Concentration
After 24 h, the invasion assay was performed with tissue culture           Blood plasma, as well as the brain samples (from control and
inserts (6.5 mm Transwell® with 8.0 µm Pore Polycarbonate                  treated animals), were prepared for liquid chromatography

Frontiers in Oncology | www.frontiersin.org                            3                                    August 2021 | Volume 11 | Article 703465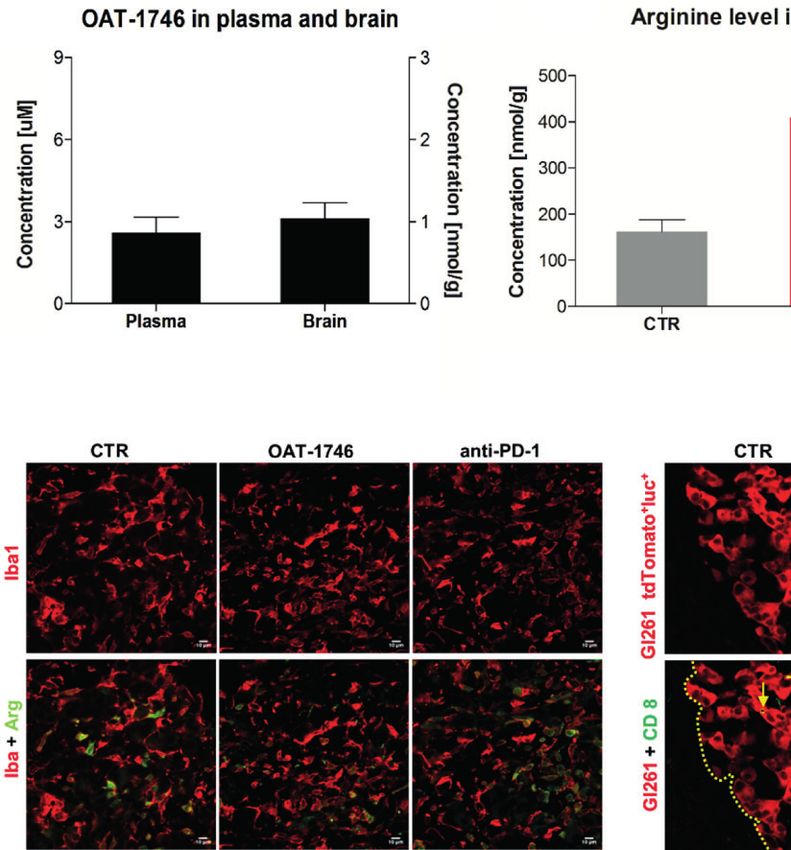
Pilanc et al.                                                                            Arginase Inhibition Sensitizes Glioblastoma to Immunotherapy

coupled with mass spectrometry (LC-MS) by homogenization in              Immunohistochemistry on Brain Slices
5% trichloroacetic acid (TCA) and the concentration of L-                The animals were sacrificed on the day 21 after GL261
arginine – the substrate of arginase – was determined. In the            tdTomato + luc + cell implantation and perfused with 4%
urea cycle, arginase cleaves arginine to produce urea and                paraformaldehyde in PBS. Brains were removed, post-fixed for
ornithine. Ornithine reacts with carbamoyl phosphate to form             48 h in the same fixative solution and placed in 30% sucrose in
citrulline. The brain homogenates prepared for arginine                  PBS at 4°C until the tissue sunk to the bottom of the flask. Tissue
measurements, as well as plasma samples were also analyzed               was frozen in Tissue Freezing Medium (Jung; Nussloch,
by LC-MS to determine the concentration of the drug, which was           Germany) and cut in 12 µm coronal sections using a cryostat.
administered to animals 2 h before the euthanasia.                       The slides were dried at room temperature for 2 h after being
                                                                         transferred from the -80°C storage. Cryosections were blocked in
Stereotactic Implantation of Glioma Cells                                PBS containing 10% donkey serum and 0.1% Triton X-100 for
Mice were deeply anesthetized with isoflurane. After identifying          2 h and incubated overnight at 4°C with rabbit anti-Iba-1 and
the sagittal and coronal sutures on the right side, a hole was           goat anti-Arg1 or with rabbit anti-CD8 antibodies. Next, sections
drilled at the following coordinates: 1 mm anterior and 1,5 mm           were washed in PBS and incubated with corresponding
lateral from bregma. GL261 tdTomato+luc+ glioma cells (80,000            secondary antibodies for 2 h at room temperature. All
in 1 mL of DMEM) were stereotactically injected with a Hamilton          antibodies were diluted in 0.1% Triton X-100/PBS solution
syringe to the right striatum of the mouse 3 mm deep from the            containing 3% donkey serum. Nuclei were counterstained with
surface of the brain. The skin incision was closed and mice were         DAPI (1 µg/mL). Images were obtained using the Olympus
monitored until they completely recovered from anesthesia. Mice          microscope (Fluoview, FV10i). For reagent specifications,
were randomly allocated to the study groups. The animals were            catalogue numbers, and concentrations, see the Supplementary
weighed weekly and observed daily for clinical symptoms and              Table 1. To quantify the tumor size, sections were stained with
evidence of toxicity by evaluating their eating, mobility, weight        toluidine blue, and images were acquired using a Leica DM4000B
loss, hair loss, and hunched posture. OAT-1746 was                       microscope (Leica Microsystems, Wetzlar, Germany). Tumor
administered by oral gavage at 50 mg/kg twice a day from day             areas were measured using ImageJ software (NIH, Bethesda, MD,
1 after implantation. Anti-PD-1 antibody (Biolegend,                     USA) on every sixth brain slice, and tumor volumes were
GoInVivo ™ Purified anti-mouse CD279) was injected                        calculated as previously described (26).
intraperitoneally (i.p.) at a dose of 2.5 mg/kg on days 8, 10, 12,
14 post-implantation. Control groups received vehicle (saline)           Tissue Dissociation, Flow Cytometry and
twice a day by gavage. Animals were euthanized when they lost            FACS Sorting
more than 20% of body weight compared to day 0.                          On day 28 after GL261 tdTomato+luc+ cell implantation mice
                                                                         were perfused transcardially with cold phosphate-buffered saline
Bioluminescence Imaging                                                  (PBS) to clear away blood cells from the brain. The tumor-
To monitor tumor growth, mice were injected i.p. with 150 mg/            bearing hemispheres were dissociated enzymatically with a
kg body weight luciferin (D-luciferin sodium salt BC218                  Neural Tissue Dissociation Kit with papain (Miltenyi Biotec)
Synchem) and left for 8 min. Then, the animals were                      and gentleMACS Octo Dissociator (Miltenyi Biotec), according
anesthetized with 3% isoflurane and transferred to the X-treme            to the manufacturer’s protocol to obtain a single-cell suspension.
Imaging System (Bruker, Germany). At 10 min after the D-                 Next, the enzymatic reaction was stopped by the addition of
luciferin injection, a photonic emission was imaged. Tumors              Hank’s Balanced Salt Solution with calcium and magnesium
were visualized at days 14, 21 and 28 after implantation and             (Gibco, Germany). The resulting cell suspension was filtered
bioluminescent images were quantified as photon/sec/mm2. We               through 70 mm and 40 mm strainers, and centrifuged at 300 × g,
applied the same ROI rectangle to all images (the whole head).           4°C for 10 min. Next, myelin was removed by centrifugation on a
Then we exported sum values for all images.                              22% Percoll gradient. Briefly, cells were suspended in 25 mL
                                                                         Percoll solution (18.9 mL gradient buffer containing 5.65 mM
Cytokine Analysis                                                        NaH2PO4H2O, 20 mM Na2HPO42(H2O), 135 mM NaCl, 5 mM
Measurement of pro- and anti-inflammatory cytokines was                   KCl, 10 mM glucose, 7.4 pH; 5.5 mL Percoll (GE Healthcare,
performed in blood from control and treated animals. Blood was           Germany); 0.6 mL 1.5 M NaCl), overlayered with 5 mL DPBS
quickly collected to EDTA containing tubes before perfusion and          (Gibco) and centrifuged for 20 min at 950 × g at 4°C, without
centrifuged (10,000 × g) for 10 min at room temperature. The             acceleration and brakes. Next, cells were collected, washed with
plasma was collected and stored at -80°C. The levels of cytokines        PBS and counted using NucleoCounter (Chemometec, Denmark).
were measured using the Milliplex Kit (Merk-Millipore, Germany)              Samples were handled on ice or at 4°C without light exposure.
according to the protocol. Cytokine levels were determined using         Prior to staining with antibodies, samples were incubated with
the MAGPIX Multiplexing Instrument (Luminex, TX, USA) with               LiveDead Fixable Violet Dead Cell Stain (ThermoFisher) in PBS
XPonent software and analyzed with Milliplex Analyst 5.1 software.       for 10 min to exclude nonviable cells. Next, samples were
Results were expressed as pg/mL for each cytokine.                       incubated for 10 min with rat anti-mouse CD16/CD32 Fc

Frontiers in Oncology | www.frontiersin.org                          4                                    August 2021 | Volume 11 | Article 703465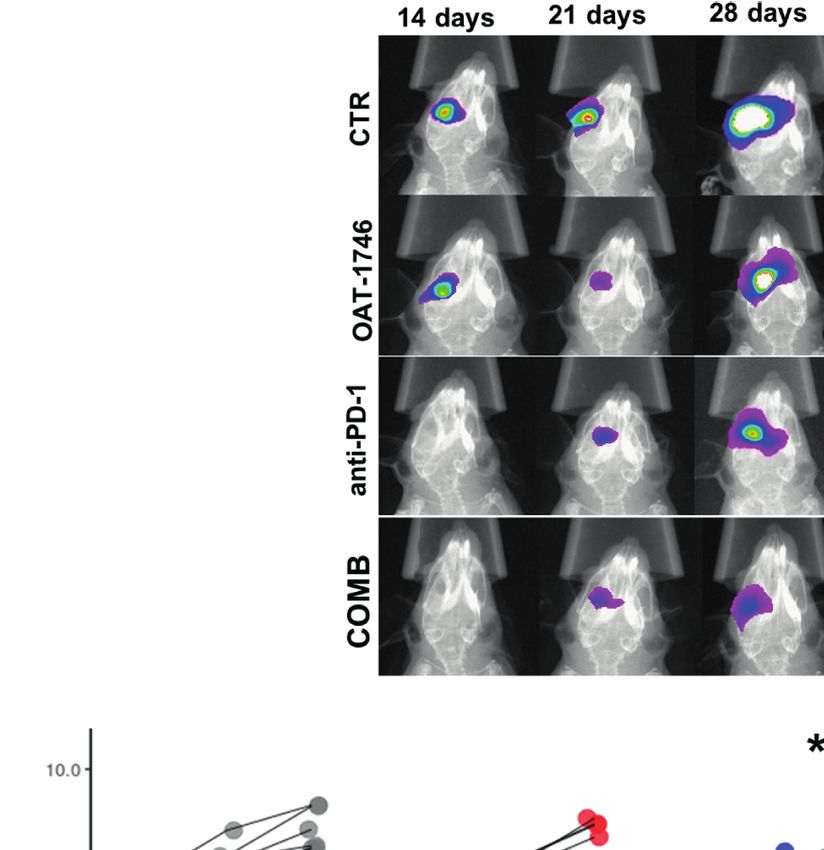
Pilanc et al.                                                                               Arginase Inhibition Sensitizes Glioblastoma to Immunotherapy

Block™ (BD Pharmingen) in Stain Buffer (BD Pharmingen) to                 Trimmomatic (27) tool (version 0.36). The resulting RNA
block FcgRIII/II and reduce unspecific antibody binding. Then,             sequencing reads were aligned to a reference mouse genome
cell suspensions were incubated for 30 min with an antibody               sequence (mm10) with STAR aligner (28) (version 2.6.1b) using
cocktail in Stain Buffer (BD Pharmingen). For flow cytometry               the two pass Mode Basic option. Duplicate reads were then
analysis of cell surface antigens the following anti-mouse                identified and flagged using Picard Tools (version 2.17.1)
antibodies were used: CD45 (30-F11), CD11b (M1/70) from                   [broadinstitute.github.io/picard/]. Quantification of mapped
BD Pharmingen and CD3 (REA641), NK 1.1 (PK136) from                       reads and summarization by gene was performed using
Miltenyi Biotec. For FACS sorting the cells were stained with             HTSeq-count (29) (version 0.11.1), with paired mode (-p) and
CD11b (M1/70) antibody labeled with FITC (BD Pharmingen).                 reverse stranded mode (-s reverse) enabled, and only reads with
    All antibodies were titrated prior to staining to establish the       MapQ values of 10 or higher were considered. Low-expressed
amount yielding the best stain index. Data were acquired using a          features were filtered out and an analysis of differentially
BD LSR Fortessa Analyzer cytometer and analyzed with FlowJo               expressed genes was performed using DESeq2 (version 1.24.0)
software (v. 10.5.3, FlowJo LLC, BD). Gates were set based on             (30). Only mRNAs encoding protein-coding genes were retained
FMO (fluorescence minus one) controls and back-gating                      for downstream analysis.
analysis. Percentages on cytograms were given as the                          To identify transcriptomic differences between groups,
percentage of a parental gate. CD11b+ cells were FACS sorted              differential expression analysis was performed using DESeq
using Cell Sorter BD FACSAriaII. All flow cytometry                        methods, with the control state (CTR) as the reference group
experiments were performed at the Laboratory of Cytometry,                and compared with the OAT-1746, anti-PD-1 and combination
Nencki Institute of Experimental Biology. For reagent                     groups. The variance stabilizing transformation (vst function)
specifications, catalog numbers and dilutions see the                      was used for visualization. Pathway enrichment analysis was
Supplementary Table 1.                                                    performed by selecting statistically significant genes (adjusted
                                                                          p-values ≤ 0.05) and correcting type I errors in multiple testing
RNA Isolation, mRNA Library Preparation                                   using the Bonferroni-Hochberg (BH) method. Gene Ontology
and RNA-Sequencing                                                        Biological Processes (GO: BP) was used to better understand the
Immediately after sorting, CD11b+ cells were centrifuged and              mechanistic findings of the enriched gene lists. The
lysed for further isolation of RNA using the RNeasy Plus Mini             clusterProfiler (31) and VennDiagram (32) packages were
Kit (Qiagen, Germany). The integrity and quality of RNA were              used to visualize the results.
assessed on an Agilent 2100 Bioanalyzer with an RNA 6000 Pico
Kit (Agilent Technologies, CA, USA). A total of 9 strand-specific
RNA libraries were prepared for sequencing (2-3 biological                RESULTS
replicates/treatment) using a KAPA Stranded mRNA-Seq Kit
(Kapa Biosystems, MA, USA). Poly-A mRNAs were purified                     ARG1 Expression Is Highly Upregulated in
from 100 ng of total RNA using poly-T-oligo-magnetic beads                Human Glioblastoma Samples and in
(Kapa Biosystems, MA, USA). mRNAs were fragmented and a                   Murine Experimental Gliomas
first-strand cDNA was synthesized using reverse transcriptase              Using transcriptomic data from The Cancer Genome Atlas
and random hexamers. A second-strand cDNA synthesis was                   (TCGA), we examined ARG1 and ARG2 expression in human
performed by removing RNA templates and synthesizing                      gliomas of different WHO grades II, III, IV. The highest mRNA
replacement strands, incorporating dUTP in place of dTTP to               levels of both genes were found in GBM samples (Figure 1A and
generate double-stranded (ds) cDNA. dsDNA was then                        Supplementary Figure 1A). To determine a cell source of ARG1
subjected to addition of “A” bases to the 3′ ends and ligation            and ARG2 expression, we explored the single-cell RNA sequencing
of adapters from NEB, followed by uracil digestion by USER                (scRNA-seq) data from 10 astrocytoma samples (33) and checked
enzyme (NEB, MA, USA). Amplification of fragments with                     the gene expression in various cell populations from the tumors
adapters ligated on both ends was performed by PCR using                  using the SingleCell data portal (https://singlecell.broadinstitute.org/).
primers containing TruSeq barcodes (NEB, Ipswich, MA, USA).               High expression of ARG1 and ARG2 was detected in malignant
Final libraries were analyzed using Bioanalyzer and Agilent DNA           cells and tumor-infiltrating microglia/macrophages (MG/MF)
High Sensitivity chips (Agilent Technologies, Santa Clara, CA,            (Figure 1B and Supplementary Figure 1B). We took advantage of
USA) to confirm fragment sizes (~300 bp). Quantification was                having in-house sc-RNA-seq data of CD11b+ immunosorted from
performed using a Quantus fluorometer and the QuantiFluor                  murine GL261 gliomas, which provided resolution to distinguish
dsDNA System (Promega, Madison, Wisconsin, US). Libraries                 resident microglia from CNS-border associated macrophages
were loaded onto a rapid run flow cell at a concentration of 8,5           (BAMs) or monocytes/macrophages (Mo/MF) (34). Using these
pM onto a rapid run flow cell and sequenced on an Illumina                 data, we analyzed Arg1 and Arg2 expression in the discrete myeloid
HiSeq 1500 paired-end.                                                    subpopulations. There was a low number of microglial cells
                                                                          expressing either Arg1 (< 1%) or Arg2 (< 0.1%) mRNA and both
Data Processing and Analysis                                              genes were more abundantly expressed in the Mo/MF population
Illumina-specific adapters, short reads, and low quality 5’ and 3’         (11% and 6%, respectively) (Figure 1C and Supplementary Figure
bases were filtered out in the FASTQ format files using                     1C). Arg1 expression levels were significantly higher than Arg2

Frontiers in Oncology | www.frontiersin.org                           5                                      August 2021 | Volume 11 | Article 703465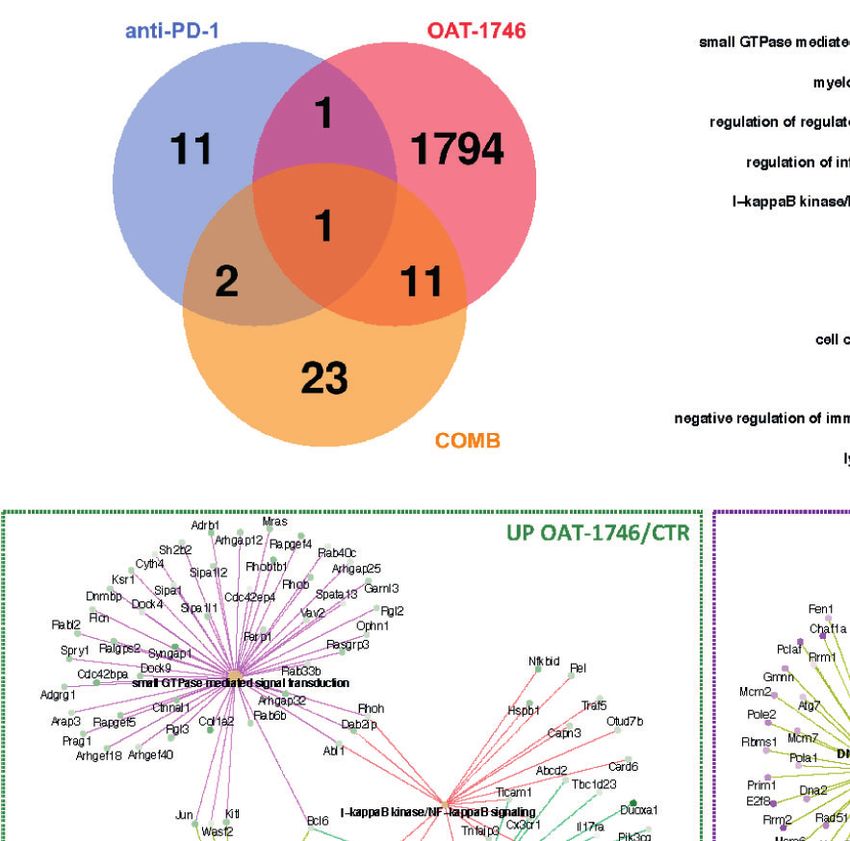
Pilanc et al.                                                                                            Arginase Inhibition Sensitizes Glioblastoma to Immunotherapy

                        A                                                       B

                        C                                                                         D

  FIGURE 1 | ARG1 expression is highly upregulated in human glioblastomas and murine experimental gliomas. (A) ARG1 expression in gliomas of different WHO
  grades (WHO grades II- IV) in TCGA datasets. Statistical significance was determined by Tukey’s Honest Significant Difference (HSD). ***p < 0.001. (B) Expression of
  ARG1 in malignant cells and microglia/macrophages (MG/MF) in 10 samples of astrocytomas in single-cell RNA-seq datasets (public data) from Ref. (33). (C) UMAP
  plot of CD11b+ cells from GL261 gliomas (n=8). Projection of cells combined from clusters identified as microglia, monocytes/macrophages (Mo/MF), and BAMs.
  Plots depicting Arg1 mRNA which is highly expressed in infiltrating Mo/MF. (D) Flow cytometry analysis of Arg1 expressing cells among microglia (CD11b+CD45lo)
  and Mo/MF (CD11b+CD45high) cells sorted from murine gliomas (n=10); Wilcoxon matched-pairs signed rank, two-tailed, **p < 0.01.

mRNA levels both in microglia and Mo/MF immunosorted from                               The Effect of OAT Inhibitors on
tumor-bearing brain (Supplementary Figure 1D). Additionally, we                         Human Arginase 1/2 Activity and
assessed Arg1 levels by flow cytometry in CD11b+ cells isolated                          Glioma Cell Invasion
from tumor-bearing hemispheres at day 21 post-implantation                              We have previously demonstrated that Arg1 mRNA is upregulated
(Figure 1D). The percentage of Arg1+ cells was higher in Mo/                            in microglia exposed to glioma during reprogramming of microglia
MF infiltrating from the periphery (CD11b+CD45high) than in                              into tumor-supportive, immunosuppressive cells (25, 35). Arginase
resident microglia (CD11b+CD45low), which corroborated the                              inhibitors OAT-1746 and OAT-1617 were designed and
results from scRNA-seq analysis (Supplementary Figure 1D).                              synthesized by OncoArendi Therapeutics, Warsaw. OAT-1746
Overall, these results confirm high ARG1 and ARG2 expression in                          inhibited ARG1/2 at low nanomolar concentrations, reversed
human malignant cells and glioma-infiltrating monocytes/                                 ARG1-inhibited proliferation of human and murine T cells and
macrophages. Arg1 is a predominant isoform expressed in                                 showed significant antitumor efficacy in various non-CNS tumor
myeloid cells in the brain of tumor-bearing mice.                                       models (36).

Frontiers in Oncology | www.frontiersin.org                                         6                                      August 2021 | Volume 11 | Article 703465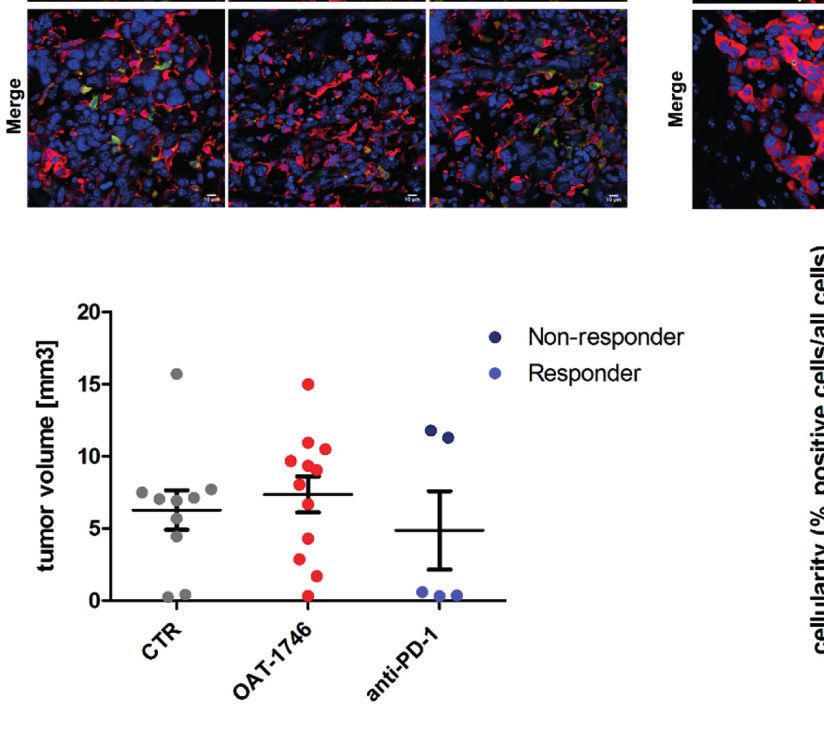
Pilanc et al.                                                                               Arginase Inhibition Sensitizes Glioblastoma to Immunotherapy

    OAT-1746 and OAT-1617 as well as two reference                          which confirms that it crosses the BBB and accumulates in the
compounds were tested in biochemical assays for the ability to              brain (Figure 3A). The administration of OAT-1746 resulted in
inhibit arginase activity and in cellular assays for the ability to         an increase of arginine concentration, both in the brain
block tumor cell invasion. OAT-1746 inhibited recombinant                   (Figure 3B) and the blood plasma (Figure 3C).
human ARG1 activity (IC50=28 nM) and the related enzyme                         To study the effects of arginase inhibition on the immune cells
ARG2 (IC50=49 nM) better than two reference compounds                       in the TME and visualize the infiltration of these cells into
(Figures 2A, B). ARG2 catalyzes an identical chemical reaction              tumors, we performed immunohistochemical double staining for
and exhibits 60% sequence identity with ARG1 (37).                          Arg1 and Iba1 (a marker of microglia/macrophages), and for
    To evaluate the effects of these novel arginase inhibitors on           CD8 (a marker of cytotoxic T cells, present also on NK cells).
glioma invasion, we performed a Matrigel invasion assay using               Mice were treated with OAT-1746 at 50 mg/kg twice a day. In
two human glioma cell lines: U87-MG (Figure 2C) and LN18                    parallel, we evaluated the effect of anti-PD-1 antibody which was
(Figure 2D). Immortalized BV2 microglial cells, similarly to                injected intraperitoneally on days 8, 10, 12 and 14 post-
primary microglial cultures, support glioma invasion (38). In co-           implantation. The administration of OAT-1746 or anti-PD-1
cultures, glioma invasion was strongly induced in the presence of           treatment did not change the accumulation of Iba1+ and Arg1+
BV2 microglial cells and all three arginase inhibitors significantly         cells in experimental gliomas (Figure 3D). CD8+ cells were
decreased the proportion of invading cells. OAT-1746 at a                   distinctly located at the invasive tumor margin and more
concentration of 11 µM reduced microglia-induced invasion of                CD8+ cells were detected in animals with smaller tumors
glioma cells more efficiently than the reference compound OAT-               (Figure 3E). As tumor cells displayed red fluorescence,
90 and the older generation inhibitor OAT-1617. The inhibitory              evaluation of brain sections allowed quantification of a tumor
effect of OAT-1746 on glioma invasion was concentration-                    growth. OAT-1746 treatment did not reduce the tumor growth
dependent, whereas this dependence was not observed for                     when compared to the control group. However, among anti-PD-
OAT-90 (Figure 2E). Representative images from Matrigel                     1 treated animals we noticed two groups with different tumor
invasion assays show an increased number of invading glioma                 sizes, which is consistent with a division into responders and
cells in co-cultures with BV2 cells and the inhibitory effect of 11         non-responders observed in patients (Figure 3F). Quantification
µM OAT-1746 (Figure 2F). These results demonstrate that the                 of CD8+ T cell densities at the invasive tumor margin showed an
inhibition of arginase activity reduced microglia-dependent                 increased number of CD8+ cells in responders when compared to
invasion of human glioma cells.                                             non-responders (Figure 3G). Non-responders had also a lower
    To assess the potential toxicity of OAT-1746, we determined the         density of CD8+ T cell than OAT-1746-treated animals. These
effects of increasing drug concentrations on cell viability by              findings show that the arginase inhibitor alone is not capable of
performing MTT metabolism assays on human glioma cells                      inhibiting glioma growth and anti-PD-1 treatment induces the
(Figure 2G), murine microglial BV2 cells (Figure 2H), and                   response in a half of animals.
murine primary microglia cultures (Figure 2I). The OAT-1746
inhibitor was not toxic towards the tested cells at concentrations up       Combined OAT-1746 and Anti-PD-1
to 1000 µM; a decrease in the viability of U87-MG cells was                 Treatment Reduces Glioma Growth
observed at the highest concentration, which exceeds by over two            Antitumor immunity can be blocked by more than one
folds of magnitude the effective IC50 concentration of the inhibitor.       suppressive mechanism, including the expression of immune
The results provide evidence for the efficacy of the new compound            checkpoint proteins and the depletion of essential nutrients from
and its safety at therapeutically relevant concentrations.                  TME (39). We assumed that combining OAT-1746 with an
                                                                            immune-modulating agent, such as anti-PD-1 antibody, might
OAT-1746 Treatment Increases Arginine                                       improve drug efficacy. Tumor growth was monitored by
Levels in the Brain and Plasma but Does                                     measuring luminescence signal 14, 21 and 28 days after
Not Show an Antitumor Activity                                              implantation of GL261 tdTomato + luc + glioma cells.
To study the antitumor activity of the arginase inhibitor OAT-1746,         Representative images of gliomas at different time points are
we employed a syngeneic model of GL261 mouse glioma cells                   shown (Figure 4A). While OAT-1746 alone did not show any
implanted into immunocompetent C57BL/6J mice. GL261 glioma                  effect on the tumor volume and the anti-PD-1 treated animals
cells were stably transfected with constructs allowing the expression       were split into responders and non-responders, the combined
of a red fluorophore tdTomato and luciferase to visualize tumor              treatment resulted in significantly reduced glioma growth at day
growth using in vivo imaging. Tumor-bearing mice received OAT-              28. The combination of OAT-1746 with anti-PD-1 delayed, and
1746 (50 mg/kg) or saline twice a day by oral gavage.                       in some cases abrogated, tumor growth. Effects of treatment and time
    First, we determined if the arginase inhibitor crossed the              of tumor progression were calculated with multifactorial ANOVA
blood-brain-barrier (BBB) by measuring directly the level of the            (Figure 4B). Both the “treatment” effect F3,89 (4.801)=0.004 and the
drug as well as the level of L-arginine - a substrate of arginase, in       “time after implantation” effect F2,89(4.726)=0.011 were significant.
the brains and sera of mice after 14 days of OAT-1746 treatment.            Tukey’s honest significant difference (HDS) post hoc test was
The brain and plasma were taken 2 h after the last drug                     used to compare experimental groups and p values were as
administration. OAT-1746 was detected in the brain extracts,                follows: CTR-OAT-1746 p=0.455, CTR-anti-PD-1 p=0.005,

Frontiers in Oncology | www.frontiersin.org                             7                                    August 2021 | Volume 11 | Article 703465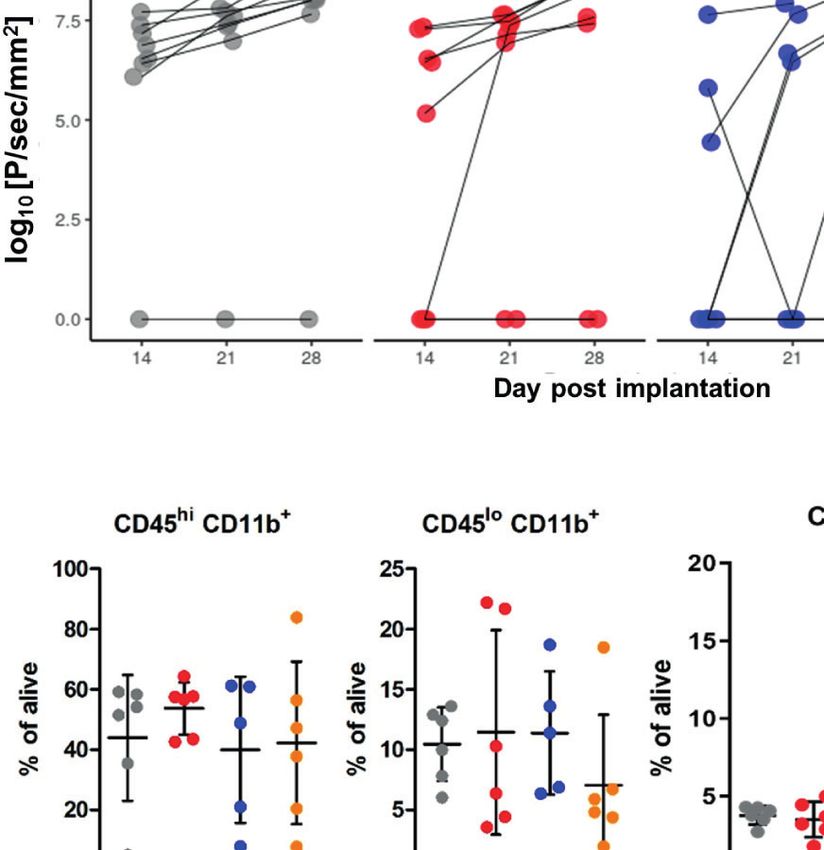
Pilanc et al.                                                                                              Arginase Inhibition Sensitizes Glioblastoma to Immunotherapy

                           A                                                           B

                           C                                                           D

                               E                                                       F

                               G                                    H                                 I

  FIGURE 2 | The effect of OAT inhibitors on human arginase 1/2 activity and microglia-induced glioma invasion. (A, B). The activity of two new and two reference
  ARG inhibitors was tested towards recombinant human ARG1 and ARG2 (hARG1 and hARG2, respectively) The IC values were determined. (C, D) Graphs
  represent relative invasion of (C) U87-MG or (D) LN18 cells induced by the co-culture with murine microglial cells (BV2). Tumor invasion was determined using a
  Matrigel matrix assay. Invasion of glioma cells co-cultured with BV2 cells is set as 100%. Three tested inhibitors (OAT-90, OAT-1617, OAT-1746) were used at 11
  µM concentration and all of them effectively reduced glioma invasion. Data are expressed relatively to a basal invasion in the absence of microglial cells. (E) The
  effects of OAT-90 and the second generation inhibitor OAT-1746 applied at 0.1 and 11 µM concentration on microglia induced invasion of U87-MG cells. Data are
  presented as means ± S.D and were calculated from three independent biological experiments. Statistical significance was evaluated using one-sample t-test.
  (F) The representative images of DAPI-stained U87-MG glioma cells on inserts show the nuclei of invading cells in the presence or absence of BV2, and OAT-1746.
  (G, I) The effect of OAT-1746 on cell viability was determined using MTT metabolism test. Cells were incubated for 24 h with or without OAT-1746 at given
  concentrations. The influence of OAT-1746 on the viability of (G) U87-MG human glioma cells, (H) BV2 microglial cells and (I) primary murine microglia was
  determined. Data are presented as means ± S.D (n=3 independent biological experiments). Significance of differences between the treatments was evaluated using
  one-way ANOVA followed by Dunnett’s post-hoc test, p-Values were considered as significant when ***p < 0.001; **p < 0.01; *p < 0.05.

Frontiers in Oncology | www.frontiersin.org                                        8                                        August 2021 | Volume 11 | Article 703465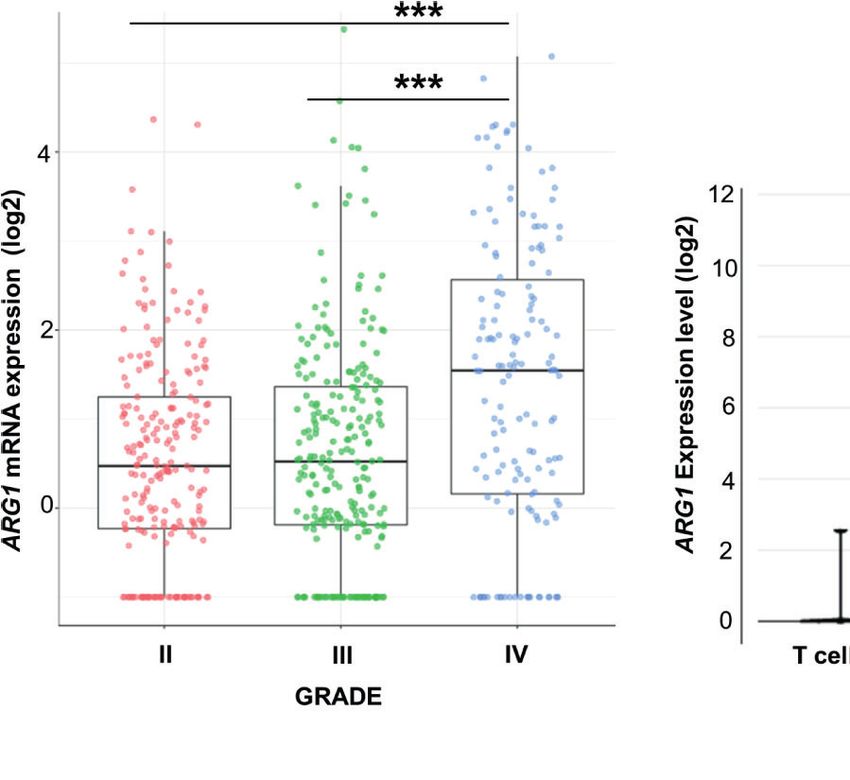
Pilanc et al.                                                                                            Arginase Inhibition Sensitizes Glioblastoma to Immunotherapy

                        A                                       B                                         C

                       D                                                    E

                            F                                                         G

  FIGURE 3 | Treatment with OAT-1746 increases arginine levels in the brain and plasma but has no antitumor activity against murine GL261 gliomas. (A–C) Tumor-
  bearing mice were treated with OAT-1746 twice a day and samples were collected 2 h after the last dosing (n = 6 per group). Concentrations of OAT-1746 (A) and
  L-arginine in tumor-bearing brains (B) and plasma (C) from the same animals were measured by LC/MS at day 14 post-implantation. The results were compared
  using the non-parametric Mann-Whitney test. **p < 0.01. (D) Mice with implanted GL261 tdTomato+luc+ glioma cells received orally saline CTR (n=12) or OAT-1746
  50 mg/kg twice a day for 21 days (n=12). A separate group received anti-PD-1 antibody (2.5 mg/kg, i.p.) at days 8, 10, 12 and 14 (n=5). Representative images of
  the glioma-bearing brains (at day 21) stained with anti-Iba1 (in red) and anti-Arg1 (in green) antibodies, and co-stained with DAPI are shown. (E) Representative
  confocal microscopy images of CD8+ T and NK cells within the tumors after OAT-1746 or anti-PD-1 antibody administration. The yellow line separates tumor areas
  (with glioma cells showing red fluorescence) and the parenchyma border; cell nuclei are counterstained with DAPI (blue); magnification x60. Yellow arrows indicate
  the accumulation of CD8+ cells (in green) in the responder PD-1 inhibition but not in the non-responder. (F) Quantification of tumor volumes at day 21 post-
  implantation. Each individual from CTR (n=12), OAT-1746 (n=12) and anti-PD-1 (n=5) groups is shown. In the checkpoint inhibitor treatment group non-responders
  (n=2) and responders (n=3) are marked in dark and light blue, respectively. Tumor areas were measured using ImageJ in every sixth brain slice, and tumor volumes
  were calculated; the mean ± SEM, p values were calculated using the Mann–Whitney U-test. (G) Quantification of CD8+ cells related to the total number of cells in
  the area of interest. The cells were counted using ImageJ software and average values from 5 fields are presented. Significance was calculated with One-Way
  ANOVA, Bonferroni’s multiple comparison test was used to compute p values (CTR n=6; OAT-1746 n=6, anti-PD-1 n=4); **p < 0.01.

CTRL-COMB p=0.021, COMB-OAT-1746 p=0.46, COMB-anti-                                   out of 8 animals developed tumors in the COMB group, while
PD-1 p=0.96. These results provide evidence that combining                            there were 5 out of 8 mice with tumors in OAT-1746-
arginase inhibition with targeting immune checkpoints could be                        treated cohort.
an effective strategy to reduce glioma growth. Administration of                         To further investigate the immune cell-mediated mechanism
the drug delayed tumor growth. Inhibition of glioma growth was                        of action of OAT-1746 and anti-PD-1, flow cytometry was
augmented when two agents were combined. At day 14 only 2                             performed on cells isolated from tumors, and changes in

Frontiers in Oncology | www.frontiersin.org                                       9                                       August 2021 | Volume 11 | Article 703465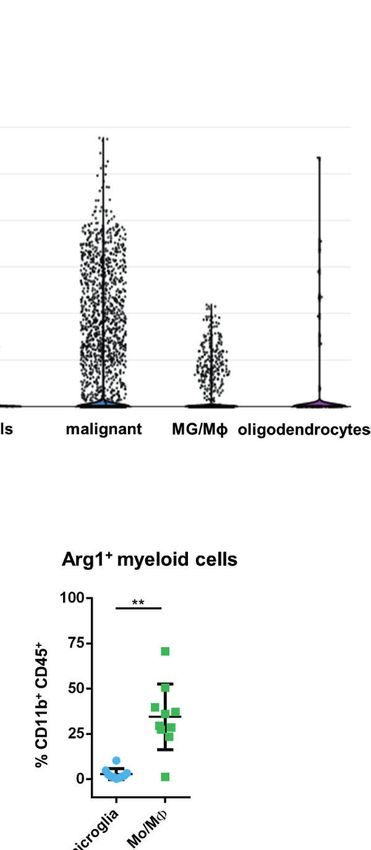
Pilanc et al. Arginase Inhibition Sensitizes Glioblastoma to Immunotherapy
A
B
C
FIGURE 4 | Combined OAT-1746 and anti-PD-1 treatment reduces glioma growth. Mice were implanted with GL261 tdTomato+luc+ glioma cells and received
saline (CTR), OAT-1746 (twice a day) alone or anti-PD-1 antibody at day 8, 10, 12 and 14 alone or in combination (COMB). (A) Representative images of tumor
bioluminescence with Bruker Xtreme imaging. Color intensity represents a relative luciferase signal. Bioluminescence signals are plotted as photon/sec/mm2 against
time at indicated days post-implantation. (B) Tumor size measured using in vivo bioluminescence imaging at various times post-implantation. The effect of treatment
and time on tumor progression was assessed with factorial ANOVA; treatment effect F3,89= 4.801, p=0.004, day post-implantation effect F2,89 = 4.726, p=0.011,
and Tukey HSD post hoc test: CTRL-OAT padj=0.455, CTRL-CHECK padj=0.005, CTRL-COMB padj=0.021, COMB-OAT-1746 padj=0.46, COMB-anti-PD-1
padj=0.96. (C) At day 28 post-implantation animals were perfused with PBS, control and tumor-bearing brains were removed and processed to isolate myeloid cells
by FACS. Percentages of peripheral macrophages (CD11b+CD45hi), microglia (CD11b+CD45lo), CD3+ and NK1.1+ cells were evaluated. Significance of differences
between groups was assessed with One-Way ANOVA followed by Bonferroni’s multiple comparison test. p-Values were considered as significant when **p < 0.01;
*p < 0.05.
specific immune cell populations were quantified. Gating blood-derived macrophages (CD11b+CD45high) in
strategy is shown in the Supplementary Figure 2. The experimental gliomas. We noticed an increase in NK cells,
administration of OAT-1746 or anti-PD-1 treatment did not however it did not reach statistical significance in anti-PD-1-
change the percentage of microglia (CD11b+CD45low) and treated animals compared to control group. An increased
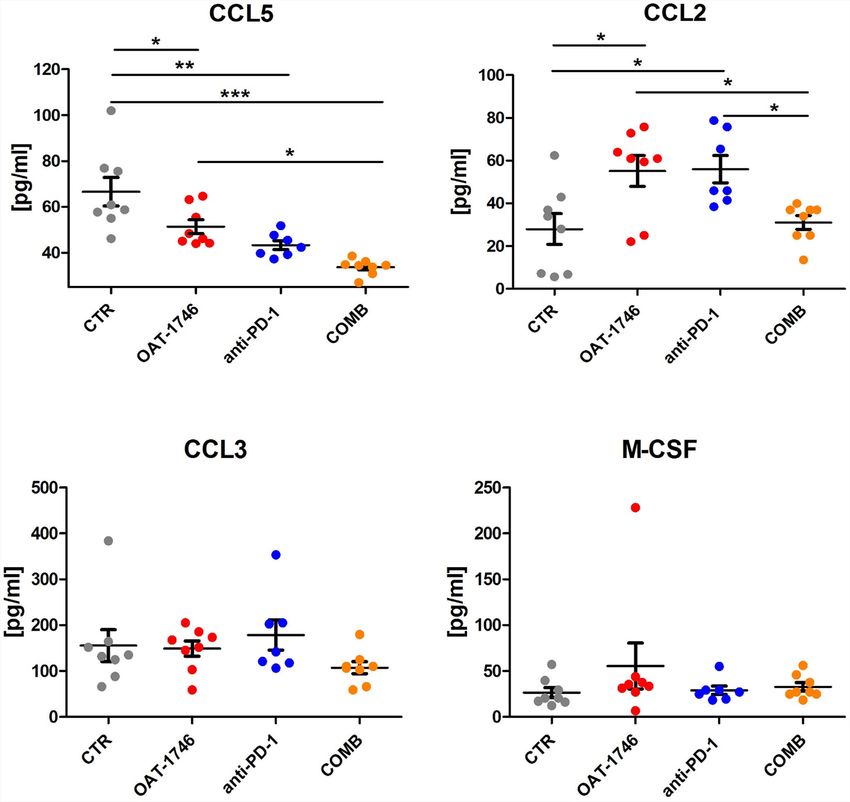
Frontiers in Oncology | www.frontiersin.org 10 August 2021 | Volume 11 | Article 703465Pilanc et al. Arginase Inhibition Sensitizes Glioblastoma to Immunotherapy percentage of CD3+ T cells was observed in the majority of receptor CCR2 controls the migration of regulatory T cells (Treg) animals in the COMB group (Figure 4C). These results provide and myeloid suppressor cells (41), as well as their ability to evidence that combining arginase inhibition with targeting the promote tumor growth (42). The CCL5/CCR5 axis directs immune checkpoint, could be an effective strategy to improve infiltration and interactions between monocytes/macrophages immunotherapy outcome. and mesenchymal stem cells. CCR5 is highly expressed in To obtain more insights regarding the enhancement of glioblastoma, controls glioma invasion and its expression is immunotherapy, we determined the levels of pro- and anti- associated with the poor prognosis of GBM patients (43, 44). inflammatory cytokines in the blood (plasma) collected 2 h after the last administration of OAT-1746. The levels of CCL5 (C-C Transcriptomic Profiles of CD11b+ From Motif Chemokine Ligand 5) were reduced in both OAT-1746 or OAT-1746 Treated Animals Show Reduced anti-PD-1 treated animals but the observed decrease was much Expression of Tumor Supportive Genes stronger in animals treated with the combination of two agents While OAT-1746 treatment alone showed no antitumor activity, (Figure 5). Interestingly, both OAT-1746 and anti-PD-1 treated it increased the therapeutic efficacy of PD-1 inhibition in murine animals showed higher levels of the cytokine CCL2 and this effect gliomas. To gain insights into potential mechanisms of the was abrogated in animals receiving the combination (Figure 5). observed phenomenon, we compared the transcriptomic The levels of CCL3 and M-CSF (macrophage colony stimulating profiles of glioma-associated CD11b + cells isolated from factor, Csf1) were not changed by the treatments. C–C motif control mice (CTR), mice treated with anti-PD-1, OAT-1746 chemokine ligand 2 (CCL2) and CCL5 are the main chemokines or a combination of both (COMB). CD11b+ cells were sorted involved in monocyte migration to tumors (40). CCL2 via its from tumor-bearing hemispheres as previously described (34) FIGURE 5 | The effect of treatment on the levels of pro- and anti-inflammatory cytokines. The levels of pro/anti-inflammatory cytokines were determined in blood plasma of the animals from the experimental groups described above using a multiplexed bead-based assay and Luminex technology (MAGPIX). Histograms show the levels of tested cytokines in pg/mL; the results are shown as means ± SEM; significance was assessed with One–Way ANOVA and Bonferroni’s multiple comparison test, ***p < 0.001; **p < 0.01; *p < 0.05. Frontiers in Oncology | www.frontiersin.org 11 August 2021 | Volume 11 | Article 703465
Pilanc et al.                                                                           Arginase Inhibition Sensitizes Glioblastoma to Immunotherapy

and the gating strategy is shown in the Supplementary Figure 3.          in the antitumor immune response, such as those encoding for
CD11b + cells immunosorted from GL261 tumor-bearing                      nitric oxide synthase (Nos2), IFNg (Ifng), Tlr4 (Tlr4), and CD86
hemispheres encompass microglia, infiltrating monocytes/                  (CD86), which provides co-stimulatory signals necessary for T-
macrophages and BAMs, as well as granulocytes, certain                   cell activation, has been demonstrated in the COMB group.
subpopulations of dendritic cells and NK cells (34). RNA                     Treatment with OAT-1746 resulted in a reduced expression
sequencing of total RNA isolated from CD11b+ cells was                   of genes related to DNA replication and cell cycle progression,
followed by computational analyses of differentially expressed           including topoisomerase 2a (Top2a), cyclin B1, E1 and E2
genes and detection of altered signaling pathways.                       (Ccnb1, Ccne1, Ccne2); spindle and kinetochore-associated
    OAT-1746 had the greatest impact on the transcriptome of             complex subunit 1, 2 and 3 (Ska1, Ska2, Ska3), as well as
CD11b+ cells and over 1800 genes were identified as differentially        mitotic checkpoint kinase Bub1b (Bub1b) and aurora kinase B
expressed genes (DEG) between the OAT-1746 and CTR groups                (Aurkb), which are involved in chromosome segregation during
(padj
Pilanc et al. Arginase Inhibition Sensitizes Glioblastoma to Immunotherapy
A B
C
D
FIGURE 6 | Transcriptomic profiles of CD11b+ from OAT-1746-treated mice show reduction of the pro-tumor phenotype genes and upregulation of gene
expression indicative of antitumor responses. (A–D) Gene expression profiling was performed by RNA-seq of CD11b+ cells from the tumor-bearing hemispheres of
mice from the experimental groups at day 21 post-implantation. (A) Venn diagram showing the number of differentially expressed genes (DEG) between OAT-1746,
anti-PD-1 and COMB compared to the CTR group (padjPilanc et al. Arginase Inhibition Sensitizes Glioblastoma to Immunotherapy
CCR2+Ly-6C+ monocytic MDSCs in murine gliomas (41). The Aurkb) and changes in their functions. High expression of
combination of PD-1 blockade and CCR2 inhibition (both inflammation mediators such as genes coding for Gpr34 and
genetic and pharmacological with the CCR2 agonist CCX872) Duoxa1 indicates a switch to the pro-inflammatory phenotype.
improved survival of KR158 glioma-bearing mice, and reduced This is consistent with the requirement of the arginase activity
accumulation of CD11b+/Ly6Chi/PD-L1+ MDSCs in gliomas. for the production of L-ornithine and polyamines for cell
The combined treatment resulted in increased TILs infiltration, proliferation (46).
IFNg expression and the decreased expression of exhaustion Moreover, OAT-1746 treatment affects the expression of
markers in CD4+ and CD8+ T cells (55). genes involved in leukocyte chemotaxis (Ccl2, Ccl7, Ccl17) and
Exploring various public datasets we found the elevated supporting glioma migration and invasion (Cme1, S100a4 and
expression of ARG1 and ARG2 in high grade gliomas, in Mmp14). Ccl2 and Ccl7 control the recruitment of monocytes
particular in highly aggressive GBMs. Interrogation of single- and neutrophils to the inflamed or tumor tissues, while Ccl17
cell sequencing data from gliomas shows ARG1 and ARG2 attracts regulatory T cells (47). MMP14 (MT1MMP) is a
expression in both malignant cells and microglia/macrophages metalloproteinase upregulated in GAMs, which activates
in human high grade gliomas. Both arginase isoforms are MMP2 and ECM degradation (48). Clec12a and Clec4a1,
expressed in myeloid cells in murine experimental gliomas, which encode dendritic cell inhibitory receptors, were
however Arg1 mRNA levels are significantly higher than Arg2. downregulated in the OAT-1746 group.
Moreover, Arg1, a phenotypic marker of immunosuppressive Ccl2 is released by many cells present in the tumor
myeloid cells, is expressed mainly in infiltrating monocytes as microenvironment, including stromal cells, leukocytes,
compared to microglia. endothelial cells, and malignant cells, which results in
Newly developed ARG1/2 inhibitors showed a comparable augmentation of the plasma chemokine levels (58). Despite
inhibitory efficacy towards recombinant proteins in vitro as two decreased expression of Ccl2 mRNA in CD11b + cells
reference inhibitors and several compounds described in the immunosorted from the tumor-bearing brains of OAT-1746-
literature (56). In microglia-glioma co-cultures, which are used treated animals, the other cells in the tumor microenvironment
to model microglia-induced glioma invasion, OAT-1746 at could still be the source of the cytokine and augment Ccl2 plasma
micromolar concentrations strongly reduced glioma invasion, levels. In humans and in animal glioma models, increased CCL2
and this effect was concentration dependent. The reference expression has been associated with high number of GAMs
compound was less effective and did not show any dose infiltrating tumor tissues, increased angiogenesis and tumor
dependency. OAT-1746 up to the concentration of 1 mM was invasion, and poor clinical prognosis (59–61). Impact of
not toxic to two types of microglial cells and glioma cells, only a increased Ccl2 and decreased Ccl5 plasma levels in OAT-1746
20% reduction of the cell viability was detected in U87-MG treated animals on the outcome of potential treatment requires
glioma cells treated with this high dose of the drug. The further investigation. Measuring the levels of cytokines in the
concentration that showed toxicity exceeds by over two orders brain or tumor tissue would provide additional insights into the
of magnitude the effective concentration of the inhibitor. The mechanism of action of mono- and combined therapies
results provide evidence for the efficacy of a new compound and its Interestingly, the transcriptomic analysis showed the
safety in therapeutically relevant concentrations. Moreover, in the upregulation of several genes implicated in antitumor immune
previous studies OAT-1746 showed no toxicity in experimental responses such as Nos2, Ifng, Tlr4 and CD86 upon the
animals after multiple oral dosing in mono- or combinatorial combinatorial therapy. Genes associated with differentiation
therapies in other tumor models (36, 57). The presented data and cytotoxic activity of NK cells were significantly
provide a strong rationale for using an ARG1 inhibitor OAT- upregulated upon anti-PD-1 treatment and COMB therapy.
1746 to block the pro-tumor activity of GAMs. OAT-1746 The CD11b + population encompasses NK cells. The
penetrated BBB and significantly increased the concentration of upregulation of genes encoding NK surface proteins (Klrb1f,
arginine in the brain and plasma of the receiving mice. While OAT- Klre1, Klrc2), cytotoxic granule protein (Nkg7), T-Box
1746 did not affect the accumulation of microglia/macrophages transcription factor 21 (Tbx21), granzyme A (Gzma) and
(Iba1+ cells) and CD8+ cells, it considerably changed the perforin (Prf1), along with the upregulation of Serpinb6b and
transcriptomic profiles in CD11b+ immunosorted from tumor- Serpinb9b that protect leukocytes from the granzyme-mediated
bearing brains. cell death, suggests the restoration of NK cell functions.
OAT-1746 had the highest impact on the transcriptome of Downregulation of genes encoding proteins acting as the
CD11b+ cells in comparison to other treatments. Gene Ontology suppressors of the immune responses: ApoE, CD69 (50), and
(GO) term enrichment revealed a significant overrepresentation Cxcr4 in OAT-1746 and COMB groups indicates the restoration
of genes involved in GTPase-mediated signal transduction, of antitumor functions of CD11b+ cells, which may explain the
myeloid cell differentiation, NF-kB signaling and the regulation antitumor effect of the combination therapy. These results
of inflammatory responses, with simultaneous significant indicate how important for the effective immunotherapy is
downregulation of genes related to ribosome biogenesis, the reprogramming of TME. Altogether, our results
the cell cycle and DNA replication. These changes in demonstrate that combining OAT-1746 with PD-1 inhibition
transcriptome are consistent with the decreased proliferation of may be a promising strategy for the therapy of GBM patients.
GAMs (Top2a, Ccnb1, Ccne1, Ccne2, Ska1, Ska2, Ska3, Bub1b, The complexity of interactions in the tumor microenvironment,
Frontiers in Oncology | www.frontiersin.org 14 August 2021 | Volume 11 | Article 703465Pilanc et al. Arginase Inhibition Sensitizes Glioblastoma to Immunotherapy
arginase inhibition in different cells and anti-PD-1 inhibition ETHICS STATEMENT
resulting in changes of the immune compartment may explain a
low number of differentially expressed genes in the COMB group The animal study was reviewed and approved by The First
and a small overlap of OAT-1746 mono and combined treatment Warsaw Local Ethics Committee for Animal Experimentation
Future testing of the drug efficacy on established tumors, (approval no 562/2018).
alternatively to the currently studied preventive treatment
regimen, would provide additional information on a mode of
action and a translational potential of OAT-1746. ARG1 AUTHOR CONTRIBUTIONS
expression is substantially elevated in myeloid cells in cancer
and mitigates antitumor responses via multiple mechanisms. BK, PP, and AE-M designed the experiments, evaluated the data,
Arginase production by macrophages not only leads to the and wrote the manuscript. PP, KW, SC, AE-M, and NO
inhibition of antitumor response via L-arginine degradation, performed the experiments, data interpretation and wrote the
but also increases the proliferation of tumor cells, which is manuscript. BG performed RNA-seq and A-JR performed
associated with the production of L-ornithine and then computational analyses, data interpretation and edited the
polyamines. Moreover, L-arginine depletion in the tumor manuscript. MG, PS, RB, and PD synthesized the ARG1/2
microenvironment attenuates nitric oxide (NO) production inhibitors, performed enzyme inhibition tests and
and reduces its cytotoxic effects on tumor cells (62). determination of the inhibitor and arginine concentrations,
Cytotoxic lymphocytes require exogenous arginine for contributed to the data interpretation and edited the
proliferation (19, 21, 63) and low plasma arginine levels are manuscript. All authors contributed to the article and
linked to immunosuppression in cancer patients (64). Arginase 1 approved the submitted version.
expression in malignant cells and myeloid cells in the TME
represents a powerful mechanism for tumor immune evasion
(65). Dietary supplementation with L-arginine altered the
spectrum of TILs and enhanced cytotoxicity in human colorectal FUNDING
and breast cancers (66, 67). Elevation of arginine levels exerted Studies were supported by the project DIMUNO “Development
immune-stimulatory effects in various cancers, for example of new cancer therapies based on selective antitumor
blocking arginase activity with nor-NOHA in leukemic cells immunomodulators”- co-financed by the National Centre for
induced cell death (68) and treatment with another inhibitor CB- Research and Development, Poland and the Foundation for
1158 had antitumor effects in several non-CNS cancers in mice (24). Polish Science TEAM-TECH Core Facility project “NGS
Here we demonstrate that a novel, oral ARG1/2 inhibitor, which platform for comprehensive diagnostics and personalized
increases L-arginine levels in the brain and restores the functionality therapy in neuro-oncology” (KW, AJ-R, BG, BK).
of GAMs and NK cells, sensitizes murine gliomas to the PD-1
inhibition. The combination of OAT-1746 and anti-PD1 leads to
the elevation of a number of CD3+ T cells in the majority of tumors.
Our results support a rationale of combining compounds targeting ACKNOWLEDGMENTS
TME (such as OAT-1746) with PD-1 inhibition as a potential
strategy to treat GBM patients. We thank Beata Kaza for technical assistance, Julian Swatler for
help with flow cytometry.
DATA AVAILABILITY STATEMENT
SUPPLEMENTARY MATERIAL
The original contributions presented in the study are publicly
available. This data can be found here: National Center for The Supplementary Material for this article can be found online at:
Biotechnology Information (NCBI) Gene Expression Omnibus https://www.frontiersin.org/articles/10.3389/fonc.2021.703465/
under accession number GSE173865. full#supplementary-material
3. Galon J, Angell HK, Bedognetti D, Marincola FM. The Continuum of Cancer
REFERENCES Immunosurveillance: Prognostic, Predictive, and Mechanistic Signatures.
Immunity (2013) 39(1):11–26. doi: 10.1016/j.immuni.2013.07.008
1. Jemal A, Murray T, Ward E, Samuels A, Tiwari RC, Ghafoor A, et al. Cancer 4. Woroniecka KI, Rhodin KE, Chongsathidkiet P, Keith KA, Fecci PE. T-Cell
Statistics, 2005. CA Cancer J Clin (2005) 55(1):10–30. doi: 10.3322/ Dysfunction in Glioblastoma: Applying a New Framework. Clin Cancer Res
canjclin.55.1.10 (2018) 24(16):3792–802. doi: 10.1158/1078-0432.CCR-18-0047
2. Stupp R, Hegi ME, Mason WP, van den Bent MJ, Taphoorn MJ, Janzer RC, 5. Webster RM. The Immune Checkpoint Inhibitors: Where Are We Now? Nat
et al. Effects of Radiotherapy With Concomitant and Adjuvant Rev Drug Discov (2014) 13(12):883–4. doi: 10.1038/nrd4476
Temozolomide Versus Radiotherapy Alone on Survival in Glioblastoma in 6. Scheffel TB, Grave N, Vargas P, Diz FM, Rockenbach L, Morrone FB.
a Randomised Phase III Study: 5-Year Analysis of the EORTC-NCIC Trial. Immunosuppression in Gliomas via PD-1/PD-L1 Axis and Adenosine
Lancet Oncol (2009) 10(5):459–66. doi: 10.1016/S1470-2045(09)70025-7 Pathway. Front Oncol (2020) 10:617385. doi: 10.3389/fonc.2020.617385
Frontiers in Oncology | www.frontiersin.org 15 August 2021 | Volume 11 | Article 703465You can also read


