Size-selective mortality induces evolutionary changes in group risk-taking behaviour and the circadian system in a fish
←
→
Page content transcription
If your browser does not render page correctly, please read the page content below
Received: 3 April 2020   |   Accepted: 5 October 2020

DOI: 10.1111/1365-2656.13372

RESEARCH ARTICLE

Size-selective mortality induces evolutionary changes in group
risk-taking behaviour and the circadian system in a fish

Valerio Sbragaglia1,2                     | Jose Fernando López-Olmeda3                              | Elena Frigato4                  |
Cristiano Bertolucci4                      | Robert Arlinghaus1,5

1
 Department of Biology and Ecology of
Fishes, Leibniz-Institute of Freshwater           Abstract
Ecology and Inland Fisheries, Berlin,             1. Intensive and trait-selective mortality of fish and wildlife can cause evolutionary
Germany
2                                                       changes in a range of life-history and behavioural traits. These changes might in
 Department of Marine Renewable
Resources, Institute of Marine Sciences                 turn alter the circadian system due to co-evolutionary mechanisms or correlated
(ICM-CSIC), Barcelona, Spain
                                                        selection responses both at behavioural and molecular levels, with knock-on ef-
3
 Department of Physiology, Faculty of
Biology, Regional Campus of International
                                                        fects on daily physiological processes and behavioural outputs.
Excellence “Campus Mare Nostrum”,                 2. We examined the evolutionary impact of size-selective mortality on group risk-
University of Murcia, Murcia, Spain
4
                                                        taking behaviour and the circadian system in a model fish species. We exposed
 Department of Life Sciences and
Biotechnology, University of Ferrara,                   zebrafish Danio rerio to either large or small size-selective harvesting relative to a
Ferrara, Italy                                          control over five generations, followed by eight generations during which harvest-
5
 Division of Integrative Fisheries
                                                        ing was halted to remove maternal effects.
Management, Faculty of Life Sciences
& Integrative Research Institute on               3. Size-selective mortality affected fine-scale timing of behaviours. In particular, small
Transformations of Human-Environment
                                                        size-selective mortality, typical of specialized fisheries and gape-limited predators
Systems (IRI THESys), Humboldt-Universität
zu Berlin, Berlin, Germany                              targeting smaller size classes, increased group risk-taking behaviuor during feed-
                                                        ing and after simulated predator attacks. Moreover, small size-selective mortal-
Correspondence
Valerio Sbragaglia                                      ity increased early peaks of daily activity as well as extended self-feeding daily
Email: valeriosbra@gmail.com
                                                        activity to the photophase compared to controls. By contrast large size-selective
Funding information                                     mortality, typical of most wild capture fisheries, only showed an almost significant
Ministerio de Economía y Competitividad,
                                                        effect of decreasing group risk-taking behaviour during the habituation phase and
Grant/Award Number: IJC2018-035389-I
and RYC-2016-20959; Deutscher                           no clear changes in fine-scale timing of daily behavioural rhythms compared to
Akademischer Austauschdienst, Grant/
                                                        controls.
Award Number: 91632699; Ministerio de
Economía y Competitividad, Grant/Award            4. We also found changes in the molecular circadian core clockwork in response to
Number: RTI2018-100678-A-I00
                                                        both size-selective mortality treatments. These changes disappeared in the clock
Handling Editor: Sissel Jentoft                         output pathway because both size-selected lines showed similar transcription
                                                        profiles. This switch downstream to the molecular circadian core clockwork also
                                                        resulted in similar overall behavioural rhythms (diurnal swimming and self-feeding
                                                        in the last hours of darkness) independent of the underlying molecular clock.
                                                  5. To conclude, our experimental harvest left an asymmetrical evolutionary legacy in
                                                        group risk-taking behaviour and in fine-scale daily behavioural rhythms. Yet, the
                                                        overall timing of activity showed evolutionary resistance probably maintained by

This is an open access article under the terms of the Creative Commons Attribution-NonCommercial License, which permits use, distribution and reproduction
in any medium, provided the original work is properly cited and is not used for commercial purposes.
© 2020 The Authors. Journal of Animal Ecology published by John Wiley & Sons Ltd on behalf of British Ecological Society

J Anim Ecol. 2021;90:387–403.		wileyonlinelibrary.com/journal/jane                                                                                  |   387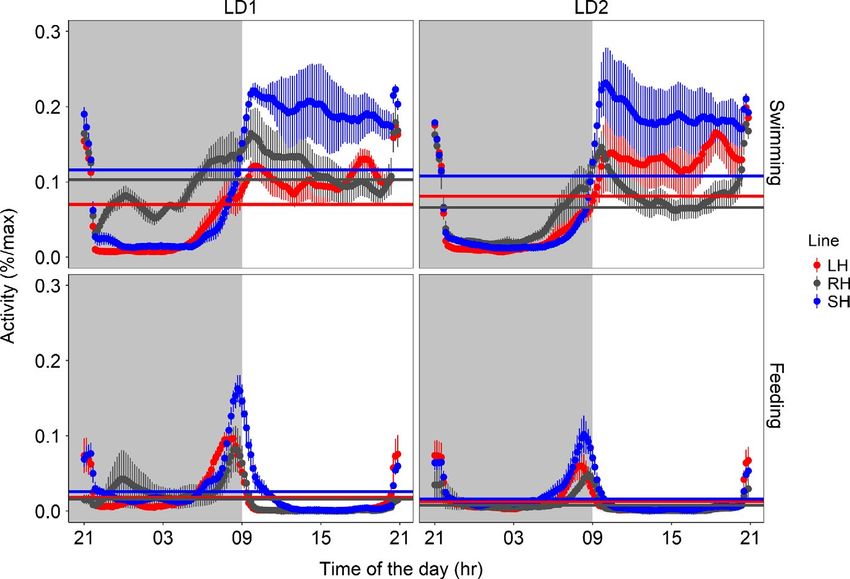
388 | Journal of Animal Ecology SBRAGAGLIA et al.
a molecular switch. Our experimental findings suggest that size-selective mortal-
ity can have consequences for behaviour and physiological processes.
KEYWORDS
activity, boldness, circadian clock, circadian switch, feeding behaviour, fisheries-induced
evolution, gene expression, life history
1 | I NTRO D U C TI O N Size-selective harvesting can affect behavioural traits through
at least two mechanisms (Figure 1). First, following the pace-of-life
Harvesting is among the five major forms of human-induced envi- syndrome (Réale et al., 2010), behavioural and life-history traits are
ronmental change (Díaz et al., 2019). Harvesting differs from many often correlated along a fast-to-slow continuum. Fast life-history
other forms of natural predation by primarily targeting adult individ- traits—those trait combinations favoured under intensive and
uals—a size class that typically experiences limited natural mortality large size-selective harvesting pressure (e.g. Andersen et al., 2018;
(Darimont et al., 2015). Intensive and trait-selective harvesting thus Jørgensen & Holt, 2013)—are expected to covary and co-evolve
can shift the fitness landscape and foster evolutionary adaptations with an increase of risk-taking behaviour (Réale et al., 2010; Wolf
at a rate and speed that is rarely experienced in the evolutionary his-
tory of many animal populations (Allendorf & Hard, 2009; Jørgensen Selective mortality of larger individuals
et al., 2007; Palumbi, 2001; Sih et al., 2011).
Empirical and modelling studies on the topic of fisheries-
induced evolution have suggested intensive fishing fosters evolution
of a fast life history that is characterized by elevated reproductive in-
vestment, reduced age and size at maturation and reduced post matu-
H1
ration growth and longevity (Heino et al., 2015; Jørgensen et al., 2007).
Fisheries-induced evolution might also affect behavioural and phys- Circadian system
iological traits due to direct selection, co-evolutionary mechanisms
and correlated selection responses (Hollins et al., 2018; Uusi-Heikkilä Fast life history Early peaks of locomotion
et al., 2008). However, behavioural and physiological adaptations to
Amplitude and robustness
fishing are much less studied compared to adaptive changes in life-his- of circadian clock genes
tory traits (Heino et al., 2015). H2
Risk-taking behaviour
The proximate mechanisms governing fisheries-induced evolution H3
of behaviour, as well as other traits, are difficult to disentangle in the
wild because phenotypic changes observed in time series (e.g. changes
F I G U R E 1 The conceptual framework of the putative
in average age at maturation) can be masked by phenotypic plasticity, mechanisms driving evolution of risk-taking behaviour and
i.e. non-genetic changes in trait expression (Heino et al., 2015). One circadian system in response to size-selective mortality. The figure
means to single out the cause-and-effect of fishing is conducting se- showed large size-selective mortality typical of many fisheries
lection experiments with model species in the laboratory (Conover & and specialized predators targeting larger size classes. The same
conceptual framework with opposing outcomes is valid for small
Baumann, 2009; Diaz Pauli & Heino, 2014). Several laboratories have
size-selective mortality typical of specialized fisheries and most
investigated the evolutionary effects of size-selective harvesting on
gape-limited predators. In particular, large size-selective harvesting
behaviour by means of selection experiments with different model fish triggers the evolution of a fast life history, which in turn can co-
species (e.g. Diaz Pauli et al., 2019; Philipp et al., 2009; Uusi-Heikkilä evolve with an increase of both risk-taking behaviour and early
et al., 2015; Walsh et al., 2006). This line of research has largely focused peaks of locomotor activity (small dotted arrows). However, a
on evolutionary changes of individual behavioural traits such as bold- plausible scenario is that harvesting disrupts the correlation of
life history with other behavioural traits. Therefore, a further
ness. However, a focus on group behaviour is crucial to fully understand
possibility is that large-size selective harvesting triggers the
the evolutionary changes in response to fishing or other forms of natural evolution of a decrease risk-taking behaviour through a correlated
mortality because collective behaviours such as shoaling might be key selection response with size-at-harvest (bold arrow and first
drivers of the capture process (e.g. Parrish, 1999; Tenningen et al., 2016) hypothesis tested here; H1). Consequently, a decrease of risk-
and could also have adaptive value to reduce exposure to natural pred- taking behaviour may affect the circadian system by triggering
a decrease of early locomotor activity rhythms (bold arrow and
ators (Pitcher, 1986; Sumpter, 2010). More work is needed to under-
second hypothesis; H2), and reducing amplitude and robustness of
stand whether and to what degree intensive size-selective mortality can
circadian clock gene expression (bold arrow and third hypothesis;
affect individual and group behavioural traits in fish and other species H3). For more details, see the main text (Fish pic source: https://
(Andersen et al., 2018; Arlinghaus et al., 2017; Diaz Pauli & Sih, 2017). pixy.org/4660397/)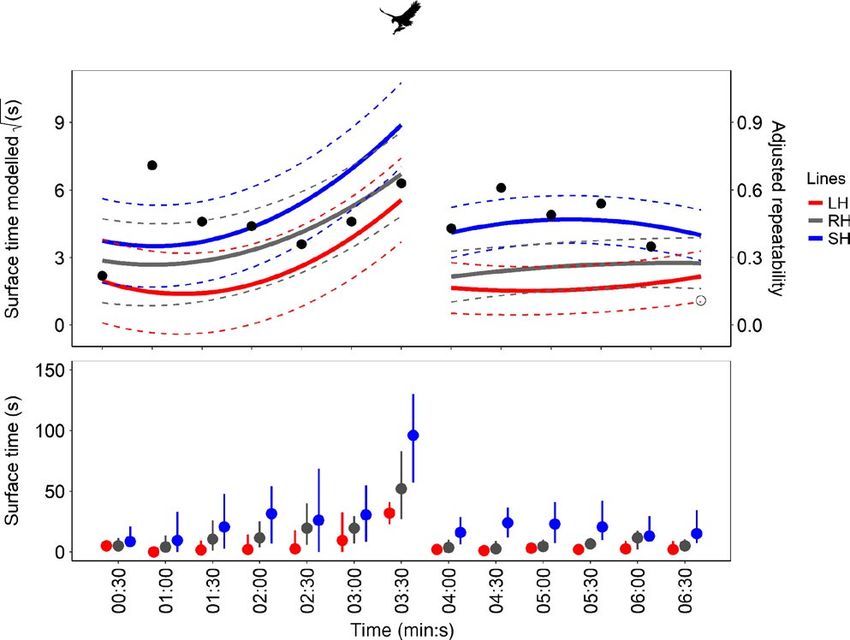
SBRAGAGLIA et al.                                                                                                    Journal of Animal Ecology   |   389

et al., 2007; Figure 1). The argument is that acquiring the resources       (vice versa for faster-running circadian clocks; Nikhil & Sharma, 2017
needed to maintain a fast life history (i.e. rapid juvenile growth or       and references therein). Moreover, the clock gene clock (i.e. a gene
high reproductive investment) favours risky behaviours, such as             that is part of the core transcription-translation feedback loop of the
feeding, in the presence of predators. Under such scenario, large           molecular circadian clockwork in fish; Vatine et al., 2011) is mainly
size-selective harvesting is expected to evolutionarily increase            mapped in regions related to life-history traits in salmonids (Leder
risk-taking behaviour (Figure 1). Yet, recent refinements of the pace-      et al., 2006; Paibomesai et al., 2010). This suggests that life history
of-life syndrome hypothesis suggest that specific ecological con-           changes induced by harvesting could co-evolve with the circadian
texts (e.g. variation in natural mortality risk) could systematically       clock (e.g. Leder et al., 2006; Nikhil & Sharma, 2017). Moreover,
break apart the genetic correlation of life-history and behavioural         proactive (i.e. more risk taking) zebrafish have shown more robust
traits (Dammhahn et al., 2018; Montiglio et al., 2018). Indeed, obser-      diurnal rhythms at molecular, endocrine and behavioural level than
vational (Dhellemmes et al., 2020; Polverino et al., 2018) and theo-        reactive ones (Tudorache et al., 2018). Therefore, harvesting-in-
retical (Andersen et al., 2018; Claireaux et al., 2018) studies in fish     duced evolution of risk-taking behaviour can also be expected to
have suggested that the covariance of life-history and risk-taking          affect the circadian system both at behavioural and molecular levels
behavioural traits may change in response to mortality-based selec-         (Figure 1). Studying both levels is relevant because different molec-
tion pressures. It is thus equally plausible that intensive and large       ular processes can underlie similar phenotypic outcomes, as recently
size-selective harvest may foster the evolution of both a fast life         demonstrated in a harvesting-induced evolution experiment using
history and a decrease of risk-taking behaviour, in particular when         Atlantic silversides, Menida menida (Therkildsen et al., 2019).
size-selection is strongly directed to very large and mature individu-         We take advantage of a long-term harvesting experimental system
als (Andersen et al., 2018).                                                based on zebrafish (Uusi-Heikkilä et al., 2015). The zebrafish selec-
   Second, fish behavioural traits can evolve in response to cor-           tion lines were exposed to strong directional harvest selection (a 75%
related selection responses linked to size-selective mortality due to       per-generation harvest rate) acting on either large (large-harvested
a systematic positive correlation of specific behaviours, growth rate       line; a common scenario in many fisheries world-wide and in presence
and size-at-age (Biro & Post, 2008; Biro & Sampson, 2015; Klefoth           of predators where large individuals are selectively preyed upon) or
et al., 2017). Specifically, behavioural traits related to resource ac-     small (small-harvested line; a possible scenarios in specific fisheries or
quisition, such as risk-taking behaviour during foraging (defined as        in the presence of gape-limited predators that preferentially feed on
boldness), increase food intake and thereby elevate growth rate             the smaller size classes) fish, relative to a control line harvested ran-
and affect size-at-age (Enberg et al., 2012). In scenarios where the        domly with respect to body size (Uusi-Heikkilä et al., 2015). Previous
larger individuals have a higher risk of mortality due to fishing or        research has shown that the large-harvested line evolved a faster life
to specialized natural predators, selective removal of these larger-,       history characterized by smaller adult length and weight, higher rela-
faster-growing individuals might also indirectly favour a decrease of       tive fecundity and elevated senescence compared to controls (Uusi-
risk-taking behaviour (Biro & Post, 2008). Consequently, selective          Heikkilä et al., 2015; see Figure S1). By contrast, the small-harvested
harvesting of large fish might evolutionarily favour a decrease of          line showed a slower life history compared to controls, characterized
risk-taking behaviour (Figure 1).                                           by reduced reproductive investment and no change in adult length
   Evolutionary changes in behavioural traits can in turn affect the        compared to the control line (Uusi-Heikkilä et al., 2015). Other previ-
circadian system (Figure 1). Recent studies have reported a rela-           ously documented changes include evidence for genetic and genomic
tionship between copying style (or animal personality), particularly        changes, i.e. the differences among the selection lines were indica-
risk-taking behaviour and the circadian system in zebrafish Danio           tive of evolutionary and not just plastic adaptations (Uusi-Heikkilä
rerio (Rey et al., 2013; Tudorache et al., 2018). The circadian system is   et al., 2015, 2017). Size-selection occurred during the first five genera-
widely conserved phylogenetically (Panda et al., 2002) and controls         tions, but the size-selected lines maintained their key life history adap-
daily rhythms of physiology and behaviour (Dunlap et al., 2004).            tations after harvesting halted for up to eight generations (Sbragaglia,
Thereby, circadian rhythms fulfill an adaptive function helping the         Gliese, et al., 2019; Uusi-Heikkilä et al., 2015), indicating that har-
organism to anticipate and maintain synchronization to external             vesting-induced evolution of life-history traits did not recover to
24-hr environmental cycles (Cowan et al., 2017; Idda et al., 2012;          pre-harvesting levels (Figure S1). The fixation of the harvesting-induced
Kronfeld-Schor & Dayan, 2003). Functional circadian clocks are es-          changes in life history after harvesting halted is a precondition to allow
sential for precise timing of activity, thereby helping the organism        a comparison among the selection lines in terms of harvesting-induced
to avoid or minimize the risk of predation while maximizing foraging        evolution of behaviour and the circadian system. Addressing this ques-
(DeCoursey et al., 2000).                                                   tion was the aim of the present research (Figure 1).
   Evolutionary changes of the circadian system in exploited pop-              We predicted (H1 in Figure 1) that evolution of group risk-taking
ulations may also occur due to the interplay between the evolution-         behaviour is governed by a resource acquisition mechanism in a way
ary responses to life history and behaviour (Figure 1). Experimental        that faster growth rate is correlated with an increase of group risk-tak-
evolution in Drosophila melanogaster indicated that selection for           ing behaviour (Enberg et al., 2012). Therefore, the selective removal of
slower-running circadian clocks could result in slower rates of de-         the larger, faster-growing individuals is predicted to result in the evo-
velopmental processes, which in turn can delay development time             lution of decreased group risk-taking behaviour in the large-harvested
390    |   Journal of Animal Ecology                                                                                                   SBRAGAGLIA et al.

line, and vice versa for the small-harvested line. Second, we predicted         feeding and maintained under the following conditions: water tem-
that a decrease of group risk-taking behaviour in the large-harvested           perature at 26 ± 0.5°C; photoperiod at 12:12 hr Light–Darkness (LD)
line triggers changes in the circadian system both at behavioural and           cycle (lights on/off at 07:00 and 19:00 respectively); fed three times
molecular levels (Rey et al., 2013; Tudorache et al., 2018). If this is true,   per day with dry food (TetraMin, Tetra, Germany) mainly in the first
we expected the absence of early peaks of locomotor activity (H2 in             part of the light hours (at 09:00; 11:00 and 13:00). Fish were reared
Figure 1), because a decrease of risk-taking behaviour has been associ-         and manipulated following the guidelines of the European Union
ated with the absence of clear peaks of activity in zebrafish (Tudorache        (2010/63/EU) and the Spanish legislation (RD 53/2013 and Law
et al., 2018), and vice versa for the small-harvested line. Third, at the       32/2007). The experimental protocols were approved by the Spanish
molecular level, we expected that the large-harvested line lost circa-          National Committee and the Committee of the University of Murcia
dian rhythmicity of clock genes (H3 in Figure 1), because a decrease of         on Ethics and Animal Welfare (reference number A13191003).
risk-taking behaviour has been associated with a loss of robustness and            Behavioural traits and circadian rhythms are sensitive to so-
amplitude in clock genes expression (here quantified as circadian rhyth-        cial modulation (Bloch et al., 2013; Castillo-Ruiz et al., 2012; Jolles
micity; Tudorache et al., 2018), and vice versa for the small-harvested         et al., 2017), and previous results showed that the selection lines be-
line. Following well-established knowledge of the functioning of the            haved differently when tested in isolation or in groups (Sbragaglia, Alós,
zebrafish circadian system (e.g. Idda et al., 2012; Vatine et al., 2011), we    et al., 2019). Indeed, being in a group has important consequences
focused our investigation on carefully selected genes related to funda-         for foraging behaviour in zebrafish (Harpaz & Schneidman, 2019;
mental properties of the circadian system functioning, such as the core         Pitcher, 1986), and social isolation can create stress-related be-
transcriptional–translational feedback loop (Dunlap et al., 2004; Vatine        haviours (Shams et al., 2017). Therefore, knowing that zebrafish is a
et al., 2011), light-inducible genes (genes directly activated by light that    social species (Spence et al., 2008), and the size-selective harvesting
can interfere with the functioning of the core feedback loop; Tamai             treatments occurred in a social environment, we studied zebrafish be-
et al., 2007; Vatine et al., 2011), circadian clock output (genes related to    haviour at the group level for testing our hypotheses.
mechanisms downstream the core feedback loop) and clock-controlled
genes related to energy balance.
                                                                                2.2 | Group risk-taking behaviour experiments

2 | M ATE R I A L S A N D M E TH O DS                                           We first characterized the diving behaviour of zebrafish to test
                                                                                whether the selective removal of the larger individuals triggered
2.1 | Selection lines                                                           a decrease of group risk-taking behaviour (vice versa for the selec-
                                                                                tive removal of smaller individuals; H1 in Figure 1). Groups of eight
Our experimental system consisted of wild-collected zebrafish from              juveniles (30 days post fertilization; dpf) were stocked into 3-litre
West Bengal in India, sampled with a range of fishing gears (seine,             rearing boxes. The boxes (N = 36) were housed on the shelves of
cast nets and dip nets). The parental wild-collected population was ex-         the same zebrafish holding system with a randomized order (six rep-
perimentally harvested as explained in detail elsewhere (Uusi-Heikkilä          licates for each line; 12 replicates per treatment). Throughout the
et al., 2015). Each selection line was replicated twice for a total of          experiment zebrafish were fed ad libitum with dry food (TetraMin,
six selection lines, similar to a landmark study about the outcomes of          Tetra, Germany) and maintained in the same conditions reported
experimental size-selective harvesting in Atlantic silversides (Conover         above. Measurements of diving behaviour were assessed with adult
& Munch, 2002; Therkildsen et al., 2019). Zebrafish were exposed to             individuals at 230 and 240 dpf to estimate consistent inter-group
size-selection only during the first five generations and then harvest-         differences as a measure of collective personality. To that end, the
ing halted for several further generations (Uusi-Heikkilä et al., 2015) to      groups of eight zebrafish were moved from the 3-L rearing box in a
remove maternal effects and study evolutionary outcomes in a com-               new experimental tank (width × length × height = 10 × 30 × 25 cm)
mon-garden setting. Age at harvest varied from generation to genera-            with 22 cm of water (Figure S2). The experimental tank was placed
tion associated with potential changes in age at 50% maturation of the          on a table behind a white curtain. On the side of the experimental
random line, and each selected parental fish was only able to spawn             tank (at about 50 cm), we placed a webcam (Figure S2; Video S1) and
once. Therefore, the experimental design did not allow the estimation           measured the cumulative time any individual of the shoals spent at
of selection responses typical of those expected in overlapping gen-            the surface (top 7 cm of the tank; Figure S2) during an experimental
erations with respect to age at maturation.                                     assay with duration of 6 min and 30 s composed of: an acclimation
      Zebrafish selection lines for the present experiment where from           period (3 min), a feeding period (30 s), the approach of a simulated
F13, eight generations after harvesting halted. The selection lines             predator (5 s) and the rest of time after the predator approach
maintained key life-history adaptations. The large-harvested line               (3 min; Figure S2; Video S1). The time spent at the surface is a well-
showed a fast life-history (e.g., elevated reproductive investment and          established behavioural test used in zebrafish to measure anxiety-
reduced post maturation growth) and the small-harvested line signs of           like behaviour (Egan et al., 2009; Kalueff, 2017; Levin et al., 2007).
a slow fast-history (e.g., reduced reproductive investment; Figure S1;          Zebrafish show a typical diving response moving towards the bottom
Uusi-Heikkilä et al., 2015). Fish were reared in groups under ad libitum        of the tank as soon as they are introduced in a novel tank, followed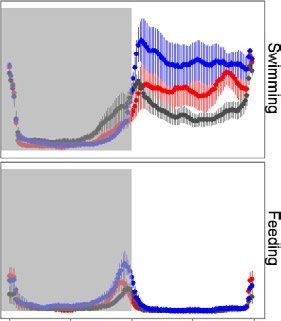
SBRAGAGLIA et al.                                                                                                Journal of Animal Ecology   |   391

by a slow exploration of the surface (Kalueff, 2017). The surface of      with the loss of circadian rhythmicity according to our third hy-
the water is a risky environment for zebrafish (Spence et al., 2008),     pothesis (H3 in Figure 1). We selected seven genes controlling the
and previous experimental results showed that stimuli mimicking an        most important functioning mechanisms of the circadian system in
approaching predator from the top of the tank induced a robust in-        fish (Foulkes et al., 2016; Frøland Steindal & Whitmore, 2019; Idda
crease of time spent at the bottom of the tank (Luca & Gerlai, 2012).     et al., 2012; Vatine et al., 2011). The first group of genes was com-
Therefore, we expected an incremental use of the water surface dur-       posed by genes related to the core transcriptional–translational
ing the acclimation period (just after the zebrafish are introduced in    feedback loop driving circadian oscillation in vertebrates (per1b,
the novel experimental tank), with its maximum happening where            clock1a, arntl1a). The second group involved light-inducible genes
food is added at the surface, followed by a drastic reduction after the   (per2, cry1a). The third group was composed of genes related to
approach of a simulated predator from the top (Figure S2; Video S1).      the circadian clock output (dbpa, tef1). These three groups of genes
   To capture the quantitative development of the behaviour of the        were measured both in the brain and liver. Finally, a fourth group
shoal throughout the experimental assay, we subdivided the observa-       was composed of circadian clock-controlled genes (lepa, and igf1)
tions in 30-s periods. The bird-like simulated predator was released      related to growth and energy balance. lepa was measured both in
with a cable from a height of 1 m (Figure S2; Video S1) and was main-     brain and liver and igf1 only in the liver. The product of the gene
tained above the tank for 5 s. By repeating the experiment 10 days        lepa acts as satiation signal in teleosts and has implications in energy
later we estimated the repeatability of risk-related group behaviour.     balance and glucose homeostasis, it is mainly secreted in the liver
                                                                          with a daily rhythm of expression (Paredes et al., 2015; Rønnestad
                                                                          et al., 2017). The gene lepa is also expressed in the teleost brain,
2.3 | Circadian experimental set up and design                            where expression increases after a meal (Yuan et al., 2016). The
                                                                          gene igf1 is involved in growth processes and signals lipid metabo-
To test the absence of early peaks of locomotor activity associated       lism and it is secreted with a daily rhythm of expression (Paredes
with a decrease of risk-taking behaviour in the large size-selected       et al., 2015).
line (according to our second hypothesis H2 in Figure 1), we recorded         Samples were collected throughout a 24-hr cycle at six differ-
daily activity rhythms in a parallel experiment with a new set of adult   ent time points (Time of the day: 01:00, 05:00, 09:00, 13:00, 17:00,
zebrafish when they were at about 170 dpf. We randomly selected           21:00). Fish were exposed for 24 hr to the second constant dim light
three groups of 15 fish for each of the six selection lines (six groups   phase. We sampled a total of five fish for each time point and each
and 90 fish for each treatment: large-harvested, small-harvested and      treatment. Zebrafish were euthanized on ice and then the whole
control line). The individual mass of the experimental fish groups        brain and liver were dissected and put in RNAlater at −80°C. Total
was within the following range: large-harvested (3.6–5.7 g); control      RNA was isolated using a Trizol reagent (Invitrogen) following the
(3.3–6.5 g); small-harvested (4.6–6.1 g). The experimental setup was      manufacturer's instructions. The amount, quality and composition
designed to jointly record swimming (as a proxy of locomotor activ-       of isolated RNA were analysed using Nanodrop ND-1000 (Thermo
ity) and self-feeding activity by a group of zebrafish (Figure S3; see    Fisher Scientific Inc.). DNase-treated RNA was used to perform
also del Pozo et al., 2011).                                              cDNA synthesis in a final volume of 20 μl using the iScript cDNA syn-
   Before starting experimental trials, fish were acclimated to lab-      thesis kit (Biorad). The reaction was performed at 46°C for 20 min,
oratory conditions and to the use of the self-feeder for 15 days.         followed by a 1-min inactivation step at 95°C.
Afterwards we recorded the swimming and self-feeding activity for             cDNA was PCR-amplified with the StepOnePlus Real-Time PCR
38 days (from at about 170 to 210 dpf) following established pro-         System (Applied Biosystems) using SsoAdvanced™ Universal SYBR®
tocols in chronobiology to test for daily and circadian rhythmicity       Green Supermix (Biorad). The thermal cycling conditions were as fol-
of fish behaviour (e.g. Sánchez-Vázquez & Tabata, 1998). The ex-          lows: 30 s of denaturation at 95°C, followed by 40 cycles of a 15-s
perimental trial was subdivided into four consecutive phases: (a)         denaturation step at 95°C and then by an annealing-elongation step
12:12 hr LD cycle to investigate daily swimming and self-feeding          for 30 s at 60°C. After amplification, a melting curve analysis was
rhythms (first LD trial: 15 days); (b) constant dim light (LL, 3.5 lux    performed to confirm amplicon specificity. The samples were run in
at the water surface) to investigate the endogenous free-running          triplicate. Gene-specific primers are indicated in Table S1. The rela-
rhythms of swimming and self-feeding activity (constant conditions:       tive expression levels of each sample were calculated by the 2–ΔΔCT
7 days); (c) 12:12 hr LD cycle to investigate their resynchronization     method (Livak & Schmittgen, 2001), using geometric mean of three
(second LD trial: 15 days); (d) LL to ascertain the endogenous expres-    housekeeping genes (βactin, GADPH and EF1α) in both tissues.
sion patterns of clock genes (final constant conditions: 2 days).

                                                                          2.5 | Statistical analysis
2.4 | Gene expression analysis
                                                                          Risk-taking behavioural data were square root transformed and split
We measured gene expression at the end of the activity rhythms            into two sections: (a) before the approach of the simulated predator;
to test whether a decrease of risk-taking behaviour was associated        (b) after the approach of the simulated predator. To assess differences
392 | Journal of Animal Ecology SBRAGAGLIA et al.
among the selection lines in the development of risk-taking behaviour 3 | R E S U LT S
of the shoals throughout the experimental assay, we modelled the
data using non-orthogonal quadratic polynomial mixed models with 3.1 | Group risk-taking behaviour
selection lines as fixed factor (three levels) and consecutive 30-s time
bins as covariate. Moreover, to assess differences among selection Group risk-taking behaviour was overall significantly repeatable (ad-
lines in risk-taking behaviour at specific time points of the experimen- justed R ranged from 0.22 to 0.71; Table S2)—after accounting for
tal assay, we estimated a linear mixed model for each 30-s time bins the fixed effects of selection lines —across time (230 and 240 dpf)
with selection lines as fixed factor (three levels). In all cases, the dif- with some differences depending on the 30-s time period consid-
ferent trials and replicates of the selection lines were used as random ered (Table S2; Figure 2a; see text S2). We found a decrease of the
intercepts. Moreover, the square root transformed data were used to adjusted repeatability towards the end of the experimental assay
calculate adjusted repeatability (i.e. after controlling for fixed effects (Figure 2a; see Figure S4 for variance partitioning).
of selection lines; Nakagawa & Schielzeth, 2010) of risk-taking behav- Group risk-taking behaviour before the approach of the simu-
iour for each 30-s time bin across time (230–240 dpf). We used the lated predator followed a positive quadratic trajectory, which was
same mixed effects models implemented before with selection lines similarly expressed in both size-selected lines compared to the con-
as fixed factor (three levels) and replicates of the selection lines as ad- trol (Table S3; Figure 2a). Zebrafish initially avoided the surface after
ditional random intercepts. being introduced into the experimental tank, but soon after started
Waveform analysis (24-hr based) was carried out in both LD tri-
als, and raw time series values (i.e. number of infrared light beam
Food
interruptions) were transformed in % of maximum to standardize the
(a)
data. The Midline Estimating Statistic Of Rhythm (MESOR) was com-
puted and represented as a horizontal threshold in waveform plots
(Refinetti, 2006).
Regarding swimming activity rhythms, we estimated total activity
for each group by calculating the area under the waveform curve during
both LD trials (Refinetti, 2006). Next, early peaks of activity were cal-
culated as the ratio between the percentages of area under the curve (b) *
divided by the percentage of time of the period considered (i.e. 4 hr;
Sbragaglia et al., 2013). Concerning self-feeding activity rhythms, we **
** * *
† * *
estimated feeding events for each group by calculating the area under †
†
the waveform curve during four different hourly sections (i.e. where
most of the activity was concentrated): (a) from 06:00 to 07:00; (b) from
07:00 to 08:00; (c) from 08:00 to 09:00 (i.e. the hour before lights on);
(d) from 09:00 to 10:00 (i.e. the hour after lights on). After a power F I G U R E 2 Results of the diving test used to assess group risk-
taking behaviour in the zebrafish selection lines in two consecutive
transformation of the data, adjusted repeatability (selection lines as
trials at 230 and 240 dpf. Data are presented as cumulative time (bin
fixed effect and lines replicates as additional random effect into the in 30-s period) spent by zebrafish shoals at the surface of the water
model) were calculated over the two LD trials. Next, we modelled the (7 cm; see Figure S2; Video S1) once moved to a novel tank. Food has
data using the same mixed-effects model structure with selection lines been added at 03:00 and the predator approached at 03:30. We first
as fixed effect and line replicates and LD trials as random intercepts. model the data with a non-orthogonal quadratic polynomial mixed
model by splitting the data into two sections: (i) before the approach
Finally, circadian periodicity in gene expression was assessed
of the simulated predator; (ii) after the approach of the simulated
using RAIN, a robust non-parametric method for the detection of
predator (a). Moreover, to assess differences among selection lines
rhythms in biological data that can detect arbitrary waveforms and in risk-taking behaviour as specific time points of the experimental
has been widely applied in the measurement of circadian transcripts assay, we implemented a linear mixed model for each 30-s time bins
abundance (Thaben & Westermark, 2014). (b). Finally, we calculated adjusted repeatability (i.e. after controlling
Periodogram and waveform analysis were performed using the for fixed effects of selection lines) of risk-taking behaviour for each
30-s time bin across time (230–240 dpf) by using the same mixed
software Eltemps (www.el-temps.com). The rest of analyses were
effects models implemented before (a). Repeatability scores (right axis
implemented using r 3.5.0 (https://www.R-projec t.org/) and the in a) are presented as empty circles (when they were not significantly
following additional packages; rain (Thaben & Westermark, 2014); different from zero) and solid circles (when they were significantly
rcompanion package for power transformation (https://CRAN.R- different from zero; see also Tables S2–S4 and Figure S4 for further
projec t.org/package=rcompanion), rptR for calculating repeatability details and partitioning of variance components). The different
colours represent the selection lines (N = 12 for each selection
and uncertainty via parametric bootstrapping (Stoffel et al., 2017),
line) together with confidence intervals (dashed coloured lines in a),
lme4 r package (Bates et al., 2014) to implement the linear mixed
median (points in b) and lower and upper quartiles (vertical lines in
models, MuMIn to get marginal and conditional R 2 (Bartoń, 2014). b). Bird pic source: https://www.piqsels.com. Significant difference
We used a 95% confidence interval. is indicated by black horizontal lines (†p < 0.10; *p < 0.05; **p < 0.01)SBRAGAGLIA et al. Journal of Animal Ecology | 393
to increase the time spent at the surface reaching the maximum 3.2 | Behavioural activity rhythms
when the food was added (03:30 in Figure 2). After the approach
of the simulated predator (04:00 in Figure 2), all the selection lines The behavioural rhythms of all the selection lines revealed signifi-
reduced their group risk-taking behaviour (Figure 2). The small-har- cant 24-hr periodicities during both LD trials (first LD trial, days 1–15;
vested line spent significantly more time at the surface, i.e. individ- second LD trial, days 22–36) and significant free-running rhythmicity
uals took more risk during feeding (+6.5 s) and after the approach under LL conditions, with periods close to 24-hr (Figure S5; Table 1,
of the simulated predator (ranging from +2.0 to +5.7 s; Figure 2b; see text S3). All lines displayed typical diurnal swimming activ-
Table S4), while the large-harvested line only showed an almost sig- ity rhythms with greater activity during photophase (Figure 3a,b).
nificant effect in being less risk-taking than the control during the However, we detected fine-scale timing differences in several daily
habituation phase (−3.2 and −3.4 s; Figure 2b; Table S4). behavioural rhythms among the lines (Figure 4).
TA B L E 1 The output of the
Experimental
periodogram analysis for swimming and
Phenotype phase Line N T or tau (SE) %V (SE) MESOR (SE)
self-feeding activity rhythms during the
three steps of the experiment (first light– Swimming LD1 LH 6/6 24.00 (0.00) 47.41 (4.54) 0.070 (0.006)
dark trial: LD1; constant dim light: LL1; RH 6/6 24.00 (0.02) 29.74 (10.38) 0.103 (0.011)
and second light–dark trial: LD2) according
SH 5/6 24.02 (0.02) 52.48 (10.13) 0.116 (0.012)
to the three selection lines (large-
harvested: LH, small-harvested: SH and LL1 LH 4/6 20.88 (1.70) 29.43 (11.23) —
control: RH). Periods (T) or free running RH 2/6 26.33 (0.00) 30.29 (8.59) —
periods (tau) are averaged according to SH 2/6 23.42 (0.33) 23.54 (1.89) —
the number of groups (N; the proportion
LD2 LH 6/6 24.03 (0.02) 52.45 (8.54) 0.081 (0.017)
indicates the number of groups with
significant rhythms) and the robustness of RH 6/6 24.00 (0.03) 51.01 (14.30) 0.066 (0.006)
periodicities is expressed as percentage SH 5/6 24.00 (0.00) 56.96 (20.82) 0.108 (0.018)
of variance explained (%V) together
Self-feeding LD1 LH 6/6 24.00 (0.00) 46.44 (7.45) 0.018 (0.003)
with the midline estimating statistic of
rhythm (MESOR). The standard errors are RH 6/6 23.97 (0.02) 38.89 (18.18) 0.016 (0.009)
reported between parentheses SH 6/6 24.01 (0.03) 43.21 (6.35) 0.026 (0.005)
LL1 LH 4/6 23.56 (0.52) 28.59 (6.73) —
RH 3/6 22.56 (1.31) 18.86 (3.43) —
SH 1/6 16.83 (—) 16.03 (—) —
LD2 LH 6/6 24.03 (0.02) 46.07 (11.67) 0.013 (0.003)
RH 6/6 24.01 (0.01) 32.29 (7.92) 0.008 (0.003)
SH 6/6 24.00 (0.02) 37.87 (10.17) 0.016 (0.003)
F I G U R E 3 Mean waveforms (time (a) (b)
scale 24 hr) for swimming (a, b) and
self-feeding (c, d) activity of zebrafish
shoals are expressed as percentage of the
maximum during the first (LD1: days 1–15)
and second (LD2: days 22–36) light–dark
trial. Each point represents the 10-min
binned mean across all the experimental
days in LD1 and LD2 for all the groups.
The different colours represent the (c) (d)
selection lines: red for large-harvested
(LH; N = 6) grey for control (RH; N = 6)
and blue for small-harvested (SH; N = 5).
The horizontal lines represent the midline
estimating statistic of rhythm as reported
in Table 1. The vertical lines represent
the standard error (N between 75 and
90). Grey shadowed areas represent the
dark hours (lights on is at time of the
day = 09:00)394 | Journal of Animal Ecology SBRAGAGLIA et al.
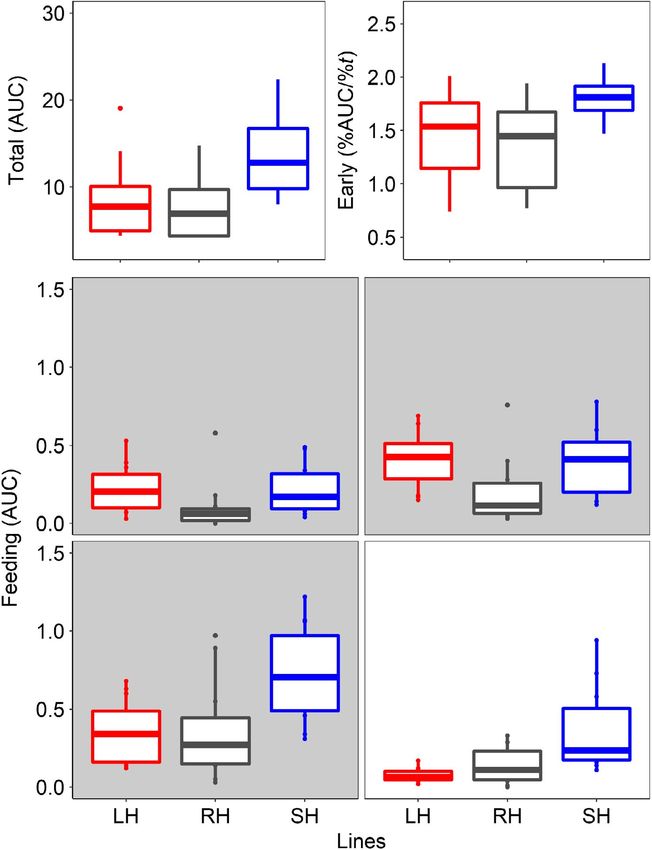
(a) (b) F I G U R E 4 Total swimming activity
during light hours (a; area under the
** waveform curve, AUC) and early daily
** activity (b; percentage of activity during
the first 4 hr of light) together with
self-feeding activity (c–f; area under
the waveform curve, AUC) during the
last 3 hr of scotophase (grey shadow;
c = 06:00–07:00; d = 07:00–08:00;
e = 08:00–09:00) and the first hour
of photophase (f = 09:00–10:00). The
different colours represent the selection
lines: red for large-harvested (LH) grey for
(c) (d) control (RH) and blue for small-harvested
(SH); N between 5 and 6 (see Table 1 for
more details). Boxplots represent the
median (bold centreline), the 25th (top
**
of the box) and 75th percentile (bottom
** **
of the box). Significant differences
** are indicated by black horizontal lines
(**p < 0.01; ***p < 0.001; see text for
more details)
(e) (f)
***
**
Specifically, total swimming activity during the photophase was (06:00–07:00 hr; darkness) both size-selected lines were significantly
significantly (p < 0.001) repeatable—after accounting for the fixed (large-harvested line: t8 = 2.94, p < 0.01; small-harvested line: t22 = 2.85,
effects of selection lines—over the two LD trials (R = 0.78 [CI: 0.27– p < 0.01) more active than controls (Figure 4c). The same pattern
0.92]; Figure S6a). The small-harvested line was significantly (t8 = 3.62; (large-harvested line: t8 = 3.37, p < 0.01; small-harvested line: t8 = 3.10,
p < 0.01) more active than controls (Figure 4a), while no significant differ- p < 0.01) was detected in the next hourly section (07:00–08:00 hr; dark-
ences (t8 = 0.73; p = 0.473) were detected between the large-harvested ness, Figure 4d). Subsequently, during the hour before light-on (08:00–
line and controls (Figure 4a). Early peaks of swimming activity were also 09:00 hr), the small-harvested line was significantly (t8 = 3.64, p < 0.001)
significantly (p < 0.05) repeatable (R = 0.46 [CI: 0.070.80], after account- more active in demanding food than controls (Figure 4e), while the
ing for the fixed effects of selection lines; Figure S6b). In particular, the large-harvested line did not show significant differences relative to the
small-harvested line concentrated significantly (t8 = 3.26; p < 0.01) more control (t8 = 0.61, p = 0.545). The same pattern (small-harvested line:
daily activity on the first 4 hr of the photophase relative to controls t8 = 3.49, p < 0.01; large-harvested line: t8 = −0.43, p = 0.672) was de-
(Figure 4b), while no significant differences (t8 = 0.64; p = 0.524) were tected during the first hour after light-on (09:00–10:00 hr; Figure 4f).
detected between the large-harvested line and controls (Figure 4b).
The lines displayed self-feeding activity rhythms during the last
hours of darkness (Figure 3c,d). The self-feeding activity was significantly 3.3 | Core clock genes
(p < 0.05) repeatable (Figure S6c–f) over the two LD trials in the four
consecutive hourly sections that were analysed (from 3 hr before to Core clock genes expression revealed significant differences in
1 hr after light-on, Figure S6c–f). At the onset of the self-feeding events their circadian oscillations among the zebrafish lines (Table 2).SBRAGAGLIA et al. Journal of Animal Ecology | 395
TA B L E 2 The output of the analysis
Brain Liver
with RAIN (a robust non-parametric
method for the detection of rhythms in Clock mechanism Gene Line N Peak p value N Peak p value
biological data) regarding the circadian
Core clock arntl1a LH 29 01396 | Journal of Animal Ecology SBRAGAGLIA et al.
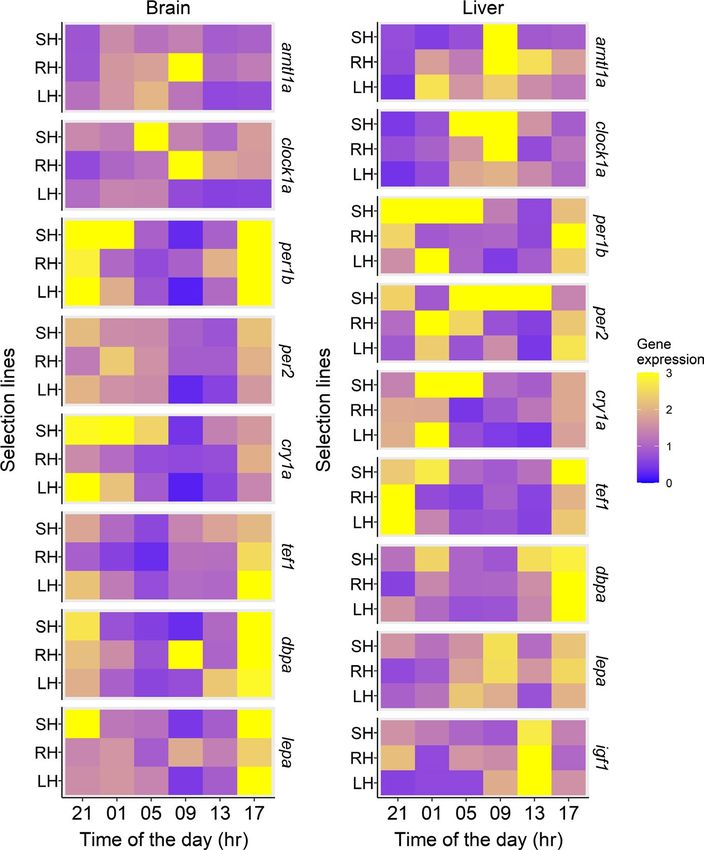
F I G U R E 5 Mean endogenous (i.e.
measured under constant dim light)
transcript abundance of the genes related
to the circadian system and clock-
controlled genes related to growth and
energy balance in the brain (left) and liver
(right) at different times of the day for the
three selection lines (large-harvested: LH,
small-harvested: SH and control: RH; N
between 4 and 5, see Table 2 for p values
and more details)
investigated (Table 2). In the brain, the three lines had a circadian Finally, the igf1 circadian oscillation in the liver was significant only
rhythmicity of tef1 and dbpa with peaks at the same time (TD17) in the control line (Table 2; Figure 5).
except for dbpa in the large-harvested line, which only showed an al-
most significant effect (p = 0.078; Table 2; Figure 5). In the liver, both
size-selected lines shifted the peak of the circadian oscillation of tef1 4 | D I S CU S S I O N
from TD21 to TD17 compared to the control (Table 2; Figure 5). By
contrast, the three lines lost circadian rhythmicity in terms of dbpa We found that five generations of size-selective harvesting left
(Table 2; Figure 5). an evolutionary legacy in group risk-taking behaviour as well as
in the circadian behavioural and molecular outputs. Three key
results are noteworthy and further discussed below. First, size-
3.6 | Clock-controlled genes related to growth and selective harvesting fostered evolutionary changes of group risk-
energy balance taking behaviour, which were more evident in the small-harvested
line than large-harvested line compared to the control. Second,
The circadian expression of lepa (involved in metabolism and energy we found changes in fine-scale daily behavioural rhythms in the
balance) and igf1 (involved in growth) also revealed significant dif- small-harvested line, but not in large-harvested line, compared to
ferences between the size-selected lines and controls. The circa- the control. Specifically, the small-harvested line was overall more
dian oscillation of lepa expression in the brain was only significant risk-taking, more active during photophase, and concentrated more
in the size-selected lines, but not in the control, with peaks at the activity early in the photophase compared to the control. Moreover,
same time (TD17; Table 2; Figure 5). By contrast, we did not find the small-harvested line extended self-feeding activity to the pho-
significant circadian oscillation of lepa in the liver (Table 2; Figure 5). tophase where it showed a higher self-feeding activity than theSBRAGAGLIA et al. Journal of Animal Ecology | 397
LH
Environmental cycles Switch
Input pathway Output pathway
SH
Molecular Phenotypes
clockwork
F I G U R E 6 The conceptual framework of the downstream switch we proposed to explain the results presented here. The circadian
clock synchronized with the environmental cycles (e.g. light–dark cycle or feeding). Next, the size-selective harvesting (large-harvested in
red: LH; small-harvested in blue: SH) triggers the evolution of different molecular circadian clockwork with respect to control. Finally, in
the output pathway the different molecular circadian clockwork is switched to produce a similar output driving the overall daily activity
rhythms phenotypes (i.e. swimming during light hours and self-feeding activity in the last hours of darkness)
control. All together, these results suggest asymmetric evolutionary zebrafish (Cachat et al., 2011; Spence et al., 2008), therefore it is ex-
changes induced by size-selective harvest in relation to group risk- pected that the time spent feeding at the surface is under predation-
taking behaviour and fine-scale timing of swimming and self-feeding driven selection pressure in wild populations and that genetic
daily activity rhythms. Third, from a molecular perspective, our data variation for surface feeding is present in the wild (Sih et al., 2011).
suggest the presence of a switch in the circadian output pathway We started our experimental system with wild zebrafish popula-
that buffered the molecular circadian clockwork (Figure 6). In fact, tions and fed them with clumped food at the surface (Uusi-Heikkilä
we found changes in the molecular circadian clockwork of both size- et al., 2015); therefore the time spent feeding at the surface played a
selected lines. These changes were expected to affect overall tem- major role in determining size-at-harvest. Our selection pressure was
poral patterns of swimming and self-feeding activity. However, all divergent, either favouring large or small size-at-harvest. However,
lines showed overall similar temporal patterns of diurnal swimming we did not observe symmetrical evolutionary changes in the two
and self-feeding in the last hours of darkness and they only differed opposing selection lines in terms of group risk-taking behaviour, at
significantly in the fine-scale timing of these behaviours. We suggest least not when judged based on a strict measure of statistical sig-
being overall active during light hours and looking for food during nificance (e.g., p < 0.05). Our hypothesis was fully confirmed for
the last hours of darkness may have important adaptive value for ze- the small-harvested line, which took more risk during foraging and
brafish, no matter what the molecular clock is signalling. Therefore, after the approach of the predator and we suggest the behavioural
our results indicate that size-selective mortality induces changes in changes in terms of group risk-taking behaviour followed the se-
the molecular clock and in the fine-scale timing of daily behavioural lection on size-at-harvest through a correlated selection response.
rhythms, but overall timing (diurnal swimming and self-feeding in the Such interpretation would imply that the evolutionary changes of
last hours of darkness) revealed evolutionary resistance (sensu Sgrò risk-taking behaviour in the small-harvested line were driven by an
et al., 2011), which buffered the changes in the molecular clockwork. energy acquisition pathway (Enberg et al., 2012), coupling behaviour
and size-at-harvest such that selection on size-at-harvest also altered
risk-taking behaviour (Biro & Post, 2008). By contrast, the evolution-
4.1 | Group risk-taking behaviour ary changes of risk-taking behaviour in the large-harvested line were
only present as an almost significant effect and exclusively in the ha-
We found group risk-taking behaviour to be a repeatable behav- bituation phase. The initially expected adaptive changes towards a
iour and thus indicative of a zebrafish collective personality trait decrease in boldness could have been buffered by an antagonistic
(Bengston & Jandt, 2014; Jolles et al., 2018). We also documented effect of an energy acquisition mechanism (i.e. where the expected
that consistency of group behaviour can vary during an experimen- trend of evolution is indeed a decrease of boldness), and a counter
tal assay as demonstrated before for individual traits (e.g. O’Neill response caused by the evolution of a fast life history (i.e. where the
et al., 2018). We found partial support for our first hypothesis (H1) in expected trend of evolution is increased boldness). Similarly, in a the-
terms of the small-harvested line significantly increasing group risk- oretical model Andersen et al. (2018) predict that large size-selective
taking behaviour compared to the control during feeding and after harvesting could either foster bold or shy fish, depending on the
the simulated predator approach; while the large-harvested line al- strength of size-selection and correlations of behaviour and growth
most significantly decreased group risk-taking behaviour compared rate. These possible counterforces caused by life history adapta-
to the control during the habituation phase. The match/mismatch be- tions could explain the weak response in terms of group risk-taking
tween the species-specific evolutionary history and human-induced behaviour of the large-harvested line. Indeed, life history adapta-
rapid environmental changes may be key to understand behavioural tions were more evident in the large-harvested line than the small-
responses, such those observed in our experimental system (Sih harvested line with respect to control (Uusi-Heikkilä et al., 2015), and
et al., 2011). The surface of the water is a risky environment for thus may be expected to have had a stronger evolutionary effect on398 | Journal of Animal Ecology SBRAGAGLIA et al.
risk-taking behaviour than an energy acquisition pathway. In sum- photophase and concentrated its swimming activity at the be-
mary, size-selective mortality did not affect the overall trajectory ginning of the scotophase. However, we did not find significant
in group risk-taking behaviour during the experimental assay; how- changes in the large-harvested line compared to controls. The
ever, it triggered asymmetrical evolutionary changes both in terms of changes in daily activity rhythms of the small-harvested line agree
strength and when specific differences were observed (habituation with a study demonstrating that proactive zebrafish (i.e. risk-taking
phase, feeding or after the simulated predator approach). individuals) are more active in the first hours of photophase com-
Previous work in our laboratory using the same experimental pared to reactive ones (Tudorache et al., 2018). Moreover, the
system was conducted at the individual level, and results related self-feeding activity events of the small-harvested line extended
to individual risk-taking behaviour in response to size-selection to the hours before and after light-on. The timing of feeding is a
showed different patterns than those reported here at the group key aspect for survival and is traded-off against predation risk and
level. Specifically, Uusi-Heikkilä et al. (2015) reported that juveniles food availability (Kronfeld-Schor & Dayan, 2003). The ecological
of the small-harvested line increased individual risk-taking com- significance of zebrafish feeding during the last hours of darkness
pared to controls, while Sbragaglia, Alós, et al. (2019) showed that may be related to avoidance of visual predators (e.g. birds; Spence
adult females decreased risk-taking behaviour relative to controls. et al., 2008) and/or to storing energy to be prepared for spawning
Similarly, the large-harvested line did not show changes in individual that occurs at the beginning of photophase (del Pozo et al., 2011).
risk-taking behaviour compared to controls in both juveniles (Uusi- However, the food demand sensor was located close to the water
Heikkilä et al., 2015) and adults (Sbragaglia, Alós, et al., 2019). surface (del Pozo et al., 2011; see also Figure S3) and an increase
Two main limitations of the previous experimental approaches of self-feeding events towards light-on by the small-harvested line
that were overcome in this research may explain some of the dis- could also indicate additional support for the evolutionary change
crepancies. The first is related to the behavioural assay. Our previous of group foraging in a risky context following a resource acquisition
work focused on individual behavioural traits using the open field test mechanism that fostered a correlated selection response of size-
to assess risk-taking behaviour (Sbragaglia, Alós, et al., 2019; Uusi- at-harvest and risk-taking behaviour.
Heikkilä et al., 2015). An open field test is used to measure explor- Overall, the results related to fine-scale timing of daily behavioural
ative behaviour, rather than risk-taking behaviour (Réale et al., 2010). rhythms revealed that the size-selected lines responded differ-
Moreover, it disregards the third vertical dimension, which constitutes ently, indicating asymmetrical evolutionary changes in response to
an important behavioural aspect for zebrafish both due to its evolu- size-selection, as previously reported for life-history traits in other
tionary history and because of the selection environment experienced selection experiments with fish (Amaral & Johnston, 2012; Renneville
in our experimental system where fish were held in large tanks and et al., 2020; van Wijk et al., 2013). Harvesting-induced evolution of
food was provided on the surface. Thus, the experimental approach behaviour likely has a complex and multivariate nature (Claireaux
used in the present paper seems more appropriate than the open field et al., 2018; Renneville et al., 2020), thereby complicating general-
to reveal evolutionary changes in risk-taking behaviour of the zebraf- izations related to evolutionary correlations among traits. The some-
ish size-selected lines. The second limitation is that our previous be- what asymmetrical evolutionary changes in the two size-selected lines
havioural assays focused on isolated individuals instead of examining might be related to the complex interplay of evolutionary mechanisms
the behavioural phenotype of groups (Sbragaglia, Alós, et al., 2019). such as life history adaptations and energy acquisition mechanisms
Being in a group has important consequences for foraging behaviour as explained above. However, other mechanisms could also be at play
in zebrafish (Harpaz & Schneidman, 2019; Pitcher, 1986), and social such as genetic trade-offs or functional limitations in our model spe-
isolation can create stress-related behaviours (Shams et al., 2017). cies (Arnold, 1992; Renneville et al., 2020).
We propose that zebrafish expressed a more reliable behaviour in the
group context presented here than in the open field experiments pre-
viously reported on isolated individuals. Collectively, the evolutionary 4.3 | Circadian system switch
changes of risk-taking presented in this paper seem more robust and
they suggest that testing evolution of behaviour in response to ex- We rejected our third hypothesis (H3) because we did not find a
perimental size-selective harvest should carefully consider the match decrease of the circadian clock gene rhythmicity (a decrease of ro-
between evolutionary history of the species, the environmental con- bustness and amplitude as documented by Tudorache et al., 2018)
ditions experienced during the artificial selection and the behavioural linked to a decrease of group risk-taking behaviour. A possible ex-
assay used to reveal the evolutionary basis of behavioural changes planation could be related to the fact that the two recent stud-
(Klefoth et al., 2012). ies on zebrafish that demonstrated a relation between individual
personality trait and the circadian system (i.e. proactivity/reactiv-
ity; Rey et al., 2013; Tudorache et al., 2018), measured transcript
4.2 | Daily behavioural activity rhythms abundance under light–dark conditions. Thereby, the truly endog-
enous nature of the circadian molecular clockwork could have been
We found partial support for our second hypothesis (H2) because masked by the light–dark cycle (i.e. direct response without syn-
the small-harvested line was found to be more active during the chronizing the circadian molecular clockwork; Dunlap et al., 2004;You can also read