January-March 2021 1Q21 - BBVA
←
→
Page content transcription
If your browser does not render page correctly, please read the page content below

January-March 2021 1Q21

take care of yourself, take care of others

                We face the challenges from a solid capital and                 CET1 fully-loaded (*)                                             LCR / NSFR
                liquidity position reinforced by the sale
                agreement of our subsidiary in the United States                       14.58%                                              151% / 127%
                                                                         (*) Pro-forma: including the positive impact
                                                                                 from the sale of BBVA USA.
                                                                                              .

                                                                         Distribution of €5.9 cents /                       *Possibility of up to a 10% buyback
                We have held the AGM, where shareholders                 share from the share premium                       of the ordinary shares, after the
                strongly supported                                       account                                            closing of the sale of BBVA USA

                                                                                                                           *Subject to the approval of the requested regulatory authorizations

             We support the community to protect the health                                     Committed with our Purpose, “to bring the age of
             and well-being of all                                                              opportunities to everyone”, and with our values

                    COVID-19 Social Response Plan

    +€35M                                                    +3.5M                    Customer                             We                            We are
                                                                                      comes first                       think big                       one team
  Donated by BBVA for                                    beneficiaries
    the fight against
     the pandemic

        +€11M Donated by customers and employees

            We offer financial support to our customers to overcome
            the pandemic and to help them throughout the recovery

      €      We help improve the financial health of our                                         We support our clients transition toward a
             customers through:                                                                  sustainable future

/ Tools for digital advice
                                                                                       Pledge 2025                                       Community investment*

                                                                                         To mobilize                                        Mobilized
                    BBVA SPAIN APP                                                       €100Billion                                        €142.2 M
                    First entity to provide information on net worth                             Mobilized*                                            Beneficiaries

                                                                                         Lo €50,155                                                    +12 M
                    It incorporates virtual tools to help                                           M
                    households save with a new function that
                    improves energy efficiency
                                                                                                                                                                  *Data as of December 2020

                                                                                                                        CARBON
                                                                                    NET ZERO
                                                                                                                        PHASE OUT
/ The acquisition de financial knowledge and skills

                                                                                   We are carbon                        Our objective is to                     BBVA, the
        2008-2020. FINANCIAL EDUCATION GLOBAL PLAN                                 neutral in direct                    reduce to zero our                      best
                                                                                   CO2 emissions and                    exposure to                             investment
                                                                                   we commit to net                     carbon-related                          bank in the
                          €                                                        zero emissions by                    activities                              world for
                                                                                   2050                                                                         sustainable
             €91.4M
                  investment
                                             29.2M
                                             beneficiaries
                                                                                                                                                                finance

                                                 We create opportunities together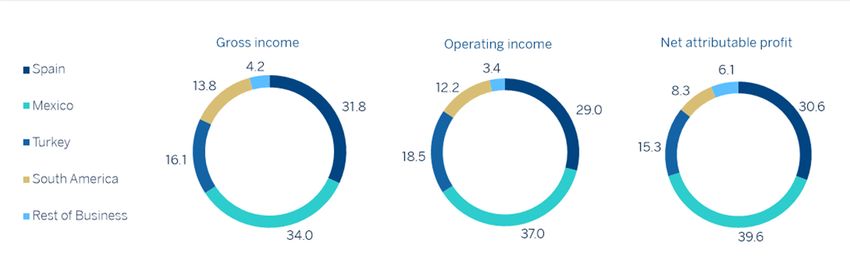
Contents
BBVA Group main data                                   2

Highlights                                             3

Group information                                      6

  Macro and industry trends                            6

  Results                                              9

  Balance sheet and business activity                 14

  Solvency                                            16

  Risk management                                     18

  Sustainability and Responsible Banking              23

Business areas                                        26

  Spain                                               29

  Mexico                                              32

  Turkey                                              35

  South America                                       38

  Rest of Business                                    42

  Corporate Center                                    45

  Other information: Corporate & Investment Banking   47

Alternative Performance Measures (APMs)               50

2

BBVA Group main data
BBVA GROUP MAIN DATA (CONSOLIDATED FIGURES)
                                                                                                          31-03-21           ∆%              31-03-20                 31-12-20
Balance sheet (millions of euros)
Total assets                                                                                               719,705           (1.4)             730,087                  736,176
Loans and advances to customers (gross) (1)                                                                322,866           (3.3)             333,845                 323,252
Deposits from customers (1)                                                                                331,064             4.0             318,347                 342,661
Total customer funds (1)                                                                                   437,979             5.6             414,786                 445,608
Total equity                                                                                                 50,711            3.1              49,174                  50,020
Income statement (millions of euros)
Net interest income                                                                                           3,451         (14.2)               4,024                   14,592
Gross income                                                                                                  5,155         (10.8)                5,778                  20,166
Operating income                                                                                              2,850         (13.6)               3,300                   11,079
Net attributable profit/(loss)                                                                                 1,210          n.s.              (1,792)                   1,305
Net attributable profit or (loss) excluding discontinued and corporate
                                                                                                               1,033        139.4                   431                    2,729
operations (2)
The BBVA share and share performance ratios
Number of shares (million)                                                                                    6,668                -             6,668                     6,668
Share price (euros)                                                                                            4.43             51.8               2.92                     4.04
Earning per share (euros) (3)                                                                                   0.17            n.s.             (0.29)                      0.14
Adjusted earning per share (euros) (2)(3)                                                                       0.14        193.0                  0.05                     0.35
Book value per share (euros)                                                                                   6.80              4.8               6.49                    6.70
Tangible book value per share (euros)                                                                          6.15              6.5               5.78                    6.05
Market capitalization (millions of euros)                                                                    29,512             51.8             19,440                  26,905
Yield (dividend/price; %) (4)                                                                                   3.6                                  8.9                     4.0
Significant ratios (%)
Adjusted ROE (net attributable profit or (loss)/average shareholders' funds +/-
                                                                                                                 9.3                                 3.6                      6.1
average accumulated other comprehensive income) (2)
Adjusted ROTE (net attributable profit or (loss)/average shareholders' funds
excluding average intangible assets +/- average accumulated other                                                9.8                                 3.8                      6.5
comprehensive income) (2)
Adjusted ROA (Profit or (loss) for the year/average total assets) (2)                                           0.81                               0.39                     0.54
Adjusted RORWA (Profit or (loss) for the year/average risk-weighted assets -
                                                                                                                1.73                               0.78                      1.16
RWA) (2)
Efficiency ratio                                                                                                44.7                               42.9                      45.1
Cost of risk (5)                                                                                                 1.17                              2.54                      1.55
NPL Ratio (5)                                                                                                    4.3                                 4.0                      4.2
NPL coverage ratio (5)                                                                                                81                              83                      82
Capital adequacy ratios (%)
CET1 fully-loaded                                                                                              11.88                              10.84                     11.73
CET1 phased-in (6)                                                                                             12.20                              11.08                     12.15
Total ratio phased-in (6)                                                                                      16.16                              15.39                    16.46
Other information
Number of clients (million)                                                                                    79.8            1.9                78.3                      80.6
Number of shareholders                                                                                     869,378           (0.8)             876,785                  879,226
Number of employees                                                                                         122,021          (3.2)             126,041                   123,174
Number of branches                                                                                            7,254          (5.7)               7,694                     7,432
Number of ATMs                                                                                               30,747          (4.7)              32,275                   31,000
General note: the results generated by BBVA USA and the rest of Group's companies in the United States included in the sale agreement signed with PNC are presented in a single
line of the Group's Income Statements as "Profit/(loss) after tax from discontinued operations".
(1) Excluding the assets and liabilities figures from BBVA USA and the rest of Group's companies in the United States included in the sale agreement signed with PNC classified as
non-current assets and liabilities held for sale (NCA&L) since 31-12-20. The figures related to "Loans and advances to customers (gross)", "Deposits from customers" and "Total
customer funds", including BBVA USA, would stand at 395,911 millions of euros, 385,050 millions of euros and 481,488 millions of euros, respectively, as of 31-03-20.
(2) Excluding BBVA USA and the rest of Group's companies in the United States included in the sale agreement signed with PNC as of 31-03-21, 31-12-20 and 31-03-20 and the net
capital gain from the bancassurance operation with Allianz as of 31-12-20.
(3) Adjusted by additional Tier 1 instrument remuneration.
(4) Calculated by dividing shareholder remuneration over the last twelve months by the closing price of the period.
(5) Excluding BBVA USA and the rest of Group's companies in the United States included in the sale agreement signed with PNC.
(6) Phased-in ratios include the temporary treatment on the impact of IFRS 9, calculated in accordance with Article 473 bis amendments of the Capital Requirements Regulation
(CRR), introduced by the Regulation (EU) 2020/873.
3
Highlights
COVID-19 pandemic
The COVID-19 pandemic has affected and is expected to continue to adversely affect the world economy,
leading many countries in which the Group operates into economic recession. This recession is expected to
be followed by a high level of activity, but uneven by sectors and geographical areas in 2021.
Results
The Group’s net attributable profit for the first three months of 2021, excluding the results from
discontinued operations (i.e. without considering the results generated by the Group’s businesses in the
United States subject to the agreement with PNC), amounted to €1,033m, with a year-on-year growth of
139.4%.
The BBVA Group generated a net attributable profit of €1,210m during the first three months of 2021,
which compares very positively with the accumulated losses in March 2020, when the outbreak of the
pandemic resulted in strong provisions for impairment on financial assets, as well as the goodwill
impairment in the United States amounting to €-2,084m.
Despite the complex environment and at constant exchange rates, the good performance in commissions
and fees, the evolution of net trading income (NTI) and lower provisions for impairment on financial assets
are noteworthy.
NET ATTRIBUTABLE PROFIT (1) NET ATTRIBUTABLE PROFIT BREAKDOWN (1)
(MILLIONS OF EUROS) (PERCENTAGE. 1Q21)
(1) Excluding profit after tax from discontinued operations, which (1) Excludes the Corporate Center.
includes the goodwill impairment in the United States in 1Q20,
amounting to €-2,084m.
Business areas
BBVA Group’s business areas reporting structure differs from the one presented at the end of 2020,
mainly as a consequence of the disappearance of the United States as a business area, derived from the
sale agreement reached with PNC. Most of the businesses in the United States excluded from this
agreement, together with those of the former business area “Rest of Eurasia”, constitute a new area called
“Rest of business”. Further detail on this new reporting structure can be found in the “Business areas
introduction” on this report.
On April 13, 2021, BBVA informed the employees’ legal representatives about its intention to initiate a
procedure for collective redundancies within BBVA, S.A. in Spain, which will affect both the central services
and the branch network.
Balance sheet and business activity
The figure for loans and advances to customers (gross) registered a slight decrease of 0.1%, mainly as a
result of Spain´s deleveraging.
Customer funds fell by 1.7%, due to the performance of customer deposits, which contracted by 3.4% in
the quarter.
Liquidity
The availability of substantial liquidity buffers in each of the geographical areas in which the BBVA Group
operates and their management, have allowed, once again, internal and regulatory ratios to be maintained
well above the minimums required.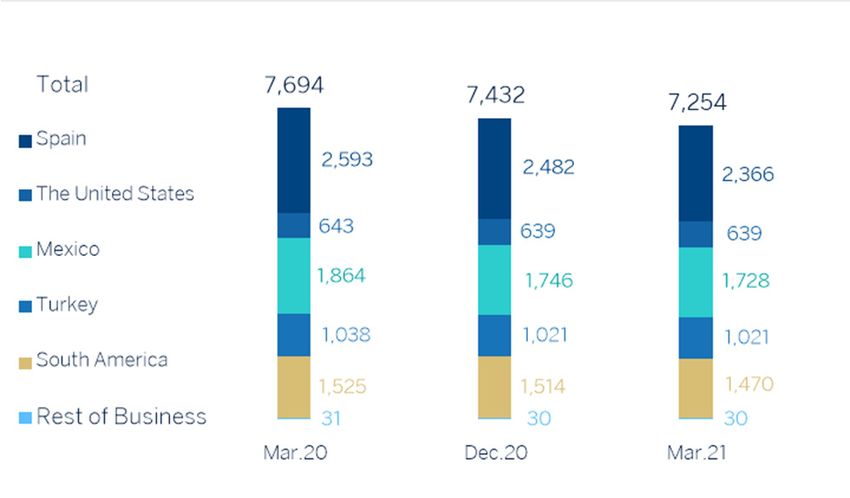
4
Solvency
BBVA’s CET1 fully-loaded ratio stood at 11.88% at the end of March 2021, within the Group’s
management target which is to maintain the ratio between 11.5% and 12.0%, increasing the distance to the
minimum requirement (currently at 8.59%) to 329 basis points. This ratio does not include the positive
impact of the sale of BBVA USA and other companies in the United States with activities related to this
banking business, which according to the current estimate and taking as a reference the capital level as of
March 2021, would place the CET1 fully-loaded ratio at 14.58%.
CAPITAL AND LEVERAGE RATIOS
(PERCENTAGE AS OF 31-03-21)
Annual General Meeting
On April 20, 2021, BBVA Group held its Annual General Meeting in a fully-remote format, in light of the
exceptional circumstances brought about by the COVID-19 pandemic and in order to protect the health and
safety of shareholders, employees and all other individuals involved. With respect to shareholder’s
remuneration, on April 29, 2021, BBVA distributed a cash amount of €0.059 per share from BBVA’s share
premium account, as approved by the Annual General Meeting held on April 20, 2021. In addition, and with
the aim of effectively implementing a repurchase program of ordinary shares, BBVA has approved the
reduction of the outstanding share capital up to a maximum of 10% through the redemption of own
shares purchased by BBVA and by any mechanism for the purpose of being redeemed, being subject the
aforementioned repurchase program to the provisions of the legislation or regulation in force, as well as the
share price, among other factors.
Risk management
The calculation of expected credit losses accumulated in the first quarter of 2021 incorporates:
o The update of the forward-looking information in the IFRS 9 models in order to reflect the
circumstances created by the COVID-19 pandemic.
o The granting of relief measures and guarantee lines or public guarantee facilities for customers
affected by the pandemic, as well as the option to grant lending with a public guarantee facility. In
addition, quantitative management adjustments are included in order to take into account issues
that might imply a potential impairment which due to its nature is not included in the model and
which will be assigned to specific operations in case this impairment materializes (e.g, sectors and
collectives more affected by the crisis).
The behaviour of the main credit risk indicators of the Group, excluding the balances of discontinued
operations, at the end of the first quarter of 2021 were:
o The NPL ratio stood at 4.3%.
o The NPL coverage ratio closed at 81%.
o The cumulative cost of risk at the end of March stood at 1.17%.
NPL(1) AND NPL COVERAGE(1) RATIOS AND COST
OF RISK(1) (PERCENTAGE)
(1) Excluding BBVA USA and the rest of Group's companies in the United States
included in the sale agreement signed with PNC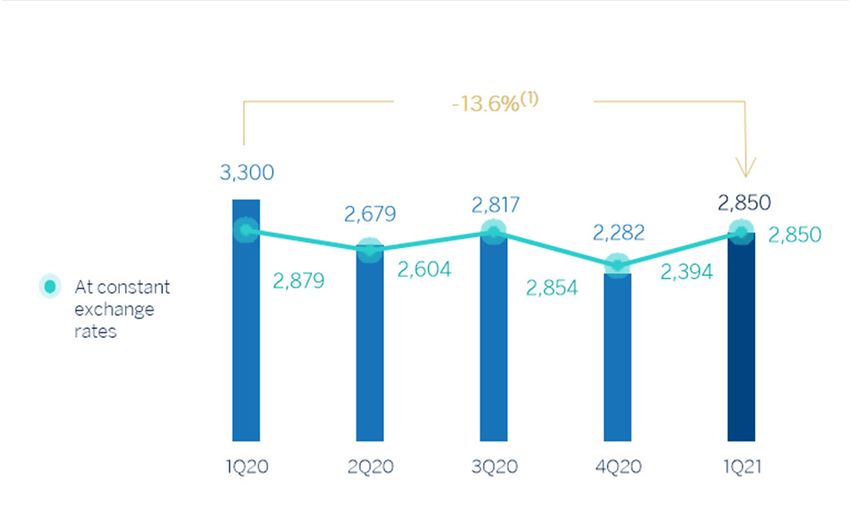
5
Security, business continuity and support measures taken by BBVA
From the outset, BBVA has adopted a series of measures to support its main stakeholders. The main business
continuity measures taken are:
In order to serve customers, and since financial services are legally considered an essential service in most
of the countries in which the Group operates, BBVA maintains its branch network operational, with
dynamic management considering the evolution of the pandemic and activity. In addition, digital channels
have been reinforced, given the increasing preference of customers for these channels. The data indicates
that the COVID-19 crisis is accelerating digitization: At Group level, excluding the United States, and in
cumulative terms, digital sales (measured in units) stood at 67.8% in December 2020, and at 69.5% at the
end of March 2021. Also, at the end of the first quarter of 2021, BBVA's digital customers, excluding the
United States, accounted for 64.7% of the total and customers operating with the bank through their mobile
phones accounted for 60.7% across the entire Group.
DIGITAL AND MOBILE CUSTOMERS (MILLIONS)
General note: March 2021 data excluding BBVA USA and the rest of Group's
companies in the United States included in the sale agreement signed with
PNC.
With employees, recommendations from health authorities have been followed, including taking an early
stance on promoting working from home. The priority for BBVA is to protect the health of the employees,
customers and society in general. The crisis is being handled dynamically; adapting the procedures in each
geographical area which the Group is present to the current situation, based on the latest data available
regarding the evolution of the pandemic, the business and the level of customer service, in addition to the
guidelines set by local authorities.
In terms of cybersecurity, the increase in remote work and digital transactions as a result of the
coronavirus crisis has led to an increase in the risk of cyber attacks. To ensure data and corporate
information protection, BBVA has established the appropriate measures and continues to strengthen its
prevention and monitoring efforts, thus mitigating the possible associated risks.
The banks are a key part of the solution to the COVID-19 crisis and BBVA will continue to support its
customers throughout the pandemic and also during the recovery phase.
Pronouncements of regulatory bodies and supervisors
With the aim of mitigating the impact of COVID-19, various European and international bodies made
pronouncements during 2020 aimed at allowing greater flexibility in the implementation of the accounting
and prudential frameworks. The BBVA Group has taken these pronouncements into consideration which
remain in force as of March 31, 2021.
In addition, the European Commission published a specific consultation in January 2021, on the bank crisis
management and deposit insurance framework of the European Union. The results of this consultation
will be included in the Commission work in order to make this framework more consistent and solid. The
consultation is focused on three legislative texts of the EU: the Bank Recovery and Resolution Directive
(BRRD), the Single Resolution Mechanism Regulation (SRMR) and the Deposit Guarantee Scheme Directive
(DGSD).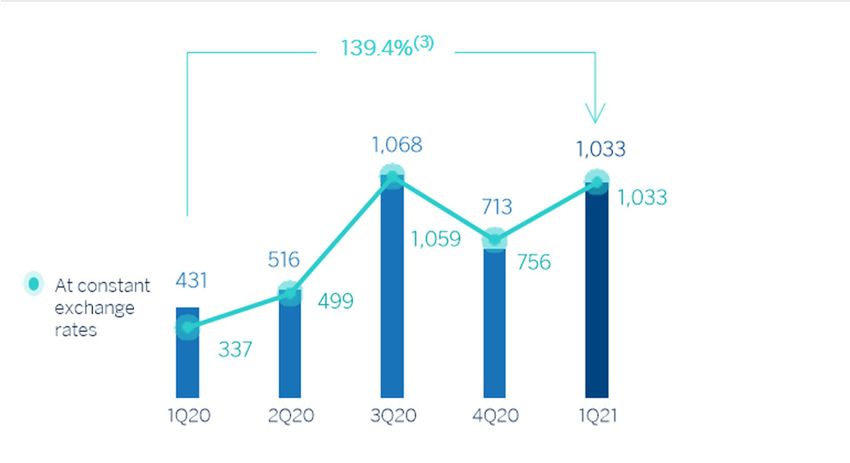
6

Group information
Macro and industry trends
The global economy is being strongly affected by the COVID-19 pandemic. Supply, demand and financial factors caused
an unprecedented fall in GDP in the first half of 2020. Underpinned by strong fiscal and monetary policy measures, as
well as greater control over the spread of the virus, global growth rebounded significantly in the second half of the year.
Global GDP, however, fell by around 3.3% in 2020.
Although the pandemic is likely to continue to adversely affect activity in the short term, the process of economic
recovery is expected to continue. According to BBVA Research, global GDP will expand by around 5.9% in 2021 and
4.8% in 2022, in line with the expected accelerated rollout of the Coronavirus vaccine, and the gradual lifting of
restrictions and economic stimulus measures. In this regard, the strong fiscal stimuli announced in the United States at
the end of 2020 and the beginning of 2021, as well as the sustained accommodative stance of monetary conditions by
the Federal Reserve (hereinafter the Fed) and other major central banks, have reinforced the global economy's
prospects for recovery; this recovery will be led by the United States, where GDP could grow around 6.2% in 2021 and
5.1% in 2022, according to BBVA Research estimates. That being said, various epidemiological, financial, economic and
geopolitical factors are contributing to the exceptionally high uncertainty.
With regard to the banking system, in an environment in which much of the economic activity has been at a standstill for
several months, the services it provides have played an essential role. There are two main reasons for this: first, the
banks have ensured the proper functioning of collections and payments for households and companies, thereby
contributing to the maintenance of economic activity; second, the granting of new credit or the renewal of existing credit
has reduced the impact of the economic slowdown on household and business incomes. The support provided by the
banks over the months of lockdown and public guarantees have been essential in softening the impact of the crisis on
companies' liquidity and solvency, meaning that banking has become the main source of funding for most companies.
In terms of profitability, European and Spanish banks have deteriorated from the outset of the crisis, primarily because
many entities recorded high provisions for impairment on financial assets in the first two quarters of 2020 as a result of
the worsening macroeconomic environment following the pandemic outbreak. Furthermore, the accumulation of capital
by banks since the previous crisis and the current very low interest-rate environment in which we have been since several
years, will continue to put pressure on bank profitability. Nevertheless, the banks are facing this situation from a position
of strength and with solvency that has been constantly increasing since the 2008 crisis, with reinforced capital and
liquidity buffers and, therefore, with a greater capacity to lend.

Europe
In the Eurozone, activity remains weak so far this year, limited by restrictions on activity adopted to curb new outbreaks
of the virus and still-slow vaccine rollout. The lifting of some restrictions, along with recovery in global demand, should
continue to support both the manufacturing and exports sectors, which could partially offset the fall in activity in the
consumer and service sectors during the first half of 2021.
In terms of GDP growth, following a fall of 6.8% in 2020, BBVA Research still expects recovery to gain substantial
momentum throughout this year, underpinned by the vaccine rollout, the European recovery fund (NGEU) and, more
recently, by stronger global recovery, which will benefit from the United States' aforementioned fiscal stimulus. As a
result, GDP could grow around 4.5% in 2021 and 4.9% in 2022 in the Eurozone as a whole. Furthermore, national
expansionary fiscal policies, the extension of support measures to the most affected sectors and support from the
European Central Bank (ECB) should avoid more-persistent negative effects.
With regard to the banking system, the ECB's immediate objective is to maintain favorable financial conditions. At its
March meeting, the ECB kept principal financial operations interest rates, credit easing interest rates and deposit facility
interest rates unchanged at 0.00%, 0.25% and -0.50% respectively and announced a significant increase in asset
purchases under the Pandemic Emergency Purchase Program (PEPP) for the second quarter of 2021. However, BBVA
Research considers that the PEPP provision (€1.85 trillion) is large enough to comfortably increase purchases over the
coming months without the ECB having to increase its provision.

Spain
In terms of GDP growth, the Spanish economy contracted by 10.8% in 2020. This year, despite the uncertainty in early
2021, BBVA Research predicts that the economy will gain traction in the coming months, recording higher growth rates
from the second quarter onward and, thereafter, traction will be favored by an international environment of ambitious
fiscal policies (especially in the United States), by the arrival of European recovery funds and by progress in the vaccine
rollout in Spain and the rest of the EU. Growth is therefore expected to stand at 5.5% at year-end. BBVA Research
predicts that accelerated economic activity from the second half of this year onward will lead to GDP growth of 7% in
2022. The main risks surrounding this scenario are linked to the pace of vaccine rollout and the pandemic, the impact of
the crisis on employment and production capacity, and slow implementation projects relating to the NGEU program.
7
Regarding the banking system, according to the latest Bank of Spain data available, the total volume of lending to the
private sector recovered by 2.6% in 2020 as a result of growth in new business lending transactions since April, within
the framework of the public guarantee programs launched by the government to combat COVID-19. This trend was
sustained in January 2021, recording year-on-year growth of 2.1% compared to January 2020. Asset quality indicators
continued to improve (the NPL ratio stood at 4.51% at year-end, and 4.54% in January 2021). Profitability entered
negative ground throughout 2020 as a whole (ROE -1.4%) due to the increase in provisions as a result of the COVID-19
crisis and, more importantly, due to the extraordinary negative results recorded in the first half of the year associated
with the deterioration of goodwill in some entities. Spanish entities maintained comfortable levels of capital adequacy
and liquidity, allowing them to weather the low-interest-rate environment, which has kept profitability under pressure
from a more robust position than in the previous crisis.

Mexico
GDP growth contracted 8.5% in 2020, slightly better than expected, due to better-than-projected economic activity in
the second half of 2020 and, in particular, due to higher growth in the United States driven by the aforementioned fiscal
package; this will help the economy to grow higher than was initially expected throughout 2021, but will not yet reach pre-
pandemic activity levels. By 2021, BBVA Research predicts that the Mexican economy will grow by 4.7%. This growth will
be driven by foreign demand, while consumption and investment components will recover more slowly. By 2022, the
economy will moderate to 2.8%, influenced by slow recovery in investment and uncertainties surrounding domestic
policies. In terms of inflation, upward surprises in the first months of 2020 led Banxico to stop the cycle of benchmark
rate reductions, and BBVA Research now predicts that the central bank will keep the interest rate unchanged at 4% for
the rest of this year. The next change in benchmark interest rates will depend on the Fed's next move.
With regard to the banking system, based on data from the National Banking and Securities Commission (CNBV, by its
acronym in Spanish) as of February 2021, loans decreased by 2.0% and an increase was observed only in the mortgage
portfolio, while total deposits increased 10.0% year-on-year. The NPL ratio increased year-on-year (20.5% in February
2021, reaching a ratio of 2.44%) and capital indicators remain comfortable.

Turkey
In Turkey, GDP growth reached 1.8% in 2020. Leading indicators for the first quarter of 2021 indicate robust economic
activity. Despite the upward revision in global GDP growth forecasts and sound current momentum, BBVA Research is
maintaining the previous GDP growth forecasts (5% for 2021 and 4.5% for 2022), based mainly on improvements in the
most recent data, which will be offset by uncertainties surrounding domestic economic policies, the tightening of
financial conditions and restrictive measures persisting in order to curb the pandemic.
With regard to the banking system, the central bank (CBRT) raised the base rate by 200 percentage points in March to
19%. BBVA Research predicts that CBRT will start cutting rates gradually toward the end of 3Q21, and that it will close
the year at around 16%. Inflation estimates have been adjusted to 15% by the end of 2021.
Based on data as of February 2021, the total volume of credit in the banking system increased 28.4% year-on-year (up
36.5% in Turkish lira and up 18.5% in foreign exchange), while deposits increased 27.3% year-on-year. These growth
rates include the effect of inflation. The NPL ratio stood at 4.02% at the close of February 2021.

Argentina
With regard to growth, following a contraction of 9.9% in 2020, BBVA Research predicts that the economy will recover
to 7% in 2021 and 3% in 2022. Indicators available for the first quarter of 2021 suggest that consumption and investment
are recovering, but employment will recover very slowly, which will impact private consumption. Growth is not free from
risks such as a new wave of COVID-19 infections or slow vaccine rollout, although factors such as improved soy prices
and increased allocations for Special Drawing Rights (SDRs) by the International Monetary Fund (hereinafter IMF)
increase the government's room for maneuver. Argentina is likely to reach an agreement with the IMF to refinance its
external debt from October. Inflation closed the year at 36% and BBVA Research still predicts that it will stand at around
50% by the end of 2021.
In the banking system, the positive trend for both lending and deposit growth continued in January 2021, with growth of
34.0% and 57.8% respectively. Both were influenced by high inflation. The NPL ratio, however, fell slightly to 3.8% in
January 2021.

Colombia
Growth data indicate that Colombia's contraction in activity reached 6.8% in 2020 and, for the next two years, BBVA
Research predicts a partial recovery of 5.5% in 2021 and 4.8% in 2022. This improvement could be limited by the effect
of new outbreaks of COVID-19, by new restrictions on movement and by the effect of the announced fiscal reform, which
could affect consumption and investment. Furthermore, consumption will continue to be hindered by the negative effect
on employment, particularly in the formal sector of the economy, which will not recover to pre-pandemic levels until
2023. Inflation remained low in the first few months of the year and BBVA Research predicts that it will converge to 2.9%
by year-end. The Central Bank kept the benchmark interest rate unchanged at 1.75%, and BBVA Research believes it will
remain unchanged for the rest of the year, with a new cycle of gradual increases next year.
8
Total lending in the banking system grew 3.4% year-on-year at the end of January 2021, due to growth in the
commercial portfolio driven by government-approved letters of credit and guarantee programs during the pandemic.
The system's NPL ratio as of January 2021 was 5.18%. Total deposits increased by 12.6% year-on-year in the same
period.

Peru
With regard to growth, the Peruvian economy contracted 11.1% in 2020, as it was hit hard by the pandemic, particularly
in the first half of the year. In the first months of 2021, the effects of the new wave of COVID-19 infections have resulted in
new restrictions that could impact activity, albeit to a lesser extent. BBVA Research predicts activity will expand to 10% in
2021 followed by growth of 4.8% in 2022. Public and private consumer spending will be key to recovery this year, as will
be recovery in the mining industry influenced by the rise in copper prices. Activity dynamics this year, however, will be
subject to uncertainty relating to the electoral process, which could also impact infrastructure plans scheduled for 2022.
With regard to inflation, BBVA Research predicts that this will stand at 2.3% at the end of the year, within the target set by
the central bank, which lowered the monetary policy rate to an all-time low of 0.25%. BBVA Research estimates that this
interest rate level will remain throughout the year and predicts that the first increase to the benchmark rate will not occur
until the first half of 2022.

The banking system showed high year-on-year growth rates for lending and deposits (up +14.0% and +25.4%
respectively, at the end of December 2020), due to the strong momentum of the Plan Reactiva Perú; the system showed
lower profitability levels due to the current crisis (ROE: 2.25% as of February 2021) but with contained NPLs (NPL ratio:
3.42% as of February 2021) due to the payment deferrals applied.

INTEREST RATES (PERCENTAGE)
                                                                                                31-03-21          31-12-20         30-09-20         30-06-20           31-03-20
Official ECB rate                                                                                   0.00              0.00             0.00             0.00               0.00
Euribor 3 months (1)                                                                                  (0.54)          (0.54)            (0.49)             (0.38)           (0.42)
Euribor 1 year (1)                                                                                  (0.49)            (0.50)            (0.41)             (0.15)           (0.27)
USA Federal rates                                                                                      0.25             0.25              0.25              0.25             0.25
TIIE (Mexico)                                                                                          4.00              4.25             4.25              5.00             6.50
CBRT (Turkey)                                                                                         19.00            17.00             10.25              8.25             9.75
(1) Calculated as the month average.

Foreign exchanges continued showing volatility during the first quarter of 2021. The macroeconomic expectations
improvement in the United States caused by new fiscal stimuli and a good rate of vaccination has contrasted with the
evolution in other geographical areas. The aforementioned has favored the U.S. dollar, which has appreciated 4.7%
against the euro. The Mexican peso, after a good behaviour in the last part of the quarter, registered an appreciation of
1.5% against the euro. Besides, the Turkish lira closes the quarter with a 6.3% depreciation against the euro, having been
harmed in March by instability caused by the shifts in the central bank. As to other foreign exchanges, Chilean peso and
Peruvian sol have appreciated against the euro 1.6% and 0.8% respectively, while the Argentine peso and Colombian
peso depreciated by 4.2% and 3.9% respectively

For information on the BBVA Group's exchange rate risk management policies, see the "Risk Management" chapter of
this report.

EXCHANGE RATES (EXPRESSED IN CURRENCY/EURO)
                                                                        Year-end exchange rates                                        Average exchange rates
                                                                                         ∆ % on                 ∆ % on                                                     ∆ % on
                                                                  31-03-21             31-03-20                31-12-20                          1Q21                       1Q20
U.S. dollar                                                           1.1725                 (6.6)                   4.7                       1.2048                        (8.5)

Mexican peso                                                       24.0506                      8.8                  1.5                     24.5272                         (9.9)

Turkish lira                                                         9.7250                 (25.9)                 (6.3)                       8.9156                       (24.4)

Peruvian sol                                                          4.4119                (14.9)                   0.8                       4.4105                       (14.9)

Argentine peso (1)                                                 107.8211                 (34.5)                 (4.2)                               -                         -

Chilean peso                                                         858.40                     8.0                  1.6                      872.59                           1.5

Colombian peso                                                     4,381.53                     1.6                (3.9)                    4,284.18                         (9.0)
(1) According to IAS 29 "Financial information in hyperinflationary economies", the year-end exchange rate is used for the conversion of the Argentina income statement.
9
Results
The Group's net attributable profit generated during the first three months of 2021, excluding the results from
discontinued operations (i.e. excluding the results generated by the Group's business in the United States included in
the sale agreement with PNC), amounted to €1,033m, a year-on-year growth of 139.4%. Taking into account the result
from discontinued operations, the BBVA Group generated a net attributable profit of €1,210m at the end of the first
quarter of 2021, which contrasts very positively with the losses accumulated in March 2020, when the outbreak of the
pandemic resulted in strong provisions for impairment on financial assets, as well as in the goodwill impairment in the
United States of €-2,084m.
Despite the complex environment and at constant exchange rates, the good performance in fees, the evolution of net
trading income (NTI) and the lower provisions for impairment on financial assets are noteworthy.
CONSOLIDATED INCOME STATEMENT: QUARTERLY EVOLUTION (MILLIONS OF EUROS)
2021 2020
1Q 4Q 3Q 2Q 1Q
Net interest income 3,451 3,477 3,553 3,537 4,024
Net fees and commissions 1,133 1,042 1,023 934 1,124
Net trading income 581 175 357 470 544
Other operating income and expenses (11) (147) 46 (80) 86
Gross income 5,155 4,547 4,980 4,862 5,778
Operating expenses (2,304) (2,264) (2,163) (2,182) (2,477)
Personnel expenses (1,184) (1,186) (1,124) (1,113) (1,272)
Other administrative expenses (812) (766) (725) (754) (860)
Depreciation (309) (312) (315) (316) (345)
Operating income 2,850 2,282 2,817 2,679 3,300
Impairment on financial assets not measured at fair value
(923) (901) (706) (1,408) (2,164)
through profit or loss
Provisions or reversal of provisions (151) (139) (88) (219) (300)
Other gains (losses) (17) (82) (127) (103) (29)
Profit/(loss) before tax 1,759 1,160 1,895 950 807
Income tax (489) (337) (515) (273) (204)
Profit/(loss) after tax from continued operations 1,270 823 1,380 678 603
(1)
Profit/(loss) after tax from discontinued operations 177 302 73 120 (2,224)
Corporate operations (2) - 304 - - -
Profit/(loss) for the year 1,447 1,430 1,454 798 (1,621)
Non-controlling interests (237) (110) (312) (162) (172)
Net attributable profit/(loss) 1,210 1,320 1,141 636 (1,792)
Of which:
Discontinued operations 177 302 73 120 (2,224)
Corporate operations - 304 - - -
Net attributable profit excluding discontinued and corporate
1,033 713 1,068 516 431
operations
(3)
Earning per share (euros) 0.17 0.18 0.16 0.08 (0.29)
Earning per share excluding discontinued and corporate
0.14 0.09 0.15 0.06 0.05
operations (3)
General note: the results generated by BBVA USA and the rest of Group's companies in the United States included in the sale agreement signed with PNC are presented in a single
line as "Profit/(loss) after tax from discontinued operations".
(1) Profit/(loss) after tax from discontinued operations includes the goodwill impairment in the United States registered in the first quarter of 2020 for an amount of €2,084m.
(2) Include the net capital gain from the sale to Allianz the half plus one share of the company created to jointly develop the non-life insurance business in Spain, excluding the health
insurance line.
(3) Adjusted by additional Tier 1 instrument remuneration.10
CONSOLIDATED INCOME STATEMENT (MILLIONS OF EUROS)
∆ % at constant
1Q21 ∆% exchange rates 1Q20
Net interest income 3,451 (14.2) (2.3) 4,024
Net fees and commissions 1,133 0.8 10.0 1,124
Net trading income 581 6.8 16.1 544
Other operating income and expenses (11) n.s. n.s. 86
Gross income 5,155 (10.8) 0.2 5,778
Operating expenses (2,304) (7.0) 1.8 (2,477)
Personnel expenses (1,184) (6.9) 1.7 (1,272)
Other administrative expenses (812) (5.6) 4.0 (860)
Depreciation (309) (10.7) (3.3) (345)
Operating income 2,850 (13.6) (1.0) 3,300
Impairment on financial assets not measured at fair value (923) (57.3) (52.4) (2,164)
through profit or loss
Provisions or reversal of provisions (151) (49.6) (47.8) (300)
Other gains (losses) (17) (41.4) (42.1) (29)
Profit/(loss) before tax 1,759 117.9 183.2 807
Income tax (489) 139.7 212.3 (204)
1,270 110.5 173.4 603
Profit/(loss) after tax from continued operations
Profit/(loss) after tax from discontinued operations (1) 177 n.s. n.s. (2,224)
Profit/(loss) for the year 1,447 n.s. n.s. (1,621)
Non-controlling interests (237) 37.8 85.8 (172)
Net attributable profit/(loss) 1,210 n.s. n.s. (1,792)
Of which:
Discontinued operations 177 n.s. n.s. (2,224)
Net attributable profit excluding discontinued operations 1,033 139.4 206.5 431
Earning per share (euros) (2) 0.17 (0.29)
Earning per share excluding discontinued operations (2) 0.14 0.05
General note: the results generated by BBVA USA and the rest of Group's companies in the United States included in the sale agreement signed with PNC are presented in a single
line as "Profit/(loss) after tax from discontinued operations".
(1) Profit/(loss) after tax from discontinued operations includes the goodwill impairment in the United States registered in the first quarter of 2020 for an amount of €2,084 m.
(2) Adjusted by additional Tier 1 instrument remuneration.
Unless expressly indicated otherwise, to better understand the changes under the main headings of the Group's income
statement, the year-on-year percentage changes provided below refer to constant exchange rates.
Gross income
Gross income showed year-on-year growth of 0.2%, underpinned by good performance in fees and NTI, which more
than offset the negative evolution of net interest income. Conversely, the other operating income and expenses line
recorded a loss of €11m, which contrasts negatively with last year's positive results due to the higher negative
adjustment for inflation in Argentina in this line in the first quarter of 2021.
GROSS INCOME (MILLIONS OF EUROS)
(1) At constant exchange rates: +0.2%.11
Net interest income showed a year-on-year decline of 2.3%, impacted by the low interest rate environment.
Net fees and commissions showed good performance in all geographic areas, except for Rest of Business, which
compares positively with the first quarter of 2020 (up 10.0%), as this line was barely affected by the outbreak of the
COVID-19 pandemic.
NET INTEREST INCOME PLUS NET FEES AND
NET INTEREST INCOME/ATAS(1) (PERCENTAGE)
COMMISSIONS (MILLIONS OF EUROS)
(1) Excluding BBVA USA and the rest of the Group's companies in the United States (1) At constant exchange rates: +0.5%.
included in the sale agreement signed with PNC.
NTI recorded excellent performance in all areas, with the exception of Mexico, where it fell slightly. For the Group as a
whole, NTI recorded a year-on-year growth of 16.1%.
The other operating income and expenses line recorded a fall of €-11m at the end of March 2021, compared to the
positive results of €86m in the same period last year, due to the higher adjustment for hyperinflation in Argentina and the
lower contribution of the insurance business in Spain and Mexico.
Operating income
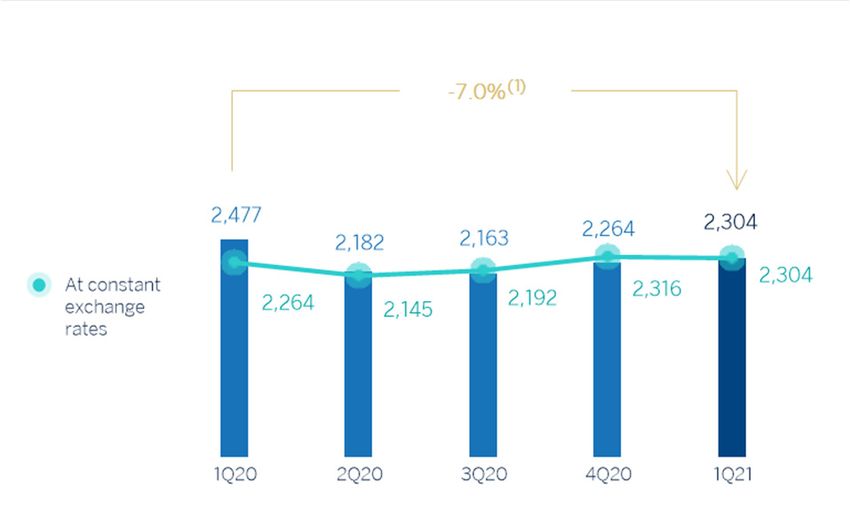
Operating expenses increased 1.8% compared to the first quarter of 2020, showing an increase in all areas except for
Spain and Rest of Business. Expenses remained controlled in the Corporate Center.
OPERATING EXPENSES (MILLIONS OF EUROS)
(1) At constant exchange rates: +1.8%.
As a result, the efficiency ratio stood at 44.7% as of March 31, 2021, with a slight increase compared to the ratio
achieved a year earlier (44.0%), though it still remains low.
The performance of gross income and expenses led to a negative operating income variation of -1.0% year-on-year.12
EFFICIENCY RATIO (PERCENTAGE) OPERATING INCOME (MILLIONS OF EUROS)
(1) At constant exchange rates: -1.0%.
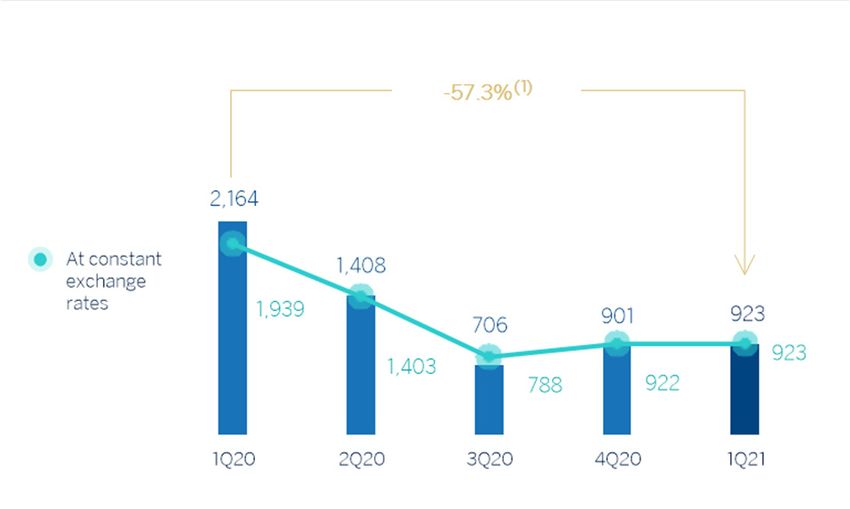
Provisions and other
At the end of March 2021, impairment on financial assets not measured at fair value through profit and loss (impairment
on financial assets) was significantly below the figure recorded in the previous year (down 52.4%), mainly due to the
negative impact of the worsening macroeconomic scenario in March 2020 as a result of the outbreak of the COVID-19
pandemic.
IMPAIRMENT ON FINANCIAL ASSETS
(MILLIONS OF EUROS)
(1) At constant exchange rates: -52.4%.
Provisions or reversal of provisions (hereinafter provisions) closed the first quarter of 2021 with a negative net balance
of €151m, 47.8% lower than the loss recorded in March last year, mainly due to higher provisions in Spain in the first
quarter of last year.
The other gains (losses) line closed March 2021 with a negative balance of €17m, 42.1% below the previous year.
Results
As a result, the BBVA Group generated profit/(loss) after tax from continued operations of €1,270m between January
and March 2021, representing a year-on-year change of +173.4%.
For its part, the results generated by the Group's businesses in the United States, included in the sale agreement with
PNC and classified as discontinued operations, generated €177m, which compares very positively with the losses of
€2,224m last year, which included the impact of the goodwill impairment in the country. As previously mentioned, these
results are recorded in the Corporate Center under the results from discontinued operations line.
The Group's net attributable profit in the first quarter of 2021 therefore amounted to €1,210m. Excluding the results
from discontinued operations, net attributable profit stood at €1,033m, representing year-on-year growth of 206.5%.13
NET ATTRIBUTABLE PROFIT EXCLUDING DISCONTINUED
NET ATTRIBUTABLE PROFIT
OPERATIONS(1) AND CORPORATE OPERATIONS(2)
(MILLIONS OF EUROS) (MILLIONS OF EUROS)
(1) Results generated by BBVA USA and the rest of Group´s companies in the United
States included in the sale agreement signed with PNC. These results include the
goodwill impairment in the United States in 1Q20 amounting to €-2,084m.
(2) Net profit before tax from the sale to Allianz of half plus one share of the company
created to jointly promote non-life insurance business in Spain, excluding the health
insurance line.
(3) At constant exchange rates: +206.5%.
Net attributable profit, in millions of euros, accumulated at the close of March 2021 for the various business areas that
comprise the Group was as follows: 381 in Spain, 493 in Mexico, 191 in Turkey, 104 in South America and 75 in Rest of
Business.
TANGIBLE BOOK VALUE PER SHARE AND
EARNING PER SHARE (1) (EUROS)
DIVIDENDS (1) (EUROS)
(1) Replenishing dividends paid in the period. (1) Adjusted by additional Tier 1 instrument remuneration.
(2) Excluding discontinued and corporate operations.
ROE AND ROTE (1) (PERCENTAGE) ROA AND RORWA (1) (PERCENTAGE)
(1) Ratios excluding profit after tax from discontinued operations in 1Q20, 2020 and (1) Ratios excluding profit after tax from discontinued operations in 1Q20, 2020
1Q21 and the net capital gain from the bancassurance operation with Allianz in and 1Q21 and the net capital gain from the bancassurance operation with
2020. Allianz in 2020.14
Balance sheet and business activity
The most relevant aspects related to the evolution of the Group's balance sheet and business activity as of March 31,
2021, are summarized below:
Loans and advances to customers (gross) registered a slight decrease of 0.1%, mainly as a result of Spain´s
deleveraging.
Customer funds fell by 1.7%, due to the performance of customer deposits, which contracted by 3.4% in the
quarter, even though the positive performance (up 3.9%) of other customer funds, i.e. mutual funds, pension
funds and other off-balance sheet funds, did not offset this decline.
Regarding the assets and liabilities of BBVA USA and the rest of the Group´s companies in the United States
included in the sale agreement signed with PNC, as the accounting regulation applied indicates, they are
classified, respectively, as non-current assets and liabilities held for sale, inside the other assets/other
liabilities line of the consolidated BBVA Group balance sheet as of 31-03-2021 and 31-12-2020. For management
purposes, to make the information comparable, the assets and liabilities of BBVA USA and the rest of the
Group´s companies in the United States included in the sale agreement signed with PNC are classified,
respectively, in the other assets/other liabilities line of BBVA Group consolidated Balance sheet as of 31-03-20.
CONSOLIDATED BALANCE SHEET (MILLIONS OF EUROS)
31-03-21 ∆ % 31-12-20 31-03-20
Cash, cash balances at central banks and other demand deposits 54,950 (16.1) 65,520 44,853
Financial assets held for trading 101,050 (6.7) 108,257 125,269
Non-trading financial assets mandatorily at fair value through profit or loss 5,488 5.6 5,198 5,079
Financial assets designated at fair value through profit or loss 1,110 (0.6) 1,117 1,175
Financial assets at fair value through accumulated other comprehensive income 72,771 4.8 69,440 55,038
Financial assets at amortized cost 363,754 (1.1) 367,668 374,496
Loans and advances to central banks and credit institutions 16,963 (18.4) 20,784 18,821
Loans and advances to customers 310,683 (0.1) 311,147 321,543
Debt securities 36,108 1.0 35,737 34,132
Investments in subsidiaries, joint ventures and associates 1,416 (1.4) 1,437 1,440
Tangible assets 7,703 (1.5) 7,823 8,424
Intangible assets 2,297 (2.0) 2,345 2,518
Other assets 109,165 1.7 107,373 111,796
Total assets 719,705 (2.2) 736,176 730,087
Financial liabilities held for trading 81,253 (6.1) 86,488 112,712
Other financial liabilities designated at fair value through profit or loss 9,714 (3.3) 10,050 8,641
Financial liabilities at amortized cost 475,813 (3.0) 490,606 458,852
Deposits from central banks and credit institutions 74,123 1.8 72,806 65,566
Deposits from customers 331,064 (3.4) 342,661 318,347
Debt certificates 57,418 (7.1) 61,780 61,588
Other financial liabilities 13,208 (1.1) 13,358 13,351
Liabilities under insurance and reinsurance contracts 10,325 3.8 9,951 9,593
Other liabilities 91,889 3.2 89,061 91,114
Total liabilities 668,994 (2.5) 686,156 680,913
Non-controlling interests 5,396 (1.4) 5,471 5,989
Accumulated other comprehensive income (14,718) 2.5 (14,356) (12,805)
Shareholders’ funds 60,033 1.9 58,904 55,990
Total equity 50,711 1.4 50,020 49,174
Total liabilities and equity 719,705 (2.2) 736,176 730,087
Memorandum item:
Guarantees given 43,110 (0.4) 43,294 45,47815
LOANS AND ADVANCES TO CUSTOMERS (MILLIONS OF EUROS)
31-03-21 ∆% 31-12-20 31-03-20
Public sector 18,895 (2.4) 19,363 21,799
Individuals 144,523 0.2 144,304 145,350
Mortgages 91,438 0.0 91,428 93,046
Consumer 30,082 1.7 29,571 29,623
Credit cards 11,721 (2.5) 12,016 11,667
Other loans 11,282 (0.1) 11,289 11,013
Business 144,516 (0.3) 144,912 152,154
Non-performing loans 14,933 1.8 14,672 14,542
Loans and advances to customers (gross) 322,866 (0.1) 323,252 333,845
Allowances (1) (12,183) 0.6 (12,105) (12,302)
Loans and advances to customers 310,683 (0.1) 311,147 321,543
(1) Allowances include the valuation adjustments for credit risk during the expected residual life of those financial instruments which have been acquired (mainly originated from the
acquisition of Catalunya Banc, S.A.). As of March 31, 2021, December 31, 2020 and March 31, 2020 the remaining amount was €334m, €363m and €418m, respectively.
LOANS AND ADVANCES TO CUSTOMERS (GROSS.
CUSTOMER FUNDS (BILLIONS OF EUROS)
BILLIONS OF EUROS)
(1) At constant exchange rates: +0.5%. (2) At constant exchange rates: -1.4%.
CUSTOMER FUNDS (MILLIONS OF EUROS)
31-03-21 ∆% 31-12-20 31-03-20
Deposits from customers 331,064 (3.4) 342,661 318,347
Current accounts 260,988 (2.0) 266,250 239,373
Time deposits 69,144 (8.6) 75,610 78,918
Other deposits 932 16.3 801 57
Other customer funds 106,916 3.9 102,947 96,438
Mutual funds and investment companies 67,828 4.6 64,869 59,507
Pension funds 37,189 2.7 36,215 34,853
Other off-balance sheet funds 1,899 1.9 1,863 2,078
Total customer funds 437,979 (1.7) 445,608 414,78616
Solvency
Capital base
At the end March 2021, BBVA's fully-loaded CET1 ratio stood at 11.88%, within the range of the Group's management
objective to maintain a ratio of between 11.5% and 12.0%, increasing the distance from the minimum requirement
(currently in 8.59%) to 329 basis points. This ratio includes the positive effect of closing the sale of BBVA Paraguay by
approximately 6 basis points. However, this ratio does not include the positive impact of the sale of BBVA USA and other
companies in the United States with activities related to this banking business, which, according to the current estimate
and taking the capital level of March 2021 as a reference, would place the fully-loaded CET1 ratio at 14.58%.
During the quarter, the fully-loaded CET1 ratio has increased by 15 basis points, mainly driven by the high organic capital
generation (up 17 basis points net of accrued dividends and remuneration of AT1 instruments). Moreover, the impacts
derived from the market evolution (down 13 basis points mostly related to the valuation of the portfolio at fair value) and
those derived from the consideration of the Targeted Review of Internal Models (TRIM) carried out by the European
Central Bank on the low default portfolio (which net of the release of the prudential buffer accrued in 2020 for this
purpose, has had an impact of approximately -9 basis points), have been partially offset by the positive impact from the
sale of BBVA Paraguay and the activity performance during the quarter in some geographical areas.
Fully-loaded risk-weighted assets (RWA) grew during the quarter by approximately €1,800m, including the effect of
exchange rates, the sale of BBVA Paraguay and the aforementioned impact of the TRIM review on the low default
portfolio.
Fully-loaded additional Tier 1 capital (AT1) stood at 1.62% at the end of March 2021. In this respect, in January 2021,
early redemption options were implemented for two preferential issuances, issued by BBVA International Preferred,
Caixa Sabadell Preferents and Caixa Terrassa Societat de Participacions Preferents, for £31m, €90m and €75m
respectively. On April 14, BBVA executed the early redemption of an issuance of preferred securities that can be
converted into BBVA ordinary shares (Contingent Convertible bonds, also known as CoCos) dating from 2016 for
€1,000m and a coupon of 8.875%. It should be noted that this issuance did not need to be refinanced due to the Group's
current capital strength. As of March 31, 2021, this issuance is no longer considered in the Group's capital adequacy
ratios.
The fully-loaded Tier 2 ratio stood at 2.25% on March 31. BBVA Uruguay issued the first sustainable bond on the
Uruguayan financial market in February for USD 15m at an initial interest rate of 3.854%.
The phased-in CET1 ratio stood at 12.20% at the end of March 2021, taking into account the transitional treatment of the
IFRS 9 standard. AT1 stood at 1.61% and Tier 2 at 2.34%, resulting in a total capital adequacy ratio of 16.16%.
In regards to shareholder remuneration, a cash amount of €0.059 per share was distributed from BBVA's share
premium account on April 29, 2021, as approved by the General Shareholders' Meeting on April 20, 2021.
SHAREHOLDER STRUCTURE (31-03-2021)
Shareholders Shares
Number of shares Number % Number %
Up to 500 356,931 41.1 66,867,844 1.0
501 to 5,000 403,495 46.4 703,337,365 10.5
5,001 to 10,000 58,193 6.7 409,802,697 6.1
10,001 to 50,000 45,687 5.3 874,377,516 13.1
50,001 to 100,000 3,301 0.4 224,600,541 3.4
100,001 to 500,000 1,483 0.2 268,505,348 4.0
More than 500,001 288 0.0 4,120,395,269 61.8
Total 869,378 100.0 6,667,886,580 100.0
FULLY-LOADED CAPITAL RATIOS (PERCENTAGE)17
CAPITAL BASE (MILLIONS OF EUROS)
CRD IV phased-in CRD IV fully-loaded
31-03-21 (1) (2) 31-12-20 31-03-20 31-03-21 (1) (2) 31-12-20 31-03-20
Common Equity Tier 1 (CET 1) 43,234 42,931 40,854 42,092 41,345 39,986
Tier 1 48,955 49,597 46,974 47,818 48,012 45,981
Tier 2 8,294 8,547 9,757 7,959 8,101 8,852
Total Capital (Tier 1 + Tier 2) 57,249 58,145 56,731 55,778 56,112 54,833
Risk-weighted assets 354,342 353,273 368,666 354,433 352,622 368,839
CET1 (%) 12.20 12.15 11.08 11.88 11.73 10.84
Tier 1 (%) 13.82 14.04 12.74 13.49 13.62 12.47
Tier 2 (%) 2.34 2.42 2.65 2.25 2.30 2.40
Total capital ratio (%) 16.16 16.46 15.39 15.74 15.91 14.87
(1) As of March 31, 2021, the difference between the phased-in and fully-loaded ratios arises from the temporary treatment of certain capital items, mainly of the impact of IFRS 9, to
which the BBVA Group has adhered voluntarily (in accordance with article 473bis of the CRR and the subsequent amendments introduced by the Regulation (EU) 2020/873).
(2) Preliminary data.
With regard to MREL (Minimum Requirement for own funds and Eligible Liabilities) requirements, BBVA issued preferred
senior debt for an amount of €1,000m in March 2021 with the aim of strengthening the eligible liabilities for compliance
with the MREL ratio and mitigating the loss of eligibility of two senior preferred and one senior non-preferred issuances
issued during 2017 that matures in one year. The term of the operation is 6 years with an early redemption option in the
fifth year and a coupon of 0.125%, the lowest coupon paid on such a product in BBVA’s history, implying practically a
zero share premium thanks to the high demand of 1.5 times oversubscription.
The Group estimates that, following the entry into force of Regulation (EU) No. 2019/877 of the European Parliament and
of the Council of May 20, 2020 (which, among other matters, establishes the MREL in terms of RWAs and sets new
maturities and transition periods, which the Group believes will apply to its MREL requirement), the current structure of
own funds and eligible liabilities enables compliance with its MREL requirement.
Finally, the Group's leverage ratio maintained a solid position, at 6.5% fully-loaded (6.7% phased-in). These figures
include the effect of the temporary exclusion of certain positions with the central bank provided for in the "CRR-Quick
fix”.
Ratings
In the first four months of 2021, BBVA's rating has continued to demonstrate its stability and all rating agencies have
continued to maintain BBVA's rating in category A. On March 31, 2021, the agency DBRS confirmed both BBVA's A (high)
rating and its stable outlook.
The following table shows the credit ratings granted by rating agencies.
RATINGS
Rating agency Long term (1) Short term Outlook
DBRS A (high) R-1 (middle) Stable
Fitch A- F-2 Stable
Moody's A3 P-2 Stable
Standard & Poor's A- A-2 Negative
(1) Ratings assigned to long term senior preferred debt. Additionally, Moody’s and Fitch assign A2 and A- rating respectively, to BBVA’s long term deposits.18
Risk management
Credit risk
The local authorities of the countries in which the Group operates initiated economic support measures in 2020, after
the outbreak of the pandemic, including the granting of relief measures in terms of temporary payments deferrals for
customers affected by the pandemic, as well as the granting of loans, especially to companies and SMEs, with public
guarantees.
These measures are supported by the rules issued by the authorities of the geographical areas where the Group operates
as well by certain industry agreements and should help to ease the temporary liquidity needs of the customers. The
classification of the customers’ credit quality and the calculation of the expected credit loss, once the credit quality of
those customers have been reviewed under the new circumstances, will depend on the effectiveness of these relief
measures. In any case, the incorporation of public guarantees is considered to be a mitigating factor in the estimation of
the expected credit losses.
For the purposes of classifying exposures based on their credit risk, the Group has maintained a rigorous application of
IFRS 9 at the time of the granting of the moratoriums and has reinforced the procedures to monitor credit risk both
during their validity and upon their expiration. In this sense, additional indicators have been introduced to identify the
significant increase in risk that may have occurred in some operations or a set of them and, where appropriate, proceed
to classify it in the corresponding risk stage.
Likewise, the indications provided by the European Banking Authority (EBA) have been taken into account, to not
consider as refinancing the moratoriums that meet a series of requirements, without prejudice to keeping the exposure
classified in the corresponding risk stage or its consideration as refinancing if it was previously so classified.
In relation to the temporary payment deferrals for customers affected by the pandemic, since the beginning BBVA has
worked on an anticipation plan with the goal of mitigating as much as possible the impact of these measures in the
Group, due to the high concentration of its maturities over time. As of March 31, 2021, the payment deferrals granted by
the Group amounted to €5,446m1.
Calculation of expected losses due to credit risk
To respond to the circumstances generated by the global COVID-19 pandemic in the macroeconomic environment,
characterized by a high level of uncertainty regarding its intensity, duration and speed of recovery, forward-looking
information has been updated in the IFRS 9 models to incorporate the best information available at the date of
publication of this report. The estimation of the expected losses has been calculated for the different geographical areas
in which the Group operates, with the best information available for each of them, considering both the macroeconomic
perspectives and the effects on specific portfolios, sectors or specific accredited. The scenarios used consider the
various economic measures that have been announced by governments as well as monetary, supervisory and
macroprudential authorities around the world. However, the final magnitude of the impact of this pandemic on the
Group's business, financial situation and results, which could be material, will depend on future and uncertain events,
including the intensity and persistence over time of the consequences derived from the pandemic in the different
geographical areas in which the Group operates.
The expected losses calculated according to the methodology provided by the Group, including macroeconomic
projections, have been supplemented with quantitative management adjustments in order to include issues that might
imply a potential impairment which due to its nature is not included in the model and which will be assigned to specific
operations in case this impairment materializes (e.g, sectors and collectives more affected by the crisis).
As of March 31, 2021, in order to incorporate those aspects not included in the impairment models, there are
management adjustments to the expected losses amounting to €316m in Spain. As of December 31, 2020 this concept
amounted to €223m. The variation is due to the use of €57m during the period, as well as an additional allowance given
the possibility that new extensions in the financing granted or agreements in order to ensure business viability
materialize.
The evolution of the exposure of corporate banking clients to the sectors that have been considered most vulnerable in
the COVID-19 pandemic environment is shown below:
1
It excludes BBVA USA and the rest of Group´s companies in the United States included in the sale agreement signed with PNC.You can also read