The PRS in Scotland for Houses - Is this meeting the needs of families? - A Savills research report for the Scottish Futures Trust
←
→
Page content transcription
If your browser does not render page correctly, please read the page content below
The PRS in Scotland for Houses -
Is this meeting the needs of families?
A Savills research report for the Scottish Futures Trust
Contents

 1 Executive summary

 2 Scope & purpose of report

 3   Macro PRS trends

 4   Scotland central belt PRS analysis

 5 Lessons from England on institutional PRS

                                               2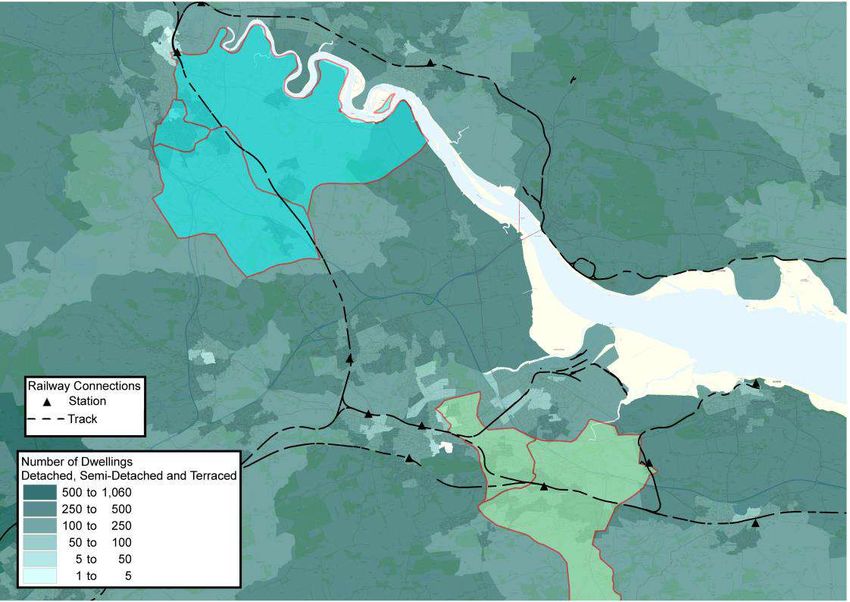
1
Executive Summary

                        3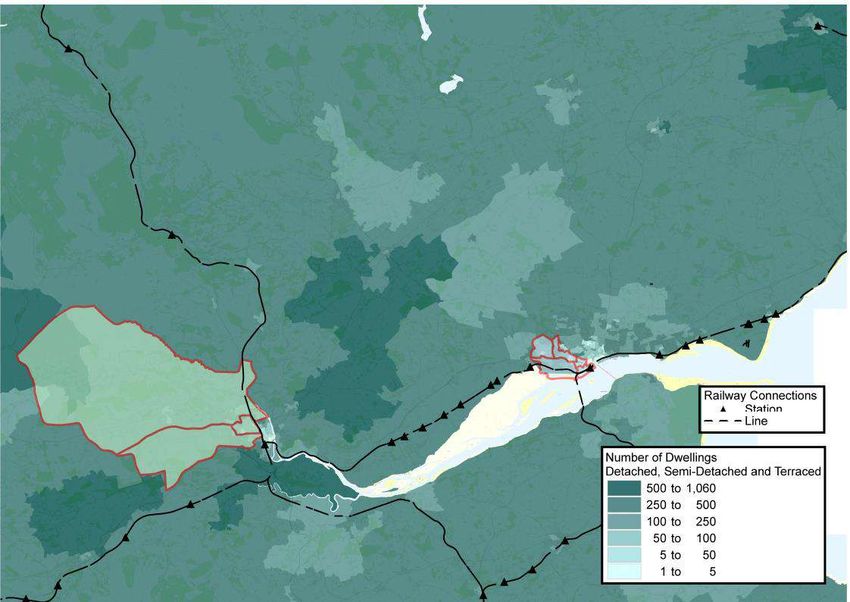
Key Findings
                              Suburban homes that are built to rent should be part of Scotland’s housing development pipeline and strategy.
               They offer the potential to deliver high-quality, modern homes available for long-term rent in popular, well connected suburban locations.
  In supporting this tenure and type of development there is the potential to accelerate the supply of new homes, which will reduce pressure on all parts of the
                        housing market and in turn give those living in the rental sector improved choice and a stronger sense of security.

• 393,000 or 15% of households in Scotland are estimated to live in the private rented sector and there is an
  established suburban rental market.

• At the time of the 2011 census, 38% of renters lived in houses and 58% of rental households were out
  with the four main cities. The Scottish Household Survey suggests that this trend has intensified with
  suburban areas witnessing strong rental household growth.

• Accessing home ownership has become increasingly challenging as a result of increased demand. House
  Price Inflation has outstripped wage growth and limited development of new homes has limited supply.

• As a result more people are renting, and renting for longer, often indefinitely with the need for deposits and
  mortgage limitations constraining access to owner occupation.

• Our Mosaic analysis of renters shows that in most locations analysed they are less affluent than owner
  occupiers within the same area. Many of these households would qualify for mid-market rent but it is
  unlikely that the supply of mid-market rented homes would be able to keep up with the levels of demand.
  Therefore high quality, modern housing delivered at market rents by the private sector would be very
  beneficial for these renting by improving choice and supply.

• High demand and limited supply of suburban housing for rent is creating affordability pressures in well
  connected and popular locations.

• Citylets report that average rents in Scotland increased by 5% year on year. Three and four bedroom
  properties are seeing growth in excess of this, at 7% and 10% respectively reflecting high demand for
  family accommodation.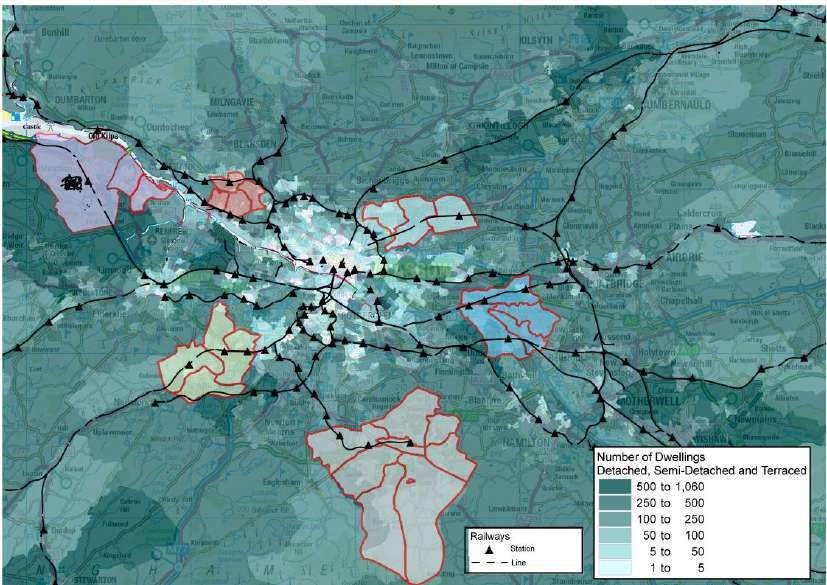
2
Scope and purpose of report

                                  5
Scope and report methodology
Scope of report                                                                                  Glossary of Terminology
The purpose of this report is to provide our client, Scottish Futures Trust, with an insight
into the existing and forecast levels of demand for Private Rented Sector (‘PRS’)                “PRS” or Private Rented Sector means those properties that let out under a market rent (therefore not social housing
properties in Scotland for couples and families, the family PRS market.                          stock or mid-market rental properties) including ‘buy to let’ landlord owned properties and Build to Rent.
The scope of the report focusses on houses, those with three or more bedrooms and
                                                                                                 “Build to Rent” means those properties which are built with the intention of being rented out often on a larger scale by
inclusive of detached, semi detached and terraced properties, rather than apartments,
and focusses primarily on suburban locations.                                                    institutional investors. These can include blocks of flats(multi-family) or houses (single family).

The report will comment upon the size of the rental market in each geography (region,            “Family PRS Market” means those properties let out by landlords at market rent that are principally houses rather
local authority and identified hot spots) including the number of households in houses           than apartments and hence tend to be in a suburban setting rather than the city centre. The properties will be attractive
rather than apartments, and the number of households with children.
                                                                                                 to couples in long term relationships. These couples may also have children or who may be planning to bring up
Further, we will provide analysis of the rental market in each location, both overall and        children. Others might be single adult households who either have children living with them full-time or part time.
specifically for houses with three or more bedrooms. This will allow us to understand
the wider rental market, and specific market factors influencing rents and demand for            “Family BTR Market” means those properties that are let out by institutional landlords at market rent to the Family PRS
larger, family orientated rental accommodation.                                                  Market.

                                                                 Methodology                                                                      We have then considered each of the local authorities within that region
                                                                                                                                                  commenting on individual population and households trends. We have
                                                                 In order to fulfil the scope of this report we will have divided the report into also carried out rental market analysis both overall and specifically for
                                                                 three main sections.                                                             three, four and five bedroom houses before commenting on the scale of
                                                                 1. Macro Context                                                                 the opportunity within that local authority.
                                                                 In order to understand the context in which the private sector has grown      We then identified rental market hotspots within that region, methodology
                                                                 we have considered three major factors; the housing crisis, challenges        for identifying these available overleaf, these hope to demonstrate that
                                                                 arising from low levels of development and a growing population. We           there are a number of different markets for whom suburban development
                                                                 have included comment on affordability, the history of the private rented     for rent would be beneficial.
                                                                 sector and rental market for houses to support this initial analysis.         3. English PRS Investment Review
                                                                 2. Rental Market Area Analysis                                                The institutional rental market is more established in England and Wales
                                                                 In order to best understand the potential opportunity for suburban build to   than it is in Scotland with a number of schemes active. This is particularly
                                                                 rent in Scotland and we have divided our focus area into five regions;        true of the suburban build to rent market.
                                                                 Greater Glasgow, Edinburgh and Lothians, Central, Tayside and Fife.           Therefore we have provided a brief history of rental investment market
                                                                 The latter sits between a number of regions and markets, therefore it was     before looking more specifically at suburban rental schemes. We have
                                                                 decided it would benefit from being reviewed separately despite only          considered where they have been developed, at what scale and
                                                                 being one local authority area.                                               compared let up rates to sales rates.
                                                                 For each region we have reviewed the demographics including both This helps us understand the role that suburban build to rent is playing in
                                                                 population and household growth and forecasts, and corresponding the development and delivery of new homes.
                                                                 implications for the private rented sector.

                                                                                                                                                                                                                         6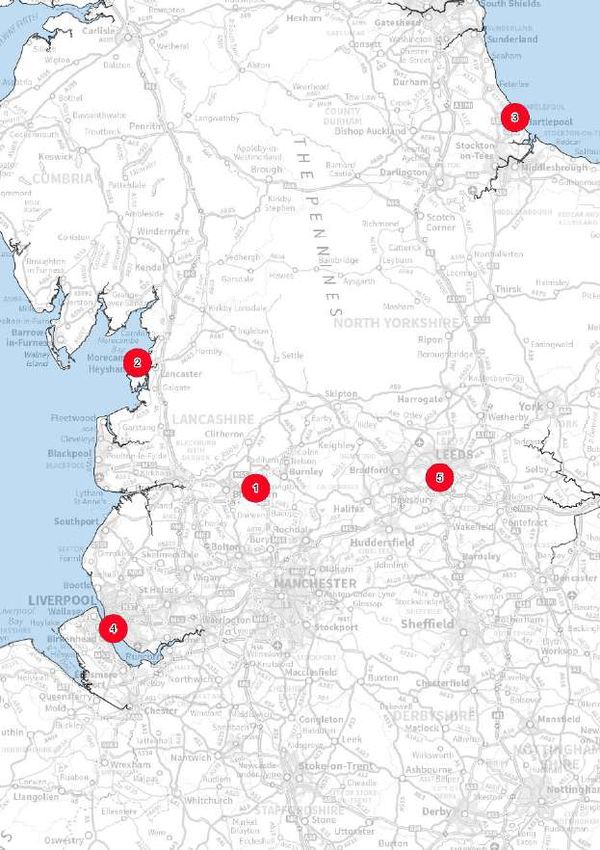
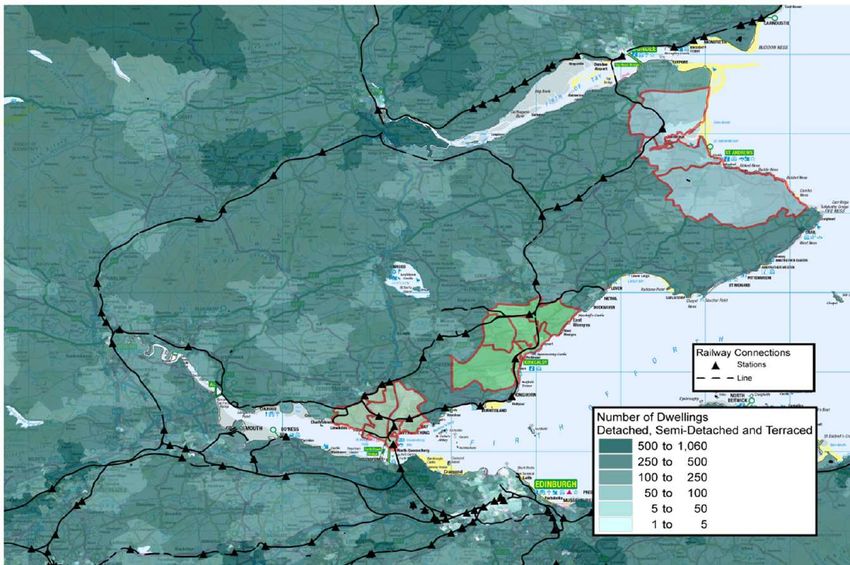
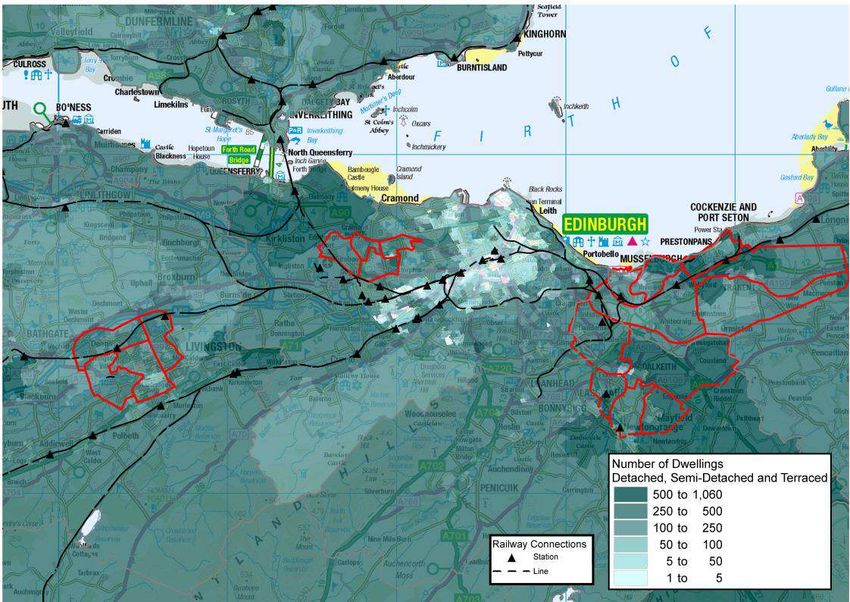
Suburban rental hotspots methodology
Scotland has a number of potential opportunities for the development of                   30 minutes travel time from Edinburgh Waverley at 7.40am on a Monday
professionally managed suburban rental schemes, some small and some large.
Instead of reviewing every market’s suitability for this product we have instead sought
to identify hotspots where a combination of factors strengthen the suitability of these
areas.
Within this analysis we actively sought to identify opportunities of different scales
acknowledging that some markets might benefit from developments of less than 50
units, meanwhile others would benefit from large developments. However, we have
tried to remain conscious of the management and servicing aspect of these
properties. Scale is important and it can be achieved through one large site, or a
number of smaller, but relatively close, sites in order to achieve economies of scale.
We considered these factors through a four step process, detailed below. We have
made reference to these steps throughout the rental hotspot analysis.
1. Public Transport
Our first step, we sought to identify suburban areas which were within a 30 to 45
minute reach of each region’s core by public transport. We have assumed that city
centers act as main employment hubs and if public transport connectivity to the city
centre was poor, this would have implications for the area’s attractiveness as a rental
market.
2. Established Locations
Having identified those within reach of the city core’s we then identified the
neighbourhoods and towns which had established amenities and offering which make
them attractive locations in which to live. For example retail offer and schooling from
which any development would benefit.
3. Development pipeline
Based upon the first two steps, we then prioritized the areas in which there is a
potential development land pipeline. For example through allocated sites, Community
Growth Areas or brownfield development. We also considered areas where
regeneration initiatives were underway because new development could benefit from,
but also contribute to, this process.
4. Market Analysis
We then considered the rental market within this area. This included analyzing stock
and rent levels for three, four and five bedroom houses which we then supplemented
by qualitative research acquired through speaking to local agents about their
properties and demand levels. We have supplemented this further through
demographic analysis in order to gain insight into who lives there.                        30 minutes travel time from Stirling and      30 minutes travel time from George Square at 7.40am
                                                                                           Falkirk at 7.40am on a Monday                 on a Monday
Source: Traveltime API/ Savills Research                                                                                                                                                       7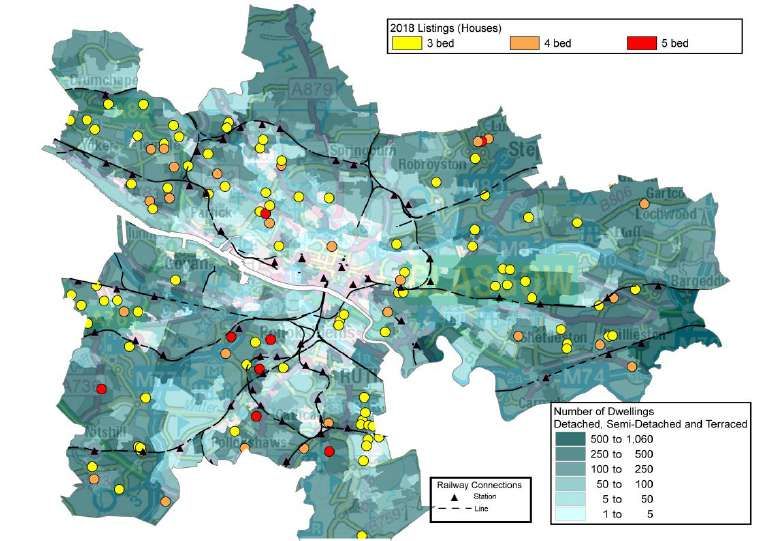
Experian data and mosaic profiles
Our demographic profile has been developed through use of 2011 census data and            Chart showing median incomes and median property values by Mosaic Group (UK)
supplemented with data from Experian’s ConsumerView Database.

                                                                                                                                                                                                                          Median property value
                                                                                                                                      Median income        Median property value
Experian’s UK ConsumerView Database combines public and Experian proprietary                                £80,000                                                                                         £700,000

                                                                                            Median Income
                                                                                                            £70,000                                                                                         £600,000
data and statistical models. These include the edited Electoral Roll, Council Tax                           £60,000                                                                                         £500,000
property valuations, house sale prices, self-reported lifestyle surveys, term time                          £50,000                                                                                         £400,000
students from HESA, social housing information from NROSH, broadband speed                                  £40,000
                                                                                                            £30,000                                                                                         £300,000
information from OFCOM, and other compiled consumer data.                                                                                                                                                   £200,000
                                                                                                            £20,000
                                                                                                            £10,000                                                                                         £100,000
This is developed into Experian’s Mosaic UK consumer classification which provides                               £0                                                                                         £0
a detailed understanding of the demographics, lifestyles, behaviour and locations of
all individuals and households in the UK. There are 15 mosaic groups, which
breakdown into 66 household types of varying degrees of affluence.

Our use of Mosaic Data:

We have used this data to calculate the number of households within each of our
hotspot areas and identify changes in tenure trends since 2011 It should be noted
that this data source is an estimate and therefore should not be taken as exact, but                                             MOSAIC Groups in order of median affluence
instead indicative. For example in areas with very transient populations there may                          Mosaic Group                                           Description
be an under and over counts as they attempt to try and track these regularly moving
households.                                                                                          Prestige Positions             Established families in large detached homes living upmarket lifestyles
                                                                                               City Prosperity             High status city dwellers living in central locations and pursuing careers with high rewards
In addition to this we have identified the largest mosaic groups within both the rental
                                                                                               Country Living                         Well-off owners in rural locations enjoying the benefits of country life
sector and owner occupation within each area in order to give us insight into who
lives within an area in respect of their employment and life stage and highlight any        Domestic Success                       Thriving families who are busy bringing up children and following careers
differences between renters and owner occupiers. We have also used this data to               Senior Security                        Elderly people with assets who are enjoying a comfortable retirement
comment upon incomes and presence of children.                                               Suburban Stability                        Mature suburban owners living settled lives in mid-range housing
                                                                                              Urban Cohesion                         Residents of settled urban communities with a strong sense of identity
This analysis of affluence helps us understand the types of people who are renting              Rural Reality                          Householders living in inexpensive homes in village communities
and those who are purchasing and can help us understand the local dynamics. For
                                                                                           Aspiring Homemakers                      Younger households settling down in housing priced within their means
example for those classified as aspiring home makers includes younger households
who are settling down, some will be able to raise a deposit and afford a mortgage,           Modest Traditions                            Mature homeowners of value homes enjoying stable lifestyles
but others will not. For example across the UK the median property value for this               Rental Hubs                            Educated young people privately renting in urban neighbourhoods
group is £141,344 which whilst below national averages, would require income of                Vintage Value                          Elderly people reliant on support to meet financial or practical needs
£31,802 (4x income multiplier) based upon a deposit of £14,000, almost 50% of                Transient Renters                Single people and young people privately renting low cost homes for the short term
required income.                                                                            Municipal Challenge                           Urban renters of social housing facing an array of challenges
                                                                                               Family Basics                        Families with limited resources who have to budget to make ends meet

Source: Experian UK Consumer View                                                                                                                                                                                                             8
3
Macro market context

                           9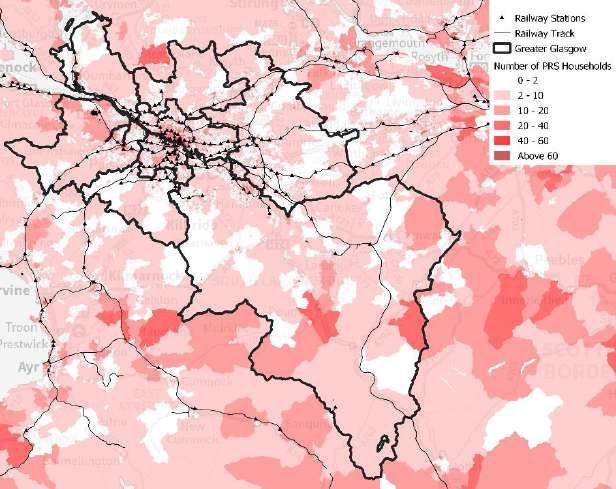
Macro market dynamics: the housing crisis
The UK housing market is facing a crisis. Years of under building and increasing
demand, generated by rising life expectancy, immigration and the growing number of Chart showing household growth and forecast for Scotland (2001-2041):
one-person households have created a chronic shortage of homes that people can 3,000,000
Number of Households
afford to buy in places that need them the most.
2,500,000
Scotland
2,000,000
Scotland’s population grew by 4% between 2008 and 2017, or 221,000 more people.
The number of households grew by 125,602 over the past ten years, or by 5.4%, 1,500,000
reaching 2,595,031 in 2017. Growth has been focused on the three main cities 1,000,000
(Edinburgh, Glasgow and Aberdeen) and their immediate suburbs.
500,000
The number of households is forecast to increase across Scotland to 2.7 million in
2041, from 2.4 million in 2018. One person households account for a significant 0
2007
2010
2029
2032
2001
2002
2003
2004
2005
2006
2008
2009
2011
2012
2013
2014
2015
2016
2017
2018
2019
2020
2021
2022
2023
2024
2025
2026
2027
2028
2030
2031
2033
2034
2035
2036
2037
2038
2039
2040
2041
share of the growth, but so do other groups suggesting demand for a range of house
types.
Scotland does not have a national housing target but it is generally understood to be 1 adult households 2 adults 3+ adults 1 adult, 1 child 1 adult, 2+ children 2+ adults, 1+ children
around 25,000 homes, and we have not been developing at that level since 2007.
Last year, year to June 2018, 18,182 new homes were built in Scotland. Private Chart showing number of new build completions in Scotland (1997-2018)
sector completions dropped slightly but the total number of completions increased Private Sector Starts Social Sector Starts
due to increased social housing development; completions by RSL’s and local
authorities increased by 1,000 units year on year, reaching 4,688 homes. 30,000
Despite this, there remained a 7,000 shortfall in development in 2018, the tenth
consecutive year, which suggests that Scotland, like the rest of the UK, is seeing a 25,000
shortage of new housing across all tenures despite a growing population and
households.
Number of Households
Therefore, there is need for delivery across a range of tenures and types in order to 20,000
deliver at the level needed.
England 15,000
In England it is estimated that 300,000 homes are required p.a.; with only 216,000
constructed last year, that implies an 84,000 shortfall. 10,000
The nature of housing supply hasn’t met the growing demand for smaller, more
plentiful households fuelling an increase in shared households which has been 5,000
exacerbated by affordability constraints on buying.
Household formation rates have increased rapidly since 2003 and outpaced supply
0
since 2008/09. As a result of this, young adults are leaving home later and when they YT YT YT YT YT YT YT YT YT YT YT YT YT YT YT YT YT YT YT YT YT YT
do, they share with other tenants at a higher rate than previously. June June June June June June June June June June June June June June June June June June June June June June
1997 1998 1999 2000 2001 2002 2003 2004 2005 2006 2007 2008 2009 2010 2011 2012 2013 2014 2015 2016 2017 2018
Source: National Records of Scotland, Scottish Government 10Macro market: growth in the PRS
History of the PRS Chart showing percentage of rental households by type (2016-2021)
Private renting was the majority tenure in the UK until after the Second World War.
Percentage of Households
40
After 1918 large blocks of rental flats were developed in UK cities (especially
London), many of which were bought and managed by companies.
30
Following the war, tightening rent regulations made rental investments uneconomic
and the buildings were gradually broken up and sold as individual units. 20
The PRS declined until the deregulation of rents and tenancies in the 1988 Housing
Act and the 1996 introduction of Buy to Let mortgages for small investors provided the 10
conditions for the sub-market to grow.
In 1991 the PRS comprised 9% of UK households, a number that grew to 17% in 0
2010 and 22% today. Within Scotland it has grown from 7% in 1993, to 15.2% in Large family Single parent Small family Single adult Small adult Large adult Older smaller Single older
2017.
This rapid growth has been fuelled by challenges associated with accessing 2013 2014 2015 2016 2017
homeownership, which has been caused by three primary factors; increased demand,
House Price Inflation (HPI) outstripping wage growth and limited supply. As Chart showing change in share of households by tenure (England and Wales)
demonstrated in the bottom chart, showing data from the English Housing Survey,
Social Rented Private Rented Owner Occupied Forecast
equivalent data is not available in Scotland but the trends are similar. 80%
Households in the PRS
The private rented sector today includes all households (e.g. students, sharers, young 70%
Proportion of housing in England
professionals, couples, families) that rent privately, generally using an Assured
Shorthold Tenancy contract in England and Wales, similar to the Short Assured 60%
Tenancies previously used in Scotland.
In Scotland The Private Housing (Tenancies) (Scotland) Act of 2016 introduced a new 50%
Credit crisis and change in
standardised PTS tenancy in Scotland, amongst other reforms to the tenure, and in Growth of home ownership
Post war - large rented market perception.
doing so replaced Short Assured Tenancies in Scotland for new tenancies although 40% through Right to Buy (RTB)
sector tied to housing Restricted mortgages and
some older tenancies remain on SAT agreements. and **MIRAS from 1970s
deposit affordability
The National Records of Scotland estimated that there are 393,000 households in the 30%
PRS in Scotland (2017). The tenure has grown by 155% growth over 20 years. There
were 154,000 households in 1998. 60% of growth in the PRS occurred between 2008
20%
and 2017 (the past ten years).
Families account for around 25% of households in the PRS, or just short of 83,000 10%
households. The Scottish Household Survey estimates that 38% of rental households
live in houses which is on par with the share in 2011 despite the changing dynamics
of the tenure, with has witnessed more families and more established households 0%
1971
1931
1936
1941
1946
1951
1956
1961
1966
1976
1981
1986
1991
1996
2001
2006
2011
2016
2021
2026
living in the tenure; 48% of households in the private rented sector are aged over 35.
Source: Scottish Household Survey/ English Household Survey 11Macro market: house price growth and implications for home ownership
The affordability of buying a home in the UK is becoming increasingly constrained. Chart showing both Wages and House Prices indexed to 1980 (United Kingdom)
House prices in London are 7x higher than their levels in 1993, compared to 4x
nationally. Wages (Index) House Prices (Index)
In 1980 the introduction of Right to Buy cemented the Government’s pivot away from
Index = 100 in Q1 1980
1000
social housing. In the following decade, free-market policies sparked a period of
significant economic growth that coincided with a housing boom, which peaked in 800
1989 as mortgage affordability declined. 600
The mid 1990s saw another period of economic growth as well as the introduction of 400
buy-to-let mortgages, both of which stimulated demand for property. This cycle was
largely uninterrupted until the global financial crisis (GFC) in 07/08. Since the GFC 200
prices have been supported by loose monetary policy combined with the continued 0
1989 Q1
2002 Q1
2016 Q1
1980 Q1
1981 Q1
1982 Q1
1983 Q1
1984 Q1
1985 Q1
1986 Q1
1987 Q1
1988 Q1
1990 Q1
1991 Q1
1992 Q1
1993 Q1
1994 Q1
1995 Q1
1996 Q1
1997 Q1
1998 Q1
1999 Q1
2000 Q1
2001 Q1
2003 Q1
2004 Q1
2005 Q1
2006 Q1
2007 Q1
2008 Q1
2009 Q1
2010 Q1
2011 Q1
2012 Q1
2013 Q1
2014 Q1
2015 Q1
2017 Q1
expansion of buy-to-let. These three cycles demonstrate how price growth has been
fuelled by the expanding demand for property ownership since the 1980’s.
Affordability in Scotland
House prices in Scotland during 2018 were 4% higher than they were during the
previous year (2017) and 9% higher than the ten year average (2009-2018).
However, this hides regional variation. Some local authorities, and some more local
markets, command significant premiums on the national average; for example the
City of Edinburgh and East Renfrewshire, the average transaction price exceeds
£250,000. The central belt of Scotland has witnessed the strongest annual growth,
reflecting the high levels of demand within this well connected area.
The full time median salary in Scotland was £29,286 in 2018. The average
transaction price in Scotland was £179,108 in 2018, or approximately 6 times the
median income.
Based upon the average transaction price, a 10% deposit equates to 61% of the
median full-time annual gross salary in Scotland. This deposit alongside the standard
four times income multiplier, would leave a £44,053 shortfall for those buying on a
single income. The picture is more optimistic for those purchasing with two median
incomes, but saving a deposit can still prove prohibitive for many.
Rental Growth exceeds transaction price growth
Citylets reports that average rents in Scotland increased by 5% in 2018 compared to
2017 with three and four bedroom properties seeing growth in excess of this, at 7%
and 10% respectively reflecting high demand for family accommodation. Over the
past ten years rents have increased by just shy of 20% on average and the average
rent stands at £771 per month.
Source: Registers of Scotland, Citylets, NOMIS 12Macro market: PRS in Scotland (Houses)
Cities Households:
The four cities accounted for 135,430 rental households or 42% of all rental
households in Scotland. Of these just 14% on average lived in houses with those in • 38% of rental households in Scotland in 2011 lived in houses, this equates to 5% of all households in Scotland at the
Aberdeen (20%) and Dundee (19%) more likely to rent a house, than those in time or 126,181 households out of a total of 325,372 in the private rented sector.
Edinburgh (13%) or Glasgow (10%). • This compares to 63% of households across all tenures who live in houses and the 77% of owner occupiers which
suggests that houses are predominately occupied by those owner occupying.
There were 275,710 people living in rental households of which 18% lived in houses
equating to a ratio of 2.8 people compared to in the 1.7 for renters in flats. This People:
suggests that rental households in houses are larger than in flats. • 45% of renters in 2011, or 304,198 people (6% of Scotland’s population), rented a house rather than a flat in
Scotland. This equates to 6% of all people.
Suburban
Within many suburban areas the share of renters renting housing is typically between • Rental households in houses tend to be bigger, at 2.4 people per household, compared to 1.8 people for those
40% and 65% with somewhat of an East/ West Divide. renting flats.
For example South Lanarkshire (42%), East Renfrewshire (48%) compare to East • This places them on par with those owner occupying their properties who generally have 2.3 people, which rises for
Lothian (57%), Midlothian (63%) and West Lothian (59%) which suggesting that those with a mortgage to 2.66 people.
renting houses is more prevalent in Edinburgh and the surrounds likely a
consequence of the higher transaction values in these areas.
100%
Despite this, the total share of households does not change hugely between areas
90%
with on average between 4% and 6% of total households within this category with the
exception of a couple of outliers – Renfrewshire and West Dunbartonshire. 80%
70%
Across the suburban areas there are typically 2.2 people per households overall and
whilst it is lower for the private rented sector overall, those in houses typically had 60%
between 2.4 and 2.6 people in them, with larger households more dominant in the 50%
West.
40%
Rural 30%
In many of the predominately rural local authorities the share of renters renting
20%
houses is around, or in excess of, 70% of rental households. This reflects the less
urban and less dense nature of housing in these areas. 10%
0%
For example in Aberdeenshire (72%), Dumfries and Galloway (80%), Highland
(71%), Moray (75%) and Orkney and Shetland (both 81%) the majority of renters rent
houses typically accounting for around 10% of total households across all tenures in
these areas. These areas are typically slightly smaller than suburban households
with on average between 2.2 people and 2.4 people per rental households in a
house.
Share of Total Renters in Houses Share of All Tenures in Houses Share of Owner Occupiers in Houses
Source: 2011 Census 134
Rental market analysis
14Greater Glasgow
Glasgow City, East Renfrewshire, Renfrewshire, East Dunbartonshire, West Dunbartonshire, North Lanarkshire, South Lanarkshire
Greater Glasgow offers a number of excellent opportunities for suburban BTR development due to region’s
numerous well connected neighbourhoods' and towns. There is an established suburban rental market, yet
listings remain limited. New purpose built homes for rent would improve options for tenants looking for more
space or a different type of property.
Greater Glasgow accounts for in excess of 1.7 million people and just shy of 800,000 households. The majority of these households
are within 45 minutes travel by public transport, or 30 minutes drive, of Glasgow’s city centre, the region’s economic core. The region
also contains many economically active towns.
The rental market is primarily concentrated within the City of Glasgow and it’s central neighbourhoods such as the West End,
Southside and Dennistoun, popular with typical, more transient rental groups including students and young professionals. Properties
in these areas are often relatively dense tenement flats of various sizes, interspersed with modern apartments.
Across the region 24% of rental households in 2011 lived in houses, and when the City of Glasgow is excluded the share rises to 40%
suggesting the region has an active suburban rental market. This equates to around 16,000 households in the surrounding local
authorities, with a further 5,500 in Glasgow.
Since 2011 the private rented sector has continued to grow and proportionally growth has been strongest in the suburban local
authority areas; West Dunbartonshire, East Dunbartonshire and South Lanarkshire have all witnessed in excess of 20% growth in
rental households between 2011 and 2017, compared to 8% growth in the City of Glasgow, which already had a significant rental
share of households.
Greater Glasgow Greater Glasgow’s population and households have been growing steady and this is forecast to continue. Recent development levels
Population (2011): 1,706,030 have delivered on average 4,669 units per year, supported considerably by Help to Buy funding and social housing grant funding,
both of which are unlikely to be available post 2021 at the same level.
Households (2011): 774,646
Number of PRS Households (2011): 91,974 Should the share of households living in the PRS remain at 13% then the Greater Glasgow City Region will have just shy of 14,000
%Share of PRS Households (2011): 12% additional households in the private rented sector by 2041. However, if each local authority were to see it’s share of households
increase by just 3% then the number would reach 40,000 additional homes. These figures are conservative compared to the growth
witnessed even over the past six years.
Population (2017): 1,745,251
Households (2017): 799,725 Just under half of this growth is anticipated to be in the City of Glasgow, and therefore would be anticipated to include some more
Number of PRS Households (2017): 104,472 urban rental demand but the remaining share will be in the surrounding local authority areas and consequently, in suburban locations.
%Share of PRS Households: 13% Therefore, from household growth alone there is significant potential for suburban build to rent development in Greater Glasgow.
Growth in PRS since 2011 12,498 However should high quality, professionally managed suburban rental products come forward we anticipate that demand would come
% Growth in PRS since 2011 12% not just from new households but existing households looking for a different type or size of property.
Household forecast (2041): 900,523
% Increase in Households: 13%
Source: 2011 Census, Scottish Household Survey, National Records of Scotland, Scottish Government, Savills Research 15City of Glasgow – demographics
%Share %Share Growth
% 2011 2001
No. PRS No. PRS Growth Hhlds %
Pop. Hhlds PRS Pop Hhlds PRS in PRS
Hhlds Hhlds in PRS forecast Increase
(2011): (2011): Hhlds (2017): (2017): Hhlds since
(2011): (2017): since (2041): Hhlds:
(2011): Hhlds: 2011
2011
593,245 285,693 50,665 18% 619,173 291,115 55,000 19% 4,335 8% 335,927 15%
• Over the ten years to 2017 the private rented sector grew by 15,000 households.
• Two thirds of the growth occurred between 2007 and 2012, when both the proportion
of, and number of, households within this tenure increased.
• Growth has been the result of households moving from both the social rental sector
and owner occupation, alongside new household formation.
• The inner urban areas have maintained, and grown, their rental populations between
2001 and 2011 but other areas have emerged, particularly along the main train lines Chart showing average rents by property type
Rental Market
with pockets of renters becoming more established. £2,500
• Flats accounted for 96% of listings within the City of
£2,000
• If Glasgow maintains the existing 19% of households in the private rented sector, in Glasgow during 2018, of the houses listed 50% had
£1,500 three or more bedrooms, accounting for just 2% of
2041 this will equate to an additional 8,800 more households living in the private
rented sector than there were in 2017, taking the total to 63,826. However, if the £1,000 the market.
share was to increase to 22% then the number would increase by 10,000 to 18,904 £500
• One and two bedroom properties accounted for
more households. £0 85% of total listings.
1 bed 2 bed 3 bed 4 bed 5 bed 1 bed 2 bed 3 bed 4 bed 5 bed
Glasgow rental market dynamic has changed in respect of both the types of Flats Houses • Overall rents increased by 4% annually and this is
properties people are renting and the tenant profile. 2016 2017 2018 on par with the five year annualised growth figure
Chart showing change in households by type in the PRS for the city.
• The share of rental households living in flats has been declining. In 2017 88% of
• Four bedroom flats and three, four and five
Glasgow’s renters live in flatted properties, compared to 97% in 2013. 50 bedroom houses have witnessed above average
• The share of rental households aged between 35 and 44 has been increasing and 40 growth over the past year.
now equates to 21% of rental households, up from 13% in 2013. 30
• The number of households with children have also increased. Single parents, small 20 • It should be noted that some larger properties will
families and larger families now account for 20% of households in the rental sector 10 be Houses of Multiple Occupation (HMO)
or approximately 12,000 households. 0 properties, which typically command a premium
Large Single Small Single Small Large Older Single
• Single person households continue to account for a significant share but the number family parent family adult adult adult smaller older
because they cater to the sharer market and
of small and large adult households have been increasing suggesting that sharing is therefore students and young professionals.
also becoming more prevalent. 2013 2014 2015 2016 2017
Sources: 2001 and 2011 Census, National Records of Scotland (NRS) and Scottish Household Survey (SHS), Citylets 2019 Q1 16City of Glasgow – rental market (houses)
Houses account for 4% of Glasgow’s rental market, and houses with three or more bedrooms account for just 2%. Therefore this is a small segment of the city’s rental market but it
plays a crucial role in providing the city’s renters with choice in respect of product often situated in the city’s suburban areas.
Increasing rents combined with falling stock levels suggest that this is an area where the market is undersupplied and would benefit from more development. The delivery of new
detached, semi-detached and terraced homes for rent would improve options and increase supply for those households seeking to rent in Glasgow and could be popular in
regeneration areas alongside more typically suburban locations.
The number of listings for houses with more than three bedrooms 350 £1,800
has been declining. Listings peaked in the period between 2011 and
2013 and year on year listings have fallen by 21%, and rents have £1,600
increased by 11% for these bedroom and property types. 300
£1,400
Three bedroom houses 250
£1,200
Three bedroom properties account for in excess of 70% of listings
Number of Listings
Average Rent
for houses in Glasgow. The number of listings have reduced and 200 £1,000
but rents have increased steadily over the past couple of years,
equating to an annualised rate of 4% over the past five years and £800
the average rent stood at £864 in 2018. 150
Four bedroom houses £600
100
Four bedroom properties have witnessed the most significant annual
increase in rents, up 16% annually. Meanwhile listings fell by 40% to £400
23, the lowest number since 2010. The annualised rate of rent 50
growth over the past five years stands at 4% and the average rent £200
was £1,316 in 2018.
0 £0
Five bedroom houses 2010 2011 2012 2013 2014 2015 2016 2017 2018
Five bedroom properties witnessed a small increase in listings.
Despite this, the average rent increased by 5% year on year and 3 bed houses - listing 4 bed houses - listing
stands at 3% annualised growth over five years. The average rent 5 bed houses - listing 3 bed houses - rents
was £1,562 in 2018.
4 bed houses - rents 5 bed houses - rents
Sources Citylets (2019 Q1)/ OSOpenSource 17West Dunbartonshire– demographics
%Share %Share Growth
% 2011 2001
No. PRS No. PRS Growth Hhlds %
Pop. Hhlds PRS Pop Hhlds PRS in PRS
Hhlds Hhlds in PRS forecast Increase
(2011): (2011): Hhlds (2017): (2017): Hhlds since
(2011): (2017): since (2041): Hhlds:
(2011): Hhlds: 2011
2011
90,720 42,167 3,052 7% 89,773 42,746 4,280 10% 1,228 29% 44,149 3%
• Over the ten years to 2017 the private rented sector grew by 2,392 households. This
is against a backdrop of low household growth, up by 2% over ten years or under
1,000 households.
• The number of private rented households saw an increase between 2007 and 2012,
stabilising before increasing again in 2015 and 2016. Growth has been the result of
declines in owner occupation because tenants living in the social sector have
increased by just short of 2,000 over the past ten years.
• Between 2001 and 2011 West Dunbartonshire witnessed an increase in the number Chart showing average rents by bedrooms Rental Market
of households renting within established rental areas along the main trains lines and £1,000
towns such as Clydebank and Dumbarton. • We do not have the same rental data for West
£750 Dunbartonshire as elsewhere.
• Should West Dunbartonshire maintain 10% of households in the PRS in 2041 this £500 • However, an initial analysis suggest that houses
would equate to a further 135 households but should the share increase to 13% the account for a small number of listings within West
£250
number would increase by 1,459 households. Dunbartonshire, despite around 30% of rental
£0 tenants living in houses.
West Dunbartonshire’s rental households are primarily found in flatted properties. 1 bed rents 2 bed rents 3 bed rents 4 bed rents
With limited listings for houses this suggests that this might be the result of lack Chart showing change in tenure (2008-2017)
• This suggests that many tenants have been in
of stock, rather than lack of demand. their properties for a long time, with little incentive
or reason to move.
• The Scottish Household Survey does not have an updated profile on the type of • Rental levels have been relatively steady within
accommodation West Dunbartonshire renters are living in. West Dunbartonshire over the past three years,
• At the 2011 Census one third of renters, approximately 1,000 rental households, lived the time for which we have strong data for, with
in houses, compared to just over two thirds living in flats. This compares to owner the exception of four bedroom properties which
occupation where two thirds of households live in houses and 28% of social rented have varied in response to fluctuations in stock
tenants. levels. For example last year there were 10
• The SHS also does not have information on the age or household structure of rental listings for four bedroom properties, compared to
tenants but the 2011 Census reported that 47% of households were single people and 20 the year before. The 50% drop in listings has
30% of households had dependant children. resulted in a 15% rental increase.
Sources: 2001 and 2011 Census, National Records of Scotland (NRS) and Scottish Household Survey (SHS), Rightmove 2019 Q1 18West Dunbartonshire– rental market (all property types)
West Dunbartonshire has a number of well established towns located along train lines leading into Glasgow. It is popular with a variety of different demographic groups, offering
waterfront living and proximity to the national park surrounding Loch Lomond.
Limited rent growth and low levels of population growth suggest that this area could have limited demand but small pockets of development could be well received by a market
which has limited supply and in doing so provide quality homes with security of tenure.
Despite having one of the fastest growing rental markets in
greater Glasgow, data on the rental market in West 180
Dunbartonshire is relatively scarce, particularly for larger
properties. Therefore by way of estimate we have provided some 160
comparables as evidence of key price points in the market.
140
120
100
Listings
3 bedroom flat 3 bedroom upper flat 80
Roman Crescent, Old Robert Burns Avenue, Drumry
Kikpatrick £595pcm - Unfurnished 60
£625pcm - Unfurnished
40
20
0
3 bedroom semi detached
£1,350
£1,000
£1,050
£1,100
£1,150
£1,200
£1,250
£1,300
£650
£300
£350
£400
£450
£500
£550
£600
£700
£750
£800
£850
£900
£950
house 4 bedroom detached house
Inchfad Road, Balloch Strathleven Drive, Alexandria
Up to 1 Bed 2 Bed 3 Bed 4+ Bed
£875pcm -Part-furnished £950pcm - Part-furnished
Source: Rightmove (2019 Q1) 19East Dunbartonshire– demographics
%Share %Share Growth
% 2011 2001
No. PRS No. PRS Growth Hhlds %
Pop. Hhlds PRS Pop Hhlds PRS in PRS
Hhlds Hhlds in PRS forecast Increase
(2011): (2011): Hhlds (2017): (2017): Hhlds since
(2011): (2017): since (2041): Hhlds:
(2011): Hhlds: 2011
2011
105,026 43,473 2,890 7% 107,950 45,690 3,655 8% 765 21% 52,203 14%
• Over the ten years to 2017 the private rented sector grew by 2,515 households.
• There was a significant jump between 2008 and 2009, when the share of households
jumped from 2.6% to 5.2%, from which it has been growing steadily reaching 8% in
2017.
• The most recent increases have been the result of households moving out of the
social sector.
• Kirkintilloch has represented East Dunbartonshire’s largest growing rental market Chart showing average rents by bedrooms Rental Market
between 2001 and 2011. However the number of rental households have increased
£2,000 • We do not have the same detail of rental data for
across the other towns too including in Bearsden and Milngavie. East Dunbartonshire as elsewhere.
£1,500
• Should East Dunbartonshire continue to have 7% of households in the private rented £1,000
• However, an initial analysis suggest that houses
sector in 2041 this would account for an additional 521 households but if it were account for a significant share of listings within East
increase to 10% the number would be 2,087. £500 Dunbartonshire, or around 30%.
£0 • Rents across all properties types and sizes have
More of East Dunbartonshire’s rental households can be found in houses than 1 bed rents 2 bed rents 3 bed rents 4 bed rents
been increasing steadily over the past few years,
elsewhere, reflecting the very suburban nature of the area but low stock levels median rents increased by 14% according to
and rising rents suggest demand is higher. Chart showing change in tenure (2008-2017)
Rightmove.
• The Scottish Household Survey does not have an updated profile on the type of • Whilst listings for one, two and three bedroom
accommodation East Dunbartonshire renters are living in. properties have been increasing, those for four
• At the 2011 census 50% of renters, approximately 1,400 households, lived in houses. bedroom properties have fallen.
This compares to owner occupation where 80% of households lived in houses and
48% of social rented tenants.
• The SHS also does not have information on the age or household structure of rental
tenants but the 2011 census reported that 42% of households were single people and
37% of households had dependant children. This equated to just over 1,000
households with children.
Sources: 2001 and 2011 Census, National Records of Scotland (NRS) and Scottish Household Survey (SHS), Citylets 2019 Q1 20East Dunbartonshire– rental market (houses)
East Dunbartonshire is a popular suburban location with a number of well connected towns which predominately appeal to families due to the well regarded schooling available.
The development of quality family homes for rent would provide an opportunity for households to access homes in well connected locations with established family amenities
nearby. Whilst some parts of the market would be able to afford premium rents, the majority of development should aim to be at attainable rents to ensure affordability therefore it
will be important to support a range of locations and price points.
The number of listings for houses have fallen substantially since
they peaked between 2011 and 2012. Last year there were just 7 80 £2,500
listings for houses with more than three bedrooms, six of which
were three bedroom properties. 70
£2,000
Three bedroom houses 60
Average Rent
Three bedroom properties account for the majority of listings in
Number of Listings
East Dunbartonshire and their share has been steadily 50
£1,500
increasing. Rents have grown at an annualised rate of 6% over
the past five years and have increased by 4% in the past year. 40
Average rent stood at £1,065pcm in 2018.
Four bedroom houses £1,000
30
There were no four bedroom houses available last year in East
Dunbartonshire. This follows a number of years declining listings.
20
In 2011 there were 23 listings and in 2017 just 2. Annualised
growth stood at 13% (2013-2017). The average rent in 2017 was £500
£1,850pcm. 10
Five bedroom houses
Listings for five bedroom properties have been declining too. 0 £0
201020112012201320142015201620172018
Rental growth has not been as steady due to lack of stock, but
the one listing last year achieved a premium at £2,200pcm. 3 bed houses - listing 4 bed houses - listing
5 bed houses - listing 3 bed houses - rents
4 bed houses - rents 5 bed houses - rents
Sources Citylets 2019 Q1/ OSOpenSource 21South Lanarkshire– demographics
%Share %Share Growth
% 2011 2001
No. PRS No. PRS Growth Hhlds %
Pop. Hhlds PRS Pop Hhlds PRS in PRS
Hhlds Hhlds in PRS forecast Increase
(2011): (2011): Hhlds (2017): (2017): Hhlds since
(2011): (2017): since (2041): Hhlds:
(2011): Hhlds: 2011
2011
313,830 139,188 12,645 9% 317,839 145,182 16,000 11% 3,355 21% 161,318 11%
• Over the ten years to 2017 the private rented sector grew by 9,295 households whilst
overall household growth stood at 8,884.
• There was significant growth between 2007 and 2012, when the share of, and
number, of households in this tenure increased. It has since been steadily growing
and now stands at 11%. A significant share of this growth has been the result of a
reduction in owner occupation, with little change in social rented hosueholds.
• South Lanarkshire’s rental households have increased across the local authority Chart showing average rents by property type Rental Market
area but the strongest growth has been in and around the towns closest to Glasgow,
including East Kilbride, Hamilton and Blantyre. Growth has also been apparent, but £2,000 • Over the past five years rental growth has stood
to a lesser degree, in more remote towns such as Lanark and Lesmahagow. £1,500 at an annualised rate of 2%. But three and four
£1,000 bedroom properties have witnessed growth
£500 slightly ahead of this figure at 3% and 4%
• Should South Lanarkshire maintain it’s rental households at 9% of all households in £0 respectively.
2041. This would equate to an additional 1,745 households in this tenure, if it were to 1 bed 2 bed 3 bed 4 bed 5 bed 1 bed 2 bed 3 bed 4 bed 5 bed
increase to 12% then the number would increase by 6,585. Flats Houses • Houses accounted for 30% of listings within
2016 2017 2018
South Lanarkshire. This is a lower share of
Chart showing change in tenure (2008-2017) listings than it has been historically. Meanwhile
Within South Lanarkshire there is a significant difference between rents for flats
the number of smaller property listings have been
and houses, particularly for three, four and five bedroom properties increasing.
• The Scottish Household Survey does not have an updated profile on the type of
accommodation South Lanarkshire’s renters are living in, but at the 2011 census • Houses has witnessed slightly stronger rental
42% of renters, approximately 5,265 households, lived in houses. growth than flatted properties, particularly in the
last year in relation to four bedroom houses
• This compares to owner occupation where 82% of households live in houses and
despite an increase in the number of listings.
47% of social rented tenants.
• The SHS also does not have information on the age or household structure of rental
tenants but the 2011 census reported that 43% of households were single people
and 33% of households had dependant children. This equated to just over 4,190
households with children.
Sources: 2001 and 2011 Census, National Records of Scotland (NRS) and Scottish Household Survey (SHS), Citylets 2019 Q1 22South Lanarkshire– rental market (houses)
South Lanarkshire has an active rental market for housing but the number of listings and average rents for three and four bedroom properties have remained relatively steady.
There are a number of attractive and popular towns in South Lanarkshire, many of which have community growth expansion plans in place. Therefore this an area which could
benefit from rental development to deliver professionally managed rental options within both new and existing new suburban areas.
The number of listings across South Lanarkshire for three, four 400 £2,000
and five bedroom houses have remained steady year on year at
241 and are now higher than they have been historically. £1,800
Meanwhile rents have been increasing at an annualised rate of 350
3% over the past five years. £1,600
300
£1,400
Three bedroom houses
250
Three bedroom properties account for 72% of house listings in £1,200
Average Rent
Number of Listings
South Lanarkshire. Rents have increased by 3% year on year
and this matches the annualised growth figure over the past five 200 £1,000
years. The average rent in 2018 was £704pcm.
£800
Four bedroom houses 150
The number of listings for four bedroom properties increased £600
year on year from 46 to 55, a 20% increase. Meanwhile rents 100
increased by 2%, below the five year annualised growth figure of £400
3%. The average rent was £1,101pcm in 2018. 50
£200
Five bedroom houses
The number of five bedroom listings increased by 4 during 2018 0 £0
from 9 to 13. This correlated with an increase in the average rent, 2010 2011 2012 2013 2014 2015 2016 2017 2018
growing from £1,204pcm to £1,438pcm. This likely represents a 3 bed houses - listing 4 bed houses - listing
change in the location of properties with some listings in Bothwell 5 bed houses - listing 3 bed houses - rents
and Strathaven, both premium markets.
4 bed houses - rents 5 bed houses - rents
Sources Citylets 2019 Q1 / OSOpenSource 23North Lanarkshire– demographics
%Share %Share Growth
% 2011 2001
No. PRS No. PRS Growth Hhlds %
Pop. Hhlds PRS Pop Hhlds PRS in PRS
Hhlds Hhlds in PRS forecast Increase
(2011): (2011): Hhlds (2017): (2017): Hhlds since
(2011): (2017): since (2041): Hhlds:
(2011): Hhlds: 2011
2011
337,727 145,998 11,710 8% 339,811 151,155 13,625 9% 1,915 14% 164,319 9%
• The private rented sector accounted for 2.5% of households in 2007 but doubled it’s
share between 2008 and 2012 and has doubled again since then.
• The majority of growth has been the result of reductions in owner occupation, down
from 65% to 57% and particularly in those owning their property with a mortgage.
• Between 2001 and 2011 the number of rental households across North Lanarkshire
increased and clusters have emerged in all of the main towns within this area and are
primarily found in the areas closest to train stations. For example in Cumbernauld,
Coatbridge and Motherwell. Chart showing average rents by bedrooms Rental Market
£1,500
2016 2017 2018 • The rental market in North Lanarkshire is active,
• Should the share of households in the PRS remain at 8% by 2041 there will be an £1,000 particularly for two bedroom properties, which
additional 1,164 households in the tenure, if it were to increase by 3% to 11% this accounted for over 50% of listings.
would equate to 6,093 more households. £500
• Overall the number of four bedroom properties
£0
The number of private rental households within North Lanarkshire have increased 1 bed rents 2 bed rents 3 bed rents 4 bed rents 5 bed rents being listed has increased slightly year on year but
all other bedroom sizes have witnessed a decline in
by 6,400 since 2008 and a significant share of households are in detached houses,
Chart showing change in tenure (2008-2017) listings.
but new households have limited choice.
• Despite this rents have been relatively steady
• The Scottish Household Survey does not have an updated profile on the type of increasing by 1% with the exception of five
accommodation North Lanarkshire’s renters are living in, but at the 2011 census 46% bedroom properties which witnessing the strongest
rental growth, up 12%.
of renters, approximately 5,330 households, lived in houses. This compares to owner
occupation where 83% of households live in houses and 44% of social rented
tenants.
• The SHS also does not have information on the age or household structure of rental
tenants but the 2011 census reported that 38% of households were single people and
37% of households had dependant children. This equated to just over 4,382
households with children.
Sources: 2001 and 2011 Census, National Records of Scotland (NRS) and Scottish Household Survey (SHS), Citylets 2019 Q1 24North Lanarkshire– rental market (houses)
North Lanarkshire has an active rental market for houses but the number of listings have remained limited despite a growing number of rental households.
The area is well connected and has a number of distinct markets and communities attracting a variety of different demographics. Many areas offer good value for money with rents,
particularly for three bedroom properties, remaining steady. There is an opportunity for build to rent development to increase the supply of modern, energy efficient homes for rent.
The listings data we have for three, four and five bedroom 20 £2,500
rental houses within North Lanarkshire is limited but
nevertheless the broad trends emerge. 18
16 £2,000
Three bedroom houses
14
Three bedroom properties account for a significant share of
Number of Listings
the listings. Rents have remained relatively static over the past 12 £1,500
Average Rent
eight years, hovering around £750 per month and as a result
they have witnessed little in the way of annualised growth. 10
Four bedroom houses
8 £1,000
Four bedroom properties witnessed 5% annualised growth
over the past five years. However over the past year growth 6
levelled out at 2%. Across the market as a whole, rents for all
four bedroom properties fell slightly to around £830 per month 4 £500
compared to £1,000 in our house sample.
Five bedroom houses 2
These properties account for a very small share of the market. 0 £0
Due to lack of consistent listing data it is hard to identify clear 2010 2011 2012 2013 2014 2015 2016 2017 2018
trends for houses. Across the market rents seem to have
increased year on year for the handful of listed properties 3 bed houses - listing 4 bed houses - listing
available. 5 bed houses - listing 3 bed houses - rents
4 bed houses - rents 5 bed houses - rents
Sources Citylets 2019 Q1/ OSOpenSource 25East Renfrewshire– demographics
%Share %Share Growth
% 2011 2001
No. PRS No. PRS Growth Hhlds %
Pop. Hhlds PRS Pop Hhlds PRS in PRS
Hhlds Hhlds in PRS forecast Increase
(2011): (2011): Hhlds (2017): (2017): Hhlds since
(2011): (2017): since (2041): Hhlds:
(2011): Hhlds: 2011
2011
90,574 37,225 2,381 6% 94,399 38,899 2,695 7% 314 12% 47,649 22%
• Between 2008 and 2012 the share of households in the PRS increased to over 10%
but has fallen back since to around 7%, following a slight increase in those owner
occupying. 1/3 or 5,000 households have been formed since the 2011 census
• The number of households grew across the local authority area between 2001 and
2011 and the biggest clusters can be seen in Darnley, Barrhead and Neilston but
also in the Giffnock and Clarkston areas, all are all well connected by train.
• In 2041 should the private rented sector still account for 7% of households then we
would anticipate a further 640 households in the PRS but should the share increase Chart showing average rents by property type Rental Market
back to 10% then there would be a further 2,070 households. £3,000 • The rental market within East Renfrewshire is
2016 2017 2018
£2,500 comparatively small but it is active with rents
East Renfrewshire is a popular suburban market offering good connectivity and £2,000
£1,500 increasing by 3% across all types and sizes from
well regarded schools but tenants have limited options. £1,000 £837pcm to £863pcm.
£500
• The Scottish Household Survey does not have an updated profile on the type of £0 • One and two bedroom flats have witnessed the
accommodation East Renfrewshire’s renters are living in, but at the 2011 Census 1 bed 2 bed 3 bed 4 bed 5 bed 1 bed 2 bed 3 bed 4 bed 5 bed strongest growth, both annually and over the past
48% of renters, approximately 1,147 households, lived in houses. Flats Houses five years.
Chart showing change in tenure (2008-2017) • Rent and number of listings for four bedroom
• The overall PRS sector has grown by approximately 300 households since and houses have fluctuated considerably but
therefore we can estimate that there has likely been an increase in the number of annualised growth over the past five years has
rental households in houses. This compares to owner occupation where 84% of stood at 7%. For example in 2018 the number of
households live in houses and 35% of social rented tenants. listings increased from 5 to 8 and rent fell from
£1,530pcm to £1,399pcm on average.
• The SHS also does not have information on the age or household structure of rental
tenants but the 2011 census reported that 42% of households were single people
and 39% of households had dependant children. This equated to just over 900
households with children.
Sources: 2001 and 2011 Census, National Records of Scotland (NRS) and Scottish Household Survey (SHS), Citylets 2019 Q1 26You can also read