Highway Safety Plan FY 2020 - September 2019
←
→
Page content transcription
If your browser does not render page correctly, please read the page content below
September 2019

Highway Safety Plan
FY 2020
Indiana
Highway Safety Plan
 NATIONAL PRIORITY SAFETY PROGRAM INCENTIVE GRANTS - The State applied for the following
incentive grants:
S. 405(b) Occupant Protection: Yes
S. 405(e) Distracted Driving: Yes
S. 405(c) State Traffic Safety Information System Improvements: Yes
S. 405(f) Motorcyclist Safety Grants: Yes
S. 405(d) Impaired Driving Countermeasures: Yes
S. 405(g) State Graduated Driver Licensing Incentive: No
S. 405(d) Alcohol-Ignition Interlock Law: No
S. 405(h) Nonmotorized Safety: No
S. 405(d) 24-7 Sobriety Programs: No
S. 1906 Racial Profiling Data Collection: No

Highway safety planning process
Data Sources and Processes
Figure 1: The Highway Safety Planning Process Flowchart

Problem Identification Process
Analyses of crash and traffic-related data and the resulting trends aid in determining where problems exist and
what program areas will be addressed. Using the data sources and partners below, each program area details the
identified problems. Funding priority will be given to programs that have the greatest impact on reducing
traffic-related injuries and fatalities. The problem identification process includes the utilization of the
observational seat belt usage surveys, data from the various partners discussed below, and the analysis of who,
what, where, when, and why for each type of crash.
Data

                                                                                                     1/94
Automated Reporting Information Exchange System (ARIES)
Nearly 100 percent of Indiana law enforcement agencies submit electronic crash reports into the Indiana State
Police (ISP) Automated Reporting Information Exchange System (ARIES). This system uses business edits to
provide users with only the areas of the report that need to be completed. It also includes a mapping feature and
enhanced VIN and INDOT data. Agencies must submit crash reports into ARIES within five days of a crash,
allowing ICJI staff to access accurate, up-to-date crash data.
Indiana University Public Policy Institute (PPI)
Indiana University Public Policy Institute (PPI), a partner of ICJI, publishes an annual collection of the state’s
motor vehicle crash facts and trends. Fact sheet topics include: problem identification, alcohol, children,
commercial vehicles, dangerous driving, motorcycles, non-motorists, occupant protection, and young drivers.
PPI also publishes county profile fact sheets for all 92 counties and a comprehensive document on strategies for
reducing traffic deaths and injuries that contains proven countermeasures for traffic crashes. The data used for
these publications are provided by ARIES, but are cleaned and queried outside of the ARIES system. Fact
sheets can be found under the traffic safety link in.gov/cji/2367.htm on the ICJI website.
Odyssey Case Management System
ICJI has obtained access to query the Odyssey Case Management System, which allows staff to view
electronically submitted traffic citations, including the charges, dispositions, file date, and county in which the
offense occurred. Demographic information, including gender and race, can also be obtained. This is one way
ICJI can measure law enforcement activity during grant funded periods. Although citation statistics are useful
in determining law enforcement activity, ICJI does not use citation information to establish goals. Over 11.5
million electronic citations and warnings have been issued since the program has been the recipient of federal
traffic records funding. There are 467 law enforcement agencies using the system. Odyssey is now in place in
322 courts in 70 counties.
Purdue Center for Road Safety (CRS)
The Center for Road Safety (CRS), affiliated with the School of Civil Engineering at Purdue University,
conducts research and develops engineering tools in the area of road safety, including driver and roadway-
related characteristics. CRS provides technical assistance, analysis, creates the survey system based on NHTSA
requirements, and produces a final report for the annual observed seat belt usage surveys conducted around the
state.
Fatality Analysis Reporting System (FARS)
FARS is a nationwide census providing NHTSA, Congress, and the American public yearly data regarding fatal
injuries resulting from motor vehicle crashes. Various FARS data reports and querying tools are available at
nhtsa.gov/FARS. FARS also annually provides the Traffic Safety Facts, Indiana report covering the most
recent 5 years of crash data. FARS data is central to many program targets set by ICJI.
Operation Pull Over (OPO) Database
The OPO database is a data repository and reporting tool created by and administered by ICJI. ICJI subgrantees
access the database to report on all programmatic activities from the reimbursable administrative costs to the
number of grant funded patrol hours and the resulting number of citations. This database is the source of
Indiana’s reported citations for seat belts, impaired driving, and speeding as part of the NHTSA core measures.
Oracle Business Intelligence Enterprise Edition (OBIEE) – INDOT Answers
                                                                                                        2/94
OBIEE was built for and is maintained by INDOT. INDOT regularly uses OBIEE to track and monitor
performance metrics data. The OBIEE database is similar to ARIES as both systems utilize ISP collision data
and provide methods for querying the data. OBIEE provides an alternative to ARIES and provides query results
in a different format. OBIEE query results are easily extractable to Excel format for additional analysis.
FY 2020 Indiana Core and Additional Performance Measures
Figure 2: FY 2020 Indiana Core and Additional Performance Measures

Evidence-Based Traffic Safety Enforcement Plan Summary
Evidence based enforcement begins with an analysis of appropriate data to form the problem identification.
Then proven countermeasures are deployed which target the identified problems. Following the deployment of
countermeasures, evidence based enforcement requires continuous follow-up and adjustments.
Prior to awarding any grant funds in FY 2020 to subgrantees, a thorough review will be conducted by ICJI of
current data resources and reports. This review will occur between the submission date of the FY 2020 HSP and
the awarding of funds. ICJI staff will receive the most recent and up-to-date data, reports, and analysis during
this time. This data will be used for problem identification and then followed with the appropriate selection of
countermeasures that work.
The six LELs play an important role in evidence based enforcement. LELs monitor all TSD police department
subgrantees with site visits and continuous monitoring. This includes an ongoing review of data, assisting

                                                                                                      3/94
agencies with the appropriate selection of countermeasures and reporting back to TSD program managers. Law
enforcement agencies that are high risk or fail to properly deploy evidence based enforcement receive an
increased level of monitoring and attention.
Enforcement efforts will be evidence-based, with the objective of preventing traffic, crashes, fatalities, and
injuries. The enforcement program will be continuously evaluated and the necessary adjustments will be made.
ICJI and the LELs will monitor law enforcement agencies’ activity reports both monthly and quarterly to
determine if adjustments are needed for their plans. When activity reports are received, they will be assessed
against the latest crash data to identify successful crash reductions in targeted locations, as well as new areas of
risk that may be developing. There will be continuous follow-up with agencies to address any lack of
performance issues or activities. Adjustments and follow-up as needed will be conducted throughout the fiscal
year by LELs and program managers.
State Demographics
Indiana consists of 92 counties and has an estimated 2018 population of 6,691,878. Eighty-four percent of the
population is between the ages of 18 and 64. Indiana residents are 85.1 percent white, 9.8 percent black, and
7.1 percent identify as Hispanic or Latino. Persons under 5 years old, under 18 years old, and 65 years old and
over made up 6.3 percent, 23.4 percent, and 15.8 percent, respectively, of the population. In 2017, there were
4,487,105 licensed drivers in Indiana. Indiana has 12,000 miles of Interstate, U.S. and State Routes, and 66,000
miles of county roadways. In total, Indiana roadways have 97,288 centerline miles and 203,080 lane-miles.
The following resources will be used for Indiana’s Evidence-Based traffic safety enforcement plan.
Indiana University’s Public Policy Institute (PPI)
PPI provides ICJI with annual briefs and data analysis on collisions regarding problem identification, alcohol,
children, commercial vehicles, dangerous driving, motorcycles, non-motorists, occupant protection, young
drivers, county profiles for all 92 Indiana counties, and a comprehensive strategies for reducing traffic deaths
and injuries book of proven countermeasures to traffic crashes. Additionally, ICJI requests county level data
specific to program areas to address the need for funding (e.g. counties ranked by lowest rate of restraint use or
highest rate of DUI). These documents and data provide category-specific analysis including highlighted age
groups, limited time and spatial analysis, and cross tabulations for injury level.
Purdue University’s Center for Road Safety (CRS)
CRS provides seat belt survey analysis and, in April 2019, provided a large data set identifying the worst 5
percent of Indiana intersections and road segments from 2016 through 2018. These data include injury level
data and collision time. Additional analysis is being undertaken to identify the worst of these 5 percent to
determine areas requiring additional law enforcement activity.
Odyssey Case Management System
The Odyssey Case Management system provides ICJI with access to electronically submitted traffic citations,
including the charges, dispositions, file date, and county in which the offense occurred. Demographic
information, including gender and race, can also be obtained. This is one way ICJI can measure law
enforcement activity during grant funded periods. Additionally, these data will be used to determine areas of
high risk for traffic violators and enforcement activities to combat them.
Operation Pull Over Database
ICJI’s OPO database provides similar, but less detailed information to the Odyssey Case Management system.
                                                                                                         4/94
In additional to using it for similar analysis, the OPO database may also be used to determine the most effective
use and locations of grant funded man-hours.
Oracle Business Intelligence Enterprise Edition (OBIEE) – INDOT Answers
ICJI will also employ the OBIEE system from INDOT. This system allows additional querying capabilities of
Indiana State Police data and yields large datasets for additional analysis. This system is updated daily with
Indiana State Police data.
Using the previously noted data sources, ICJI will identify the areas of most concern for any specific data
metric (i.e. motorcycle fatalities). NHTSA’s “Countermeasures That Work” will then be identified based on the
specific need of a location or region of the state. Grantees will be instructed on these specific countermeasures
and trained to ensure program fidelity at the local level. Program managers will provide a key role in the
countermeasure implementation and will be required to regularly and continuously monitor and adjust the
countermeasure as needed.
While analysis is ongoing, these data sources have already allowed ICJI to identify the following: worst Indiana
counties across multiple measures such as restraint use and impaired driving; the worst spans of time for
collisions based specific variables; and roadways where collisions are occurring. This allows ICJI’s Research
Division to provide law enforcement with specific plans of action for their program based on county specific
data (e.g. days and times, roadways, and maps of collision data).
ICJI is confident the data identified above will provide the necessary information to implement a state-wide
approach employing countermeasures resulting in improving traffic safety in Indiana. By funding over 150 law
enforcement agencies, utilizing the most up-to-date data, driving “Countermeasures That Work” programming,
and continuous monitoring of programs, ICJI’s funding to local law enforcement will yield a positive traffic
safety impact across the State of Indiana.
For equipment with a useful life of more than one year and an acquisition cost of $5,000 or more, ICJI shall
receive prior written approval from the Regional Administrator before making the purchase.
Data A
Processes Participants
Participants
It is essential that ICJI continues to collaborate with traffic safety stakeholders to remain current
about emerging traffic safety issues. This allows ICJI to take appropriate action to address any
identified problems.
The Governor's Council on Impaired & Dangerous Driving serves as a panel of experts in the
area of behavioral traffic safety. The Council, a sub-committee of ICJI’s Board of Trustees,
provides input on proposed traffic safety strategies, while supplying guidance on the Traffic
Safety Division’s pursuit of competitive funding opportunities. Strategies and funding
opportunities are meant to diversify and expand the number of agencies participating in making
Indiana roadways safe. The Council further advises the Traffic Safety Division on initiatives
that can increase effectiveness of impaired driving countermeasures. Through its input and

                                                                                                      5/94
opinions collectively, the Council provides guidance on the Traffic Safety Division’s
involvement in issues of public policy, and input on legislative proposals affecting the Traffic
Safety Division’s practices and programming. The Council also works with INDOT to
coordinate traffic safety strategies outlined in the HSP and Strategic Highway Safety Plan
(SHSP) whenever it is updated. INDOT works closely with ICJI through regular meetings and
communications about the status of goals and efforts outlined in the HSP and SHSP through the
monthly Indiana Crash Snapshot report that is exchanged between INDOT, ICJI, and FHWA.
ICJI will continue collaborating with the Traffic Records Coordinating Committee (TRCC), a
group of individuals from state and federal agencies dedicated to improving the state’s traffic
records systems. The TRCC includes representatives from ICJI, Bureau of Motor Vehicles
(BMV); Indiana Department of Transportation (INDOT); Indiana State Police (ISP); Federal
Highway Administration (FHWA); Indiana State Supreme Court; Indiana State Department of
Health (ISDH); Indiana State Coroner’s Association; Indiana Office of Technology; Indiana
Prosecutor’s Association; Riley Hospital for Children; Purdue Center for Road Safety; Indiana
University PPI; the Indiana Department of Homeland Security, Indiana Department of
Toxicology, and the Federal Motor Carrier Safety Administration (FMCSA). The TRCC seeks
to enhance the accessibility, accuracy, uniformity, timeliness, integration, and completeness of
statewide traffic-related information. The TRCC will meet October 9, 2019, February 12, 2020,
and May 20, 2020 at 1:00 PM to 2:30 PM.
ICJI will continue its partnership with Indiana University’s Public Policy Institute (PPI) to
obtain a research analysis of Indiana’s traffic safety trends as well as track the effectiveness of
ICJI’s countermeasures. The data obtained by PPI allows for ICJI and their partners to
determine whether programming is effective. Annual traffic safety fact sheets and a county
profile fact book allow ICJI and their partners to make informed policy and program decisions.
Lastly, ICJI will continue its partnership with Purdue University Center for Road Safety (CRS).
CRS seeks to strengthen injury data throughout the state by tracking the progress of the linkages
between crash, EMS, and hospital inpatient/outpatient databases. CRS does not own the
information in these three databases; however, they advise the owners of the data about source
quality on the results of linking packages. CRS assists ICJI by improving observational seat
belt survey designs and training observers on how to correctly obtain data. Once the surveys
are complete, CRS analyzes the raw data and provides ICJI with overall seat belt and helmet
usage rates and usage rates broken down into regions, vehicle type, gender, race, role (i.e.,
driver or passenger), and road class.
Description of Highway Safety Problems
                                                                                          6/94
ICJI and INDOT also agreed to three identical common performance targets in their HSP and HSIP. These
common performance targets are: Number of fatalities, rate of fatalities per VMT, Incapacitating Injury
(“Suspected serious” Injury) Target Setting MethodologyFatality/Injury CountBaseline projections are
calculated using fatality and “suspected serious” injury counts (or estimations) and applying an equation to
generate predictive values for 2017-2029. This was accomplished by the software built into Microsoft Excel for
applying a logarithmic trend line with a forward forecast of three years. The equation is of the form [y =
(A*ln(x) + B] and for 2019 and 2020 targets the equation is of the form [y = (A*.928)*ln(x) + B]. The .928 is
included for the 2019 and 2020 equation because Indiana is predicted to have a decrease in unemployment,
which correlates with an increase of drivers. The predicted annual Vehicle Miles Traveled (VMT) growth rate
for each of the next five years is estimated to be 1.20% from the last INDOT estimated VMT for 2020. For all
other targets (fatalities, serious injuries, and VMT) a five year rolling average is used. For example: Motorcycle
Fatalities per 100k Registrations the equation to get the 2020 target would be [(2015’s # + 2016’s # + 2017’s #
+ 2018’s target # + 2019’s target #)/5]. With numbers this looks like (48.35 + 45.17 + 59.46 + 52 + 52.13)/5 =
51.42.
Indiana has developed a process for selecting the appropriate projects for solving our highway safety problems
and meeting our highway safety performance goals. The primary goal of all highway safety programs is to
achieve a significant reduction in traffic fatalities and serious injuries on Indiana‘s roadways. All highway
safety programs require a strategic data-driven approach to improving highway safety. ICJI will provide
county-specific data to law enforcement agencies to determine who is initially qualified for each specific grant.
Only top 20 or 30 counties with the highest ratio of a specific collision to their overall collisions will receive
priority in that grant funding. ICJI’s traffic safety researcher will provide the updated data to the traffic safety
division, who will then determine who qualifies for funding. The traffic safety division will then host six
regional grant trainings for police departments in that region to notify them of what they are able to apply for.
This way when the solicitation for grant proposals is published police departments are aware if they will receive
priority. Grant funding is open to all departments, but priority will be given to those departments that are able
to demonstrate a need for funding through data.
In 2018, Indiana awarded 235 law enforcement agencies grant funding. Grant applications for the FY 2020
grant year will have four types of applications:
Existing Enforcement Grantees
New Enforcement Grantees
Traffic Records Grantees
Non-enforcement (Education) Grantees
All grant applications will be assigned to traffic safety program managers for reviewing and scoring based on
specific criteria. Once an application was received it was assigned to a program manager along with a project
evaluation template for a first review. A second review was completed by another traffic safety program
manager (i.e., occupant protection, impaired driving, etc.). Then the final score was calculated by averaging the
first two reviewers.
The traffic safety division will gather all the scores and rank the project applications by their average score of
the two reviews. Based on the overall average and any discussion, the traffic safety division will vote for either
approval or denial. Once the traffic safety division has completed its recommendations for all the applications, a
7/94list of the approvals and denials will be presented to the ICJI board of trustees for approval. Using the
performance goals as a guideline, the committee selects the state and local agency projects that justify to a need
for grant funding through data and that the funding will help achieve its short and long-term program goals
projections.
List of Information and Data Sources
The 2020 project selection were based on the input of many different data sources. Those that were used in the
planning process are:
ARIES, Crash database (2012-2018)
FARS data (2012-2017)
Federal VMT data (2012-2017)
Census data (2017-2018, estimate)
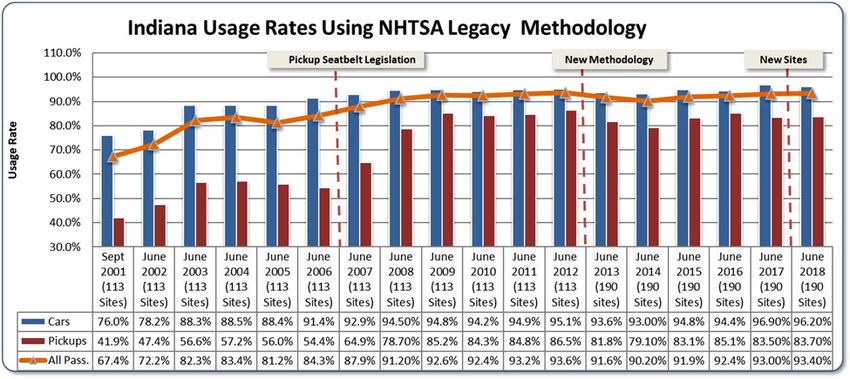
Observational seat belt and car seat surveys (2001-2018)
Driver and vehicle data (BMV)
Description of Outcomes
Indiana’s safety planning efforts have coordinated three targets with the Strategic Highway Safety Plan (SHSP)
which provides strategic direction for the Highway Safety Plan (HSP) as required under Highway Safety
Programs (23 U.S.C. 402(b)(1)(F)(v)). INDOT shares with ICJI the targets for fatalities, fatalities per VMT, and
incapacitating injury. The TRCC is a committee where traffic safety stakeholders come together to discuss how
they can be of assistance in making Indiana roadways safer and having accurate data of what is happening.
There are ten different traffic records planned activities that will be funded to help improve data collection.
Seven of the ten focus on collecting and reporting data and three focus on combining data from different
databases. The traffic records planned activities will provide ICJI and Indiana with a more accurate depiction of
what risky driving behaviors are occurring on Indiana roadways. The data that is provided has assisted Indiana
in determining seven different areas that can lower fatalities and incapacitating injuries if funded or increase
them if not funded. Those seven areas are; occupant protection, impaired driving, young drivers, children,
pedestrians, bicyclists, and motorcyclists.
Impaired driving is an area that has received grant funding for many years. In FY 2019, impaired driving
activities received $4,065,000 in funding. This resulted in 2018 having a decrease in fatalities involving a
driver or motorcycle operator with a BAC of .08 or above. By looking at where impaired collisions were
occurring ICJI was able to determine what agencies should get priority for DUI funds. Doing this has resulted
in a decrease of 13 fatalities from 2017.
In FY 2020 ICJI plans to do more analysis of the traffic records data and also look at other contributing
circumstances, date information, times, etc. ICJI is also analyzing the top 20 or 30 counties that have the
highest ratio of a specific type of collision compared to their overall collisions. The top counties will receive
priority when it comes to funding. By giving priority to these counties the likelihood of agencies lowering these
collisions through enforcement is high. These different analyzes will provide the traffic safety division more
information for detailed enforcement activities. The more trends that can be found in collision data the more
enforcement activities can be specified to address those trends and lead to a reduction of collisions. This will
assist more in grant funding that ICJI requests in FY 2021.
8/94Performance report
Progress towards meeting State performance targets from the previous fiscal year’s HSP
Performance Plan
Sort Order Performance Target Period Target Start Target End Target Value
measure Year Year
name
1 C-1) Number 5 Year 2016 2020 907.7
of traffic
fatalities
(FARS)
2 C-2) Number 5 Year 2016 2020 3467.4
of serious
injuries in
traffic crashes
(State crash
data files)
3 C-3) 5 Year 2016 2020 1.1
Fatalities/VM
T (FARS,
FHWA)
4 C-4) Number 5 Year 2016 2020 223
of
unrestrained
passenger
vehicle
occupant
fatalities, all
seat positions
(FARS)
5 C-5) Number 5 Year 2016 2020 198
of fatalities in
crashes
involving a
driver or
motorcycle
operator with
a BAC of .08
and above
(FARS)
6 C-6) Number 5 Year 2016 2020 217
of speeding-
related
fatalities
(FARS)
7 C-7) Number 5 Year 2016 2020 119
of
motorcyclist
fatalities
(FARS)
9/948 C-8) Number 5 Year 2016 2020 85
of
unhelmeted
motorcyclist
fatalities
(FARS)
9 C-9) Number 5 Year 2016 2020 113
of drivers age
20 or younger
involved in
fatal crashes
(FARS)
10 C-10) 5 Year 2016 2020 92.4
Number of
pedestrian
fatalities
(FARS)
11 C-11) 5 Year 2016 2020 14.00
Number of
bicyclists
fatalities
(FARS)
12 B-1) 5 Year 2016 2020 92.2
Observed seat
belt use for
passenger
vehicles,
front seat
outboard
occupants
(survey)
13 Fatalities Per 5 Year 2016 2020 1.79
100 Million
Vehicle Miles
Traveled-
Rural
14 Fatalities Per 5 Year 2016 2020 .60
100 Million
Vehicle Miles
Traveled-
Urban
15 Motorcycle 5 Year 2016 2020 51.42
Fatalities Per
100k
Registrations
16 Rate of .08+ 5 Year 2016 2020 .25
BAC
Impaired
Driving
Fatalities per
100 Million
Vehicle Miles
Traveled
10/9417 Children 5 Year 2016 2020 32
Aged 15 and
Under Killed
in Traffic
Collisions
Performance Measure: C-1) Number of traffic fatalities (FARS)
Performance Target details
Performance Target Metric Target Value Target Period Target Start
Target Type Year
C-1) Number of Numeric 907.7 5 Year 2016
traffic fatalities
(FARS)-2020
Primary performance attribute: Accuracy
Core traffic records data system to be impacted: Crash
Performance Target Justification
The performance target for traffic fatalities is one of the three targets that must match INDOT due to the FAST
ACT. INDOT calculates this performance target by using a trend line. "Baseline projections are calculated
using fatality and "A" injury counts (or estimations) and applying a equation to generate predictive values for
2018-2020. This was accomplished by the software built into Microsoft Excel for applying a logarithmic trend
line with a forward forecast of four years. The equation is of the form [y = A*ln(x) + B]. The resulting equation
is then adjusted to more closely fit recent peak years by shifting the value of B to produce a matching value for
the recorded peak." This is INDOT'S explanation.
Performance Measure: C-2) Number of serious injuries in traffic crashes (State
crash data files)
Performance Target details
Performance Target Metric Target Value Target Period Target Start
Target Type Year
C-2) Number of Numeric 3467.4 5 Year 2016
serious injuries
in traffic crashes
(State crash data
files)-2020
Primary performance attribute: Accuracy
Core traffic records data system to be impacted: Crash
Performance Target Justification
The performance target for traffic fatalities is one of the three targets that must match INDOT due to the FAST
ACT. Due to a definition change of incapacitating/serious injury we take the number of injuries and multiple it
by 7.2% to get the number of those that are serious. Then we created a trend line to calculate the performance
targets.
Performance Measure: C-3) Fatalities/VMT (FARS, FHWA)
11/94Performance Target details
Performance Target Metric Target Value Target Period Target Start
Target Type Year
C-3) Numeric 1.1 5 Year 2016
Fatalities/VMT
(FARS,
FHWA)-2020
Performance Target Justification
The performance target for traffic fatalities is one of the three targets that must match INDOT due to the FAST
ACT. The predicted annual Vehicle Miles Traveled (VMT) growth rate for each of the next five years is
estimated to be 1.20% from the last INDOT estimated VMT for 2018. INDOT’s Technical Planning Support &
Programming Division arrived at this figure by averaging the last 5 years of Annual Growth Rates for each of
five factor groups and then averaging those to arrive at 1.20%. The contributing Annual Growth Rates are
calculated from the data collected at Indiana’s 100+ Continuous Data Collection Sites around the State across a
variety of Functional Classes.
Performance Measure: C-4) Number of unrestrained passenger vehicle occupant
fatalities, all seat positions (FARS)
Performance Target details
Performance Target Metric Target Value Target Period Target Start
Target Type Year
C-4) Number of Numeric 223 5 Year 2016
unrestrained
passenger
vehicle occupant
fatalities, all seat
positions
(FARS)-2020
Primary performance attribute: Accuracy
Core traffic records data system to be impacted: Crash
Performance Target Justification
The number of unrestrained passenger vehicle fatalities performance target is figured off of a five year rolling
average. Outcome Measure Targets 2017 2018 2019 C-4 Unrestrained Passenger Vehicle Occupant Fatalities
(All Seat Positions) 216 217 219
Performance Measure: C-5) Number of fatalities in crashes involving a driver or
motorcycle operator with a BAC of .08 and above (FARS)
Performance Target details
Performance Target Metric Target Value Target Period Target Start
Target Type Year
12/94C-5) Number of Numeric 198 5 Year 2016
fatalities in
crashes
involving a
driver or
motorcycle
operator with a
BAC of .08 and
above (FARS)
2020
Primary performance attribute: Accuracy
Core traffic records data system to be impacted: Crash
Performance Target Justification
To calculate this target, Indiana did a five year rolling average. Outcome Measure Targets 2017 2018 2019
C-5 Fatalities Involving Driver or Motorcycle Operator with .08 BAC or Above 194 187 185
13/94Performance Measure: C-6) Number of speeding-related fatalities (FARS)
Performance Target details
Performance Target Metric Target Value Target Period Target Start
Target Type Year
C-6) Number of Numeric 217 5 Year 2016
speeding-related
fatalities
(FARS)-2020
Performance Target Justification
The performance target for speeding-related fatalities is calculated by a five year rolling average. Outcome
Measure Targets 2017 2018 2019 C-6 Speeding-Related Fatalities 211 216 215
Performance Measure: C-7) Number of motorcyclist fatalities (FARS)
Performance Target details
Performance Target Metric Target Value Target Period Target Start
Target Type Year
C-7) Number of Numeric 119 5 Year 2016
motorcyclist
fatalities
(FARS)-2020
Performance Target Justification
The performance targets for motorcyclist fatalities is calculated by a rolling five year average. Outcome
Measure Targets 2017 2018 2019 C-7 Total Motorcycle Fatalities 120 114 113
Performance Measure: C-8) Number of unhelmeted motorcyclist fatalities (FARS)
Performance Target details
14/94Performance Target Metric Target Value Target Period Target Start
Target Type Year
C-8) Number of Numeric 85 5 Year 2016
unhelmeted
motorcyclist
fatalities
(FARS)-2020
Performance Target Justification
The performance targets for unhelmeted motorcyclist fatalities is calculated by a rolling five year average.
Outcome Measure Targets 2017 2018 2019 C-8 Unhelmeted Motorcycle Fatalities 88 82 82
Performance Measure: C-9) Number of drivers age 20 or younger involved in fatal
crashes (FARS)
15/94Performance Target details
Performance Target Metric Target Value Target Period Target Start
Target Type Year
C-9) Number of Numeric 113 5 Year 2016
drivers age 20 or
younger
involved in fatal
crashes (FARS)
2020
Performance Target Justification
The performance targets for Drivers age 20 or younger involved in fatal crashes is calculated by a rolling five
year average. Outcome Measure Targets 2017 2018 2019 C-9 Drivers Aged 20 and Younger Involved in
Fatal Crashes 109 105 105
16/94Performance Measure: C-10) Number of pedestrian fatalities (FARS)
Performance Target details
Performance Target Metric Target Value Target Period Target Start
Target Type Year
C-10) Number Numeric 92.4 5 Year 2016
of pedestrian
fatalities
(FARS)-2020
Performance Target Justification
The performance targets for pedestrian fatalities are calculated by a rolling five year average. Outcome Measure
Targets 2017 2018 2019 C-10 Pedestrian Fatalities 79 83 84
Performance Measure: C-11) Number of bicyclists fatalities (FARS)
Performance Target details
Performance Target Metric Target Value Target Period Target Start
Target Type Year
C-11) Number Numeric 14.00 5 Year 2016
of bicyclists
fatalities
(FARS)-2020
Performance Target Justification
The performance targets for bicyclists fatalities are calculated by a rolling five year average. Outcome Measure
Targets 2018 2019 2020 Bicyclists and Other Cyclists Fatalities 14 14 14
Performance Measure: B-1) Observed seat belt use for passenger vehicles, front
seat outboard occupants (survey)
Performance Target details
17/94Performance Target Metric Target Value Target Period Target Start
Target Type Year
B-1) Observed Percentage 92.2 5 Year 2016
seat belt use for
passenger
vehicles, front
seat outboard
occupants
(survey)-2020
Performance Target Justification
The performance target for observed seat belt use for passenger vehicles are calculated by a rolling five year
average. Outcome Measure Targets 2018 2019 2020 B-1 Observed Seatbelt Usage Rate (%) 91.82 91.8 92.2.
We did this calculation because it is a NHTSA mandate to do a rolling average for performance targets. We
chose a 5 year rolling average due to it producing a number closer to the annual figures. A three year rolling
average would be numbers based on all targets and not have any verified numbers as part of the equation for the
2020 target.
Performance Measure: Fatalities Per 100 Million Vehicle Miles Traveled- Rural
Performance Target details
Performance Target Metric Target Value Target Period Target Start
Target Type Year
Fatalities Per Numeric 1.79 5 Year 2016
100 Million
Vehicle Miles
Traveled- Rural
2020
Performance Target Justification
The latest posted VMT for Indiana is 2017. Indiana’s 2018 2019 2020 targets is 1.77 1.76 1.79
Performance Measure: Fatalities Per 100 Million Vehicle Miles Traveled- Urban
Performance Target details
Performance Target Metric Target Value Target Period Target Start
Target Type Year
Fatalities Per Numeric .60 5 Year 2016
100 Million
Vehicle Miles
Traveled
Urban-2020
Performance Target Justification
The latest posted VMT for Indiana is 2017. Indiana’s targets for 2018 2019 2020 are 0.58 0.59 0.60
Performance Measure: Motorcycle Fatalities Per 100k Registrations
Performance Target details
18/94Performance Target Metric Target Value Target Period Target Start
Target Type Year
Motorcycle Numeric 51.42 5 Year 2016
Fatalities Per
100k
Registrations
2020
Performance Target Justification
The performance target is based off of a rolling five-year average.
Performance Measure: Rate of .08+ BAC Impaired Driving Fatalities per 100
Million Vehicle Miles Traveled
Performance Target details
Performance Target Metric Target Value Target Period Target Start
Target Type Year
Rate of .08+ Numeric .25 5 Year 2016
BAC Impaired
Driving
Fatalities per
100 Million
Vehicle Miles
Traveled-2020
Performance Target Justification
The latest posted VMT for Indiana is 2017. Indiana’s target for 2018 2019 2020 are 0.24 0.24 0.25
Performance Measure: Children Aged 15 and Under Killed in Traffic Collisions
Performance Target details
Performance Target Metric Target Value Target Period Target Start
Target Type Year
19/94Children Aged Numeric 32 5 Year 2016
15 and Under
Killed in Traffic
Collisions-2020
Performance Target Justification
Indiana calculated this target by doing a five year rolling average. Outcome Measure Targets 2017 2018
2019 19 Children Aged 15 and Under Killed in Traffic Collisions 29 29 27
Certification: State HSP performance targets are identical to the State DOT targets for common performance
measures (fatality, fatality rate, and serious injuries) reported in the HSIP annual report, as coordinated through
the State SHSP.
I certify: Yes
A-1) Number of seat belt citations issued during grant-funded enforcement activities*
Seat belt citations: 46311
Fiscal Year A-1: 2017
A-2) Number of impaired driving arrests made during grant-funded enforcement activities*
Impaired driving arrests: 5966
Fiscal Year A-2: 2017
A-3) Number of speeding citations issued during grant-funded enforcement activities*
Speeding citations: 50244
Fiscal Year A-3: 2017
Program areas
Program Area: Communications (Media)
Description of Highway Safety Problems
Analyses of crash and traffic-related data and the resulting trends aid in determining where problems exist and
what program areas will be addressed. Using data sources and partners, each program area details the identified
20/94problems. Funding priority will be given to programs that have the greatest impact on reducing traffic-related
injuries and fatalities. The problem identification process includes the utilization of the observational seat belt
usage surveys, data from the various partners discussed below, and the analysis of who, what, where, when, and
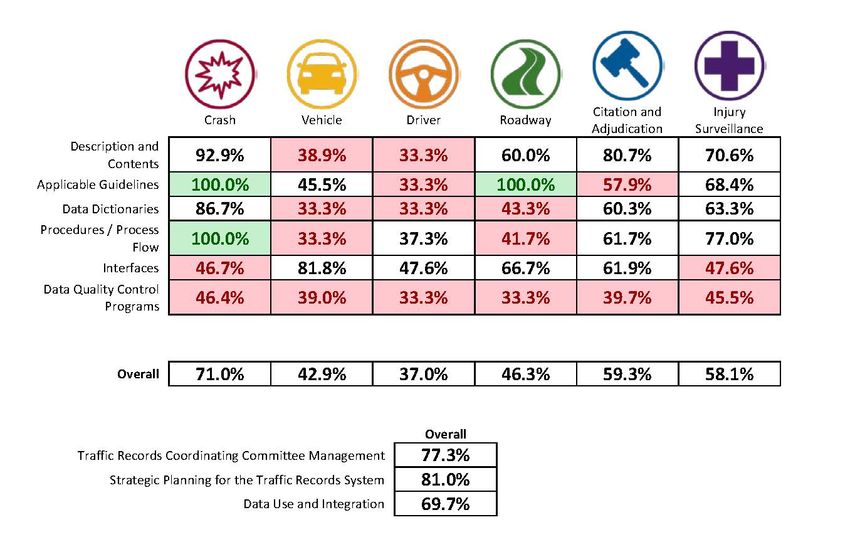
why for each type of crash. Indiana did not meet the 2017 targets for traffic fatalities and VMT, but did meet
the target for incapacitating injuries.
Traffic Fatalities 2012-2018
Sources: FARS and 2018 from ARIES
Incapacitating Injuries 2012-2018
Sources: FARS and 2018 from ARIES
Fatalities per 100 Million Vehicle Miles Driven 2012-2018
Source: FARS
ICJI will continue its effective efforts in targeting audiences to communicate messaging for occupant
protection; motorcycle safety and awareness; child passenger safety; young drivers; impaired driving;
21/94dangerous driving; and bicyclist and pedestrian safety.
In addition to supplementing national messages, ICJI will place special emphasis on earned media. ICJI works
with local law enforcement and non-profit agencies to localize messages. Experience has shown local media are
much more receptive to speaking with representatives in their local community, than simply publishing a media
release from the state agency.
ICJI will continue to use digital media messaging to reach audiences ages 35 and younger. Studies have shown
this demographic does not consume traditional media and relies instead on their mobile devices to receive
information. ICJI will also continue using some traditional media, primarily radio but, since driving habits are
developed at a young age, it’s important to place a heavier emphasis on digital and social media channels.
ICJI will strengthen its partnerships with key organizations to meet message objectives. This includes the
Automotive Safety Partnership, Miracle Ride for Riley Hospital, ABATE and other groups that can assist in
getting messages to targeted audiences. Additionally, when appropriate, ICJI will hold media events with our
partners, to further expand messaging
Objectives
Associated Performance Measures
Fiscal Year Performance Target End Year Target Period Target Value
measure name
2020 C-4) Number of 2020 5 Year 223
unrestrained
passenger
vehicle occupant
fatalities, all seat
positions
(FARS)
2020 C-3) 2020 5 Year 1.1
Fatalities/VMT
(FARS, FHWA)
2020 C-7) Number of 2020 5 Year 119
motorcyclist
fatalities (FARS)
2020 C-5) Number of 2020 5 Year 198
fatalities in
crashes
involving a
driver or
motorcycle
operator with a
BAC of .08 and
above (FARS)
2020 Children Aged 2020 5 Year 32
15 and Under
Killed in Traffic
Collisions
Countermeasure Strategies in Program Area
Countermeasure Strategy
Communication Campaign
22/94Countermeasure Strategy: Communication Campaign
Program Area: Communications (Media)
Reduce the number of traffic collisions, injuries, and fatalities that result from impaired driving and
motorcycle riding, speeding, improper restraint use, and distracted and aggressive driving – by
utilizing highly targeted digital media, social media, radio, and earned media;
Raise awareness of national traffic safety campaigns through statewide paid media (primarily digital,
social and radio), in conjunction with localized earned media. These efforts will publicize statewide
HVE efforts;
Build and sustain partnerships with key individuals and organizations to maintain awareness,
between statewide advertising campaigns, which deliver large target audiences during non-
enforcement periods;
Plan and execute a series of communication activities which effectively convey the dangers and
consequences of impaired, dangerous, and distracted driving behaviors, in addition to increasing seat
belt usage. Paid and earned media exposure will successfully heighten awareness and increase
positive behavioral change;
Maintain an integrated calendar of paid and earned media events.
Project Safety Impacts
ICJI will use a variety of integrated communications tactics to publicize police enforcement of Indiana traffic
laws, including seat belts, child restraints, school bus stops, speeding, aggressive driving, distracted driving and
graduated driver’s licenses. The latest available crash data, along with enforcement mobilization times and
jurisdictions involved, will inform paid advertising purchases and sponsorships of events and sports teams.
Advertising and event marketing will make up the majority of ICJI’s impaired-driving communications budget
with a smaller amount of funding anticipated to support and partner with other state agencies and local law-
enforcement subgrantees on earned news media coverage and organic social-media posts. ICJI anticipates
working through the State of Indiana advertising agency to secure the best possible ad inventory and through
Alliance Highway Safety on sports and event marketing. For both, ICJI will give priority focus to national and
statewide enforcement mobilizations detailed in the next section while minimizing overlap and conflict with the
separate traffic-safety campaigns in this Marketing and Communications Program Area that are not related to
impaired driving. ICJI will complement national advertising and publicity by customizing NHTSA materials for
Indiana news media outlets and advertising formats. The mix of advertising mediums will be selected based on
ad creative available, budget and target demographics. Sports and event marketing opportunities will be
evaluated based on timing, anticipated attendance, geographic areas they serve and target demographics.
Linkage Between Program Area
Impaired driving has been rising in the State of Indiana. Alcohol impaired collisions, fatalities and injuries have
decreased, but drug impaired and dual impaired collisions have been increasing. Media campaigns that
discourage impaired driving and that impaired driving enforcement is a deterrent to drivers who may drive
impaired. Click-it or ticket advertising encourages those in cars to wear their seat belt to avoid a citation. Over
25 percent of motorcycle collisions primary factor was failure to yield right of way. The other motorists are
often at fault due to not yielding the right of way to the motorcyclist. Other countermeasures that support this
23/94one are:
Publicized Sobriety Checkpoints
High-Visibility Saturation Patrols
Integrated Enforcement
Mass Media Campaigns
Underage Drinking Enforcement Countermeasures
Alcohol-Impaired Motorcyclists: Detection, Enforcement and Sanctions
Short-term High-Visibility Child Restraint/Booster Law Enforcement
Communications and Outreach Supporting Speeding and Aggressive Driving Enforcement
Enforcement of GDL and Zero-Tolerance Laws
ICJI is requesting $1,733,500 in total funds for communication planned activities. The planned activities will
need $450,000 in 402 general funds, $413,000 in 405(d)flex funds, $410,000 in 405D impaired driving funds,
$50,000 405F motorcycle funds and $410,000 in 164 alcohol penalty funds.
Rationale
As alcohol-impaired crashes, injuries and deaths decline, ICJI plans to give equal weight to marketing and
communications planned activities for drugged driving, for which Indiana crashes, injuries and deaths remain
consistent or increasing. Planned statewide impaired-driving enforcement mobilizations include Safe Family
Travel in November and December, St. Patrick’s Day in March and the national Drive Sober or Get Pulled Over
in August and September. Paid advertising and event marketing will begin about one week before, and continue
through, these statewide and national mobilizations. Where there are gaps in enforcement-oriented ad flights,
ICJI will sustain the traffic-safety message to include matters not enforceable or easily enforced under Indiana
law (child restraints over age 8 and distracted drivers over age 21) and at a reduced level through “social
norming” awareness. National campaigns for which NHTSA makes creative available include the Super Bowl
in early February, the July 4th travel holiday, Halloween in late October and the Holidays in late December.
Sports and event marketing for impaired-driving enforcement, general traffic enforcement, and "social
norming" awareness is anticipated at Indiana venues for basketball, hockey and baseball, motorcycle rides,
concerts, state and county fairs that draw attendees from wider geographic areas. The motorcycle campaign is
for all drivers on the roads to be aware that they are sharing the road with motorcycles.
Planned activities in countermeasure strategy
Unique Identifier Planned Activity Name
FDL*PM-05-05-05 Publicizing Traffic Enforcement and Social
Norming Awareness
FDLPEM-2020-07-03-12 Publicizing Enforcement of Alcohol-
Impaired and Drug-Impaired Driving Laws
PM-2020-01-00-00 Click It or Ticket/Local Heroes
PM-2020-05-01-07 Motorist Awareness of Motorcycles
Planned Activity: Publicizing Traffic Enforcement and Social Norming Awareness
Planned activity number: FDL*PM-05-05-05
Primary Countermeasure Strategy ID: Communication Campaign
24/94Planned Activity Description
In addition to the traffic enforcement mobilizations described above, national awareness campaigns supported
with this planned activity include Distracted Driving Awareness Month, Motorcycle Safety Awareness Month
and Child Passenger Safety Week.
Intended Subrecipients
Countermeasure strategies
Countermeasure Strategy
Communication Campaign
Funding sources
Source Fiscal Funding Eligible Use Estimated Match Local Benefit
Year Source ID of Funds Funding Amount
Amount
2020 FAST Act 405d Low $413,500.00 $103,375.00
405d Paid
Impaired Advertising
Driving Low
2020 FAST Act Paid $250,000.00 $62,500.00 $62,500.00
NHTSA 402 Advertising
(FAST)
Planned Activity: Publicizing Enforcement of Alcohol-Impaired and Drug-
Impaired Driving Laws
Planned activity number: FDLPEM-2020-07-03-12
Primary Countermeasure Strategy ID: Communication Campaign
Planned Activity Description
This planned activity has two different focuses. One focuses solely on alcohol-impaired driving and the other
focuses mostly on drug impaired driving. ICJI will complement drugged driving activities with concurrent
support of the national “Drive/Ride Sober or Get Pulled Over” and “Buzzed Driving is Drunk Driving” alcohol-
impaired driving brands using the tactics described previously. Paid advertising will air ahead of times when the
latest available crash data show impaired-driving crashes are highest, between 6 p.m. and 6 a.m. on weekends.
Advertising and event marketing will target demographics, primarily men ages 21-34 and secondarily women
ages 21-44, and geographic areas with the highest impaired-driving crash rates. This activity will advance
President Trump’s and Indiana Governor Holcomb’s efforts to fight the nation’s drug epidemic by publicizing
drugged driving enforcement. ICJI will support the national “If You Feel Different, You Drive Different” and
“Drive High, Get a DUI” brands through the tactics detailed above. ICJI Communications will partner with
Indiana’s Drug Evaluation and Classification program to publicize the training of and enforcement by Drug
Recognition Experts, thereby increasing public education and deterring drugged driving.
Intended Subrecipients
State Marketing Advertising Agencies
Sports and Event Marketing Vendors
25/94Countermeasure strategies
Countermeasure Strategy
Communication Campaign
Funding sources
Source Fiscal Funding Eligible Use Estimated Match Local Benefit
Year Source ID of Funds Funding Amount
Amount
2020 164 Transfer 164 Alcohol $410,000.00 $102,500.00
Funds-AL
2020 405d 405(d) FAST $410,000.00 $102,500.00
Impaired Act Impaired
Driving Driving Low
Alcohol HVE
Planned Activity: Click It or Ticket/Local Heroes
Planned activity number: PM-2020-01-00-00
Primary Countermeasure Strategy ID: Communication Campaign
Planned Activity Description
Intended Subrecipients
State Marketing Advertising Agencies
Sports and Event Marketing Vendors
Countermeasure strategies
Countermeasure Strategy
Communication Campaign
Funding sources
Source Fiscal Funding Eligible Use Estimated Match Local Benefit
Year Source ID of Funds Funding Amount
Amount
2020 402 - Traffic 402 FAST $200,000.00 $50,000.00 $50,000.00
Safety Act Paid
Advertising
Planned Activity: Motorist Awareness of Motorcycles
Planned activity number: PM-2020-05-01-07
Primary Countermeasure Strategy ID: Communication Campaign
Planned Activity Description
The latest crash data available will inform an integrated communications campaign to educate car and truck
drivers of safe-driving practices around motorcycles. Paid advertising purchases and sponsorship of events and
sports teams will make up the majority of ICJI’s communications budget for motorist awareness of motorcycles.
Motorcycles return to the roads each spring as temperatures rise and chances diminish for ice or snow.
26/94According to recent Crash Fact publications, injury and fatal crashes involving motorcycles increase
dramatically between March and April.
Paid advertising will begin after the March Madness/St. Patrick’s enforcement mobilization ends in late March
and reach its peak when earned-media efforts kick off Motorcycle Safety Awareness Month in early May,
before Click It or Ticket. Currently NHTSA makes “Get Up to Speed on Motorcycles” and “Share the Road”
materials available for web display ads, posters and short pre-roll videos for video streaming on YouTube,
Facebook and other services.
ICJI will work to complement and minimize conflict with other communications campaigns in this plan,
including Distracted Driving Awareness Month in April and “Ride Sober or Get Pulled Over” as part of
impaired-driving communications. Where there are schedule gaps between awareness months and high-
visibility enforcement during the warm-weather riding season, ICJI will work to sustain the motorcycle
awareness message through the remainder of the fiscal year.
Sports and event marketing opportunities will be evaluated based on timing, anticipated attendance, target
demographics and geographic areas they serve. Some of the most passionate ambassadors on this topic are the
riders themselves. Through sponsorship of motorcycle rallies, ICJI and its vendors will work to arm riders with
educational materials and talking points for use in educating their networks of family, friends and co-workers
who only drive cars and trucks.
Budget: $50,000
Intended Subrecipients
Countermeasure strategies
Countermeasure Strategy
Communication Campaign
Funding sources
Source Fiscal Funding Eligible Use Estimated Match Local Benefit
Year Source ID of Funds Funding Amount
Amount
2020 FAST Act 405f Paid $50,000.00 $15,000.00
405f Advertising
Motorcycle (FAST)
Programs
Program Area: Impaired Driving (Alcohol)
Description of Highway Safety Problems
Associated Performance Measures
Fiscal Year Performance Target End Year Target Period Target Value
measure name
27/942020 Rate of .08+ 2020 5 Year .25
BAC Impaired
Driving
Fatalities per
100 Million
Vehicle Miles
Traveled
2020 C-5) Number of 2020 5 Year 198
fatalities in
crashes
involving a
driver or
motorcycle
operator with a
BAC of .08 and
above (FARS)
Countermeasure Strategies in Program Area
Countermeasure Strategy
High Visibility Enforcement
Highway Safety Office Program Management
Ignition Interlocks
Impaired Driving Task Force
Preliminary Breath Test (PBT) Devices
Countermeasure Strategy: High Visibility Enforcement
Program Area: Impaired Driving (Alcohol)
Project Safety Impacts
This countermeasure strategy provides funding to police departments to continue impaired enforcement after
the summer blitzes. The High Visibility enforcement takes place during the summer months when collisions
are highest. Counties that have the highest percentage of impaired collisions to all their collisions get priority
when applying for the grant funds. Departments that receive funding will be encouraged to focus their
enforcement at streets, days, and times that data suggests that most impaired collisions occur. This enforcement
occurs after the national blitzes and continues impaired enforcement throughout the summer. To make this
countermeasure the most effective we use data driven maps to assist officers find where would be their most
effective enforcement areas.
Linkage Between Program Area
Rationale
Planned activities in countermeasure strategy
Unique Identifier Planned Activity Name
M6X-2020-14-00-05 Summer Impaired Driving Enforcement
Project
Planned Activity: Summer Impaired Driving Enforcement Project
Planned activity number: M6X-2020-14-00-05
28/94Primary Countermeasure Strategy ID:
Planned Activity Description
The Summer Impaired Driving Enforcement Project promotes a coordinated effort to reduce alcohol impaired
collisions and fatalities through highly visible and sustained traffic enforcement in identified counties. This
project is designed to decrease impaired collisions and fatalities in identified counties.
Intended Subrecipients
Countermeasure strategies
Countermeasure Strategy
High Visibility Enforcement
Funding sources
Source Fiscal Funding Eligible Use Estimated Match Local Benefit
Year Source ID of Funds Funding Amount
Amount
2020 164 Transfer 405d $400,000.00 $100,000.00 $250,000.00
Funds-AL Impaired
Driving Low
(FAST)
Countermeasure Strategy: Highway Safety Office Program Management
Program Area: Impaired Driving (Alcohol)
Project Safety Impacts
Linkage Between Program Area
Rationale
Planned activities in countermeasure strategy
Unique Identifier Planned Activity Name
M6X-2020-01-00-00 Program Management Impaired Driver
Planned Activity: Program Management Impaired Driver
Planned activity number: M6X-2020-01-00-00
Primary Countermeasure Strategy ID: Highway Safety Office Program Management
Planned Activity Description
This project funds program management to coordinate, monitor, and administer impaired driving
countermeasure grants. Program manager responsibilities include monitoring sub-grantees for compliance and
performance; collaborating with local, state, and community organizations in developing and implementing
impaired driving awareness campaigns; and promoting enforcement of impaired driving laws. Program
managers uses the OPO database as well as PPI and LEL recommendations to develop impaired driving
countermeasures, such as sobriety checkpoints, to lower the occurrence of drunk driving crashes. The program
manager also works closely with the LELs to direct targeted outreach for training opportunities for officers in
the field. This project provides funds for the program manager’s salary, benefits, and travel costs to impaired
29/94driving-related conferences and training seminars.
Budget: $75,000
Intended Subrecipients
ICJI Regional Program Managers
Countermeasure strategies
Countermeasure Strategy
Highway Safety Office Program Management
Funding sources
Source Fiscal Funding Eligible Use Estimated Match Local Benefit
Year Source ID of Funds Funding Amount
Amount
2020 FAST Act 405d Low $75,000.00 $18,750.00
405d Alcohol
Impaired
Driving Low
Countermeasure Strategy: Ignition Interlocks
Program Area: Impaired Driving (Alcohol)
Project Safety Impacts
Linkage Between Program Area
Rationale
Planned activities in countermeasure strategy
Unique Identifier Planned Activity Name
FDLII-2020-01-01-01 Ignition Interlock Management
Planned Activity: Ignition Interlock Management
Planned activity number: FDLII-2020-01-01-01
Primary Countermeasure Strategy ID: Ignition Interlocks
Planned Activity Description
Intended Subrecipients
Countermeasure strategies
Countermeasure Strategy
Ignition Interlocks
Funding sources
Source Fiscal Funding Eligible Use Estimated Match Local Benefit
Year Source ID of Funds Funding Amount
Amount
30/94You can also read