A New Traffic Safety Paradigm - Victoria Transport Policy ...
←
→
Page content transcription
If your browser does not render page correctly, please read the page content below
www.vtpi.org

                                                                                              Info@vtpi.org

                                                                                              250-360-1560

                            A New Traffic Safety Paradigm
                                                8 October 2019
                                              Todd Litman
                                   Victoria Transport Policy Institute

A new traffic safety paradigm recognizes exposure, total vehicle travel, as a risk factor, and therefore the
safety benefits of vehicle travel reduction strategies such as multi-modal planning, more efficient transport
pricing, Smart Growth development policies and Transportation Demand Management (TDM) programs.

Abstract
Despite large investments in traffic safety programs and technologies, motor vehicle crashes
continue to impose high social costs, and recently increased. New strategies are needed to
achieve ambitious safety targets such as Vision Zero. Recent research improves our
understanding of factors that affect traffic risks and identifies new safety strategies. Applying this
knowledge requires a paradigm shift, a change in the way problems are defined and solutions
evaluated. The old paradigm assumed that driving is generally safe, and so favored safety
programs that target special risks such as youth, senior, impaired and distracted driving. The
new paradigm recognizes exposure (total vehicle travel) as a risk factor, and therefore the
safety benefits of vehicle travel reduction strategies such as multi-modal planning, efficient
transport pricing, Smart Growth development policies, and Transportation Demand
Management (TDM) programs. These strategies provide significant co-benefits in addition to
safety. This report examines our emerging understanding of traffic risks and new safety
strategies, and the importance of more comprehensive safety analysis.
                                                  Summarized in
      Todd Litman (2019), “Toward More Comprehensive Evaluation of Traffic Risks and Safety Strategies”
       Research in Transportation Business & Management (https://doi.org/10.1016/j.rtbm.2019.01.003).
  Todd Litman (2018), “A New Traffic Safety Paradigm,” Transportation Talk (Journal of the Canadian Institute of
                     Transportation Engineers), Winter, pp. 12-18; at https://bit.ly/2Febrwx.

                                        Todd Alexander Litman © 2017-2019
You are welcome and encouraged to copy, distribute, share and excerpt this document and its ideas, provided the author
            is given attribution. Please send your corrections, comments and suggestions for improvement.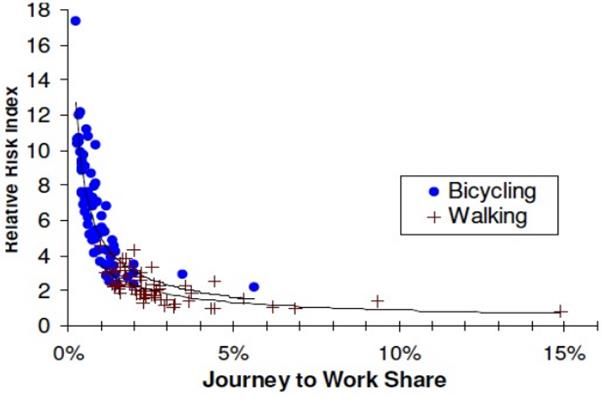
A New Traffic Safety Paradigm
                                                               Victoria Transport Policy Institute

Table of Contents
Introduction ......................................................................................................................................3

Why a New Paradigm? .......................................................................................................................4

New Understanding of Traffic Risk......................................................................................................8
   Total Vehicle Travel...................................................................................................................................................8
   Quality of Transport Options ..................................................................................................................................12
   Transportation Pricing ............................................................................................................................................17
   Land Use Factors .....................................................................................................................................................17
   Transportation Demand Management Programs ...................................................................................................18

How Common Planning Practices Can Increase Risk .......................................................................... 19

New Paradigm Safety Strategies ....................................................................................................... 20
   Transit Service Improvements ................................................................................................................................20
   HOV and Bus Priority ..............................................................................................................................................21
   Active Transport (Walking and Cycling) Improvements ..........................................................................................21
   Expanded Carsharing Services ................................................................................................................................21
   Raise Fuel Taxes to Fully Finance Roadway Costs or as a Carbon Tax ....................................................................21
   Efficient Parking Pricing (Motorists Pay Directly For Using Parking Spaces)...........................................................22
   Congestion Pricing (Road Tolls that Increase Under Congested Conditions) .........................................................22
   Distance-Based Vehicle Insurance and Registration Fees .......................................................................................22
   Commute Trip Reduction Programs........................................................................................................................23
   Mobility Management Marketing ...........................................................................................................................23
   More Comprehensive and Multi-modal Planning ...................................................................................................23
   More Connected and Complete Streets .................................................................................................................24
   Reduced Parking Requirements ..............................................................................................................................25
   Urban Rail and Bus Rapid Transit ............................................................................................................................25
   Smart Growth and Transit Oriented Development.................................................................................................26

New Paradigm Analysis Methods ..................................................................................................... 29

Evaluating Current Traffic Safety Programs ....................................................................................... 31

Obstacles and Criticisms ................................................................................................................... 33

Conclusions and Recommendations.................................................................................................. 35

References....................................................................................................................................... 36

                                                                                   2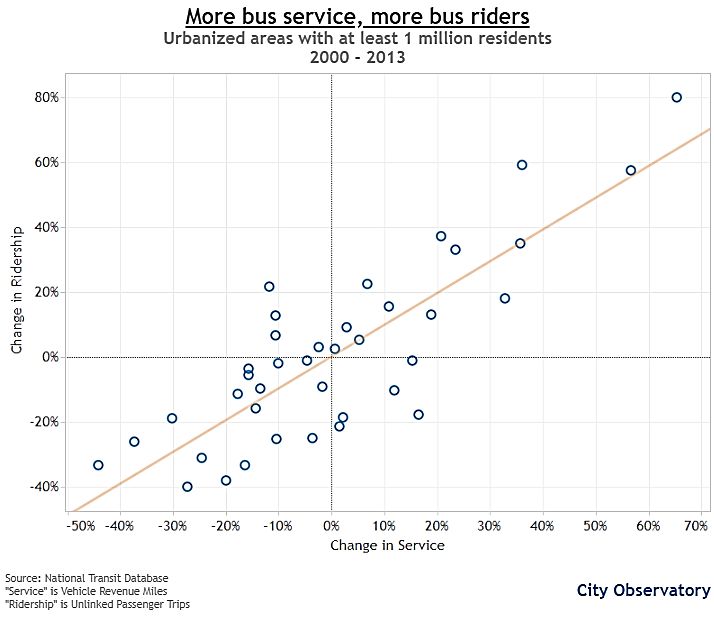
A New Traffic Safety Paradigm
                                           Victoria Transport Policy Institute

Introduction
Despite large investments in traffic safety, motor vehicle crashes impose huge social costs. According to
a National Highway Traffic Safety Administration study, in 2010 United States motor vehicle crashes
caused damages cost $242-836 billion, or $800-2,700 per capita (Blincoe, et al. 2015). International
studies show similar results (Wismans, et al. 2017), with traffic crash costs estimated at 5% of GDP in
lower- and middle-income countries (Welle, et al. 2018, p. 31).

Information described in this report indicates that the long-term decline in traffic casualty rates is
ending. Crash rates have recently increased, indicating that current traffic safety strategies have fulfilled
their potential. To achieve ambitious crash reduction goals such as Road to Zero (NSC 2017) we need
new traffic safety strategies. This requires a paradigm shift, a change in the ways that risks are measured
and potential safety strategies are evaluated (Hughes 2017; May, Tranter and Warn 2011; Litman 2013).

In a word, the new paradigm recognizes exposure – the amount that vehicles travel – as a risk factor.
Total crashes are the product of distance-based crash rates (such as collisions per 100,000 vehicle-miles)
times travel distance (such as per capita vehicle-miles); a change in either tends to cause proportional
changes in total crashes. The old paradigm assumed that vehicle travel is generally very safe, and so
ignored exposure as a risk factor. It argued that most crashes are caused by special risk factors, such as
youth, senior, impaired and distracted driving, and so favored targeted safety strategies. The new
paradigm recognizes that all vehicle travel imposes risks and so recognizes the additional crashes caused
by planning decisions that increase vehicle travel, and the safety benefits of transportation demand
management (TDM) strategies such as more multi-modal planning, efficient transport pricing, Smart
Growth development policies, and TDM programs. Since most TDM strategies provide large co-benefits,
besides safety, the new paradigm supports more comprehensive analysis that considers these impacts.

Table 1 compares the old and new traffic safety paradigms.

Table 1          Comparing the Old and New Traffic Safety Paradigms
       Factor                              Old                                                            New
Goal               Make vehicle travel safer.                                    Make transportation systems safer.
Risk               Direct user risks, measured by distance (e.g.,                Total risks, including risks to other road users,
measurement        occupant deaths per 100,000 million vehicle-miles).           measured by distance and per capita
                   Roadway and vehicle design improvements                       Walking, cycling and public transit improvements
                   Graduated licenses                                            Road, parking, fuel and insurance pricing reforms
                   Senior driver testing                                         More connected and complete roadways

Solutions          Seatbelt and helmet requirements                              Smart Growth development policies
considered         Anti-impaired and distracted driving campaigns                Transportation demand management programs
Analysis scope     Program costs and traffic safety benefits                     All economic, social and environmental impacts
The old and new traffic safety paradigms differ in many ways.

This report explores these issues. It describes traffic casualty trends and the need for a new safety
paradigm, summarizes recent research on traffic risk factors and new safety strategies, evaluates the
degree that current safety programs consider these factors, and provides recommendations for
implementing new strategies to achieve safety goals. It should be of interest to anybody who wants to
identify the most efficient and cost effective ways to improve traffic safety.

                                                           3
A New Traffic Safety Paradigm
                                                                            Victoria Transport Policy Institute

Why a New Paradigm?
This section describes why a new approach is needed for traffic safety.

Figure 1                                            Total Annual U.S. VMT and Traffic Fatalities (FHWA 2015, Table FI-201)
                                      3,500                                                                                                 60,000
 Vehicle-Miles Travelled (Billions)

                                                                Billion VMT
                                      3,000                     Traffic Deaths                                                              50,000

                                                                                                                                                        Annual Traffic Deaths
                                      2,500
                                                                                                                                            40,000
                                      2,000
                                                                                                                                            30,000
                                      1,500
                                                                                                                           High Fuel
                                                                                                                            Prices          20,000
                                      1,000

                                       500                                                                                                  10,000

                                            0                                                                                               0
                                                1900 1910 1920 1930 1940 1950 1960 1970 1980 1990 2000 2010
Traffic death declined after 1973, but increased after 1993 and subsequently tracked total vehicle travel, and
so recently increased when low fuel prices stimulated more vehicle travel.

Figure 1 shows annual U.S. vehicle travel and traffic deaths. Motor vehicle miles of travel (VMT)
increased steadily during the Twentieth Century, but grew more slowly after 2006. Total deaths peaked
in 1973 and declined for three decades with the implementation of successful safety strategies such as
increased passenger protection and anti-impaired-driving campaigns, but this decline ended in 1993 and
subsequently traffic deaths tracked annual vehicle travel. When VMT increased 1994-2003, so did traffic
deaths. When high fuel prices reduced VMT 2004-13, so did deaths. When low fuel prices increased
VMT after 2014, so did deaths. Figure 2 shows distance-based and per capita traffic fatality rates. These
declined during most of the Twentieth Century, but plateaued 2010-14 and recently increased.

Figure 2                                            Distance-based and Per Capita U.S. Traffic Fatality Rates (FHWA 2015, FI-201)
                                      45                                                                                                           35
                                                                                        100 Million Vehicle-miles
 100,000 Million Vehicle-Miles

                                      40                                                100,000 Residents                                          30
                                                                                                                                                                  100,000 Residents
                                      35
                                                                                                                                                   25
                                      30
                                      25                                                                                                           20

                                      20                                                                                                           15
                                      15
                                                                                                                                                   10
                                      10
                                                                                                                                       High Fuel   5
                                       5                                                                                                Prices

                                       0                                                                                                           0
                                           1900   1910   1920     1930   1940    1950     1960      1970     1980   1990   2000    2010
Deaths per vehicle-mile declined significantly during the last century, but this decline stopped after 2010.

                                                                                            4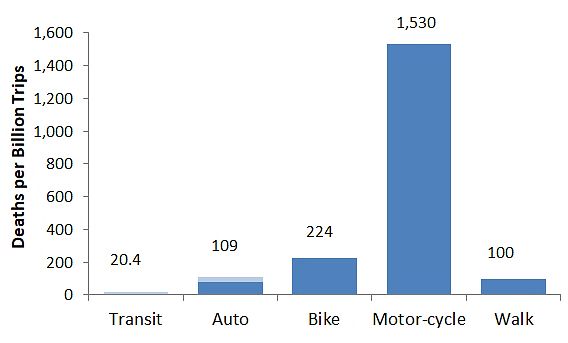
A New Traffic Safety Paradigm
                                                                    Victoria Transport Policy Institute

Figure 3 shows 2007 to 2016 fuel price trends and traffic fatality rates. When fuel prices were high,
traffic fatality rates declined, but when fuel prices declined between 2014 and 2016, per capita vehicle
travel and traffic death rates increased. This and other research described later in this report illustrate
how factors that affect per capita vehicle travel, and therefore crash exposure, affect crash rates.

Figure 3                                        U.S. Traffic Fatality and Fuel Price Trends (FHWA and GasBuddy Data)
                                       1.4                                                                                     14
                                                                  100 Million Vehicle-miles
                                       1.3
                                                                  100,000 Residents
 100,000 Million Vehicle-Miles

                                                                                                                               13
                                       1.2

                                                                                                                                    100,000 Residents
                                       1.1                                                                                     12

                                       1.0
                                                                                                                               11
                                       0.9

                                       0.8                                                                                     10

                                       0.7
                                                                                                                               9
                                       0.6

                                       0.5                                                                                     8
                                             2007   2008   2009    2010      2011       2012       2013   2014   2015   2016
Traffic fatality rates declined while fuel prices where high but increased after 2014 when prices went down.

International comparisons indicate that large safety gains are possible. The U.S. has the highest per
capita traffic fatality rate among its peers (Figure 4). Geographic factors do not explain this: Australia
and Canada have lower population densities, and Sweden, Norway and Finland have more extreme
weather, yet all have much lower traffic death rates and faster crash rates declines than the U.S.

Figure 4                                        Traffic Death Rates by Country (OECD 2015)

                                       10
        Deaths per 100,000 Residents

                                        8

                                        6

                                        4

                                        2

                                        0

The U.S. has the highest traffic fatality rate among peer countries, nearly twice those of Australia and Canada,
and three times those of European countries.

                                                                                    5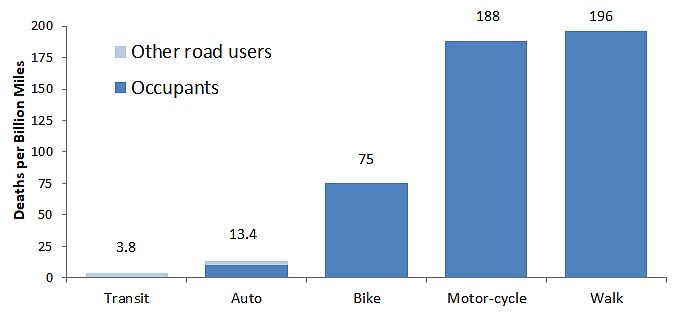
A New Traffic Safety Paradigm
Victoria Transport Policy Institute
Figure 5 Traffic Death Rates by U.S. States (IIHS 2015)
25
Deaths Per 100,000 Residents
20
15
10
5
0
Iowa
Washington
New Mexico
Florida
Kansas
Arizona
New York
Maryland
Vermont
Pennsylvania
Nebraska
Idaho
Kentucky
Montana
Rhode Island
New Jersey
Louisiana
North Dakota
South Carolina
Connecticut
Utah
Michigan
Alabama
Wyoming
Alaska
U.S. total
Oregon
Maine
Indiana
Delaware
Missouri
Arkansas
Massachusetts
Minnesota
Illinois
Tennessee
South Dakota
Oklahoma
Mississippi
California
Nevada
New Hampshire
Texas
Hawaii
Virginia
Colorado
North Carolina
Georgia
West Virginia
Ohio
Wisconsin
Crash rates vary significantly between U.S. states, reflecting differences in their transport and land use patterns.
There are also large crash rate variations between geographically similar states and regions, as figures 5
and 6 illustrate. For example, Minnesota, Illinois and Washington have about half the traffic fatality
rates of Oklahoma, Kentucky and South Carolina, and Seattle, San Diego and Portland have less than half
the rates of Atlanta, Houston and Sacramento, despite similar vehicles, roads and traffic safety
programs. Evidence described in the next section of this report indicates that these variations largely
reflect transport and land use development policies that affect per capita vehicle travel.
Figure 6 Traffic Death Rates by U.S. Urban Regions (CDC 2012)
18
16
Traffic Deaths Per 100,000 Residents
14
12
10
8
6
4
2
0
Cleveland
San Diego
Denver
Tampa
Seattle
Milwaukee
Atlanta
Birmingham
Sacramento
Glendale
Baltimore
Mesa
Fort Worth
Indianapolis
New Orleans
Louisville
Memphis
Virginia Beach
Cincinnati
Jacksonville
Kansas City
Hartford
Philadelphia
San Jose
Columbus, Ohio
Salt Lake City
Charlotte
Nashville
Boston
Buffalo
Los Angeles
Richmond
Richmond
Phoenix
Riverside
San Antonio
Detroit
New York City
San Francisco
Washington, DC
Chicago
Portland
Raleigh
Aurora
Columbus
Pittsburgh
Minneapolis
Austin
Dallas
St. Louis
Arlington
Houston
Las Vegas
Miami
Jacksonville, Fl
Crash rates vary significantly between cities, reflecting differences in their transport and land use patterns.
6A New Traffic Safety Paradigm
Victoria Transport Policy Institute
Many people hope that new technologies will soon eliminate traffic risks. Advocates claim that since
human errors contribute to 90% of traffic crashes, they will eliminate 90% of crashes (Keeney 2017; Kok,
et al. 2017). However, more objective experts predict that autonomous vehicles will take longer to
develop, cost more, and introduce more risks than advocates claim (Ackerman 2017; Litman 2018;
Shladover 2016). The safety benefits of previous technologies were often overestimated because,
travellers tend to take more risks when they feel safer, called offsetting behavior or risk compensation
(Chirinko and Harper, 1993; Wilde, 1994). For example, high mounted stop lamps were predicted to
prevent 35% of rear-ending vehicle accidents, but once they become mandatory and common this
declined to just 4% (NHTSA 1998). Optimistic safety predictions tend to overlook the additional risks
autonomous vehicle technologies can introduce (Hsu 2017; Koopman and Wagner 2017):
Hardware and software failures. Complex electronic systems can fail, as computer and Internet users
often experience. Operating a vehicle in traffic is demanding, and small failures - a false sensor,
distorted signal or software error - can have catastrophic results. Self-driving vehicles will certainly
have errors that contribute to crashes; the question is how frequently compared with human drivers.
Malicious hacking. Self-driving technologies can be manipulated for amusement or crime.
Increased risk-taking. When road users feel safer they tend to take additional risks, what safety
experts call offsetting behavior or risk compensation. For example, if they expect self-driving vehicles
to be very safe, fewer passengers may wear seatbelts and other road users may be less cautious.
Platooning risks. Many potential benefits, such as reduced congestion and pollution emissions,
require platooning (vehicles operating close together at high speeds on dedicated lanes). This will
introduce new risks such as human drivers joining platoons, and more multiple-vehicle crashes.
Increased total vehicle travel. The additional convenience and comfort of autonomous vehicles could
increase total vehicle travel, and therefore cause additional risk exposure.
As a result, autonomous vehicles will probably reduce crashes much less than 90%. Their net safety
benefits will depend on how they are programmed and used, including public polices such as road
pricing and regulations. For example, to maximize mobility they can be programmed to operate at
higher speeds, take greater risks, and have dedicated platooning lanes, but to maximize safety they
should be programed to drive slower and be more cautious in unexpected situations (causing delays as
they wait for human instructions). Congestion pricing and high-occupant vehicle lanes can encourage
sharing of autonomous vehicle trips which can reduce total vehicle travel and therefore crashes.
Some experts acknowledge that autonomous vehicles may provide relatively modest safety gains. One
major study concluded that, “Early research suggests that AV technologies have promisein mitigating
traffic crashes, but their safety benefits are not guaranteed.” (TRB 2019). Groves and Kalra (2017) argue
that autonomous vehicle deployment is justified even if they only reduce crash rates 10%, but
acknowledge that safety impacts depend on how this technology affects total vehicle travel. For
example, if autonomous vehicles reduce per-mile crash rates 10% but increase vehicle travel 12%, total
crashes, including risks to other road users, will increase.
This suggests that even if autonomous vehicles become common and affordable, and reduce distance-
based crash rates, the new safety paradigm will still be justified: it will be important to consider how
public policies affect total motor vehicle travel and therefore crash exposure, and to recognize the
safety benefits of vehicle travel reduction strategies, even if they apply to autonomous vehicles.
7A New Traffic Safety Paradigm
Victoria Transport Policy Institute
New Understanding of Traffic Risk
This section describes new research concerning how transport and land use factors affect crash risks. Also see
Hamidi, Ewing and Grace (2016); ITF (2019); Litman and Fitzroy (2016); and Welle et al. (2018).
Total Vehicle Travel
Although many demographic, geographic and economic factors affect casualty rates, all else being
equal, that is, for a given group or area, traffic casualties tend to increase with vehicle travel. For
example, among higher-income countries, per capita crash rates tend to increase with per capita vehicle
travel, as illustrated in Figure 7. As previously mentioned, the U.S. has the highest traffic death rate
among peer countries, which can be explained by it having the highest per capita annual mileage.
Figure 7 Vehicle Mileage and Traffic Fatality Rates in OECD Countries (OECD Data)
16
Canada Among
Traffic Fatalities Per 100,000 Residents
14 Denmark economically
similar countries
Germany there is a strong
12
Iceland positive
10 relationship
Italy between per capita
8 Japan
vehicle travel and
R² = 0.6405
traffic deaths.
Netherlands
6
This explains why
Norway
4
the U.S. has the
Sweden highest per capita
traffic death rate
2 Switzerland
among its peers.
United Kingdom
0
0 5,000 10,000 15,000 20,000 25,000 United States
Annual Vehicle Kilometers Per Capita
Per capita traffic fatality rates tend to increase with vehicle travel among U.S. states, as indicated below.
8A New Traffic Safety Paradigm
Victoria Transport Policy Institute
Figure 8 Vehicle Mileage Versus Traffic Fatalities in U.S. States (FHWA 1993-2002 data)
16
This figure shows various year’s
Traffic Fatalities Per 100,000 Residents
14 Rural traffic fatality and annual
mileage rates for urban and rural
12
Urban portions of U.S. states.
10
A state’s per capita traffic death
8 rate tends to increase with per
capita vehicle travel, particularly
6
in rural areas.
4
R² = 0.8047
2
0
0 10,000 20,000 30,000 40,000 50,000 60,000
Per Capital Annual Vehicle Mileage
Similar patterns occur at smaller geographic scales. Figure 8 shows that regional traffic fatality rates
tend to increase with vehicle travel, and other studies indicate that traffic casualty rates are much lower
in compact, multi-modal neighborhoods than in sprawled, automobile-dependent areas (Ewing and
Dumbaugh 2009; Ewing and Hamidi 2014; Marshall, Ferenchak and Janson 2018; Welle, et al. 2015 and
2018).
Figure 9 Vehicle Mileage Versus Traffic Deaths (FHWA and CDC data)
20
18
Traffic Deaths Per 100,000 Residents
16 Per capita traffic fatality rates
tend to increase with per capita
14 vehicle-miles in U.S.
12 Metropolitan regions.
10
8 R² = 0.3139
6
4
2
0
0 10 20 30 40 50
Daily Vehicle-Miles Per Capita
9A New Traffic Safety Paradigm
Victoria Transport Policy Institute
These impacts are dynamic. Figure 10 illustrates the relationship between annual changes in vehicle
travel and traffic fatalities in the U.S. between 1960 and 2016. Years when vehicle travel increased tend
to have similar increases in traffic deaths, and when vehicle travel declines so do deaths.
Figure 10 Changes in Vehicle Travel and Traffic Fatality Rates (FHWA 2015, Table FI-201)
0.04
Change in Annual Vehicle Travel
0.02
Total U.S. traffic fatality rates
tended to increase when total
0 vehicle travel increased and
-0.15 -0.1 -0.05 0 0.05 0.1 0.15 0.2 decline when vehicle travel
-0.02 declines.
R² = 0.3277
-0.04
-0.06
-0.08
Change in Annual Traffic Deaths
These studies reflect simple correlations that may overlook confounding factors related to vehicle travel
and risks. More sophisticated analyses that account for various demographic, geographic and economic
factors show statistically-strong positive relationships between mileage and traffic deaths. For example,
Ahangari, Atkinson-Palombo and Garrick (2017) used annual data from 1997 to 2013 to capture the
effect of seven factors that influence traffic risks: exposure, travel behavior, socioeconomics,
macroeconomics, safety policies, and mitigating factors such as health care. Their results indicate that
Vehicle Miles Traveled and Vehicles per Capita, have the strongest impact on per capita traffic fatality
rates. Similarly, accounting for various geographic and demographic factors, Yeo, Park and Jang (2015)
found that each 1% increase in per capita VMT is associated with a 0.549% increase in traffic deaths, and
comprehensive analysis by Ewing, Hamidi and Grace (2016) found that, normalizing for other factors,
each 1% increase in VMT is associated with 0.3% increase in per capita traffic deaths.
A major study by the U.S. National Academy of Sciences, Identification of Factors Contributing to the
Decline of Traffic Fatalities in the United States from 2008 to 2012 (NAS 2019), investigated factors that
affect crash risks and contributed to a 25% decline in traffic deaths during this time period. The analysis
indicates that total vehicle travel stayed relatively steady, but crash rates per vehicle-mile declined
significantly during economic recessions. The evidence suggests that recessions tend to reduce driving
by high-risk groups, particularly younger drivers. The study found that people under 26 years of age
accounted for almost 48% of the decline in fatalities. Other higher risk driver groups may also contribute
to the decline but are more difficult to identify in crash statistics. Detailed statistical analysis found that
the three most significant contributors to the traffic fatality decline were the substantial increase in teen
and young adult unemployment, reductions in median household income, and the reduction GDP per
capita. Declines in rural vehicle travel and beer consumption, plus stricter DUI laws also contributed.
State highway spending and changes in safety belt use rates and fuel prices were not significant
contributors because they changed little over the period.
10A New Traffic Safety Paradigm
Victoria Transport Policy Institute
Since about two-thirds of casualty crashes involve multiple vehicles, and crash rates increase with traffic
density (vehicles per lane-mile), changes in total vehicle travel can provide proportionately larger
casualty changes, particularly in higher traffic density areas (Vickrey 1968). Edlin and Karaca-Mandic
(2006) found that each 1% increase in total vehicle travel increases total crash costs by substantially
more than 1% in virtually all U.S. states, and by 3.3- 5.4% in dense states such as California. Described
differently, vehicle travel reductions can provide external safety benefits by reducing risk to other road
users, so people become safer if their neighbors drive less.
11A New Traffic Safety Paradigm
Victoria Transport Policy Institute
Quality of Transport Options
The quality of non-auto mobility options significantly affects crash rates (Stimpson, et al. 2014).
Table 2 2009 Crash Rates by Mode (NHTS and NHTSA data)
Totals Transit Auto Bike Motorcycle Walk
1
Occupant fatalities 35,978 48 26,408 628 4,286 4,109
Other road user fatalities1, 2 178 9,023 NA NA NA
Personal travel mode share3 1.9% 83% 1.0% 1.0% 10.4%
Personal trips (billions)3 392 11 325 2.8 2.8 41
Average miles per trip3, 4 5.5 10 3 10 0.5
Total miles (billions)5 2,976 60 2,645 8.4 22.8 21
Occupant deaths per billion miles 12.0 0.8 10.0 75 188 196
Other deaths per billion miles 0.1 3.0 3.4 0 0 0
Total deaths per billion miles 12.1 3.8 13.4 75 188 196
Occupant deaths per billion trips 92 4.4 81 224 1,530 100
Other deaths per billion trips NA 16 28 NA NA NA
Total deaths per billion trips 92 20.4 109 224 1,530 100
This table calculates internal (occupant) and external (other road user) death rates for various modes.
Table 2 and Figure 11 show per mile and per trip crash rates by mode. More than three-quarters of
transit fatalities involve other road users, but even considering these, transit travel had the lowest total
death rate. About a quarter of automobile deaths involve other road users. Bike, motor-cycle and walk
have relatively high death rates per mile but impose little risk on others, and since walk and bike trips
tend to be shorter than motorized trips, their per trip crash rates are similar to auto travel (ABW 2016).
Figure 11 Crash Rates by Mode (Table 2)
Per Mile Per Trip
Public transit has the lowest total (occupant and external) casualty rate. Auto (cars and light trucks) have moderate
crash rates, about a quarter of which is external. Bike and walk have relatively high per mile crash rates, but their
trips are short and impose little external risk, so their total per trip death rates are not much higher than driving.
1
www.rita.dot.gov/bts/sites/rita.dot.gov.bts/files/publications/national_transportation_statistics/html/table_02_01.html_mfd.
2
www.apta.com/resources/statistics/Documents/FactBook/2016-APTA-Fact-Book.pdf.
3
http://nhts.ornl.gov/2009/pub/stt.pdf. Excludes commercial vehicle travel.
4
www.apta.com/resources/statistics/Documents/FactBook/2016-APTA-Fact-Book.pdf.
5
www.rita.dot.gov/bts/sites/rita.dot.gov.bts/files/publications/national_transportation_statistics/html/table_01_35.html
12A New Traffic Safety Paradigm
Victoria Transport Policy Institute
Figure 12 Traffic Fatalities Vs. Transit Travel (Kenworthy and Laube 2000)
International data indicate that
urban region per capita crash
rates decline with increased
transit ridership.
Figure 12 and 13 illustrate the relationship between transit travel and death rates. Regions where
residents average more than 50 annual transit trips have about half the fatality rates as regions where
residents take fewer than 20 annual trips. This represents a small increase in transit mode share, from
about 1.5% to 4%, which alone cannot explain the large safety gains. This suggests that many factors
that encourage transit travel, such as compact development, good walkability, carshare services and
reduced parking supply, have synergistic effects that reduce vehicle travel and increase traffic safety.
Figure 13 U.S. Traffic Fatalities Versus Transit Trips (FTA 2012; NHTSA 2012)
This graph illustrates the relationship
between per capita transit ridership and
total (including pedestrian, cyclist,
automobile occupant and transit passenger)
traffic fatalities for 35 large North American
cities.
As transit travel increases, traffic fatalities
tend to decline significantly. Cities with
more than 50 annual transit trips per capita
have about half the average traffic fatality
rate as regions with less than 20 annual
trips per capita, indicating that relatively
modest increases in transit travel are
associated with large traffic safety gains.
Figure 14 indicates that the statistical relationship between transit ridership and traffic safety is
particularly strong for youths, age 15-25, which suggests that many young people want to reduce their
driving and associated risk, but can only do so if they have adequate alternatives.
13A New Traffic Safety Paradigm
Victoria Transport Policy Institute
Figure 14 Youth and Total Traffic Fatality Rates Compared to Transit Travel (CDC 2012)
25 Youths (15-25 years old) have
Youth
Traffic Fatalities Per 100,000 Residents
about twice the traffic
fatality rates as the total
20 Total population average, and both
youth and total fatality rates
tend to decline with increased
15 transit ridership.
This statistical relationship is
particularly strong for youths.
10 R² = 0.3425 This suggests that many
young people are willing to
reduce their driving and
5 associated risk, but can only
R² = 0.1101
do so if they have adequate
alternatives
0
0 50 100 150 200 250
Annual Transit Trips Per Capita, 2012
Trend data indicate that transit improvements tend to increase traffic safety. Figure 15 compares transit
ridership and total (all mode) traffic fatality rates between four high-transit-growth cities (Denver, Los
Angeles, Portland and Seattle, green line) and four low-transit-growth cities (Cleveland, Dallas, Houston
and Milwaukee, red line). The high transit growth cities had much larger crash rate declines (38% versus
10%), which suggests that increasing transit ridership tends to increase safety for all travellers.
Figure 15 Trend Analysis (APTA 2016, based on FTA and NHTSA data)
Transit Ridership Trends Traffic Fatality Trends
Low Transit Growth Cities Average 12 Low Transit Growth Cities Average
Traffic Deaths Per 100,000 Pop.
High Transit Growth Cities Average
Transit Pass.-Miles Per Capita
350 High Transit Growth Cities Average
10
300
250 8
200 6
150
4
100
50 2
0 0
2005 2010 2014 2005 2010 2014
High-transit-growth cities experienced far greater safety gains than low-transit-growth cities or national
trends. This suggests that pro-transit policies can significantly increase safety for all travellers.
14A New Traffic Safety Paradigm
Victoria Transport Policy Institute
Because active modes (walking and bicycling) have high per-mile or -kilometer casualty rates, some
researchers to conclude that “a shift from passenger vehicle travel (lower risk) to nonmotorized travel
(higher risk) could result in an overall increase in the numbers of people killed in traffic” (Beck, Dellinger
and O'Neil 2007). However, numerous studies find that both active mode and total (all mode) crash
casualties tend to decline as walking and bicycling increase in an area, an effect called safety in numbers
(ABW 2016; Castro, Kahlmeier and Gotschi 2018; ECF 2012; ITF 2019; NACTO 2016), illustrates below.
Figure 16 Safety in Numbers Effect (Jacobson 2003)
Data from 68 California cities indicates
that as walking and cycling commute
mode share increases, pedestrian and
bicycling casualty rates tend to decline
significantly: a few percentage point
increase in active mode share is
associated with proportionately larger
reductions in injury rates.
Cities with active mode shares over 10% average about half the per capita traffic fatality rates as those
with active mode shares under 5% (Figure 17). A comprehensive study by Marshall, Ferenchak and
Janson (2018) found that in U.S. cities, total traffic fatality rates decline with increased bicycling mode
shares. Murphy, Levinson and Owen (2017) found that in 448 Minneapolis city intersections, individual
pedestrians’ motor vehicle crash risk declines as pedestrian traffic increases. Tasic and Porter (2018) find
that, all else being equal, expanding sidewalks in an area tends to reduce non-motorized crash rates.
Figure 17 Active Commute Mode Share and Traffic Deaths (Census and CDC Data)
20
Total per capita traffic death
Traffic Deaths per 1000,000 Residents
18
rates tend to decline as active
16 (walking and cycling)
14 commute mode shares
12 increase in U.S. urban regions.
R² = 0.3451
10 This and other research
8 indicate that more active
travel tends to increase
6
overall traffic safety.
4
2
0
0% 5% 10% 15% 20%
Active Mode Commute Share
15A New Traffic Safety Paradigm
Victoria Transport Policy Institute
Various factors help explain the large total crash reductions associated with more active transport
(Marshall and Ferenchak 2019):
Safer travel conditions. Both active safety and travel tend to increase with improved sidewalks,
crosswalks, cycling facilities, streetscaping, traffic speed control and education programs.
Complementary factors. Many factors that encourage walking and cycling, such as connected streets,
higher parking and fuel prices, and compact development, also tend to increase traffic safety.
Reduced total travel. Shorter active mode trips often substitute for a longer automobile trip, for
example, walking or biking to local shops rather than driving to regional shopping centers. Improving
walking and cycling conditions reduces chauffeuring trips. Since most public transit trips involve
walking and cycling links, improving their conditions can increase transit travel.
Vehicle ownership reductions. Improving alternative modes can allow some households to reduce
their vehicle ownership. Since motor vehicles are costly to own but relatively cheap to use, once
households purchase an automobile they tend to use it, including some relatively low-value trips.
New users may be more cautious than current users. Walkers and cyclists who observe traffic rules
and use protective gear (such as helmets and lights) can have lower than average casualty rates.
Increased driver caution. As more walking and cycling occurs in an area, drivers are likely to become
more aware and cautious.
Less high-risk driving. Improving non-auto modes allows young, old, impaired and distracted
travellers to reduce driving, increasing the effectiveness of safety programs such as graduated
licenses, senior driver testing and anti-impaired and distracted driving campaigns. For example, ride-
hailing and public transit availability can help reduce post-drinking driving (Greenwood and Wattal
2015; Jackson and Owens 2011).
Reduced risk to other road users. Pedestrians and cyclists impose less risk on other road users.
Relatively modest investments can increase active mode travel and safety. For example, the U.S. Federal
Highway Administration’s Nonmotorized Transportation Pilot Program, which invested about $100 per
capita in pedestrian and cycling improvements in four typical U.S. communities, caused walking trips to
increase 23% and cycling trips to increase 48%, mostly for utilitarian purposes (FHWA 2014). Despite this
increase in exposure, pedestrian fatalities declined 20% and bicycle fatalities 29%, causing per-mile
fatality rates to decline 36% for pedestrians and 52% for bicyclists.
Analysis by Frank, et al. (2011) indicates that increasing an area’s sidewalk coverage ratio from 0.57
(sidewalks on both sides of approximately 30% of streets) to 1.4 (sidewalks on both sides of 70% of
streets) will reduce vehicle travel 3.4% and carbon emissions 4.9%. Guo and Gandavarapu (2010) found
that completing a typical U.S. community’s sidewalk network increases average per capita non-
motorized travel 16% (from 0.6 to 0.7 miles per day) and reduce automobile travel 5% (from 22.0 to
20.9 vehicle-miles), representing about 12 miles of reduced driving for each mile of increased non-
motorized travel. Similarly, Wedderburn (2013) found that in New Zealand cities, each additional daily
transit trip by driving age (18+ years) residents is associated with increases of 0.95 walking trips and 1.21
walking kilometers, and two fewer daily car trips. Similarly, U.S. cities that expanded their bicycle lane
networks tend to experience increased cycling activity and reduce crash rates (NACTO 2016).
16A New Traffic Safety Paradigm
Victoria Transport Policy Institute
Transportation Pricing
Recent studies using various analysis methods and data sets indicate that more efficient transportation
pricing, such as road tolls and fuel price increases, reduces traffic casualty rates (Litman 2014). A
comprehensive study of 14 industrialized countries found that a 10% gasoline price decline caused road
fatalities to increase 2.19% (Ahangari, et al. 2014). Similarly, Burke and Nishitateno (2015) found that a
10% fuel price increase typically reduces traffic deaths by 3-6%, and estimate that removing global fuel
subsidies would reduce approximately 35,000 annual road deaths worldwide.
U.S. studies find similar results. Leigh and Geraghty (2008) estimate that a sustained 20% gasoline price
increase would reduce approximately 2,000 annual U.S. traffic deaths plus 600 air pollution deaths.
Grabowski and Morrisey (2004 and 2006) estimate that each 10% fuel price increase reduces total traffic
deaths 2.3%, with larger decline for drivers aged 15-21. Morrisey and Grabowski (2011) find that a 10%
U.S. fuel price increase reduces fatalities by 3.2–6.2% with the largest percentage reductions among 15-
to 17-year-old drivers, and a 10% beer tax increase reduces motor vehicle fatalities by 17-24 year old
drivers by approximately 1.3%. Studies by Chi, et al. (2010a, 2013 and 2015) indicate that U.S. fuel price
increases reduce both per capita and per-mile crash rate, so a 1% reduction in total VMT reduces total
crashes more than a 1%, with particularly large reductions in youth and drunken driving crashes.
Green, Heywood and Navarro (2015) found that after London’s congestion charge was implemented
central area weekday traffic accident rates decline significantly. Within the 8-square-mile charging zone,
vehicle travel declined 14% and traffic accidents by a third, traffic accident rates declined 22% (from
4.51 to 3.51 per million vehicle-miles), and traffic casualty (injury or death) rates declined 25%,
indicating that the higher travel speeds enabled by reduced congestion do not increase crash severity.
Crash rates also declined 16% in areas up to four kilometers outside the charging zone, indicating that
congestion pricing reduces rather than just shifting traffic and crash locations.
Analyzing three million vehicle-years of insurance claim data, Ferreira and Minike (2010) found that
annual crash rates and claim costs tend to increase with annual vehicle travel, and so recommend
distance-based pricing (insurance premiums based directly on annual vehicle mileage). Since per-mile
premiums incorporate other risk factors, higher risk motorists have more incentive to reduce their
mileage and risks. For example, a low-risk driver who currently pays $360 annual premiums would pay
3¢ per mile and so would reduce mileage about 5%, but a higher-risk driver who currently pays $1,800
annual premiums would pay 15¢ per vehicle-mile and so would be expected to reduce mileage more
than 20%. This should provide proportionately large safety benefits (i.e., a 10% reduction in total vehicle
travel should provide more than 10% reduction in crashes and claim costs).
Land Use Development Factors
Ewing, Hamidi and Grace (2016) found that at the U.S. county level, accounting for various geographic
and demographic factors (land use density and mix, block size, roadway connectivity, Walkscore,
household size, employment and income, race fuel price and climate factors) dispersed, sprawl land use
development is associated with lower per capita rates of minor “fender bender” crashes, but
significantly higher rate of fatal crashes, due to the combination of more total motor vehicle travel and
higher traffic speeds in dispersed, automobile-oriented areas. Similarly, accounting for demographic and
geographic factors (income, fuel prices and compactness) in 147 U.S. urban regions, Yeo, Park and Jang
(2015) found that per capita traffic fatality rates increase with sprawl, apparently due to a combination
of increased vehicle travel, higher traffic speeds and slower emergency response. Similarly, Ahangari,
Atkinson-Palombo and Garrick (2017) found that traffic death rates decline with urban densities.
17A New Traffic Safety Paradigm
Victoria Transport Policy Institute
Najaf, et al. (2018) find that an urban area’s per capita crash rates decline with more job-housing
balance, more polycentric design, increased population density and less low-density sprawl, improving
transportation network connectivity, more public transit facilities, and grade-separated highways. They
conclude that these safety gains result primarily from reductions in per capita vehicle travel and traffic
speeds. They estimate that, all else being equal, a 10% increase in urban density or the spatial
distribution of employment reduces fatal crash rates by >15%, a 10% increase in network connectivity
increases traffic safety 4.13%, and a 10% increase in public transit supply reduces fatalities 8.28%.
Transportation Demand Management Programs
Transportation Demand Management (TDM) programs include Commute Trip Reduction (CTR), freight
transport management, parking management and mobility management marketing (Peterson 2017;
VTPI 2016). Their impacts vary depending on conditions. For example, commute trip reduction programs
typically reduce affected vehicle travel 5-15% if they only provide information and encouragement, and
10-30% if they include financial incentives such as parking pricing or cash out (Kuzmyak, Evans, and Pratt
2010). Voluntary Travel Behavior Change (VTBC) programs typically increase use of non-auto modes by
5-10%, and provide equal or larger motor vehicle travel reductions (CARB 2013).
18A New Traffic Safety Paradigm
Victoria Transport Policy Institute
How Common Planning Practices Can Increase Risk
Many conventional transportation and land use planning practices tend to increase total vehicle travel
and crash risk (DeRobertis, et al. 2014; Dumbaugh and Rae 2009). For example, development policies
that separate land uses, minimum parking requirements in zoning codes and unpriced on-street parking
tend to increase motor vehicle travel (CARB 2014). Common transport planning practices, often
intended to increase traffic safety, often increase total crash risks. For example, since grade-separated
highways have low per-mile traffic fatality rates, transportation agencies often justify road widening,
straightening, grade separation, hierarchical street systems that force traffic onto higher-speed arterials,
and expanded clear zones for safety sake, but such treatments cause motorists to drive farther and
faster, which tends to increase total crash casualties (Garrick and Marshall 2011; Karim 2015; Noland
and Oh 2004). More dispersed development, wider roads, and higher traffic speeds also discourage
walking and bicycling, which further increases vehicle travel and reduces the safety in numbers effect.
Because they feel safer, wider and straighter roads encourage drivers to take additional incremental
risks, such as driving slightly faster or being distracted, a phenomena called risk compensation. The
additional vehicle travel caused by increased travel speeds is called induced travel (Milam, et al. 2017).
As a result of these factors, roadway expansions often provide smaller safety benefits than predicted.
This is not to ignore the benefits provided by higher speed roads, separated land uses, subsidized
parking and hierarchical road networks, but it is important to account for the additional crashes they
cause in their evaluation. This is particularly important when comparing modal alternatives, such as
whether to address traffic congestion by expanding roadways or instead by improving alternative modes
and implementing TDM strategies; the former is likely to increase total vehicle travel and therefore
crashes while the latter are likely to reduce total vehicle travel and crashes. These impacts should be
considered when determining the best overall congestion reduction strategies.
19A New Traffic Safety Paradigm
Victoria Transport Policy Institute
New Paradigm Safety Strategies
This section evaluates the safety impacts of various transportation demand management strategies. For more
information see Sustainable & Safe (Welle, et al. 2018).
Transit Service Improvements
Public transit service improvements include more routes, increased service speed and frequency, nicer
vehicles and waiting areas, improved user information and more convenient payment systems. Such
improvements tend to increase ridership and reduce automobile travel. High quality transit (urban rail
and bus rapid transit) often leverages additional vehicle travel reductions by allowing some households
to reduce their vehicle ownership, and by supporting more compact development, so each 1% increase
in ridership reduces automobile travel by more than 1% (ICF 2010).
Figure 18 Ridership Versus Service Hours (Hertz 2015)
As transit service increases in a city, so does
ridership. This tends to reduce automobile
travel and traffic crash rates.
As public transit travel increases in a community total (pedestrians, cyclists, motorists and transit
passengers) per capita traffic casualty rates tend to decline (Karim, Wahba and Sayed 2012; Scheiner
and Holz-Rau 2011). Various studies using diverse analysis methods and data sets indicate that relatively
small ridership gains are associated with proportionately larger reductions in per capita crash rates
(Duduta, et al. 2012). Much of these ridership gains resulted from relatively fast and inexpensive service
improvements such as better routing, increased service, reduced fares and better rider information
(Peterson 2017; Walker 2015). This suggests that transit service improvements can provide cost-
effective safety gains in addition to other community benefits.
Services that target higher risk groups can provide particularly large safety gains. For example, Jackson
and Owens (2010) found that extending night transit service reduced drunk driving and accidents: they
found that for each additional service hour DUI arrests declined 15.6%, and fatal accidents involving
intoxicated drivers declined 70% near Metro stations. Broyles (2014) found that Phoenix, Arizona
university students are significantly less likely to drink and drive if they live close to the city’s light rail
transit system which connects student housing with commercial and entertainment districts. Similarly,
Lichtman-Sadot (2019) found that young driver traffic crash rates declined an average of 37%, and their
crash injuries decrease 24%, after late-night buses began operating in Israeli cities in 2007.
20A New Traffic Safety Paradigm
Victoria Transport Policy Institute
HOV and Bus Priority
High Occupancy Vehicle (HOV) lanes, bus lanes, and bus priority traffic control systems improve transit
performance (speed, reliability and operating cost efficiency) and encourage ridesharing (car- and
vanpooling). HOV lanes can reduce vehicle trips on a particular roadway by 4-30% (Turnbull, Levinson
and Pratt 2006). Ridesharing programs typically attract 5-15% of commute trips if they offer only
information and encouragement, and 10-30% if they also offer incentives such as HOV Priority and
efficient parking pricing (Evans and Pratt 2005). In addition to their direct impacts these strategies can
also leverage additional vehicle travel reductions, for example, if some commuters who shift from
driving to public transit or vanpooling subsequently reduce their vehicle ownership.
Active Transport (Walking and Cycling) Improvements
Improving sidewalks, crosswalks, bike lanes, pathways, plus traffic calming and cycling education, can
directly increase walking and cycling safety, and by reducing vehicle travel, increase overall traffic safety.
As previously described, in typical North American communities, completing sidewalk and bike facility
networks is predicted to reduce total personal vehicle travel about 5%, which should provide at least
proportional crash reductions, and more if these improvements reduce traffic speeds or are particularly
effective at reducing higher risk driving, for example, allowing drinkers to walk rather than drive home,
and young men to reduce driving. This is supported by previously described evidence indicating that
relatively modest increases in active mode shares are associated with large reductions in a community’s
per capita crash rates. This suggests that comprehensive active transport improvements can reduce
resident’s total crash casualty rates 5-10%. Most improvements can be implemented in a few years.
Expanded Carsharing Services
Carsharing refers to vehicle rental services designed to substitute for personal vehicle ownership, so
they are located in residential neighborhoods, priced by the hour, and marketed to local residents.
Although carsharing may increase vehicle travel by households that otherwise lack motor vehicle access,
can significantly reduce household vehicle ownership, which reduces vehicle travel (ITF 2015). In dense
urban neighborhoods, households with carsharing membership own 40% fewer vehicles and drive 33%
fewer annual miles than a control group (Clewlow 2015). This suggests that carsharing can provide large
safety benefits in suitable areas. If 10-30% of households live in areas suitable for carsharing (typically
10 residents or more per acre), and 10-30% of area households would use carsharing if available, and
carsharing reduces participating household’s vehicle travel 33%, the total vehicle travel reduction and
potential safety gain is 0.3-3%, with larger impacts in denser neighborhoods.
Raise Fuel Taxes to Fully Finance Roadway Costs or as a Carbon Tax
A basic economic principle is that markets are most efficient and equitable if prices (what users pay for a
good) reflect marginal costs (the full incremental costs of that good). This suggests that, as much as
possible, motorists should pay for roads, and compensate society for external costs they impose on
other people, sometimes called the polluter pays principle.
Road user fees (road tolls, special fuel taxes and vehicle registration fees) are often insufficient to fully
finance roadway costs (SUTP 2014). For example, in 2015 U.S. government agencies spent $235 billion
on roadways, of which $113 (48%) was from user fees and $122 billion from general taxes (FHWA, 2017,
Table HF-10). Fuel taxes would need to increase 50¢ per gallon or more to fully finance roadways. A 50¢
per gallon fuel tax can also be justified as a $55 per tonne carbon tax. With current $2.50 per gallon fuel
prices, a 50¢ per gallon tax represents a 20% increase. Previously described research indicates that each
10% fuel price increase typically reduces traffic deaths 2-6% (Ahangari, et al. 2014; Burke and
Nishitateno 2015), suggesting that a 50¢ per gallon tax should reduce fatalities by 4-12%.
21A New Traffic Safety Paradigm
Victoria Transport Policy Institute
Efficient Parking Pricing
Motorists are currently able to park without a fee at most destinations, due to unpriced on-street
parking, and zoning codes that require that large numbers of parking spaces be included in most
developments. As a result, most parking costs are borne indirectly through general taxes, building rents,
and higher costs for retail goods. Parking facility annualized costs (total land, construction and operating
costs calculated by the year) typically range from $500 for a basic parking lot on low-value land to more
than $3,000 for structured and underground parking (Litman 2009).
There are many possible ways to efficiently price parking. Municipal governments can expand where
parking is metered; businesses can charge for off-street parking; employee parking can be priced or
“cashed out” (employees who use non-auto modes are offered cash benefits equivalent to the parking
subsidies offered those who drive); residential parking can be unbundled (rented separately from
building space); and existing parking fees can be adjusted to be more efficient, for example, with rates
that reflect costs and demand (VTPI 2016). Charging users directly for parking typically reduces affected
vehicle ownership and use by 10-30% (CARB 2014), which should provide comparable crash reductions.
More efficient parking pricing can be implemented relatively quickly, and with new technologies,
transactions costs can be minimized.
Congestion Pricing (Road Tolls that Increase Under Congested Conditions)
Congestion pricing consists of road tolls that increase under congested conditions. Research by Green,
Heywood and Navarro (2015) indicates that London’s congestion pricing program reduced peak-period
vehicle travel by 10% and crashes by 30% in the priced area, and reduced crashes in nearby areas by
16%. Since less than a third of total vehicle travel occurs under urban-peak conditions, which suggests
that congestion pricing can reduce total crash rates 5-15%, depending on how broadly it is applied.
Distance-Based Vehicle Insurance and Registration Fees
Distance-Based (also called Pay-As-You-Drive, Usage-based, Mileage-Based and Per-Mile Premiums)
means that vehicle insurance premiums and registration fees are based directly on how much it is
driven. Vehicle purchase taxes also be converted into distance-based fees, so a $1,000 tax becomes 1¢
per vehicle-mile. This price structure gives motorists a new opportunity to save money if they reduce
their vehicle travel (Ferreira and Minike 2010; Greenberg and Evans 2017; VTPI 2016).
An average motorist who currently pays $1,200 annual insurance premiums and registration fees would
pay about 10¢ per mile, which is approximately equivalent to a 60% fuel price increase, although it is
simply a different way of paying existing fees rather than a cost increase. Such a price change should
reduce participating vehicles’ average mileage 10-15%. Since all existing rating factors are included in
the rate structure, higher risk motorists would pay more per mile under distance-based pricing, and so
should reduce their mileage more than average. For example, a lower-risk motorist who currently pays
$500 annually would pay about 4¢ per mile, and so would reduce mileage 5%, but a higher-risk motorist
who pays $2,400 for insurance would pay about 20¢ per mile, and so would reduce their driving and
crash risk more than 20%. As a result, distance-based insurance pricing should reduce crash rates even
more than mileage. This suggests that distance-based insurance and registration fees can reduce
affected vehicles’ crash casualties 10-20%.
There are many possible ways to implement distance-based pricing. Some systems use electronic
devices to track when, where and how people drive, but this imposes significant costs ($25-50 annually)
and raises privacy concerns. Basic distance-based pricing only requires an odometer reading at the start
22You can also read