Annual attrition study with - Forecast analysis Life and times of the Class to 2019 Resources Infographics And more - ERIC
←
→
Page content transcription
If your browser does not render page correctly, please read the page content below
Intercultural Development Research Association
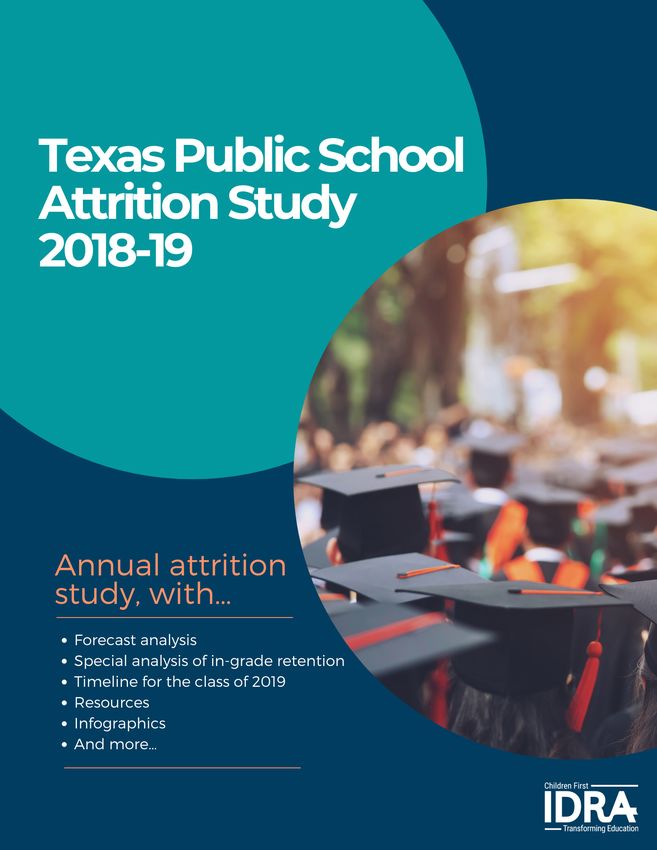
Annual attrition
study with…
Forecast analysis
Life and times of the Class to 2019
Resources
Infographics
And more…
Fe b r u a r y 2 0 2 1 Te x a s P u b l i c S c h o o l A t t r i t i o n S t u d y , 2 0 1 8 - 1 9 1
Intercultural Development Research Association

Inside
Lowest-Ever High School Attrition Rate in Texas ......................................... 3
Attrition Rate Forecast Predicts Continued Loss of Students for Decades .1 7
Infographic: Texas public schools are losing 1 out of 5 students................ 21
Life and Times of the Class of 2019.. ..................................................... 22
College Bound and Determined........................................................... 29
State Report Shows Stagnant Graduation Rates in 2017-18 .. .................... 30
Texas Ranks Fourth Nationally in On-Time Graduation Rate .................... 35
A Model for Success. . .......................................................................... 40
Taking Action to Hold on to Students.................................................... 41
Unwavering Principles to Graduate All Students.. .................................. 42
IDRA Valued Youth Partnership.. ......................................................... 43
Types of Dropout Data Defined ................................................................. 44

                                                                                                               Connect with IDRA
                                                                                                               Online
  The Intercultural Development Research Association      Publication offices:
  (IDRA) is a non-profit organization with a 501(c)(3)    5815 Callaghan Road, Suite 101
  tax exempt status. The purpose of the organization                                                                          Sign up for IDRA’s free
                                                          San Antonio, Texas 78228
  is to disseminate information concerning equality of
                                                          210-444-1710; Fax 210-444-1714
                                                                                                                              email newsletters!
  educational opportunity.                                                                                                    https://idra.news/Subscribe
                                                          www.idra.org | contact@idra.org
  Permission to reproduce material contained herein                                                                           Get IDRA’s Classnotes
  is granted provided the article or item is reprinted    Celina Moreno, J.D.                                                 Podcast via iTunes or online
  in its entirety and proper credit is given to IDRA                                                                          https://budurl.me/IDRApodcast
                                                          IDRA President and CEO
  and the author. Please send a copy of the material in
  its reprinted form to the communications                Executive Editor
  offices. Editorial submissions, news releas-
  es, subscription requests, and change-of-               Christie L. Goodman, APR
                                                                                                                   facebook.com/IDRAed            twitter.com/IDRAedu
  address data should be submitted in writing             IDRA Director of Communications
  to the communications offices. IDRA staff               Production Editor
  welcome your comments on editorial material.
                                                                                                                   https://idra.news/LinkedIn   https://idra.news/YouTubee
  www.idra.org

  Fe b r u a r y 2 0 2 1                                               Te x a s P u b l i c S c h o o l A t t r i t i o n S t u d y , 2 0 1 8 - 1 9                          2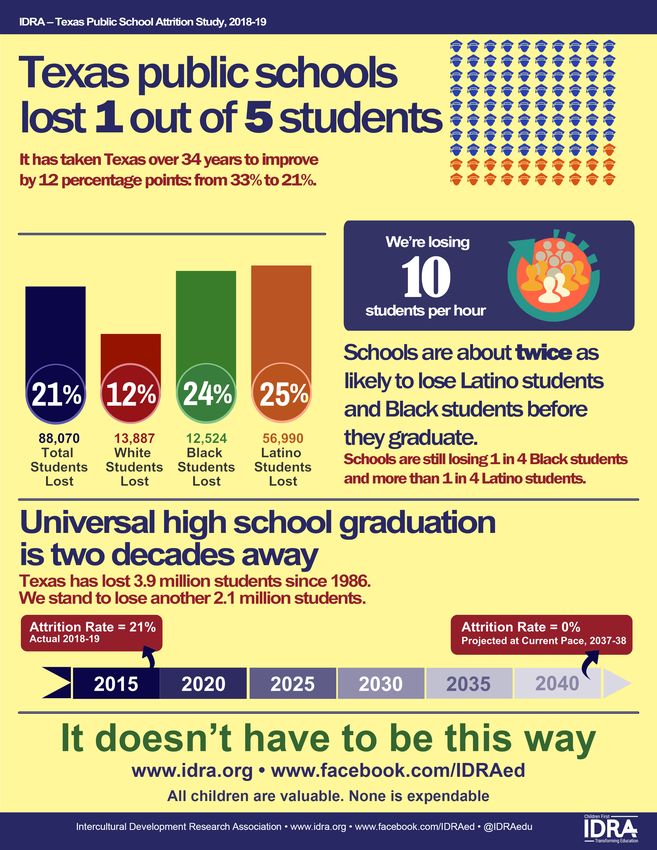
Intercultural Development Research Association
                                                                                                                       Attrition Statewide

Texas Public School Attrition Study, 2018-19
Lowest-Ever High School Attrition
Rate in Texas
by Roy L. Johnson, M.S.
The overall high school attrition rate in Texas          racial and ethnic student groups. The attrition
was 21% for the 2018-19 school year – the lowest         rates of Latino students and Black students were     The statewide attrition
rate ever recorded since the initial attrition study     double the rate of white students.
released by the Intercultural Development                                                                     rate was the lowest
Research Association (IDRA) in 1986. IDRA’s              Findings Highlights                                  it has ever been, but
latest attrition study found that 21% of the freshman    Key findings of the latest study include the         Texas was still losing
class of 2015-16 left school prior to graduating in
the 2018-19 school year.
                                                         following.                                           more than one in five
                                                         • Texas public schools fail to graduate one out of   students the year
This figure represents a drop of one percentage            every five students.                               before COVID-19.
point from last year’s study and a 12-percentage
point drop from the initial study in 1986. The           • A total of 88,070 students from the 2015-16
overall state attrition rate declined from 22% in          freshman class were lost from public high school
2017-18 and 33% in 1985-86.                                enrollment in 2018-19 compared to 86,276 in
                                                           1985-86.
Even with the good news that school holding
power in Texas improved, IDRA cautions that              • Since IDRA’s landmark study in 1986, Texas
this improvement is too slow. At the current pace,         schools lost more than 3.9 million students
Texas will continue to have attrition rates ranging        from public high school enrollment. This is
from 21% to 25% and will not reach an attrition rate       the equivalent of losing the entire populations
of zero until about the year 2037-38 (see forecast         of Houston and San Antonio over the course of
analysis on Page 17). And gaps persist among major         three decades.

In 2018-19…                                                              Schools are twice
                                                                         as likely to lose
                                                                         Latino students
                                                                         and Black
                                                                         students before
                                                                         they graduate.

                                                                         Schools are still
                                                                         losing 1 in 4 Black
                                                                         students and Latino
                                                                         students.

  Intercultural Development Research Association, 2021

  Fe b r u a r y 2 0 2 1                                          Te x a s P u b l i c S c h o o l A t t r i t i o n S t u d y , 2 0 1 8 - 1 9   3
Intercultural Development Research Association
                                                                                                                                   Attrition Statewide

                                                                                                                 Attrition Rates in Texas
        Texas public                                                                                             Public Schools by Year,
        schools are                                                                                              1985-86 to 2018-19
        losing                                                                                                   Year            Black White Latino Total
        1 out of 5                                                                                               1985-86            34           27             45      33
        students                                                                                                 1986-87            38           26             46      34
                                                                                                                 1987-88            39           24             49      33
                                                                                                                 1988-89            37           20             48      31
                                                                                                                 1989-90            38           19             48      31
                                                                                                                 1990-91            37           19             47      31
                                                                                                                 1991-92            39           22             48      34
        It has taken over three decades to improve by                                                            1992-93            43           25             49      36
            12 percentage points: from 33% to 21%                                                                1993-94            47           28             50      39
                                                                                                                 1994-95            50           30             51      40
 Intercultural Development Research Association, 2021                                                            1995-96            51           31             53      42
                                                                                                                 1996-97            51           32             54      43
• For the class of 2019, Latino students and Black       (TDCA) to assess the effect of the state’s dropout      1997-98            49           31             53      42
  students were two times more likely to leave           problem on the Texas economy. Under contract            1998-99            48           31             53      42
  school without graduating than white students.         with TDCA and TEA, IDRA conducted the 1986              1999-00            47           28             52      40
                                                         study entitled, Texas School Dropout Survey Project     2000-01            46           27             52      40
• In four decades, the overall attrition rate declined   (Cárdenas, et al., 1986).
  from 33% in 1985-86 to 21% in 2018-19, a 36%                                                                   2001-02            46           26             51      39
  improvement. The overall attrition rate has been       That first study found that one-third of the students   2002-03            45           24             50      38
  less than 30% in the last 10 study years.              in the class of 1986 dropped out of school without      2003-04            44           22             49      36
                                                         graduating, totaling 86,276 students who did not        2004-05            43           22             48      36
• Since 1986, the attrition rates of Latino students     graduate.                                               2005-06            40           21             47      35
  declined by 44%; the attrition rates of Black                                                                  2006-07            40           20             45      34
  students declined by 29%; the attrition rates of       IDRA’s analysis estimated the economic cost             2007-08            38           18             44      33
  white students declined by 56%; the attrition          to the state was $17 billion in foregone income,        2008-09            35           17             42      31
  rates of Asian/Pacific Islander students declined      lost tax revenues, and increased job training,          2009-10            33           15             39      29
  by 64%; and the attrition rates of Native              welfare, unemployment and criminal justice costs        2010-11            30           14             37      27
  American students declined by 56%.                     (Cárdenas, et al., 1986).                               2011-12            28           14             35      26
• The attrition rates for males are higher than          In 1987, the Texas Legislature responded to the         2012-13            26           14             33      25
  those of females. In the class of 2018-19, males       study findings by the passing HB 1010 through           2013-14            25           13             31      24
  were 1.3 times more likely to leave school before      which the state and local responsibilities for          2014-15            26           14             31      24
  graduation than females.                               collecting and monitoring dropout data were             2015-16            27           15             31      25
                                                         substantially increased (TEC §§11.205-11.207,           2016-17            26           14             29      24
Study History                                            1988).                                                  2017-18            24           13             27      22
This year’s study is the 34th in a series of annual                                                              2018-19            24            12            25      21
reports on trends in dropout and attrition rates in      Data Collection                                         Intercultural Development Research Association, 2021
Texas public schools. The 2018-19 study builds on        IDRA uses data on public school enrollment
a series of studies by IDRA that track the number        from the Texas Public Education Information
and percent of students in Texas who are lost from       Management System (PEIMS) Fall Membership
public school enrollment prior to graduation.            Survey. During the fall of each year, the state
                                                         requires school districts to report information to
IDRA conducted the first-ever comprehensive              TEA via the PEIMS for all public school students
study of school dropouts in Texas more than              by grade levels.
three decades ago (Cárdenas, et al., 1986). In
1984, the Texas Legislature passed House Bill            TEA masks some data in order to comply with
72 authorizing the Texas Education Agency                the Family Educational Rights and Privacy Act
(TEA) to develop a statewide program to reduce           (FERPA). In some of these cases, IDRA must
the longitudinal dropout rate and directed the           exclude some district- and/or county-level data
then Texas Department of Community Affairs               from the total student enrollment counts.

  Fe b r u a r y 2 0 2 1                                             Te x a s P u b l i c S c h o o l A t t r i t i o n S t u d y , 2 0 1 8 - 1 9                        4
Intercultural Development Research Association
                                                                                                                                                               Attrition Statewide

     2015-16 and 2018-19 Enrollment and 2018-19 Attrition in Texas
          Race-                      2015-16   2018-19                               2015-16                 2018-19                     2018-19                  Students              Attrition
         Ethnicity                  9th Grade 12th Grade                           9-12th Grade            9-12th Grade                 Expected                   Lost to                Rate
        and Gender                 Enrollment Enrollment                           Enrollment              Enrollment                  12th Grade                 Attrition                %
                                                                                                                                       Enrollment
       Native
       American                         1,619                1,241                          5,543                 5,280                         1,542                    301                 20

       Asian/Pacific
       Islander                      16,277                16,714                         59,936                70,094                        19,036                 2,322                   12

       Black                         51,786                40,651                       178,647               183,470                          53,175               12,524                   24

       White                       118,446               102,206                        442,136               433,347                        116,093                13,887                   12

       Latino                        211,518             168,764                         710,701               758,572                      225,754                56,990                    25

       Multiracial                     7,296                 6,558                        25,832                30,456                         8,604                 2,046                   24

       All Groups                 406,942                336,134                     1,422,795              1,481,219                      424,204                 88,070                    21

       Male                          212,542              169,823                        729,380                757,938                       221,165                51,342                  23

       Female                        212,542              169,823                        729,380                757,938                       221,165                51,342                  23

       Notes: Figures calculated by IDRA from Texas Education Agency Fall Membership Survey data. IDRA’s 2018-19 attrition study involved the analysis of enrollment figures for public high
       school students in the ninth grade during 2015-16 school year and enrollment figures for 12th grade students in 2018-19. This period represents the time span when ninth grade students would
       be enrolled in school prior to graduation. The enrollment data for special school districts (military schools, state schools and charter schools) were excluded from the analyses since they are
       likely to have unstable enrollments and/or lack a tax base to support school programs. School districts with masked student enrollment data were also excluded from the analysis. Since the
       2014-15 school year, TEA has collected enrollment data for race and ethnicity separately in compliance with new federal standards. For the purposes of analysis, IDRA continued to combine
       the Asian and Native Hawaiian/Other Pacific Islander categories. Attrition rates were not calculated for students classified as having two or more races (multiracial).
       Intercultural Development Research Association, 2021

Beginning in 2010-11, TEA reported student                           19 (see box on Page 7). The percentage of the
enrollment data on race and ethnicity based on                       ninth through 12th grade population reported as
new federal standards that require data on race                      Hispanic/Latino increased from 50.9% to 51.7%
and ethnicity to be collected separately using                       in the one-year period. The percentage of the ninth
a specific two-part question: (1) Is the person                      through 12th grade population reported as Black or
Hispanic/Latino? and (2) What is the person’s                        African American decreased slightly from 12.7%
race? Prior to the new standard, TEA allowed                         to 12.6%, and the percentage reported as white
school districts to report a student’s race or                       declined from 29.9% to 28.7% (see box on Page 8).
ethnicity in one of five categories: American Indian
or Alaska Native (Native American); Asian or                         Methods
Pacific Islander; Black or African American (not                     Attrition rates indicate a school’s holding power –
of Hispanic origin); Hispanic/Latino; or white                       or ability to keep students enrolled in school and
(not of Hispanic origin).                                            learning until they graduate. Along with other
                                                                     dropout measures, attrition rates are useful in
Under the new standards, TEA requires school
                                                                     studying the magnitude of the dropout problem
districts to report a student’s race or ethnicity
                                                                     and the success of schools in keeping students
in one of seven categories: American Indian or
                                                                     in school. Though each measure has different
Alaska Native; Asian; Black or African American;
                                                                     meaning and calculation methods, each provides
Hispanic/Latino; Native Hawaiian or Other
                                                                     unique information that is important for assessing
Pacific Islander; white; or Multiracial (two or
                                                                     schools’ quality of education and school holding
more races).
                                                                     power (see Page 44 for dropout definitions).
Student enrollment data for grades 9-12 increased
                                                                     Since 1985-86 through today, the IDRA attrition
from 1,547,045 in 2017-18 to 1,563,774 in 2018-
                                                                     studies provide time series data, using a consistent

  Fe b r u a r y 2 0 2 1                                                          Te x a s P u b l i c S c h o o l A t t r i t i o n S t u d y , 2 0 1 8 - 1 9                                            5
Intercultural Development Research Association
                                                                                                                           Attrition Statewide
methodology, on the number and percent of Texas         the base year; (2) multiplying the results from
public school students who leave school prior to        Calculation 1 by the ninth grade enrollment in
graduation. They provide information on the             the base year; (3) subtracting the results from
effectiveness and success of Texas public high          Calculation 2 from the 12th grade enrollment in the     Additional Resources
schools in keeping students engaged in school
until they graduate with a high school diploma.
                                                        end year; and (4) dividing the results of Calculation
                                                        3 by the result of Calculation 2. The attrition rate
                                                                                                                Online
                                                        results (percentages) were rounded to the nearest       • Look Up Your County – See attrition
IDRA’s attrition studies involve an analysis of         whole number.                                             rates and numbers over the last 10 years
ninth-grade enrollment figures and 12th-grade
enrollment figures three years later. IDRA              Latest Study Results                                    • eBook – Types of Dropout Data
adjusts the expected grade 12 enrollment based          One of every five students (21%) from the freshman        Defined
on increasing or declining enrollment in grades         class of 2015-16 left school prior to graduating with   • Online graphs
9-12. This period represents the time span during       a high school diploma. For the class of 2019, there
which a student would be enrolled in high school.                                                               • Infographic: Attrition Highlights in
                                                        were 88,070 students who were lost from public
                                                        school enrollment between the 2015-16 and 2018-19         Texas, 2018-19
IDRA collects and uses high school enrollment
                                                        school years. (See box on Page 13.)                     • Infographic: 6 School Policies that Lead
data from the TEA Fall Membership Survey to
compute countywide and statewide attrition rates                                                                  to Higher Dropout Rates – Infographic
                                                        The overall attrition rate declined from 33% in
by race-ethnicity and gender (see box on Page           1985-86 to 21% in 2018-19. Over the past three          • Infographic: Timeline for the Class of
5). IDRA excludes enrollment data from special          decades, attrition rates fluctuated between a low         2019
school districts (military schools, state schools,      of 21% in 2018-19 to a high of 43% in 1996-97.          • eBook – Resources on Student
charter schools) from the analyses because they         (See boxes on Page 10 and Page 12.)
are likely to have unstable enrollments or lack a                                                                 Discipline Policy and Practice
tax base for school programs.                           Racial-Ethnic Student Data. The attrition rates         • Book – Courage to Connect: A Quality
                                                        of Latino students and Black students are much            Schools Action Framework
For the purposes of its attrition reporting, IDRA       higher than those of white students (see box on
continued to use the term Native American in place                                                              • Book – College Bound and Determined
                                                        Page 10). From 1985-86 to 2018-19, attrition rates
of American Indian or Alaska Native. Additionally,      of Latino students declined by 44% (from 45%            • Overview of the Valued Youth
IDRA combined the categories of Asian and Native        to 25%).                                                  Partnership program, that keeps 98% of
Hawaiian or Other Pacific Islander and continued                                                                  students in school
to use the term Asian/Pacific Islander in place of      During this same period, the attrition rates of Black
the separate terms of Asian and Native Hawaiian         students declined by 29% (from 34% to 24%).             • Ideas and Strategies for Action
or Other Pacific Islander.                              Attrition rates of white students declined by 56%       • Classnotes Podcast episodes on
                                                        (from 27% to 12%). Native American students had           Dropout Prevention and College-
IDRA calculates the adjusted attrition rate by: (1)     a decline of 56% in their attrition rates (from 45%
dividing the high school enrollment (grades 9-12)                                                                 Readiness
                                                        to 20%), and Asian/Pacific Islander students had
in the end year by the high school enrollment in        a decline of 64% (from 33% to 12%).
                                                                                                                         www.idra.org
  Proportion of Student Population
  Lost to Attrition
                                                           Latino students and Black
                                                           students comprise a higher
                                                           percentage of students lost
                                                           than their proportion of the
                                                           student population

 Intercultural Development Research Association, 2021

  Fe b r u a r y 2 0 2 1                                            Te x a s P u b l i c S c h o o l A t t r i t i o n S t u d y , 2 0 1 8 - 1 9           6
Intercultural Development Research Association
                                                                                                                                                       Attrition Statewide

 Texas Student Enrollment, Grades 9-12, 2015-16 to 2018-19 (number)
                                                                                                            Enrollment by Grade
   Race-Ethnicity                                                                 9                      10          11                                 12             9-12

   2015-16
       Black or African American                                              55,616                 49,189                 45,027                  40,730           190,562
       Latino                                                                224,127                195,093                173,392                 156,961           749,573
       American Indian or Alaskan Native                                        1,736                 1,449                   1,379                  1,307              5,871
       White                                                                 122,593                117,706                 111,378                104,374            456,051
       Asian                                                                  16,371                 15,580                 14,237                  13,830             60,018
       Native Hawaiian or Other Pacific Islander                                  617                   548                     546                    447              2,158
       Multiracial                                                             7,644                  6,969                  6,360                   5,829             26,802
       Total                                                                428,704                386,534                 352,319                323,478          1,491,035

   2016-17
       Black or African American                                              56,025                49,657                   45,993                  41,411           193,086
       Latino                                                                227,208                203,515                 181,279                 163,411           775,413
       American Indian or Alaskan Native                                        1,625                  1,515                   1,342                  1,252             5,734
       White                                                                 121,294                115,985                 112,222                105,598           455,099
       Asian                                                                  16,994                 16,710                   15,817                14,290              63,811
       Native Hawaiian or Other Pacific Islander                                 604                    580                      534                    548             2,266
       Multiracial                                                             7,995                  7,372                   6,746                  6,257             28,370
       Total                                                                 431,745               395,334                 363,933                332,767          1,523,779

   2017-18
       Black or African American                                               55,975                 50,148                 46,329                     42,746        195,198
       Latino                                                                 227,319               204,935                 188,795                    171,047       792,096
       American Indian or Alaskan Native                                        1,646                  1,460                   1,444                     1,256          5,806
       White                                                                  120,753                115,234                 110,795                  106,999         453,781
       Asian                                                                   17,923                  17,163                 16,791                    15,842         67,719
       Native Hawaiian or Other Pacific Islander                                  656                    608                      571                       519         2,354
       Multiracial                                                              8,679                   7,661                  7,146                     6,605         30,091
       Total                                                                 432,951               397,209                  371,871                   345,014      1,547,045

   2018-19
       Black or African American                                               56,163                50,152                 46,658                      43,362        196,335
       Latino                                                                231,346                207,791                190,435                     178,632       808,204
       American Indian or Alaskan Native                                         1,513                1,489                   1,286                       1,312         5,600
       White                                                                  119,103               114,433                109,590                     105,504       448,630
       Asian                                                                   18,550                18,003                  17,215                     16,829         70,597
       Native Hawaiian or Other Pacific Islander                                  608                   604                     610                        529           2,351
       Multiracial                                                              9,403                 8,364                   7,419                      6,871         32,057
       Total                                                                436,686                400,836                 373,213                    353,039      1,563,774

   Data source: Texas Education Agency, Standard Reports, Enrollment Reports, 2015-16 to 2018-19, https://rptsvr1.tea.texas.gov/adhocrpt/adste.html
   Intercultural Development Research Association, 2021

 Fe b r u a r y 2 0 2 1                                                     Te x a s P u b l i c S c h o o l A t t r i t i o n S t u d y , 2 0 1 8 - 1 9                         7
Intercultural Development Research Association
                                                                                                                                  Attrition Statewide

   Texas Student Enrollment, Grades 9, 12 and 9-12,
   2015-16 to 2018-19 (percent)
     Race-Ethnicity                                                                      2015-16         2016-17             2017-18               2018-19

     9th Grade Enrollment
          Black or African American                                                           13.0           12.9                 13.0                  12.9
          Hispanic or Latino                                                                  52.3           52.5                52.6                  53.0
          American Indian or Alaskan Native                                                    0.4            0.4                  0.4                   0.3
          White                                                                              28.6           27.9                  28.1                  27.3
          Asian                                                                                3.8            4.1                  3.9                   4.2
          Native Hawaiian or Other Pacific Islander                                            0.1            0.2                  0.1                   0.1
          Multiracial                                                                          1.8            2.0                  1.9                   2.2
          Total All Ethnicities                                                             100.0          100.0                100.0                 100.0

     12th Grade Enrollment
          Black or African American                                                           12.7           12.4                 12.4                  12.3
          Hispanic or Latino                                                                  50.5          49.6                 49.1                  50.6
          American Indian or Alaskan Native                                                    0.4            0.4                  0.4                   0.4
          White                                                                              30.5            31.0                 31.7                 29.9
          Asian                                                                                4.0            4.6                  4.3                   4.8
          Native Hawaiian or Other Pacific Islander                                            0.1            0.2                  0.2                   0.1
          Multiracial                                                                          1.8            1.9                  1.9                   1.9
          Total All Ethnicities                                                             100.0          100.0                100.0                 100.0

     9-12th Grade Enrollment
         Black or African American                                                            12.8           12.6                 12.7                  12.6
         Hispanic or Latino                                                                  50.3            51.2                50.9                   51.7
         American Indian or Alaskan Native                                                     0.4            0.4                  0.4                   0.4
         White                                                                               30.6           29.3                 29.9                  28.7
         Asian                                                                                 4.0            4.4                  4.2                   4.5
         Native Hawaiian or Other Pacific Islander                                             0.1            0.2                  0.1                   0.2
         Multiracial                                                                           1.8            1.9                  1.9                   2.0
         Total All Ethnicities                                                              100.0          100.0                100.0                 100.0

     Data source: Texas Education Agency, Standard Reports, Enrollment Reports, 2015-16 to 2018-19
     Intercultural Development Research Association, 2021

Latino students have higher attrition rates than                   2018-19. The gap between white students and      • Asian/Pacific Islander students exhibited the
either white students or Black students. The                       Black students increased by 71% from 1985-86       greatest positive trend in the reduction of the
attrition rate of Asian/Pacific Islander students                  to 2018-19. (See boxes on Page 10.)                gap in attrition rates compared to white students.
are lowest among the racial/ethnic groups. For                                                                        The gap between the attrition rates of white
the class of 2018-19, Black students and Latino                • The attrition gap between white students and         students and Asian/Pacific Islander students
students were about two times more likely to                     Latino students was 18 percentage points in          declined from 6 percentage points in 1985-86
leave school without graduating with a diploma                   1985-86 compared to 13 percentage points in          to equaling the attrition rate of white students
than white students.                                             2018-19. The gap between white students and          in 2018-19.
                                                                 Latino students decreased by 28% from 1985-86
Gap Over Time. The gap between the attrition                     to 2018-19. (See boxes on Page 10.)                Historically, Latino students and Black students
rates of white students and of Black students and                                                                   comprised a large proportion of students lost by
Latino students is nearly as high as or higher than            • The gap between the attrition rates of white       schools. For the period of 1985-86 to 2018-19,
34 years ago.                                                    students and Native American students has          students of color account for nearly three-fourths
                                                                 declined from 18 percentage points in 1985-86      (73.9%) of the estimated 3.8 million students lost
• The attrition gap between white students and                   to eight percentage points in 2018-19, a 56%       from public high school enrollment.
  Black students was 7 percentage points in                      decline.
  1985-86 compared to 12 percentage points in

  Fe b r u a r y 2 0 2 1                                                      Te x a s P u b l i c S c h o o l A t t r i t i o n S t u d y , 2 0 1 8 - 1 9          8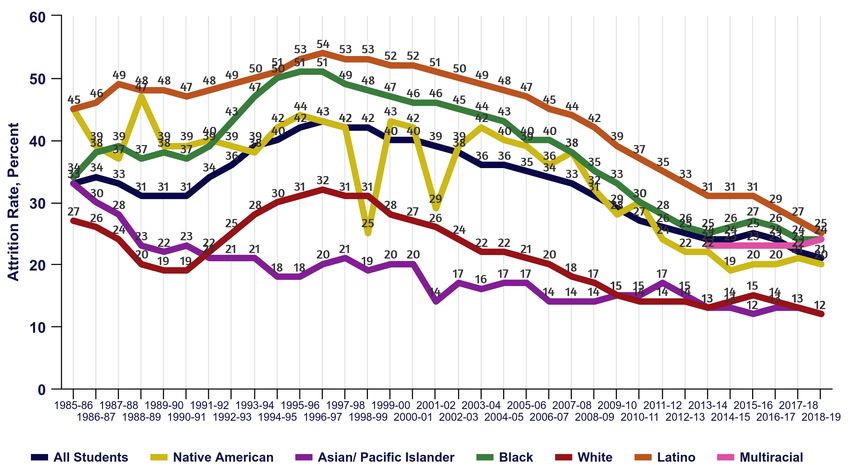
Intercultural Development Research Association
                                                                                                                                Attrition Statewide
• Latino students account for 55.6% of the                 females have accounted for 42.8%.
  students lost to attrition.
                                                         Additional Data. County-level data are provided        A total of 88,070
• Black students account for 16.5% of all students       on Pages 14-15. In addition, trend data by county      students from the
  lost from enrollment due to attrition over the         are available on IDRA’s website at www.idra.           2015-16 freshman
  years.                                                 org (see box on Page 13). The box on Page 12
                                                         shows attrition and dropout rates in Texas over
                                                                                                                class were lost from
• White students account for 25.9% of students           time as reported in IDRA’s attrition studies and       public high school
  lost from high school enrollment over time.            TEA dropout reports. Descriptions of different         enrollment in 2018-19
• Attrition rates for white students and Asian/
                                                         dropout counting and reporting methodologies
                                                         are outlined on Page 44.
                                                                                                                compared to 86,276 in
  Pacific Islander students have been typically                                                                 1985-86.
  lower than the overall attrition rates.
                                                         Conclusions
Male-Female Student Data. The attrition rates            The results of the current attrition study show that
for males have been higher than those of females.        attrition rates today are lower than they have ever
In the class of 2018-19, males were 1.3 times more       been. Trend data show that evidence is mounting
likely to leave school without graduating with a         that attrition rates are indeed declining, but
diploma than females.                                    persistent gaps in the attrition rates of white and
                                                         non-white students continue to exist. Additional
• From 1985-86 to 2018-19, attrition rates of male       research is needed to address the reasons these
  students declined by 34% (from 35% to 23%).            persistent gaps remain.
  Attrition rates for females declined by 44% from
  32% in 1985-86 to 18% in 2018-19.                      Educators, policymakers and the community at
                                                         large must continue to advocate for educational
• Longitudinally, males have accounted for 57.2%         programs and funding to ensure that every child
  of students lost from school enrollment, while         graduate from high schools and that they have full

  Longitudinal Attrition Rates by Race-Ethnicity
  in Texas Public Schools, 1985-86 to 2018-19

                                                                                                                            Latino

                                                                                                                                                      Black
                                                                                                                                                      Mulitracial
                                                                                                                                                      Native
                                                                                                                                                      American

                                                                                                                 Asian/                  White
                                                                                                                 Pacific
                                                                                                                 Islander

  Intercultural Development Research Association, 2021

  Fe b r u a r y 2 0 2 1                                           Te x a s P u b l i c S c h o o l A t t r i t i o n S t u d y , 2 0 1 8 - 1 9               9
Intercultural Development Research Association
Attrition Statewide
Trend in Black-White Attrition Rates Attrition and Dropout
The attrition gap between Black •
Rates in Texas
2017-18 22 n/a
Over
n/a
Time
n/a
students and white students is IDRA TEA TEA Long. TEA Annual
double what it was 34 years ago Attrition Attrition Dropout Dropout
Rates1 Rates1 Rates Rates
Black 1985-86 33 -- --
1986-87 34 -- --
Initial Gap
7 points
1987-88 33 34.0 6.7
1988-89 31 31.3 6.1
White Current Gap 1989-90 31 27.2 5.1
12 points 1990-91 31 21.4 3.9
1991-92 34 20.7 3.8
1992-93 36 15.8 2.8
1993-94 39 14.4 2.6
1994-95 40 10.6 1.8
1995-96 42 10.1 1.8
1996-97 43 9.1 1.6
School Year
1997-98 42 36 14.7 1.6
Intercultural Development Research Association, 2021
1998-99 42 37 9.0* 1.6
1999-00 40 37 7.7* 1.3
2000-01 40 37 6.8* 1.0
Trend in Latino-White Attrition Rates 2001-02 39 36 5.6* 0.9
2002-03 38 34 4.9* 0.9
The attrition gap between 2003-04 36 33 4.2* 0.9
Latino students and white
2004-05 36 32 4.6* 0.9
Latino
students is just 5 percentage
2005-06 35 31 9.1*** 2.6**
points less than 34 years ago
2006-07 34 30 11.6*** 2.7**
Initial Gap
18 points 2007-08 33 29 10.7*** 2.2**
2008-09 31 29 9.5*** 2.0**
White Current Gap 2009-10 29 27 7.6*** 1.7**
13 points 2010-11 27 25 7.1*** 1.6**
2011-12 26 23 6.6*** 1.7**
2012-13 25 22 6.7*** 1.6**
2013-14 24 21 6.7*** 1.6**
2014-15 24 20.3 6.3*** 2.1**
2015-16 25 19.6 6.2*** 2.0**
School Year
2016-17 24 18.5 5.9*** 1.9**
Intercultural Development Research Association, 2021 2017-18 22 18 5.7*** 1.9**
2018-19 21 n/a n/a n/a
Attrition rates for grades 9-12
1
opportunity for post-secondary education, gainful for all students to graduate from high school and * Longitudinal completion rate (Grades 7-12)
employment, and maximum career earnings. college (https://idra.news/CollegeBoundw, also ** Annual dropout rate using NCES definition (Grades 7-12)
*** Longitudinal dropout rate using NCES definition (Grades 7-12)
see Page 29). Sources: Intercultural Development Research Association, 2021;
IDRA urges communities to work together to Texas Education Agency, Secondary School Completion
review issues surrounding school dropouts and In the book, Courage to Connect: A Quality and Dropouts, 2003-04 to 2018-19;
Texas Education Agency, Report on Public School
to take action for the benefit of children and the Schools Action Framework, IDRA shows how Dropouts, 1987-88 to 1996-97
future of Texas. IDRA has developed a number communities and schools can work together to
of products to guide communities and schools in strengthen school success in a number of areas
improving school holding power in schools in including graduation outcomes. The book’s web
Texas and across the nation. IDRA’s publication, page (see Page 40) provides a table of contents,
College Bound and Determined, shows how one excerpts, related podcasts and other resources.
south Texas school district transformed itself from IDRA’s set of principles for policymakers and
low achievement and low expectations to planning school leaders is provided on Page 42.
Fe b r u a r y 2 0 2 1 Te x a s P u b l i c S c h o o l A t t r i t i o n S t u d y , 2 0 1 8 - 1 9 10Intercultural Development Research Association
Attrition Statewide
Look Up Your Texas County
IDRA is providing dropout
trend data at your fingertips.
Go to the IDRA website to
see a graph of high school
attrition in your county over
the last 10 years.
https://idra.news/Txlook
Resources
Cárdenas, J.A., Robledo Montecel, M., & Supik, J. (1986).
Texas Dropout Survey Project. San Antonio, Texas:
Intercultural Development Research Association.
Johnson, R. (2018). Texas Public School Attrition Study,
2017-18 – High School Attrition Improves by Two Points.
San Antonio, Texas: Intercultural Development Research
Association.
Montes, F. (2018). “Attrition Rate Reached Lowest Value
but Trend Needs to Quicken to Make a Difference,”
Texas Public School Attrition Study, 2017-18. San Antonio,
Texas: Intercultural Development Research Association,
October 2018.
Texas Education Agency. (2019). Secondary School Completion
and Dropouts in Texas Public Schools 2017-18. Austin, Texas:
Texas Education Agency.
Texas Education Agency. (2019). Standard Reports, Enrollment
Reports, 2007-08 to 2018-19 . Austin, Texas: Texas
Education Agency.
Roy L. Johnson, M.S., is director of research and evaluation
(roy.johnson@idra.org). Charles Cavazos, an IDRA education
data analyst, provided assistance with data analysis (charles.
cavazos@idra.org).
Fe b r u a r y 2 0 2 1 Te x a s P u b l i c S c h o o l A t t r i t i o n S t u d y , 2 0 1 8 - 1 9 11Intercultural Development Research Association
Attrition Statewide
Longitudinal Attrition Rates in Texas Public High Schools,
1985-86 to 2018-19
Race-Ethnicity Gender
Total
Native Asian/Pacific
Group Black White Latino Multiracial Male Female
American Islander
1985-86 45 33 34 27 45 35 32 33
1986-87 39 30 38 26 46 35 32 34
1987-88 37 28 39 24 49 35 31 33
1988-89 47 23 37 20 48 34 29 31
1989-90 39 22 38 19 48 34 29 31
1990-91 39 23 37 19 47 34 28 31
1991-92 40 21 39 22 48 37 30 34
1992-93 39 21 43 25 49 39 33 36
1993-94 38 21 47 28 50 41 36 39
1994-95 42 18 50 30 51 43 37 40
1995-96 44 18 51 31 53 45 39 42
1996-97 43 20 51 32 54 46 40 43
1997-98 42 21 49 31 53 45 38 42
1998-99 25 19 48 31 53 45 38 42
1999-00 43 20 47 28 52 44 36 40
2000-01 42 20 46 27 52 43 36 40
2001-02 29 14 46 26 51 43 35 39
2002-03 39 17 45 24 50 41 34 38
2003-04 42 16 44 22 49 40 33 36
2004-05 40 17 43 22 48 39 32 36
2005-06 39 17 40 21 47 38 31 35
2006-07 36 14 40 20 45 37 30 34
2007-08 38 14 38 18 44 36 29 33
2008-09 32 14 35 17 42 35 27 31
2009-10 28 15 33 15 39 N/A 33 25 29
2010-11 30 15 30 14 37 31 23 27
2011-12 24 17 28 14 35 29 22 26
2012-13 22 15 26 14 33 28 22 25
2013-14 22 13 25 13 31 23 26 21 24
2014-15 19 13 26 14 31 23 27 22 24
2015-16 20 12 27 15 31 23 27 22 25
2016-17 20 13 26 14 29 23 26 21 24
2017-18 21 13 24 13 27 23 25 19 22
2018-19 20 12 24 12 25 24 23 18 21
Percent
Change* -56 -64 -29 -56 -44 N/A -34 -44 -36
From
1985-86
to 2018-19
* Rounded to nearest whole number. Figures calculated by IDRA from Texas Education Agency Fall Membership Survey data.
Intercultural Development Research Association, 2021
Fe b r u a r y 2 0 2 1 Te x a s P u b l i c S c h o o l A t t r i t i o n S t u d y , 2 0 1 8 - 1 9 12Intercultural Development Research Association
Attrition Statewide
Numbers of Students Lost to Attrition in Texas,
1985-86 to 2018-19
School Total Race-Ethnicity Gender
Year Native Asian/ Black White Latino Multiracial Male Female
American Pacific
Islander
1985-86 86,276 185 1,523 12,268 38,717 33,583 N/A 46,603 39,673
1986-87 90,317 152 1,406 14,416 38,848 35,495 N/A 48,912 41,405
1987-88 92,213 159 1,447 15,273 34,889 40,435 N/A 50,595 41,618
1988-89 88,538 252 1,189 15,474 28,309 43,314 N/A 49,049 39,489
1989-90 86,160 196 1,214 15,423 24,510 44,817 N/A 48,665 37,495
1990-91 83,718 207 1,324 14,133 23,229 44,825 N/A 47,723 35,995
1991-92 91,424 215 1,196 15,016 27,055 47,942 N/A 51,937 39,487
1992-93 101,358 248 1,307 17,032 32,611 50,160 N/A 57,332 44,026
1993-94 113,061 245 1,472 19,735 37,377 54,232 N/A 63,557 49,504
1994-95 123,200 296 1,226 22,856 41,648 57,174 N/A 68,725 54,475
1995-96 135,438 350 1,303 25,078 45,302 63,405 N/A 75,854 59,584
1996-97 147,313 327 1,486 27,004 48,586 69,910 N/A 82,442 64,871
1997-98 150,965 352 1,730 26,938 49,135 72,810 N/A 85,585 65,380
1998-99 151,779 299 1,680 25,526 48,178 76,096 N/A 86,438 65,341
1999-00 146,714 406 1,771 25,097 44,275 75,165 N/A 83,976 62,738
2000-01 144,241 413 1,794 24,515 41,734 75,785 N/A 82,845 61,396
2001-02 143,175 237 1,244 25,017 39,953 76,724 N/A 82,762 60,413
2002-03 143,280 436 1,611 25,066 36,948 79,219 N/A 82,621 60,659
2003-04 139,413 495 1,575 24,728 33,104 79,511 N/A 80,485 58,928
2004-05 137,424 490 1,789 24,373 31,378 79,394 N/A 78,858 58,566
2005-06 137,162 512 1,876 24,366 29,903 80,505 N/A 78,298 58,864
2006-07 134,676 500 1,547 23,845 28,339 80,445 N/A 76,965 57,711
2007-08 132,815 581 1,635 23,036 25,923 81,640 N/A 76,532 56,283
2008-09 125,508 450 1,685 21,019 22,476 79,878 N/A 73,572 51,936
2009-10 119,836 427 1,951 20,051 20,416 76,991 N/A 70,606 49,230
2010-11 110,804 601 1,951 16,880 16,771 74,601 N/A 65,983 44,821
2011-12 103,140 432 2,353 14,675 16,615 69,065 N/A 61,165 41,975
2012-13 99,575 412 2,171 13,437 16,390 67,165 N/A 58,758 40,817
2013-14 94,711 363 2,015 12,324 15,437 62,990 1,582 55,094 39,617
2014-15 99,297 313 2,017 13,525 17,047 64,825 1,570 57,626 41,671
2015-16 102,610 320 1,852 14,423 17,441 66,863 1,711 59,365 43,245
2016-17 99,960 305 2,124 13,802 17,107 64,849 1,773 57,874 42,086
2017-18 94,767 314 2,444 12,986 15,467 61,660 1,896 55,266 39,501
2018-19 88,070 301 2,322 12,524 13,887 56,990 2,046 51,342 36,728
All Years 3,938,938 11,791 57,230 651,861 1,019,015 2,188,463 10,578 2,253,410 1,685,528
Figures calculated by IDRA from Texas Education Agency Fall Membership Survey data. * Calculation of attrition could not be achieved without corresponding first-year data.
Intercultural Development Research Association, 2021 N/A = Not applicable
Fe b r u a r y 2 0 2 1 Te x a s P u b l i c S c h o o l A t t r i t i o n S t u d y , 2 0 1 8 - 1 9 13Intercultural Development Research Association
Attrition Statewide
Attrition Rates in Texas Public Schools, by Texas County,
by Race-Ethnicity, 2018-19
County Attrition Rates1 County Attrition Rates1
Name Black White Latino Total Name Black White Latino Total
Anderson 28 21 32 25 Dewitt 18 12 39 26
Andrews ** 23 27 25 Dickens 0 19 21 21
Angelina 29 8 8 10 Dimmit ** 48 31 31
Aransas 72 15 28 18 Donley 60 6 25 17
Archer ** 8 ** 5 Duval . 33 18 19
Armstrong . ** 11 ** Eastland ** 17 1 13
Atascosa 33 21 19 19 Ector 44 27 41 38
Austin 32 13 25 20 Edwards . 23 1 9
Bailey . 10 4 5 Ellis 15 18 25 20
Bandera ** 14 36 22 El Paso 8 20 18 18
Bastrop 5 8 33 24 Erath 40 16 34 23
Baylor ** 7 50 8 Falls ** 10 23 12
Bee 54 ** 28 22 Fannin 28 4 24 9
Bell 33 19 30 26 Fayette 45 7 32 20
Bexar 24 10 26 23 Fisher 100 ** 22 10
Blanco . ** ** ** Floyd ** ** 20 13
Borden . 21 36 14 Foard . 49 ** 46
Bosque 12 14 2 13 Fort Bend 17 12 31 19
Bowie 21 10 23 14 Franklin 39 22 ** 18
Brazoria 20 15 28 22 Freestone ** 13 23 8
Brazos 40 11 33 26 Frio 100 39 22 23
Brewster . 24 5 13 Gaines 60 11 29 24
Briscoe . ** 23 ** Galveston 24 11 25 17
Brooks . . . . Garza 46 30 37 36
Brown 18 9 22 14 Gillespie . 12 22 15
Burleson ** 1 22 8 Glasscock . ** ** **
Burnet 13 16 23 19 Goliad ** 13 30 19
Caldwell 7 ** 28 20 Gonzales ** 22 31 26
Calhoun ** 16 19 19 Gray 15 11 24 19
Callahan ** 21 38 20 Grayson 36 17 30 23
Cameron ** 15 20 20 Gregg 15 10 16 12
Camp 5 34 9 17 Grimes 33 13 30 23
Carson 40 17 ** 12 Guadalupe 0 9 26 16
Cass ** 10 10 7 Hale 24 9 27 22
Castro 29 ** 24 17 Hall 8 ** 33 20
Chambers 3 12 26 15 Hamilton ** 6 32 12
Cherokee 24 26 33 29 Hansford . ** 16 10
Childress ** 3 17 9 Hardeman . 14 29 19
Clay . 11 37 10 Hardin 20 13 26 16
Cochran . ** 26 18 Harris 26 10 25 21
Coke . ** ** ** Harrison 61 13 22 23
Coleman 11 33 8 25 Hartley . ** 53 2
Collin 12 9 20 14 Haskell 25 ** 15 4
Collingsworth 0 ** ** ** Hays 21 19 28 24
Colorado 13 5 30 18 Hemphill . ** 42 16
Comal ** 14 26 18 Henderson 8 12 18 13
Comanche . 25 13 21 Hidalgo 6 18 26 26
Concho 50 ** 40 22 Hill 27 11 22 18
Cooke 45 17 31 22 Hockley 24 11 16 14
Coryell 9 19 20 19 Hood 51 18 26 20
Cottle 56 3 12 18 Hopkins 15 16 23 19
Crane . 19 7 9 Houston 24 18 24 21
Crockett . ** 26 18 Howard 26 20 35 30
Crosby 16 20 8 11 Hudspeth . ** 6 1
Culberson . 73 ** 7 Hunt 26 8 21 14
Dallam 25 7 22 14 Hutchinson ** 5 ** **
Dallas 24 7 29 24 Irion . 29 19 25
Dawson 6 ** 16 8 Jack 38 12 11 10
Deaf Smith 100 5 25 23 Jackson 32 1 20 10
Delta 28 7 33 17 Jasper 18 17 25 19
Denton 15 10 23 15 Jeff Davis . 38 25 28
1
Calculated by: (1) dividing the high school enrollment in the end year by the high school enroll- ** = Attrition rate is less than zero (0).
ment in the base year; (2) multiplying the results from Calculation 1 by the ninth grade enrollment *** = No high school.
in the base year; (3) subtracting the results from Calculation 2 from the 12th grade enrollment in
the end year; and (4) dividing the results of Calculation 3 by the result of Calculation 2. The • = The necessary data are unavailable to calculate the attrition rate.
attrition rate results (percentages) were rounded to the nearest whole number.
Intercultural Development Research Association, 2021
Fe b r u a r y 2 0 2 1 Te x a s P u b l i c S c h o o l A t t r i t i o n S t u d y , 2 0 1 8 - 1 9 14Intercultural Development Research Association
Attrition Statewide
Attrition Rates in Texas Public Schools, By Texas County,
by Race-Ethnicity, 2018-19 (continued)
County Attrition Rates County Attrition Rates
Name Black White Latino Total Name Black White Latino Total
Jefferson 22 3 22 16 Randall 15 5 22 11
Jim Hogg . 45 18 18 Reagan 100 7 36 35
Jim Wells 64 0 36 31 Real . 10 41 23
Johnson 35 17 24 20 Red River 16 ** 11 4
Jones 43 14 10 15 Reeves ** 30 31 30
Karnes . 16 24 21 Refugio 16 ** 11 1
Kaufman 32 14 32 21 Roberts . ** 25 5
Kendall ** 11 20 14 Robertson 10 5 31 14
Kent . ** 48 15 Rockwall 18 17 28 20
Kerr 1 4 12 9 Runnels ** 15 26 19
Kimble . ** 23 3 Rusk 10 7 20 11
King . 14 . ** Sabine 10 0 19 3
Kinney 100 14 0 8 San Augustine 14 ** 24 4
Kleberg 28 6 33 31 San Jacinto ** 21 32 19
Knox ** ** 16 1 San Patricio 39 14 27 24
Lamar 12 6 27 9 San Saba . 8 17 14
Lamb 21 2 22 18 Schleicher . ** 24 15
Lampasas ** 4 9 5 Scurry ** 1 36 21
La Salle . 63 23 25 Shackelford . 9 22 13
Lavaca 47 ** 28 8 Shelby 15 39 22 28
Lee 13 14 26 19 Sherman . ** ** **
Leon ** ** 10 1 Smith 23 13 29 21
Liberty 17 23 36 28 Somervell 100 10 20 14
Limestone 3 5 15 6 Starr . 100 21 21
Lipscomb ** ** 14 3 Stephens ** 39 28 36
Live Oak ** 8 21 15 Sterling . 21 ** 9
Llano . 20 41 26 Stonewall . 9 24 10
Lubbock 25 10 25 19 Sutton . ** 14 8
Lynn 100 18 33 29 Swisher 32 10 16 14
Madison 9 12 7 9 Tarrant 30 11 29 22
Marion 11 27 35 23 Taylor 43 18 36 28
Martin . 18 40 31 Terrell . ** 3 0
Mason . ** 6 ** Terry ** 6 15 11
Matagorda ** ** 20 11 Throckmorton . ** 9 **
Maverick 67 46 32 33 Titus 29 20 23 22
McCulloch ** ** 14 ** Tom Green 12 3 30 19
McClennan 22 10 27 19 Travis 14 16 30 23
McMullen . 21 17 16 Trinity 29 13 15 17
Medina 2 14 20 17 Tyler 16 16 21 17
Menard 0 ** 10 1 Upshur 3 13 34 15
Midland 45 18 44 37 Upton 0 ** 22 13
Milam 6 14 31 20 Uvalde . 27 26 26
Mills 22 5 32 19 Val Verde 38 ** 6 6
Mitchell ** 2 12 7 Van Zandt 45 14 25 16
Montague 38 13 7 10 Victoria 40 12 41 34
Montgomery 21 15 26 19 Walker 31 18 35 29
Moore 65 10 19 18 Waller 29 12 30 25
Morris ** ** 28 3 Ward 18 18 28 24
Motley . ** 47 14 Washington 39 ** 39 21
Nacogdoches 29 3 28 17 Webb 15 14 17 17
Navarro 16 10 25 19 Wharton 22 4 35 23
Newton 7 24 30 20 Wheeler ** 7 19 10
Nolan ** 19 27 23 Wichita 15 8 12 10
Nueces 9 11 21 18 Wilbarger 52 27 25 28
Ochiltree . 24 28 28 Willacy . 0 16 16
Oldham 10 13 44 22 Williamson 15 10 18 14
Orange 27 16 20 17 Wilson 36 4 19 12
Palo Pinto 23 18 22 19 Winkler 100 37 26 28
Panola 16 14 31 16 Wise 69 15 12 14
Parker 7 19 22 19 Wood 34 23 16 22
Parmer . 13 21 20 Yoakum 100 20 5 9
Pecos ** ** 24 17 Young 17 5 29 14
Polk 25 29 26 28 Zapata . 55 0 1
Potter 34 18 27 25 Zavala 33 ** 9 8
Presidio . ** 24 24
Rains ** 23 39 22 Total 24 12 25 21
Intercultural Development Research Association, 2021
Fe b r u a r y 2 0 2 1 Te x a s P u b l i c S c h o o l A t t r i t i o n S t u d y , 2 0 1 8 - 1 9 15Intercultural Development Research Association Changes in High School Attrition Rates in Texas Counties 138 Counties Where High School Attrition Rates Improved Since Last Year Angelina Childress Erath Hudspeth Limestone Palo Pinto Tom Green Archer Collin Falls Hunt Lipscomb Parmer Upshur Bailey Colorado Fayette Jack Live Oak Pecos Uvalde Bastrop Cooke Floyd Jackson Llano Presidio Val Verde Bee Coryell Freestone Jasper Lubbock Rains Van Zandt Bell Cottle Frio Jim Hogg Madison Randall Victoria Bexar Crane Galveston Jim Wells Matagorda Refugio Walker Borden Dallam Gregg Johnson Maverick Roberts Waller Bowie Dallas Grimes Jones McClennan Robertson Webb Brazoria Dawson Guadalupe Karnes Medina Rusk Wharton Brazos Deaf Smith Hamilton Kaufman Menard San Augustine Wilbarger Brewster Denton Hansford Kendall Milam San Jacinto Williamson Brown Dickens Harris Kerr Mitchell Schleicher Wilson Burleson Dimmit Hartley Kinney Montague Somervell Wise Burnet Duval Haskell Knox Montgomery Starr Wood Calhoun Eastland Hemphill Lamar Moore Stephens Yoakum Callahan Ector Henderson Lampasas Nacogdoches Sterling Young Cameron Edwards Hidalgo Lavaca Navarro Tarrant Zapata Castro El Paso Hockley Leon Nolan Taylor Zavala Chambers Ellis Howard Liberty Nueces 82 Counties Where High School Attrition Rates Worsened Since Last Year Anderson Cochran Fort Bend Hill Martin Red River Terry Aransas Coleman Garza Hood McMullen Reeves Titus Atascosa Comal Gillespie Hopkins Midland Runnels Trinity Austin Comanche Goliad Houston Mills San Patricio Tyler Bandera Concho Gonzales Irion Motley San Saba Upton Baylor Culberson Gray Jeff Davis Newton Scurry Ward Bosque Delta Grayson Kent Ochiltree Shackelford Washington Caldwell Dewitt Hale La Salle Orange Shelby Wichita Camp Donley Hall Lamb Parker Smith Willacy Carson Fannin Hardeman Lee Polk Stonewall Winkler Cherokee Fisher Harrison Lynn Potter Sutton Clay Foard Hays Marion Reagan Swisher 12 Counties Where High School Attrition Rates Are the Same as Last Year Andrews Franklin Hardin Kimble Oldham Rockwall Travis Cass Gaines Jefferson Kleberg Panola 20 Counties Where High School Attrition Rates Cannot be Compared with Last Year* Armstrong Collingsworth King Sabine Blanco Crockett Mason Sherman Look up your county to see Briscoe Crosby McCulloch Terrell 10-year trends Brooks Glasscock Morris Throckmorton https://idra.news/Txlook Coke Hutchinson Real Wheeler * County rates cannot be compared from one year to the next when for either year (or both) the attrition rate is less than zero, there is no high school or the necessary data are unavailable to calculate the attrition rate. Source: Intercultural Development Research Association, 2021 Fe b r u a r y 2 0 2 1 Te x a s P u b l i c S c h o o l A t t r i t i o n S t u d y , 2 0 1 8 - 1 9 16
Intercultural Development Research Association
                                                                                                                                 Forecast Analysis

Attrition Rate Forecast Predicts Continued
Loss of Students for Decades
by Felix Montes, Ph.D.
The annual attrition rate decreased by one point to     What does this mean for the future of attrition?        We still need to wait at least 19 years for the attrition
21% in 2018-19, compared to the previous year’s 22%     Will we need another 17-year uninterrupted              rate to reach zero. This year’s attrition rate of 21%
(Johnson, 2020). Is this a firming of this downward     downward trend for the attrition rate to reach zero     was within the range predicted last year, between
trend? Since 1986, when IDRA started calculating        at the present speed of decline? IDRA conducted         20% and 27% (Montes, 2018).
the attrition rate on an annual basis, there have       this supplemental inquiry to the Texas high school
been only three uninterrupted downward trends.          attrition study. This article represents this year’s    The predictions for next year (2020), shown in the
                                                        update to the forecasting analysis with the most        chart below in green, are between 19% and 26%.
First, in the period 1987-1989, the attrition rate      recent attrition figures. This is the 12th time we      The chart first plots the attrition historic values
decreased to 31% from 34% in two years. Second,         performed this analysis. Note, the models do not        (green line, 1986-2019), followed by the forecasted
in the period 1997-2014 the rate nearly halved to       reflect the effects of COVID-19, which occurred         values (2020 to 2038) created by three forecasting
24% from 43% in 17 years. Third, the current trend,     after this analysis.                                    models. These prediction values kept the zero-
in the period 2016-2019, the rate moved from 25%                                                                attrition year at 2038. The overall picture did not
to 21% – the lowest value ever calculated by the        Forecasting Summary                                     change. The span was reduced by one year, as time
IDRA annual study.                                      The forecasting analysis, depicted in the chart         moved from 2018 to 2019, while the zero-attrition
                                                        below, shows that although the downward trend           year remained the same (2038).
                                                        continued, the long-term prospect did not change.

  Historic Attrition Rates and Next Year Forecasted Attrition Rates
                                                                                                               downward trend periods

                                     Historic Attrition Rates

                                                                                                                               Historic Forecast Model

                                                                                      Contemporary Forecast Model                                 Medium
                                                                                                                                                     Forecast
                                                                                                                                                          Model

 Intercultural Development Research Association, 2021

  Fe b r u a r y 2 0 2 1                                          Te x a s P u b l i c S c h o o l A t t r i t i o n S t u d y , 2 0 1 8 - 1 9                     17
Intercultural Development Research Association
Forecast Analysis
Universal high school graduation
is two decades away
Texas has lost 3.9 million students since 1986.
We stand to lose another 2.1 million students.
Intercultural Development Research Association, 2021
Forecasting Models values. The medium model predicts the attrition
The forecasting analysis uses three models. The rate to first revert to 23% in 2020, then resume the
first model, Historic Forecast Model, includes all downward trend, and after 19 years, be 9%. The
known attrition values, from 1986 to the present, chart on Page 17 depicts this model in orange.
as determined by the annual IDRA longitudinal
attrition studies. This model assumes that each The three models complement each other. The
past rate has an equal weight over future rates. contemporary model is useful for predictions that
This model constructs the current 21% rate as a assume systematic changes, such as the existence
cyclical bottom within the long-term progression of dropout prevention programs in a significant
of the curve. Therefore, it anticipates an upward number of schools. The historic model provides
reversal. In this formulation, the attrition rate a long-term view. Absent of some fundamental
would increase to 26% in 2020. After that, it changes, history tends to repeat itself. The medium
would begin a slow decline, initiating another model is useful for medium-term predictions and
downward trend. In this model, after 19 years, tries to bridge the gap between the contemporary
the attrition rate would be 18%. The chart on and the historic models.
Page 17 depicts this model in blue.
The second model takes the downward trend
started in 1997 as a more reasonable predictor
of future attrition values. The fact that these are
The forecast trend for when
chronologically the most recent values supports Texas will reach zero attrition
this assumption. The recent past is often more
relevant to the present than the distant past.
is moving further away
Consequently, this Contemporary Forecast
Model used the values corresponding to the
years 1997 to present. This model predicts a
19% attrition rate for 2020, which is two points
below the current attrition rate. After that, the
attrition rate will progressively decrease by one
or two points annually until it will reach zero in
the year 2038. The chart on Page 17 depicts this
model in pink.
The third model takes a centrist approach
between the historic and contemporary models.
This Medium Forecast Model derives its
values by calculating the medians between the
corresponding pairs of the previous two models’
Intercultural Development Research Association, 2021
Fe b r u a r y 2 0 2 1 Te x a s P u b l i c S c h o o l A t t r i t i o n S t u d y , 2 0 1 8 - 1 9 18Intercultural Development Research Association
Forecast Analysis
Forecasted Numbers of Students Lost to Attrition At the current pace,
Period Statistical Models we will not reach a
Historic Medium Contemporary zero attrition rate
2019-24 570,565 481,239 391,914 until 2038.
2025-29 553,819 420,025 286,232
2030-34 531,683 349,142 166,601
2035-38 405,786 221,780 37,775
Total 2,061,852 1,472,187 882,522
Intercultural Development Research Association, 2021
Best Fit rate reinstated the contemporary model as the best
The exhibit below shows the performance of the fit, with a residual of just -1 in the last two years. In
three models through the 12-year application. The addition, the long-term absolute mean residual for
exhibit lists the forecasted value and its residual this model continued to be the lowest, 1.5 points
– the difference between the forecasted and the (compared to 3.2 and 6.5).
actual values – for each model, annually. Smallest
Because the contemporary model is the best fit
residuals correspond to models that best fit the data.
overall, we used it to forecast the year when the
The last row, year 2019-20, shows the current attrition rate would reach zero, listed in the last
predicted values for the three models and the column of the exhibit below, along with the number
long-term absolute mean residual for each model. of years (N) it would take. The contemporary
Initially, the contemporary model, with residuals model puts the attrition rate in single digits in the
between zero and two, was the best fit for the data, early 2030’s. The rate will progressively decrease
suggesting a continuous downward trend. thereafter and reach zero in 2038.
But, in years 2015-16 and 2016-17, this model It is essential to keep in mind that the contemporary
undershot by 3 and 2 points (a difference of -3 and model is the best fit for now. Since there isn’t a clearly
-2, respectively), and the medium model missed the discernible cause for a sustained attrition decrease,
actual value by just one point in both years. This the current trend might prove to be cyclical, as the
placed the medium model as the best fit for this other models suggest.
period. However, the most recent actual attrition
Forecasted Model Values and Residuals
School Attrition Historic Model Medium Model Contemporary Model Years to Zero Rate
Year Rate Values Residuals Values Residuals Values Residuals Year N
2008-09 31 39 8 35 4 32 1 2044 36
2009-10 29 36 7 33 4 31 2 2042 33
2010-11 27 34 7 32 5 29 2 2040 30
2011-12 26 33 7 30 4 27 1 2037 26
2012-13 25 32 7 29 4 26 1 2037 25
2013-14 24 31 7 28 4 25 1 2036 23
2014-15 24 31 7 27 3 24 0 2035 21
2015-16 25 30 5 26 1 22 -3 2035 20
2016-17 24 29 5 25 1 22 -2 2036 20
2017-18 22 28 6 24 2 21 -1 2037 20
2018-19 21 27 6 24 3 20 -1 2038 20
2019-20 N/A 26 6.5 23 3.2 19 1.5 2038 19
Intercultural Development Research Association, 2021
Fe b r u a r y 2 0 2 1 Te x a s P u b l i c S c h o o l A t t r i t i o n S t u d y , 2 0 1 8 - 1 9 19Intercultural Development Research Association
Forecast Analysis
Zero-Attrition Year will reach zero in the year 2038. However, from
The “Years to Zero Rate” column in the lower now to that point, we would have lost nearly one
table on Page 19 shows the years the contemporary million (0.88 million) students to attrition. We should expect to
model predicted attrition would reach zero for the • Over the medium term, one model suggests that
lose between 0.88
12 forecasting runs. We plotted these forecasted the current attrition rate will increase to 23% million and 2.06 million
zero-attrition years in the chart on Page 18 to gain before resuming its downward trend. In this additional students
further insights about the most likely year schools scenario, by the year 2038, attrition will be 9%, to attrition before we
will stop regularly losing students to attrition. and during these 19 years, we would have lost
more than 1.47 million students.
reach a zero attrition,
In the early forecasting years (2008 to 2011), the unless this issue is
• While the attrition rate has decreased markedly
attrition rate dropped relatively fast, from 31% to
from the values (in the 40% range) of the
considered seriously
26% in three years. As a result, the predicted zero-
attrition year also dropped relatively quickly, from 1990s, the rate of decrease needs to accelerate by policymakers and
2044 to 2042 to 2040 to 2038. After that period, the for us to attain a breakthrough. If the attrition systemic changes
attrition rate’s downward movement slowed down, rate continues to decrease by 1 or 2 points with implemented to
occasional reversals, the zero-attrition rate year
occasionally stopping or reverting.
will continue to be pushed into the future by
ameliorate the problem.
Consequently, the zero-attrition year also slowed one or two years annually and the nearly 20-year
down (2038 to 2037 to 2036 to 2035) and eventually barrier to achieve zero attrition will persist.
reverted (2035 to 2036 to 2037 to 2038). It is as if the Therefore, we should expect attrition rates in the
model distrusts the durability of these recent tepid range of 19% to 26%, for the next few years. We
downward moves. As a result, the predicted zero- should also expect to lose between 0.88 million and
attrition year, for the second time, is back to when 2.06 million additional students to attrition before
it was at the end of the first more rapid downward we reach a zero attrition, forecasted under the most
trend, the year 2038. For the zero-attrition year to optimistic scenario, unless this issue is considered
be significantly closer, the attrition rate’s downward seriously by policymakers and systemic changes
trend needs to be firmer. implemented to ameliorate the problem.
Forecasted Student Losses Resources
To understand the severity of the situation, we used Johnson, R. (2020). “Lowest-Ever High School Attrition Rate
in Texas,” Texas Public School Attrition Study 2018-19.
the updated three forecast models to estimate the San Antonio, Texas: Intercultural Development Research
number of students to be lost to attrition before the Association.
Montes, F. (2018). “Attrition Rate Reached Lowest Value but
contemporary model predicted rate reaches zero
Trend Needs to Quicken to Make a Difference,” Texas
(see top table on Page 19). Public School Attrition Study 2017-18. San Antonio, Texas:
Intercultural Development Research Association.
The historic forecast model predicts a loss of more
than 2 million students for the next two decades. Retired in December 2019, Felix Montes, Ph.D., was an IDRA
research associate. Comments and questions may be directed to
The contemporary model yielded a figure of nearly Roy L. Johnson, M.S., IDRA Director of Evaluation, via e-mail
1 million (0.88 million), and the medium forecast at roy.johnson@idra.org.
model more than 1.47 million students.
Conclusions
• If we take the full historic values as a guide,
the student dropout rate should be expected
to increase to 26% next year and then remain
between 18% and 25% for the foreseeable
future. Under this scenario, more than 2 million
additional students will be lost to attrition by the
year 2038.
• If we assume that the current downward trend
is real, the result of systemic changes, next year
attrition would drop two additional points to 19%.
After that, the attrition rate will continue to drop,
reaching single digit values in the early 2030s.
By 2033, the attrition rate will be about 5% and it
Fe b r u a r y 2 0 2 1 Te x a s P u b l i c S c h o o l A t t r i t i o n S t u d y , 2 0 1 8 - 1 9 20Intercultural Development Research Association
See this infographic online and share! https://idra.news/Attrition19
Fe b r u a r y 2 0 2 1 Te x a s P u b l i c S c h o o l A t t r i t i o n S t u d y , 2 0 1 8 - 1 9 21Intercultural Development Research Association
Timeline
Life and Times of
the Class of 2019
What happened as the Texas
Class of 2019 progressed through school?
0 2
When children in the Class of 2019
were only toddlers, the No Child Left
Behind Act went into effect. As we
look at their attrition rates by the
time they would become high school
seniors, we pieced together a sense
of the history these young people
1
may have experienced.
For example, during their school
years, there was an increase in
charter schools, and a number of
affluent children never saw a public 9/11
3
school classroom. The Class of 2019 One of the most defining national
moments of the 21st century
was more segregated by income occurred when the children in the
and race/ethnicity than many Class of 2019 were only 1 year old
classes that came before it. The on September 11, 2001. Almost
3,000 people were killed during the
changing nature of education with 9/11 terror attacks, triggering major
technology and the new phenomenon U.S. initiatives to combat terrorism.
Although these attacks did not
of cyberbullying also were notable
happen in Texas, students in the
since these kids have mostly known Class of 2019 grew up in a country
technology as user-friendly and as at war. Many students living in areas
with military bases were personally
oriented toward social media and affected either in their own families
gaming from the start. or those of their friends.
Homeschooling
Prior to the Class of
2019 entering preschool,
homeschooling in Texas
began to rise. The number
2.2% of homeschooled students
increased from 850,000
(1.7%) in 1999 to 1,096,000
(2.2%) in 2003.
2000-01 2001-02 2002-03 2003-04
Fe b r u a r y 2 0 2 1 Te x a s P u b l i c S c h o o l A t t r i t i o n S t u d y , 2 0 1 8 - 1 9 22You can also read