Generational change in home purchase opportunity in Australia
←
→
Page content transcription
If your browser does not render page correctly, please read the page content below
Generational change in
home purchase
opportunity in Australia
authored by
Terry Burke, Wendy Stone and Liss Ralston

for the
Australian Housing and Urban
Research Institute
at Swinburne University of Technology

November 2014

AHURI Final Report No. 232
ISSN: 1834-7223
ISBN: 978-1-922075-65-9
Authors              Burke, Terry             Swinburne University of Technology
                     Stone, Wendy             Swinburne University of Technology
                     Ralston, Liss            Swinburne University of Technology
Title                Generational change in home purchase opportunity in Australia
ISBN                 978-1-922075-65-9
Format               PDF
                     Home purchase, housing affordability, housing opportunity,
Key words
                     generation y housing
Editor               Anne Badenhorst               AHURI National Office
                     Australian Housing and Urban Research Institute
Publisher
                     Melbourne, Australia
Series               AHURI Final Report; no. 232
ISSN                 1834-7223
                     Burke, T., Stone, W. and Ralston, L. (2014) Generational
                     change in home purchase opportunity in Australia, AHURI
                     Final Report No.232. Melbourne: Australian Housing and
Preferred citation
                     Urban Research Institute. Available from:
                     .
                     [Add the date that you accessed this report: DD MM YYYY].

                                                                                     i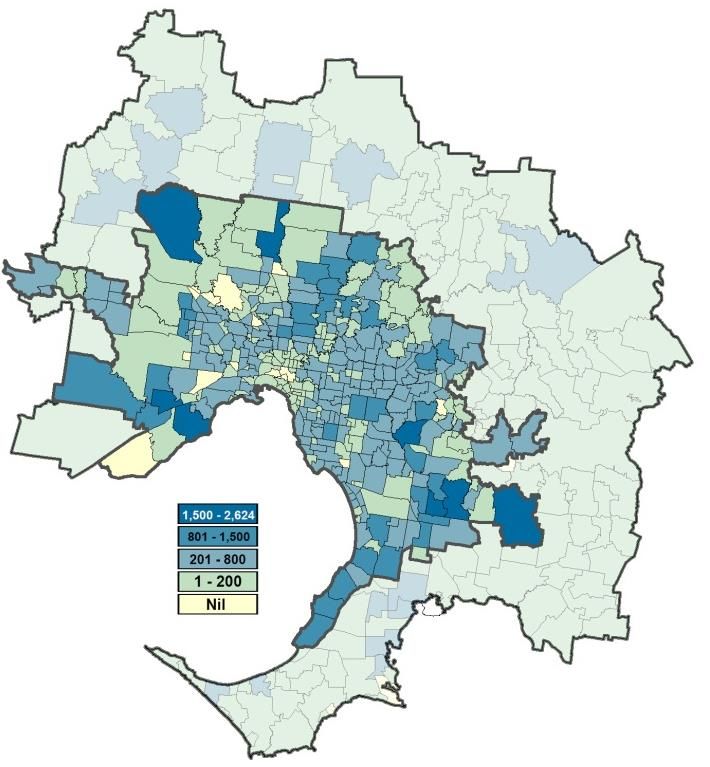
ACKNOWLEDGEMENTS
This material was produced with funding from the Australian Government and the
Australian state and territory governments. AHURI Limited gratefully acknowledges
the financial and other support it has received from these governments, without which
this work would not have been possible.
AHURI comprises a network of university Research Centres across Australia.
Research Centre contributions, both financial and in-kind, have made the completion
of this report possible.

DISCLAIMER
AHURI Limited is an independent, non-political body which has supported this project
as part of its program of research into housing and urban development, which it hopes
will be of value to policy-makers, researchers, industry and communities. The opinions
in this publication reflect the views of the authors and do not necessarily reflect those
of AHURI Limited, its Board or its funding organisations. No responsibility is accepted
by AHURI Limited or its Board or its funders for the accuracy or omission of any
statement, opinion, advice or information in this publication.

AHURI FINAL REPORT SERIES
AHURI Final Reports is a refereed series presenting the results of original research to
a diverse readership of policy-makers, researchers and practitioners.

PEER REVIEW STATEMENT
An objective assessment of all reports published in the AHURI Final Report Series by
carefully selected experts in the field ensures that material of the highest quality is
published. The AHURI Final Report Series employs a double-blind peer review of the
full Final Report where anonymity is strictly observed between authors and referees.

                                                                                       ii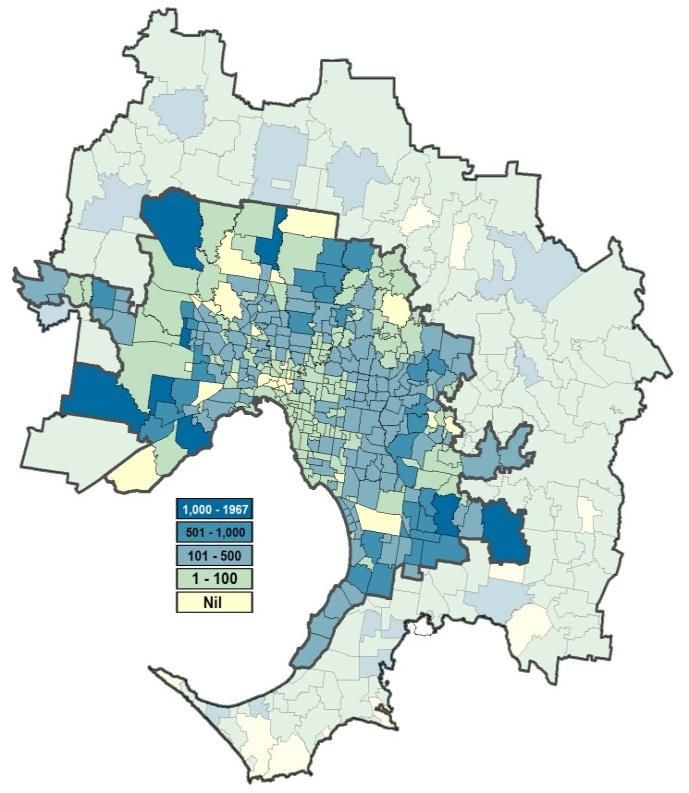
CONTENTS
LIST OF TABLES ....................................................................................................... IV
LIST OF FIGURES ...................................................................................................... V
ACRONYMS ............................................................................................................... VI
EXECUTIVE SUMMARY .............................................................................................. 1
1   INTRODUCTION ................................................................................................. 4
2       METHODOLOGY ................................................................................................ 7
2.1     Burden of risk ....................................................................................................... 8
3       CONTEXT.......................................................................................................... 10
3.1     Affordability ........................................................................................................ 11
3.2     Demography ...................................................................................................... 15
3.3     Urban restructuring and changed housing markets ............................................ 16
3.4     Housing policy.................................................................................................... 18
4       FINDINGS.......................................................................................................... 21
4.1     Patterns of change ............................................................................................. 21
      4.1.1 Trends since 1981 .................................................................................... 21
      4.1.2 Locational variation ................................................................................... 23
      4.1.3 The impact of socio-economic background ............................................... 24
      4.1.4 Household type ......................................................................................... 26
4.2     Resilience in the face of hardship: adaptation to affordability pressures ............. 28
      4.2.1 Housing debt............................................................................................. 28
      4.2.2 Dual income formation .............................................................................. 31
      4.2.3 Deferring, not rejecting purchase .............................................................. 32
      4.2.4 Keeping up the dream via multi-unit purchase .......................................... 36
      4.2.5 Importing home ownership: the role of migration ....................................... 37
      4.2.6 'Honey, I gave up the baby for a house': delayed and foregone
            childrearing ............................................................................................... 38
      4.2.7 The fringe dwellers: purchasing on the urban fringe .................................. 39
      4.2.8 Rent to buy, the Australian way................................................................. 42
   4.2.9 Keeping it in the family .............................................................................. 42
5   CONCLUSION ................................................................................................... 43
REFERENCES ........................................................................................................... 45
APPENDICES ............................................................................................................. 49
Appendix 1: Methods .................................................................................................. 49
Appendix 2: budget standard ...................................................................................... 50

                                                                                                                             iii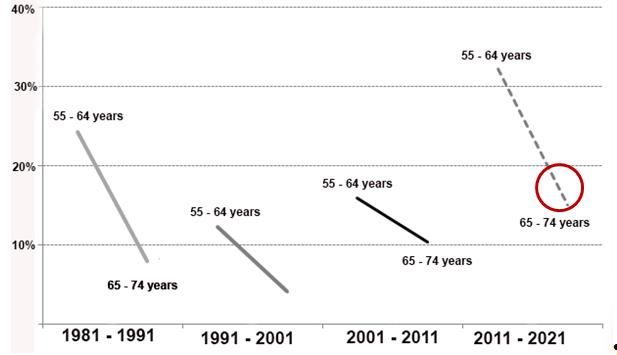
LIST OF TABLES
Table 1: Housing tenure of Australian households, 2001–2011, Census and SIH
    validification, percentage of all households .......................................................... 8
Table 2: Labour force participation rates among married women aged 20–44, 1971–
    2011 ................................................................................................................... 15
Table 3: Australia’s first home owner and eEconomic boost grants, 2000–2011 ....... 19
Table 4: Home ownership rates, by age cohorts, 1981–2011 .................................... 21
Table 5: Home purchase by household type, 1981–2011 .......................................... 27
Table 6: Number and percentage of purchasing households with residual income
    affordability problem; all households and lowest 40 per cent of income earners,
    Australia, 2011–12 ............................................................................................. 29
Table 7: Number and percentage of purchasing households with residual income
    affordability problem, all households by household type, Australia, 2011–12 ..... 30
Table 8: Purchase patterns, various cohorts, showing debt across the life course .... 34
Table 9: Purchasers by first-home buyer and change-over buyer, Australia, 2011–12
    in the previous three years ................................................................................. 35
Table 10: Home ownership by age cohort by dwelling type, 1981–2011 ................... 36
Table 11: Home purchase and outright ownership rates of key migrant groups, 1991–
    2011 ................................................................................................................... 37
Table 12: Percentage of parenting households (purchasers), 1981–2011, Australia . 39

                                                                                                                            iv
LIST OF FIGURES
Figure 1: Home ownership rates for Australian households, 1976–2011 ..................... 5
Figure 2: Established house prices compared to household disposable income,
Australia, 1986–2011. Nominal data .................................................................. 12
Figure 3: Ratio of owner occupied Housing debt to annualised household disposable
income1981–2012 ............................................................................................. 13
Figure 4: Mortgage interest rates and unemployment rates, Australia, 1981–2013 ... 13
Figure 5: Commonwealth Bank Index of affordability, Australia, 1985–2013 ............. 14
Figure 6: Median house prices in Melbourne corridor, 1981 and 2011 ...................... 18
Figure 7: First home purchases: number of dwellings financed and percentage of all
dwellings financed, Australia, 1991–2013 .......................................................... 20
Figure 8: Home purchase rates, Australian cities, 1991–2011, 25–34 year-olds ....... 24
Figure 9: Home purchase rates, Australian cities, 1991–2011, 35–44 year-olds ....... 24
Figure 10: 25–34 age cohort home purchase rates by income quintile, 1981–2011 .. 25
Figure 11: 35–44 age cohort home purchase rates by income quintile, 1981–2011 .. 25
Figure 12: 45–54 age cohort home purchase rates by income quintile, 1981–2011 .. 26
Figure 13: Percentage in outright ownership, 55–64 year-olds, 1981–2011 .............. 26
Figure 14: Median mortgage as percentage of median household income, 1981–2011
.......................................................................................................................... 29
Figure 15: Percentage of purchasing households that are dual or single-income
households, 25–34 and 35–44 year-olds, 1981–2011 ........................................ 32
Figure 16: Home purchase rates by age cohort over time. Generation of 1981,1991
and 2001 ............................................................................................................ 33
Figure 17: Home purchase rates by decade movements, 1981–1991, 1991–2001,
2001–2011, 2011–2021 ..................................................................................... 35
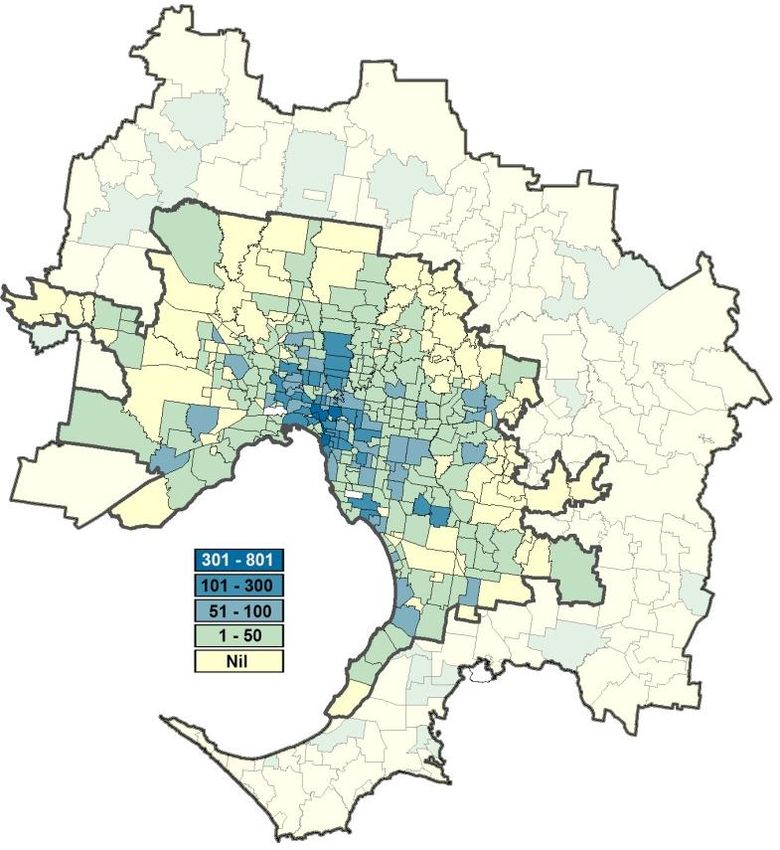
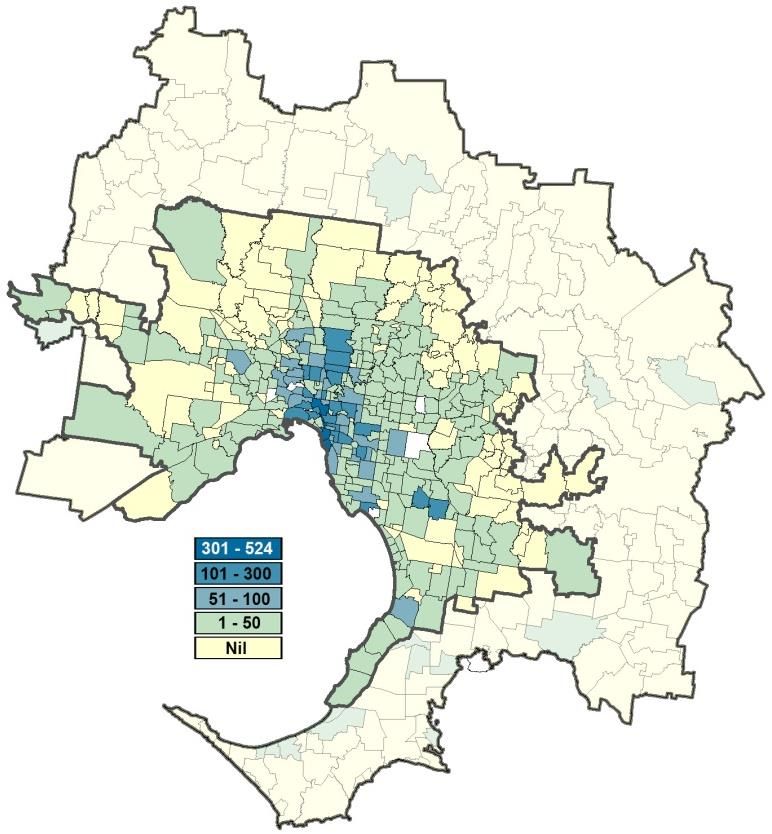
Figure 18: Location of home purchasers, Melbourne urban area, detached houses
and flats, 2011 ................................................................................................... 40
v
ACRONYMS
ABS        Australian Bureau of Statistics
AHURI      Australian Housing and Urban Research Institute Limited
AIFS       Australian Institute of Family Studies
CURF       Confidentialised Record File
FHOB       First Home Owner Boost
FHOG       First Home Owner’s Grant
GFC        Global Financial Crisis
GST        Goods and Services Tax
HES        Household Expenditure Survey
HIA        Housing Industry Association
NATSEM     National Centre for Social and Economic Modelling
NHSC       National Housing Supply Council
RBA        Reserve Bank of Australia
REIA       Real Estate Institute of Australia
SIH        Survey of Income and Housing

                                                                     vi
EXECUTIVE SUMMARY
There has been considerable media exposure in recent years to the contracting opportunities
for younger people to become home owners, just as there was at the turn of the millennium.
Rising dwelling prices were a problem then as they are now. The language of crisis often
flavours such writing, with commentary linking the problematic housing future of the young with
the more favourable environment faced by their parents, the baby boomers. This short report is
designed to provide current evidence around the topic, with the particular research objectives
of identifying:
1. The degree to which younger households, particularly the cohorts aged 25–44 years, have
experienced a contraction in home purchase over the last 30 years.
2. The adaptive responses this generation has made to circumvent obstacles to ownership,
particularly that of declining housing affordability.
3. Which younger households have been most disadvantaged in terms of home purchase
opportunity—and whether factors such as income and household type, have been
influential in this regard.
This paper is a quantitative study and relies for its findings on 30 years of Australian Bureau of
Statistics (ABS) data, most notably from the census. The methodological approach and related
issues are discussed in Chapter 2.
Context
Chapter 3 reviews the changes in the economic, social and policy context over the last 30
years and argues that these changes have created circumstances in which the ability to
purchase became more constrained over this period. Affordability has worsened considerably,
although factors influencing the changes in affordability are complex and declining affordability
is not simply due to a continuing increase in dwelling prices in relation to household income.
Findings
A key finding of the report is that, for younger households, there has been decline in home
ownership over the 30 years between 1981 and 2011 (from 61.4% to 48.4% for 25–34 year-
olds and from 74.3% to 65.3% for 35–44 year-olds).
However, much of this decline was in the decade 1981–91, and contraction since then (when
affordability has been much worse) has been somewhat less. Purchase rates, as distinct from
outright ownership, have actually increased since 1991 (by 4.3% for 25–34 year-olds and
12.7% for those aged 35–44). What has changed the most has been the ability to achieve
outright ownership at an early age, which has decreased markedly. The problem in drawing
any conclusions from this is complicated by the changed nature of the mortgage instrument
over this period. Prior to the mid-1980s a mortgage could only be used for dwelling purchase.
But subsequent to deregulation in the mid-1980s finance institutions developed new mortgage
products and become more flexible in lending conditions. This meant a mortgage could also be
used to finance a car, white goods, a rental property or even to pay private school fees. So one
of the factors contributing to increased purchase rates and contracting rates of outright
ownership is that households were increasingly paying off more than just a dwelling, and were
effectively using the housing loan as a form of cheap finance—most notably so in the 2000s
when interest rates fell.
While purchase rates since 1991 have held up (in part for the reason above), it is clear the
context has not been kind to certain types of younger households. Single-income households
and low to moderate-income households are being progressively pushed out of the home
purchase market. Whereas in 1981 the home purchase market was almost split 50-50 between
single and dual-income households, by 2011 over 80 per cent were dual-income households
1and this was the case for both age cohorts. Not quite as dramatic, but still substantial, has
been the fall in the ability of low to moderate-income households to purchase. In 1981, among
25–34 year-olds, over 60 per cent of households in both the lowest and second lowest
household income quintiles were purchasers. By 2011 the purchase rate was down to just over
30 per cent for the lowest quintile and just over 40 per cent for the second lowest quintile. For
the 35–44 age cohort the decline in rate of purchase was not as great, but still dropped by
some 15 percentage points for the lowest income quintile (and about 5% for the second
lowest). Like other markets, such as the labour market, the home purchase market is becoming
a mechanism for reinforcing inequality: lower and single-income households are being locked
out of the opportunities for wealth building and secure occupancy that has historically been
offered by home ownership.
Adaptive responses
In principle, given the context, the decline in home purchase should have been much worse
(and more in keeping with the ‘crisis’ image presented in the media). In reality it has arguably
held up much better than expected given the major declines in affordability. In Chapter 3, the
concept of ‘resilience via adaptation’ is used to explain how the value of home ownership is so
strong in Australia that there appears to be considerable resilience in the tenure, with
households responding in various adaptive ways to achieve purchases in the face of quite
difficult barriers. Potential adaptive responses discussed and empirically tested in the report
include:
Borrowing more. Historically, up to the mid-1980s, there was a tendency for households to
rarely borrow more than a quarter of household income, a process reinforced by more
restrictive regulation on finance providers. Post deregulation, households could borrow more
(in some cases up to 100% of dwelling value) and that has certainly been a major response.
Whereas in 1981 the median mortgage for the 25–34 age group was 16.7 per cent of
household income, by 2011 it was 26.8 per cent and for the 35–44 age group the figures were
12.5 per cent and 25.2 per cent respectively. The 2011 figures are quite remarkable, indicating
that the median mortgage to household income ratio is actually higher than the 25 per cent
affordability benchmark, a level thought to be one where there is housing stress.
Dual income formation. As the large change in the proportion of dual-income relative to single-
income households suggests, one way of purchasing is to form a dual income household or, if
already a dual income household, to remain one when that may not have been the intention.
By 2011 this had become a necessity for most households.
Home purchase deferral. Households may not cease purchase altogether but simply defer
purchase to a later time, when household circumstances enable it. The four census years
provide a limited time series cohort analysis by analysing what happens to the 25–34 cohort in
the next 10-year period and so on for each cohort. This analysis does suggest that home
purchase deferral is an adaptive strategy.
Deferring or not having children. Having children is expensive and so is home purchase. If one
prevents the other, hard decisions may have to be made, with some households deferring or
deciding not to have children in order to purchase a dwelling. The analysis in Section 4.2.6,
however, suggests that this has not been one of the adaptive responses as the trend in the
number of children of purchaser households appears to be more linked with those of changing
fertility rates than any housing trends.
Purchasing a different product, that is flats and townhouses. Historically, Australians have
preferred to purchase detached dwellings rather than flats or apartments, which were typically
bought by investors for rental. Flats and apartments tend to be a cheaper form of
accommodation, so another way to become a home purchaser is to acquire such
accommodation. Section 4.2.4 provides clear evidence that a large proportion of younger
people were able to achieve ownership through purchasing a flat or apartment. In 1981, of
2those who were purchasing, 93.4 per cent of 25–34 year-olds were buying a house, but by
2011 this had fallen to 78.8 per cent. For the other age group, 34–45 year-olds, the
comparable figures were 94.8 per cent in 1981, down to 87.2 per cent in 2011. Whether this
switch in consumption patterns was a response to affordability versus lifestyle decisions cannot
be concluded, but whatever the reason it has had the effect of helping to maintain home
ownership rates in the face of affordability pressures.
Importing ownership. Another way in which tenure can be influenced is through migration. For
example, potential home purchase decline may be countered if there is an intake of more
migrants from societies with a home ownership culture, and where there may be access to the
resources of extended family and pre-existing wealth if a business migrant, for example
Chinese and Indian households. But, as outlined in Section 4.2.5, the evidence about this
effect in Australia is to the contrary. Whereas in the 1950s to 1980s migrants had higher rates
of home purchase than the Australian born, the three largest recent migrant groups as of 2011
(Chinese, Indian and New Zealander) all had purchase rates below the Australian born. They
were, in effect, a drag on the purchase rate, not an accelerator.
Moving to more affordable locations. There are always cheaper housing submarkets in which
to purchase and thus some households may purchase in locations which previously were not
part of their awareness space. The evidence, although based on Melbourne only, is that young
purchasers are moving to outer and fringe suburbs.
There are two other potential adaptive responses: inter-generational assistance through either
direct purchase, provision of loans or acting as guarantor, or inheritance upon death; and
renting at the same time as purchasing a rental property so that some form of property equity
can be achieved, with the hope this enables transition into ownership at a later date. In the
absence of relevant Census data, neither of these responses are able to be tested empirically
in the current analyses. References to further reading are however provided.
Conclusions
The statistical evidence would suggest that some of the populist commentary on the decline of
home ownership, particularly for younger households, is premature. Despite decline, the bulk
of which was in the 1980s, home ownership rates have held up better than might have been
expected.
The reason for this can be found in a set of adaptive responses that, in combination, have
enabled the purchase rates to be greater than they may otherwise have been. This is not a
result to be sanguine about however: we have to acknowledge that the rate of overall
ownership is in slow decline. But, perhaps more importantly, the adaptive responses have their
own, and potentially significant, problems. These are:
High levels of debt with unknown implications for family and personal relations.
Risk of arrears problem if any economic downturn.
Carriage of debt into retirement years causing major affordability problems and putting
pressures on income support systems.
Concentration of first home buyers (mainly families) in outer urban areas of poor
infrastructure and weak labour market access.
Equity implications of those households increasingly locked out of ownership (single and
lower income households).
In 1976 British housing expert David Donnison pointed out that ‘Australians are among the best
housed people in the world and they are perhaps the most equally housed’ (Donnison 1976,
p.21). Given the direction that home purchase is taking in Australia today, any visiting housing
expert could no longer come to the same conclusion. Home purchase today is fraught with
problems, both for households and potentially for the wider economy and society.
31 INTRODUCTION
Each housing market boom, such as the one of late 2013 to early 2014, prompts considerable
media reporting on the difficulties faced by younger households seeking to buy a home. Some
of this media coverage has tended to be quite acrimonious, with younger generations blaming
baby boomers for their plight and older generations saying younger people are just unwilling to
make the compromises that previous generations have made.
Headlines such as Young buyers find home owning dream a nightmare to fund in the Sydney
Morning Herald (Johanson, 16 November 2013) ‘Hey mum, Can I have the keys to the house?’
in the Sydney Morning Herald (Elder, 6 July 2013), and ‘Great Australian home ownership
dream becomes a fantasy’ in The Guardian (Jericho, 25 November 2013) imply a crisis
situation, signalling a major social change and a threat to one of the core values—the goal of
home ownership—that underpin social relations in Australia.
But interest in, and concern about, the ownership opportunities for younger households wax
and wane. The late 1990s and early 2000s was another such period, when similarly
provocative headlines were accompanied by an upsurge in research and policy inquiry. By
contrast the more recent attention given to the topic has not as yet generated the same amount
of substantive research although there have been some important contributions. This short
report is designed to provide current evidence around the topic, with the particular research
objectives of identifying:
1. The degree to which younger households, particularly the cohorts aged 25–44 years, have
experienced a contraction in home purchase over the last 30 years.
2. The adaptive responses this generation has made to circumvent obstacles to ownership,
particularly that of declining housing affordability.
3. Which younger households have been most disadvantaged in terms of home purchase
opportunity—and whether factors such as income and household type have been influential
in this regard.
The age cohorts comprising 25–44 year-olds do not fit neatly into either of the commonly
accepted age labels or brands, notably Gen X or Gen Y, but actually embrace both. Gen X are
understood to be those born between 1963 and 1980, now aged from their early 30s to 40s,
while Gen Y are those born between 1981 and 1994 and now aged 20 to their early 30s. Thus
these terms are not used here, and we will report on the age cohorts 25–44 under the simple
and non-pejorative title ‘younger households’.
Despite concern about the capacity of younger households to achieve ownership and the belief
that declining affordability has constrained their opportunities to purchase, an initial impression
from looking at broad national data is that this problem may have been overstated. Figure 1
below charts the changes in the overall ownership rate, further disaggregated into outright
ownership and home purchase, for Australia from 1976 to 2011. Equivalent data is not
available before this period.
4Figure 1: Home ownership rates for Australian households, 1976–2011
Source: ABS Census, unit record files, selected years
There is a remarkably stable rate of ownership overall, falling only slightly from 68.4 per cent in
1976 to 67.0 per cent in 2011. In terms of purchasing, as distinct from outright ownership, the
decline has been even smaller, from 35.8 per cent in 1976 to 34.9 per cent in 2011. There was,
however, a large dip in this rate of purchasing between 1976 and 1996, although it lifted again
thereafter, and by 2011 returning to levels much as they were in 1976. If younger households
were unable to access purchase, why has the overall purchase rate shown such resilience?
And, just as puzzling, the return to higher rates of purchase has occurred in the period when
affordability problems were most severe. What has been going on?
A decline in home purchase opportunity in Australia has been a concern for over two decades.
Neutze and Kendig (1991), drawing from a national life history survey carried out in 1986–87,
argued that their findings suggested that access to home ownership in the future would be
increasingly limited to young adults having high household incomes. A number of studies in the
early 2000s seemed to indicate that Neutze and Kendig's prediction had partial substance,
although the studies were often contradictory, with inconsistent findings (Productivity
Commission 2004, pp.32–34; Yates 1999; Mudd et al. 2001). There was some evidence that
among younger age cohorts home ownership rates had fallen, but the degree to which that
was the case depended on the data sources used (see further discussion in Chapter 2). There
was also debate as to whether the falls in rates of home ownership were a response to housing
market conditions, notably declining affordability, or simply reflected broader social and
demographic trends. Baxter and Macdonald (2004) and Mudd et al. (2001) argued, for
example, any apparent decline in ownership rates merely represented a deferral of purchase,
largely related to demographic changes.
These various studies were based on large ABS data sets including the census, and are now
more than a decade old, in some cases older. There have been few subsequent studies
looking at tenure trends among younger households. Beer and Faulkner (2009), analysing a
much smaller purpose-designed survey (and therefore not comparable with the larger ABS
data sets) found little evidence of a contraction in the ownership rate of younger households.
However, a chart prepared by Yates in Eslake (2013, Chart 5), which was updated to include
2011 census data, did reveal a marked decline in ownership rates among younger households
compared to earlier decades (showing a drop of more than 10% between 1981 and 2011). But
these studies have not made any distinction between purchasing and outright ownership. Nor
5has there been any attempt to identify who, among younger households, was or was not failing
to achieve the dream of home ownership. There have also been important contributions on the
future of home ownership (Wood & Ong 2012) where issues of younger household opportunity
are discussed but without any data details. This short report is intended to both update the
earlier studies and to add more detail.
The report begins with a description of the methodology adopted for the analysis of the data
(Chapter 2) and moves on to a discussion of the broad context in which home purchase
decisions have been made over the last 30 years (Chapter 3). This includes a brief overview of
the key organising concept, that of ‘resilience through adaptation’. The section examines the
hypothesis that declining affordability has created the potential for a weakening in levels of
home ownership among 25 to 44 age cohorts. But after reviewing the economic, demographic
and social contexts impacting on home purchase, it can be argued that the affordability barrier
to ownership may not be as substantial as it first appears. Various adaptive behaviours may
have enabled many households to circumvent this barrier. Chapter 4 then looks at the results
of the analyses to see whether the evidence confirms or contradicts this hypothesis, while
Chapter 5 draws out the implications.
62 METHODOLOGY
Data for this study are taken from Australian Bureau of Statistics (ABS) sources. These
sources can vary in their estimates of the same variable—in the current case, that of housing
tenure—because of differences in data definition, collection methods, including how questions
around tenure are asked, and sample size.
The Census of population and housing is the longest established source of data on tenure, and
has the advantages of both relatively good consistency over time and availability on a spatial
basis. A weakness is that in the census some households do not complete all the questions,
and ownership may be under-reported compared to other ABS surveys where more rigorous
questions are asked. However, this characteristic is consistent over time, meaning that trend
data on tenure from the census does not suffer from survey design bias. More problematic, as
noted by Baxter and Macdonald (2004, pp.2–3), is that the census question asked on tenure
changed slightly in 1991, so that respondents may have reported differently since then.
Nevertheless this was some time ago, and the questions were the same in 2001 and 2011.
Another problem with census data is that there is no distinction in the ‘purchasers’ category
between first and subsequent home buyers, making it difficult to estimate the barriers to first
home purchase using this data source.
Compared with the census, the Household Expenditure Survey (HES) and the Survey of
Income and Housing Survey (SIH), dating from the 1980s, have the advantage, via a broader
range of questions including those around first home purchase, of enabling more nuanced
analysis. However, unlike the census, the HES and SIH data are derived from samples of the
population, so that spatial analysis is very constrained and numbers related to any variable
much smaller. For more detailed discussion of differences between data sources and methods,
see Mudd et al. (2001), Baxter and Macdonald (2004) and Bessant and Johnson (2013).
One conclusion that might be drawn from these reports is that ABS survey data is limited in its
ability to tell us anything about the home purchase situations of young people as the story has
now become so complex that the data cannot convey that complexity. There are of course
limitations in surveys that are snapshots in time: for instance, they cannot capture the process
of people moving into and out of ownership, perhaps related to marital breakdown and/or re-
partnering. Such surveys do not give an adequate understanding of the reality of household
behaviour—for example, whether a decline in home ownership rates is a ‘real’ process or just
an artefact of the effect of growing relationship breakdown (Beer & Faulkner 2009).
However, we do not want to throw the baby out with the bathwater. While interpretation of ABS
data requires caution, the overall reliability of ABS census and other survey data such as HES
and SIH is much greater than probably all other surveys in Australia. Moreover the different
ABS surveys can be used to triangulate findings: results from each can be cross checked, so
that when there is consistency in findings there is a high degree of confidence in them. In
addition, access to unit record files enables more fine grained analyses, including the creation
of new variables to overcome issues such as data comparability. More importantly we can,
perhaps mistakenly, exaggerate the qualities of smaller scale purposive surveys or qualitative
research, which rarely ever have the response rates and representativeness of the ABS data.
Table 1 below provides an example of the triangulation of survey results, recording the tenure
patterns in 2001 and in 2011 derived from three sources: the Australian Census, the unit
record files of the census, and the unit record data of the Survey of Income and Housing (SIH).
A unit record file is a Confidentialised Record File (CURF) of ABS variables taken from a small
random sample of census or other survey data (typically 1%) of unidentified private
households, associated persons, and a small random sample of persons in non-private
dwellings. Unit record files allow for deeper data interrogation than standard ABS outputs.
7There are differences between the three data sources but all show the same general levels of
tenure, and the same directions of changes over time. We can therefore be confident that the
unit record data of the census and the SIH sample file are adequate for this research. The data
sources used in this analysis are also in unit record format, enabling detailed interrogation. In
this paper we will move between all three sources depending on the appropriateness of the
data to the research questions.
Table 1: Housing tenure of Australian households, 2001–2011, Census and SIH validification,
percentage of all households
1981 1991 2001 2011
Full Sample 1982 Full Sample 1990 Full Sample Full Sample
Census file SIH Census file SIH Census file SIH Census file SIH
Outright
33.2 33.4 38.3 41.1 39.9 42.2 41.7 41.8 40.2 31.1 30.9 30.9
owner
Purchaser 34.9 34.8 36.3 27.7 26.7 29.3 27.8 28.3 33.0 34.9 33.6 36.6
Home
68.1 68.2 74.6 68.8 66.6 71.5 69.5 70.1 73.2 67.0 64.5 67.4
owners
Source: ABS Census of population and housing, and ABS Survey of income and housing, 1981, 1991, 2001, 2011
One of the problems in all three data sets is that estimates of rates of ownership are for the
household reference person. This has two implications: in some cases the household
reference person may not be the actual home owner, and it does not allow for comparisons by
gender as men are much more likely to nominate as the head or reference person (Baxter &
McDonald 2004, p.3). If there is bias here it would be in the later census years where it would
be more likely, compared to the past, that more women would be home purchasers or outright
owners. If anything this could slightly understate ownership rates in more recent years, thus
reinforcing the story of resilience of home purchase, not undermining it.
A further issue is that, in the case of the 1981 census unit record files, there is no descriptor or
variable for the household reference person, and thus one had to be constructed from the
identifying attributes of the household. This may be the cause of some minor difference
compared with subsequent years. Other statistical issues to be confronted in the analyses
included the creation of equivalised income data; this is explained where relevant in the text or
the appendices.
Where there are only small percentage differences over time or between variables we
acknowledge it may be difficult to draw any conclusions from the data and we will not do so. In
this study we are therefore looking to identify and analyse any larger scale statistical changes
of the type that may be explained by changes in the economic, social and demographic context
and not just statistical constructs.
2.1 Burden of risk
Large scale shifts in economic and demographic stability and migration and settlement are
symptomatic of what some sociological commentators call a liquid modernity, or ‘risk society’ in
which the taken-for-granted pillars of society and private lives associated with previous eras
have been transformed.
The three decades following World War II was an unprecedented period of economic
prosperity. It was a period in which there was an unwritten social contract between citizens,
government and industry, with a shared economic and social purpose and with labour market
and housing market stability part of this contract. Citizens accepted the major social changes
that characterised the era and were rewarded by job security and the opportunity for home
ownership. It was an era of more regulated labour markets, financial markets and indeed
8housing markets, wherein the regulation, in part, contributed to economic stability, social
cohesion and relatively fair income distribution. By and large this informal social contract was
accepted by all players as rapid and stable economic growth meant all were happy with their
share. By the standards of subsequent decades it was a relatively risk free society.
Things began to change in the 1980s, with long-term repercussions. Economic growth slowed
in the second half of the seventies and inflation increased. The informal social contract
weakened and industry, government and citizens no longer shared a common interest to the
same degree.
A new neo liberal society emerged in which stability was replaced by risk. As a way of
regenerating economic growth it was believed the economy and society had to be deregulated,
and more freedom given to markets. Labour markets, financial markets, exchange rates,
international trade and urban planning were all progressively deregulated (Henderson 1995).
And the basis of public policy shifted away from principles of universalism to transferring
responsibility for welfare and security to the family, community and individuals at one level,
while increasing opportunity for investment and wealth gain at another.
For ordinary households these changes meant there was no longer job security, the workplace
became more casualised, and housing finance opened up not just for ownership but for
investment. For most individuals and households the future became more uncertain but for
others, principally higher income earners and those with existing wealth, it presented market
opportunities that hitherto had been limited by a more regulated environment.
Potential, and unintended, consequences of a risk society are to weaken the opportunities for
home ownership by affecting home purchase affordability (see Section 3.1) and also to weaken
employment opportunity and security, the latter likely to be important for getting a loan.
However, the overall impact of factors likely to affect the capacity of households to purchase a
home are not evenly distributed among the population, as both housing affordability and
employment opportunity differ spatially, socially and economically. Moreover, on top of the
impact of broad social processes, factors such as family formation or breakdown, good or bad
health and a range of other household specific issues can affect overall housing pathways and
ultimately the access to opportunity and good quality of life.
This study focuses on two age cohorts, 25–34 year-olds, and 35–44 year-olds. While
concentrating on these two age groups, other age groups will be considered where they throw
light on the situation of younger households, or if the issues faced by younger households are
transferred to older households at a later date. For example if, because of deferred ownership
among younger households, a much greater number and proportion of households are not
purchasers or still have a sizeable mortgage at the time of retirement, then Australia has a
problem: there will be major pressures on the income support system and/or substantial after
housing poverty. In this way, younger households may be seen as the canary in the coalmine,
with their circumstances acting as an early warning system for major income support and
housing affordability problems in Australia’s future.
93 CONTEXT
The research for this report is framed around the concept of ‘resilience via adaptation’. It is a
concept drawn from the broader resilience literature and is used here to capture the idea that,
in order to achieve ownership, households make adaptive responses to increasing affordability
barriers. Originally used to describe how ecological systems adapt to changing environmental
circumstances (Holling 1973; Longstaff 2009), resilience has become more widely applied as a
concept to explain how individuals and communities cope with difficult circumstances and
overcome adversity. For the purposes of this research paper, and consistent with popular
mythology, it can be argued that younger households encounter a context of adversity because
their home ownership opportunities have been severely reduced by the barrier of declining
affordability overlaid on other risk factors such as a casualised labour market; in short by the
emergence of a risk society.
Nevertheless, the desire for home ownership in Australia is so strong that there appears to be
considerable resilience in the tenure, with households responding in various adaptive ways to
become purchasers. As a result, the rate of decline in ownership may not be as great as might
be suggested by the scale of the affordability barriers and other economic and social changes.
The potential adaptive responses include:
Home purchase deferral—households may not cease purchase altogether but simply defer
purchase to a later time, when household circumstances enable it.
Increasing household income by formation of two income households or higher rates of
workforce participation.
Borrowing more—historically, up to the mid-1980s, there was a tendency for households to
rarely borrow more than a quarter of household income, a process reinforced by more
restrictive regulation on finance providers.
Deferring or not having children—having children is expensive and so is home purchase; if
one prevents the other, hard decisions may have to be made, with some households
deferring or deciding not to have children in order to purchase a dwelling.
Purchasing a different product, that is flats and townhouses—historically Australians tended
to buy detached dwellings rather than flats or apartments, which were typically purchased
by investors for rental; flats and apartments tend to be a cheaper form of accommodation,
so another way to become a home purchaser is to acquire such accommodation.
Moving to more affordable locations—there are always cheaper housing submarkets in
which to purchase and thus some households may purchase in locations that previously
were not part of their awareness space.
Parents assisting children into ownership through either direct purchase, provision of loans
or acting as guarantor, or inheritance upon death.
Renting but at the same time purchasing a rental property so that some form of property
equity can be achieved, with the hope this enables transition into ownership at a later date.
Adaptive responses by households are not of course made in a vacuum. They are enabled and
constrained by the wider institutional context, that is, what is allowed by the economic, social
and political environment of the times. So while there have been major changes in affordability,
which in principle limits home purchase, the 1980s have seen other changes. Changes that
have created a risk society can have the effect of both weakening and improving opportunities
for purchase, in effect shaping household decision-making in the housing market. And this
raises the issue of an alternative adaptive response to those identified above. This is the one of
some younger people making an alternative lifestyle decision to that of the lineal leaving home
‘home purchase young family’ one that historically has characterised younger persons housing
10careers. More likely to have casualised work and more mobile, including internationally, some
younger households opt for an unencumbered ‘being in the here and now’ lifestyle (Wyn &
Woodman 2006). In terms of housing choices this typically means private rental with its greater
flexibility than home purchase. This response, however, is not the subject matter of this report
where the focus is on those who still opt for the latter.
The ability to purchase is conventionally reduced by economists to a number of factors: price
and household income (creating an affordability variable), savings (necessary for a deposit),
lending conditions (availability and cost of finance) and the cost of substitutes, which in the
Australian context is that of the private rental sector. But behind these factors sit more complex
institutional relationships which impact on each of them either separately or collectively.
Thus, household income can be affected by whether it is a single or two-income household,
and rates of change in the formation of such households. It can also be affected by the
regularity of income and indeed the overall level of economic growth and the distribution of
income related to that growth. Similarly the availability of substitutes can be equally multi-
faceted. An adaptive response to the high cost of detached dwellings could, as previously
mentioned, be the purchase of an apartment rather than a house, which for various reasons
outlined in Section 4.2.4 might not have been possible in the past.
The following discussion briefly reviews the major changes that have implications for home
purchase, beginning with affordability. There is now a growing literature on all of these areas
so the discussion of each one here is kept short, with directions to the broader literature. One
of the problems in such analysis, regardless of whether it is brief or extensive, is that the
categories of the changes discussed, such as economic, demographic, and social, are never
mutually exclusive and are often interdependent. This creates the dilemma of where to locate
certain points of the analysis, but where possible duplication is avoided and interdependencies
are noted.
3.1 Affordability
The concern for declining home ownership opportunity for younger households is inevitably
linked to affordability, with the argument that dwelling prices have been pushed to levels where
younger households simply cannot afford them. A plethora of government, industry and AHURI
reports have documented the scale and nature of the problem (Productivity Commission 2004;
Berry & Dalton 2004; Yates & Gabriel 2006; Yates & Milligan 2007; Yates et al. 2007; Tanton
et al. 2008; Burke et al. 2011; HIA 2014). Perhaps the most popular from a media perspective
(but perhaps the most unreliable) is Demographia's annual comparison with other countries
where Australian cities always figure among the most expensive (Demographia 2014).
Most of these affordability measures are detailed snapshots in time (using ABS Census or SIH
data) and some, such as those that use dwelling price to income ratios, ignore changing costs
of finance and lending conditions. All have their strengths and weaknesses (see Gabriel et al.
2005; Abelson 2009; Burke et al. 2011 for discussion), but there is little doubt that the collective
story is the same. Australia does have an affordability problem! What can be contested
however is the degree to which affordability represents a solid versus a permeable barrier to
ownership—that is, one that cannot be got around or one that can be circumvented in various
ways and for various reasons.
A few charts hint at the potential stories. Figure 2 below shows the ABS index of established
house prices compared to the index of disposable household income over the 30 years and
clearly reveals a growing gap between the two. In the late 1980s there was a housing boom
which took the index of dwelling prices to a rate higher than that of household disposable
income. House prices then fell back, and, while remaining slightly higher than income, the two
kept in broad relationship up to the late 1990s. From that time on dwelling prices, despite some
up and downs, accelerated compared to household income. Overall the gap between
11household income and dwelling prices is much wider than three decades ago and thus there is
prima facie evidence of an entry barrier to home ownership.
Figure 2: Established house prices compared to household disposable income, Australia, 1986–
2011. Nominal data
Source: ABS (2014a), Australian national accounts: National income, expenditure and product, (March 2014), ABS
cat. no. 5206.0; ABS (2014b), Residential property price indexes: Eight capital cities, (March 2014), ABS cat. no.
6416.0
However, one way to overcome such entry barriers is to borrow more than hitherto, even if this
risks a worsening ongoing affordability problem, as distinct from entry affordability problems. It
is now common knowledge, with the GFC having drawn attention to the issue, that the levels of
debt per household (most of it housing) soared in most western countries in the last two
decades, with Australia having some of the largest increases in debt (Debelle 2008, Graph 9).
Figure 3 below shows the ratio of owner occupied debt to household disposable income and
reveals the large increase in household debt following the deregulation of the finance system in
the mid-1980s. Debt jumped from about 25 per cent of income to around 130 per cent in 2011.
The relationship between the trend line in household debt (Figure 3) and that of dwelling prices
(Figure 2) is a close one suggesting much of the increased borrowing manifested itself in
higher dwelling prices. How a different debt environment plays out for younger households,
25–34 year-olds and 35–44 year-olds, is explored in Section 4.2.1.
12Figure 3: Ratio of owner occupied Housing debt to annualised household disposable
income1981–2012
Source RBA household finances—selected ratios—Table E2, 2014, column F
Two other factors related to affordability are mortgage interest rates and employment rates.
The former has a direct relationship as it affects the level of mortgage payments. But the
second has both a direct and an indirect influence in that unemployment can reduce household
income and thus worsen affordability (the direct relationship), while fear and uncertainty
created by an environment of weaker employment conditions can undermine confidence in
purchase (the indirect relationship).
Figure 4 below charts, for the study period, mortgage interest and unemployment rates. It
suggests that the affordability story is more complex than that provided by income to house
price ratios. Mortgage interest rates have largely gone in the opposite direction to dwelling
prices (see Figure 2 above) and thus to some extent has negated the affordability problem
created by higher dwelling prices. Unemployment rates have also reduced over time, creating
an environment in which more households have increasing incomes and the confidence to
purchase.
Figure 4: Mortgage interest rates and unemployment rates, Australia, 1981–2013
Source RBA (2014), Indicator lending rates—Table F5 (Mortgage interest rates); ABS (2014c), Labour force,
Australia (June 2014), ABS cat. no.6202.0.
13Together, the trends in unemployment and interest rates combined to make the 1980s to mid-
1990s a period of difficult economic conditions, but these improved substantially thereafter. Not
even the Global Financial crisis produced economic indicators as poor as those of the 1980s.
Thus Figure 5 below suggests that the barriers to home ownership may not be consistently
forbidding as affordability has waxed and waned in severity over the decades as dwelling
prices and interest rates change over time. This shows the Commonwealth Bank Index of
Housing Affordability which is based on Commonwealth bank home loans and the eligible
incomes of their borrowers and factors in interest rates to the affordability equation. It indicates
that, despite the high house prices of the 2000s, in this decade housing affordability improved
considerably largely due to a large fall in interest rates. The worst period of affordability, taking
into account household incomes, interest rates and dwelling prices, was from the mid-1990s to
the beginning of the 2000s. This, however, is an index and just shows the direction of
affordability. It does not mean even for periods such as 1989, 2007 and 2011 when affordability
conditions were relatively better that there was not an affordability problem for many
households. This is taken up further in Section 4.2.1.
Figure 5: Commonwealth Bank Index of affordability, Australia, 1985–2013
Source: HIA 2014, HIA/Commonwealth Bank Affordability index, HIA Canberra, available monthly by subscription
In terms of wider economic conditions, the 30 years covered by this study encompassed a
period of sustained economic growth, but with two distinct patterns. The first was 1981 through
to the end of the 1990s, during which growth was more subdued, accompanied by higher than
average levels of unemployment and two periods of marked slowdown (the early 1980s and
early 1990s) when unemployment peaked at around 10 per cent (as shown in Figure 4 above).
The second period, broadly 2000 to the present, was one of strong growth and low
unemployment (bottoming at 4% in 2008) with, unlike in other countries, the GFC having only
marginal impact.
All other factors constant, affordability for example, the period in which one might expect any
negative affect on housing opportunities would therefore have been the earlier period, when
higher rates of unemployment may have had both a dampening effect on confidence and
would also have affected more households in their capacity to actually purchase. But overlaid
on the uncertainty and more subdued growth of this period (in fact causally linked) were the
mortgage interest rates of these years, peaking at 18 per cent (and parallel with a house price
boom) in the late 1980s. The decade 1981 to 1991 was thus one in which the ability of younger
households to purchase may have been more constrained by economic factors than in later
years, when affordability was worse.
143.2 Demography
Changing demography is another factor potentially affecting home purchase. For example,
more single people may mean, given they are one-income households, that there is a reduced
ability to afford purchase, while later marriage/family formation may defer the desire or need to
purchase. Both of these demographic trends have been occurring over the last 30 years, with
the proportion of singles rising from 17.5 per cent to 24.3 per cent over the decades 1981 to
2011 and the median marriage age for women pushed out from 23.3 years to 28 years by 2011
(AIFS 2013; ABS 1988,1983, 2012). These factors may be seen as negatives in terms of home
purchase potential. On the other hand there were other changes which were likely to be more
positive. One, a fusion of demographic and economic, is the increased rate of dual income
household formation.
In the first few post-war decades, when home ownership grew from 53 per cent (in 1947) to
70 per cent (in 1971), the bulk of home purchasers were single income households. This
reflected a demographic characteristic of that era, when the dominant household type was
generally a couple with children. And this was overlayed with the social norm in which the male
worked and the partner stayed at home looking after the children. However, in part this was
facilitated by the fact that, in that era, house prices were at such a level that it only required a
single income in order to purchase a dwelling.
As the post-war years progressed demographic changes saw a lessening of the predominance
of the conventional family. But among those families the proportion in which the partner also
worked increased dramatically, to the extent that by 2011 the participation rate for married
women in the 25–34 year-old cohort was just under 70 per cent in 2011, compared to 45 per
cent in 1981, while for 35–44 year-olds the respective figures were 74 per cent and 55 per cent
(see Table 2 below).
The addition of a second income earner to many households raises the capacity to afford more
housing. It also begs the question as to what degree the increased house prices of the last four
decades represent the capitalised value of additional earnings of the second (largely female)
income earner. However, there is an issue of causation: an alternative question is to what
extent has the increase in dwelling prices been a factor in creating a drive for more and more
married women to seek employment and thereby become a dual income household? Whatever
the direction of the relationship, one of the reasons that the rate of home purchase may not
have fallen as it might otherwise have, given the barriers, is that second income related
increases in household income enabled many households to continue purchasing. Those that
did drop out of the purchase race were more likely to be single-income households, whose
incomes increasingly diverged from median house prices. This is taken up in more detail in
Section 4.2.2.
Table 2: Labour force participation rates among married women aged 20–44, 1971–2011
1971 1981 1991 2001 2011
25–34 years 33.0% 44.7% 57.0% 64.8% 69.3%
35–44 years 41.3% 54.9% 67.9% 69.4% 73.5%
Source: ABS Census, 1971, 1981, 1991, 2001 and 2011; ABS 2014c, Labour force, Australia (June 2014), ABS cat,
no,6202.0
Another demographic process with the potential to effect ownership rates of households, and
one not really significant until the 1970s, was household dissolution through divorce.
Household dissolution typically means that one or both persons move out of the family home.
Given that, in most cases, dissolution weakens the wealth and household income of both
partners this may mean dropping out of ownership and/or inability to enter ownership. Thus an
increase in the divorce rate in any given period may explain a reduction in purchase. There are
15You can also read