The 2020 State of Housing in Harris County and Houston
←
→
Page content transcription
If your browser does not render page correctly, please read the page content below
The 2020 State of Housing
in Harris County and
Houston

                            Photo by Josh Olalde on Unsplash

                            Building Better Cities
                            Building Better Lives
Funded in part by

Research on housing is a core priority area for the Kinder Institute. “The 2020 State of Housing in Harris County and Houston” was made possible,
in part, by lead funding from Wells Fargo.

June 2020

Rice University Kinder Institute for Urban Research MS 208, 6100 Main St. Houston, Texas 77005 Telephone: 713-348-4132 kinder.rice.edu

For more information, contact kinder@rice.edu.

Copyright ©2020 by Rice University Kinder Institute for Urban Research. All rights reserved.

Sales price data included in this report is © Copyright 2020 Houston Realtors Information Service, Inc. This report includes information provided by
the Houston Association of REALTORS®.

Contributors: Kyle Shelton, John Park, Carlos Villegas, Luis Guajardo, Chris Servidio, Zhiyan Zhang.

Suggested Citation: Shelton, Kyle, John Park, Carlos Villegas, Luis Guajardo, Chris Servidio, and Zhiyan Zhang, “The 2020 State of Housing in Harris
County and Houston,” Report. Kinder Institute for Urban Research, Rice University. Houston, TX: Kinder Institute for Urban Research, 2020.
DOI: doi.org/10.25611/zm83-6070
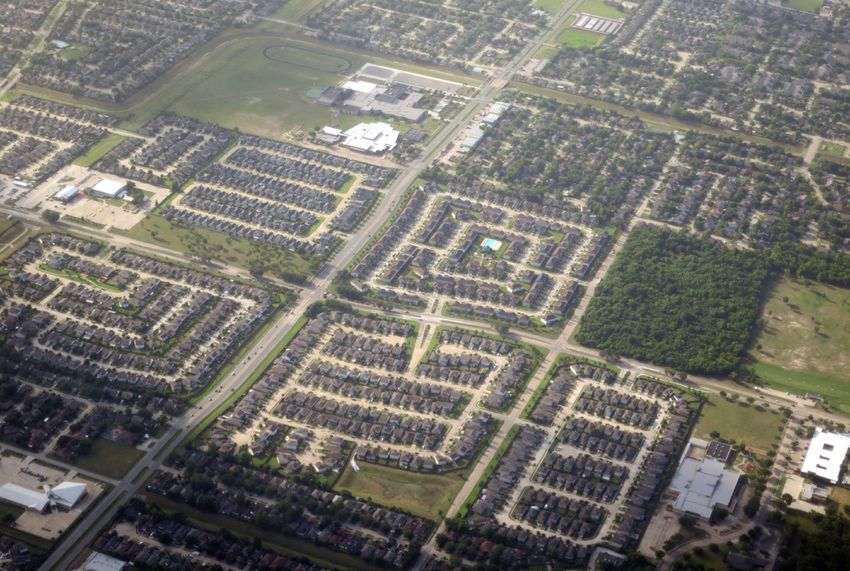
TABLE OF CONTENTS

Table of Contents

                     2       Executive Summary

                     6       Introduction

                  10         Section 1. Economic Trends

                  15         Section 2. Population Trends and the Demand for Housing

                  22         Section 3. Housing Supply

                  26         Section 4. Affordability and Access to Housing

                  37         Section 5. Cross-cutting Connections to Housing

                  42         Conclusion

                  43         Appendix A. Affordability Gap Calculations

                  44         Appendix B. Harris County and City of Houston Indicators

The 2020 State of Housing in Harris County and Houston                                                1
EXECUTIVE SUMMARY

Executive Summary

T     he Kinder Institute’s inaugural State of Housing in Harris County and Houston
      report provides a consistent and accessible baseline of information about
housing-related issues to all Houstonians. This report will be updated annually
to track shifts in how the housing system in our region is changing. The Kinder
Institute will provide an updated report annually and make housing indicators
available for all stakeholders to access. This first report establishes a baseline by
comparing how dozens of key housing indicators have shifted between 2010 and
2018. Subsequent annual reports will add the latest year of data to the analysis and
track trends over time.

This report also appears at an unprecedented time, one           that this affordability is disappearing. Current homeown-
that is likely to both mirror and depart from the impacts        ers are somewhat cushioned from this shift as the values
of the 2008 economic crash. The COVID-19 pandemic and            of homes have risen throughout the county, increasing
plummeting oil prices already have taken a devastating           the value of many households’ biggest asset. The loss of
toll on Harris County and the city of Houston. The public        affordability is falling heaviest on renters. Middle-income
health crisis is compounded by major economic struggles          renters, those traditionally expected to enter into home-
for individuals and society. In the housing sector, the          ownership, are finding themselves without the financial
dual crises have slowed home sales, disrupted the rental         resources to buy even a median-priced home in Houston
market and halted new development.1 For residents, the           or Harris County, thus forcing them to remain as renters.
loss of income has made rent and mortgages harder to pay         Low-income renters face quickly increasing rents across
and contributed to growing housing insecurity.2 Despite          the county and are squeezed into the few areas where
these immediate impacts, the sustained, long-term shifts         affordable rentals still exist. For low-income renters,
in individuals’ lives and the area’s housing system will         homeownership is a near-impossibility without signifi-
not be clear for many years. This inaugural 2020 housing         cant public subsidy.
baseline, coupled with future annual reports, will provide
                                                                 Throughout this report, when Harris County is listed
a critical comparison from which to quantify and track the
                                                                 as the geography, it includes the city of Houston, unless
impacts of each of these major events. What is clear amidst
                                                                 otherwise noted. This choice was made because Houston
the crises is that both the pandemic and the unstable
                                                                 is a significant part of the county and to understand the
economy have made the most-vulnerable members of our
                                                                 scope of the housing challenge both jurisdictions face we
region even more vulnerable. Where possible, this report
                                                                 have to understand how the challenges are intertwined.
reflects on current data points that capture this instability.
                                                                 Information about the city of Houston alone is shared
Harris County and Houston have a reputation for housing          throughout because of the importance of the city to the
affordability, but many of the findings of this report show      overall housing sector.

 2                                                                                        Rice University Kinder Institute for Urban Research
EXECUTIVE SUMMARY

Key Findings                                                                                      2011
                                                                                              Affordability Gap
  !   There are more renters than homeowners in
                                                                                              –$24,121
      the city of Houston and renters are nearing a
      majority in all of Harris County. In the city of
      Houston, renter households already comprise 57% of
      the population, up from 53% in 2010. In all of Harris
                                                                        Median Sales Price                        Affordable Housing Price
      County, the proportion of renters has grown to 45% in
                                                                       $139,000                                     $163,121
      2018, up from 42% in 2010.

  !   Nearly half the renter households in Harris
      County are spending too much on housing.
      In 2018, about 335,000 renter households (47% of
      the total renter households) in Harris County paid                                           2018
                                                                                              Affordability Gap
      more than 30% of their income toward housing,
                                                                                              $33,744
      classifying them as cost-burdened. Of that number,
      about 164,000 renter households (23% of all renter
      households in Harris County) paid rent that was
      greater than 50% of their income, classifying them
                                                                         Median Sales Price                  Affordable Housing Price
      as severely cost-burdened. The number of cost-
                                                                         $220,000                                 $186,256
      burdened renters in Harris County grew between
      2010 and 2018 by 24%.

  !   Far fewer homeowners face affordability issues
      and the number has declined since 2010. In 2018,
                                                                       Affordability Gap for Median Household Income
      186,000 owner households (23% of the total owner
                                                                               in Harris County 2011 and 2018.
      households) in Harris County paid more than 30%
      of their income toward housing. Of that number,
      about 76,000 owner households (9.6% of total owner
                                                               !   The affordability gap is even worse for renters,
      households) paid more than 50% of their income. The
                                                                   making it nearly impossible for the average
      number of cost-burdened owners in Harris County
                                                                   renter to purchase a home without significant
      declined between 2010 and 2018 by 18%.
                                                                   subsidy. Median household income among renter
  !   Households making the median household                       households in Harris County is lower than the
      income in Harris County have seen median sales               overall median income. Among renters in Harris
      prices grow above what they can sustainably                  County, the median household income was $33,590
      afford. The affordability gap—the difference between         in 2011 and grew to $40,740 in 2018. In 2011, a renter
      a home affordable to a household making the median           household making the median household income of
      income and the median home sales price—has                   $33,590 could afford a home priced at $104,019, but
      grown. In 2011, a Harris County household with a             the median sales price was $139,000, resulting in a
      median income of $52,675 could afford a $163,121 home        $34,981 gap. In 2018, a renter household making the
      without spending more than 30% of their income.              renter median income of $40,740 could afford a home
      That was comfortably above the median sales price            of $126,160, but the median sales price was $220,000,
      of $139,000 and created a surplus of $24,121. By 2018,       resulting in a $93,480 gap.
      a household with a median income of $60,146 could
      afford a $186,256 home, but median home prices had
      jumped to $220,000, creating a $33,744 gap.

The 2020 State of Housing in Harris County and Houston                                                                                         3
EXECUTIVE SUMMARY

                                     2011                                 !   Black homeownership dropped significantly in
                                 Affordability Gap                            the Great Recession and lags far behind white,
                                 $34,981                                      Hispanic, and Asian homeownership rates.
                                                                              While all groups saw declines in homeownership
                                                                              between 2010 and 2018, black homeownership fell
                                                                              the most and to the lowest percentage overall. Black
            Median Sales Price                 Affordable Housing Price       homeownership fell from 41% in 2010 to 37% in 2018
            $139,000                                 $104,019                 across Harris County, and from 36% to 31% in the city
                                                                              of Houston. White homeownership fell from 72% to
                                                                              68%, while Asian homeownership fell from 63% to 62%
                                                                              and Hispanic homeownership fell from 50% to 49%.

                                     2018                                 !   Harris County is the center of the region’s job
                                 Affordability Gap                            and economic activity, but the population is
                                 $93,840                                      growing at a faster rate outside of the county.
                                                                              A range of factors such as lower home prices and
                                                                              perceptions about school quality may be driving the
                                                                              trend and it is creating a mismatch between where
            Median Sales Price                 Affordable Housing Price       people work and live.
            $220,000                                 $126,160             !   This spatial mismatch between work and home
                                                                              results in major transportation costs for Harris
                                                                              County households. The addition of significant
                                                                              transportation costs that come from owning and
               Affordability Gap for renter households                        using a car strains household incomes. The average
         making median income among renter households                         Harris County household spends a combined 47% of
                    in Harris County in 2011 and 2018.                        their income on housing plus transportation. There
                                                                              is also a spatial mismatch in connecting existing
                                                                              affordable housing to quality, affordable transit. In
 !   Houstonians must earn $21.02 an hour to pay                              the city of Houston, only 1 in 3 affordable units has
     for an average two-bedroom, market-rate rental.                          access to quality transit.
     The minimum hourly wage in Texas is $7.25 and a
                                                                          !   Trends in the construction of new housing show
     minimum-wage worker would have to work 115 hours
                                                                              growing multi-family supply. While single-family
     a week to afford this rent—nearly three full-time jobs.
                                                                              housing made up 64% of the existing housing stock
     Even at a slightly higher median hourly income for
                                                                              in 2018, large multi-family development accounted
     low-wage workers of $10.92, this translates to working
                                                                              for almost 50% of all new residential development in
     nearly 77 hours a week (or two full-time jobs). This is
                                                                              Harris County and nearly 60% in Houston. This is in
     particularly problematic because of growth in single-
                                                                              response to changing market demand and household
     parent households and people living alone, meaning
                                                                              composition trends, as well as public incentives such
     more households are attempting to secure housing on
                                                                              as the Downtown Living Initiative.
     one income.3
                                                                          !   While many units are being built, they tend to
 !   A quarter of homes face significant flood risk
                                                                              be higher priced, and existing affordable units
     and the number is likely to grow as new maps
                                                                              are declining. The share of rental units below $800
     expand mapped floodplains. In 2018, 1 in 4 homes
                                                                              declined between 2010 and 2018. Median gross rents
     in Harris County was within the current 500-year
                                                                              rose 8% in both Harris County and the city of Houston.
     floodplain, 100-year floodplain or floodway. As
     floodplain maps are updated in the future to account
     for higher risks, more homes will be added to the
     floodplains and many in existing floodplains will
     move to higher-risk categories.

 4                                                                                                Rice University Kinder Institute for Urban Research
EXECUTIVE SUMMARY

  !   The makeup of households is trending away from           Methodology
      the nuclear family of four as the overwhelming
                                                               The word home is used interchangeably to describe all
      demographic. Households consisting of people
                                                               types of dwelling units, whether single-family homes,
      living alone, couples without children, single parents
                                                               townhomes or apartments. This is done to give all
      and unrelated housemates are all on the rise. These
                                                               homes—whether rented or owned—and all residents—
      shifts are also leading to changes in housing needs
                                                               whether renter or owner—equal value.
      and responses from the market.
                                                               Throughout this report, residents are put into four racial
  !   Growth of people over the age of 65 and those
                                                               and ethnic groups—white, Asian, black and Hispanic. The
      with disabilities may present housing and
                                                               white, Asian and black populations referenced are those
      service provision challenges to both Harris
                                                               who identify as non-Hispanic in each group.
      County and the city of Houston. Rapidly aging
      populations are concentrated in the suburbs and          At the neighborhood scale, this report relies on the Kinder
      outer edges of Houston.                                  Institute’s Community Tabulation Area (CTA) to define
                                                               smaller, neighborhood-size areas. The CTAs are aligned
  !   Heads of households between the ages of 25 and
                                                               with census boundaries to ensure the most accurate
      39 are settling equally between Harris County
                                                               numbers. Information about how the CTAs were created
      and the city of Houston, though families with
                                                               and what exact boundaries are is available at the Kinder
      children continue to locate outside of the city.
                                                               Institute’s Houston Community Data Connections site:
      In both Harris County and the city of Houston, the
                                                               www.datahouston.org.
      number of residents between the ages of 25 and 39
      grew by 15% between 2010 and 2018. In Houston,           Data for the indicators included in this report is available
      this growth was concentrated inside the 610 Loop         in the appendix at the county and city level. Some commu-
      in more walkable, multi-family heavy, amenity-rich       nity level data is available at the Kinder Institute’s Houston
      neighborhoods. In Harris County, suburban areas          Community Data Connections site: www.datahouston.org.
      saw massive growth in this population, especially
      farther-out places where home prices tend to be
      lower. In all of Harris County, 38% of households have
      children, compared to 33% within the city of Houston.

  !   Both Harris County and Houston continue
      to be racially diverse overall. The most diverse
      neighborhoods are attracting more diversity, while
      most racially segregated communities continue to
      lose diversity. Hispanics are integrating into several
      historically black neighborhoods. Black and white
      residents are declining in the city.

  !   Both Harris County and the city of Houston are
      seeing more people of different income levels
      living in close proximity. At the same time, many
      predominantly high-income and low-income
      areas have seen income-based residential
      segregation intensify. The neighborhoods with the
      most income diversity are situated within the city of
      Houston and especially inside the Loop, signaling
      that some income diversity may be coming as a result
      of gentrification and in the future income segregation
      could worsen. Many wealthier and low-income areas
      grew even more segregated by income.

The 2020 State of Housing in Harris County and Houston                                                                       5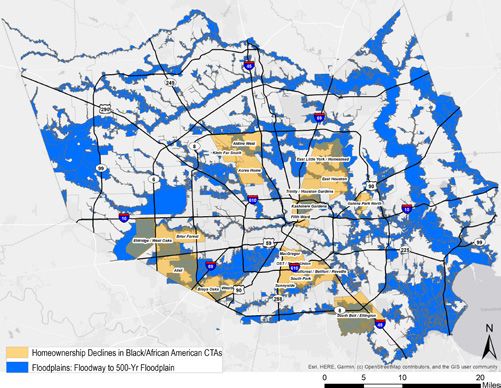
INTRODUCTION

Introduction

F    or individuals and families, where and how we live greatly influences other
     elements of our lives—our health, our access to opportunities, our exposure
to risk and our ability to create wealth. A stable housing situation is a critical
foundation on which to build a life. For broader society, the housing sector is
a critical part of our regional economy, representing a huge proportion of our
spending and supporting thousands of jobs in construction, real estate and supply
chains. The Kinder Institute’s State of Housing report aims to document shifts at
both of these levels. The information contained in this report shows not only how
the housing system is responding to major global shifts, but also how the existing
system is working or not working for individual households.

Harris County and Houston have a reputation for housing         The picture is slightly different for homeowners because
affordability. A main reason for Houston’s decades-long         home values and sales prices both have risen considerably
growth is that it has been awash in inexpensive suburban sin-   since 2010. These increases are a boon to many homeown-
gle-family homes. Indeed, as the populations of both Harris     ers looking to sell their homes or excited to see their as-
County and Houston have grown significantly over the past       sets grow. But even this growth is not without a negative.
10 years (though Houston’s growth seems to have plateaued       For homeowners on fixed incomes, increasing values can
since 2016), many new residents have settled in suburban        lead to higher property taxes and potential displacement.
areas of the county dominated by single-family homes.           Homeownership rates have fallen across the county since
                                                                2010 but have declined the most for black residents and
Many of the findings in this report show, however, that
                                                                lower-income residents.
Harris County and Houston’s reputation for affordabil-
ity belies the reality that many residents are struggling       A similar picture emerges when we look closer at new
to find affordable and safe homes. This burden is falling       construction. While the total units have kept pace with
most heavily on renters who cannot afford to enter the          population growth, most new units are at higher price
ranks of homeownership—the most important form of               points, even though most of the demand is for more-af-
wealth creation in America—due to rising prices and stag-       fordable units. This mismatch arises mainly from the
nant incomes. Digging into the data provides a clearer pic-     combination of rising land prices and stagnant wages.
ture of how and for whom the housing system is working
                                                                Throughout the county, low-income households, people
and where it is faltering. Harris County and Houston are
                                                                of color and renters are the most affected by these chal-
not alone in facing these challenges. Cities and counties
                                                                lenges, which often compound. For example, a household
across the United States face similar issues.4 These are
                                                                is evicted for failure to pay rent, then cannot find adequate
national issues apparent in the local context.
                                                                housing, either because of low income, discriminatory

 6                                                                                       Rice University Kinder Institute for Urban Research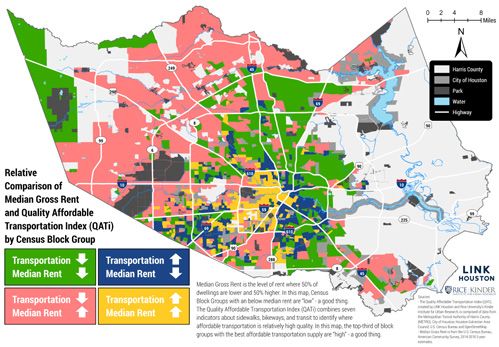
INTRODUCTION

                                                                                                                                 Photo by Random Sky on Unsplash
leasing practices or low availability, and instead secures a   The data for our housing indicators included here are
home in a high-risk area such as a flood zone or a location    available in the appendices at the county and city levels.
with poor access to public transit. This scenario com-         Data used for many of the indicators at the community
pounds vulnerabilities for the least-stable households in      level have been added to the community profiles of the
the region, often placing pressures on other systems such      Kinder Institute’s Houston Community Data Connections
as health care, education and social services.                 website (www.datahouston.org).

The major components tracked in the State of Housing
                                                               COVID and Housing
report are overall economic trends affecting the housing
sector: demand, supply and affordability. This report will     The COVID-19 pandemic, of course, has disrupted every
explore these components through five sections. First, we      part of our lives. Beyond the dire public health threat, the
begin with macro Economic Trends at the national, state        response to the virus has led to millions of unemployed
and local levels. Second, Population Trends and the Demand     Americans, shuttered schools and recreation spaces and
for Housing explores how demand and household charac-          created instability in countless other realms. In Houston
teristics are changing in our region and what that could       and Harris County, the collapse of the oil sector has
mean for the market. Third, in Housing Supply, we explore      produced a one-two punch and destabilized even more
the existing housing stock and its ability to meet demand.     households. Nearly 350,000 individuals in Harris County
Fourth, in Affordability and Access to Housing, we docu-       have filed unemployment claims since March 2020, ac-
ment issues with affordability in the housing sector. Fifth    cording to Texas 2036.5 Kinder Institute analysis of Texas
and finally, in Cross-cutting Connections to Housing, we       Workforce Commission data also shows that job losses
explore three issues that interlock with housing in critical   are affecting lower-income neighborhoods the most.6 The
ways—flooding, gentrification and transportation.              loss of income likely will compound pre-existing chal-

The 2020 State of Housing in Harris County and Houston                                                                     7
INTRODUCTION

lenges around housing, food security and health care for      for those with lower incomes and for households that
many households.7                                             rent. While most data points compare 2010 to 2018, where
                                                              possible the State of Housing does mark data points that
Because of the virus, most people are spending more time
                                                              are beginning to show the disruptions of the pandemic
in their homes, a place that is supposed to be a respite
                                                              in the housing system. In the coming years, we will keep
from the stresses of the outside world. For essential work-
                                                              a close eye on how incomes, affordability and access to
ers who have worked on-site throughout the pandemic,
                                                              housing change in response to COVID-19.
fears of bringing the virus home have changed that dy-
namic. The same is true for the hundreds of thousands of      There are huge inequities in both health impacts and
residents in Houston and Harris County who find them-         ongoing economic impacts of COVID-19. Black and brown
selves living in unaffordable or unsafe homes and con-        communities are hit hardest by the virus itself as well
fronting household incomes stretched to breaking amidst       as feeling many of the economic impacts most directly.8
the pandemic. In these cases, home is not a respite but a     Further, recovery is complicated by decades of unequal
cause of anxiety. Uncertainties about whether households      public policy and underinvestment in low-income, non-
can pay their rent or mortgage or keep children and older     white communities, which can be traced to the origins of
relatives safe and healthy in their current home have         federal housing policy in the United States. These inequi-
become ever-present concerns.                                 ties have their roots in the redlining practices of the Home
                                                              Owners Loan Corporation and, later, the Federal Housing
Given the changing nature of the pandemic and the
                                                              Administration, which helped entrench segregation and
limitations on the underlying data, the 2020 State of
                                                              affected the amount of public and private investment
Housing report does not capture the complete picture of
                                                              in lower-income, non-white communities.9 Many of the
the impacts that COVID-19 and the energy sector collapse
                                                              groups highlighted in this report as facing major challeng-
have had on Houston and Harris County’s housing sector.
                                                              es in the housing sector before COVID-19 are also likely
Many of the indicators through which long-term impacts
                                                              to see those housing issues worsened by the impacts of
can be tracked will not include data from the current
                                                              the pandemic. Even in cases where public dollars will
situation until 2022. Much of the data underpinning this
                                                              assist those with significant housing stability issues, such
work, for example, is drawn from sources such as the U.S.
                                                              as renters falling behind on their monthly payments, the
Census Bureau’s American Community Survey, for which
                                                              gap between the need and the funding available is huge.
the most recent data currently available is from 2018. This
                                                              The City of Houston, for example, created the Houston
inaugural report provides a critical baseline to more ac-
                                                              Rental Assistance fund using $15 million of its CARES act
curately understand the impacts of COVID-19 when data
                                                              funding. The $14.4 million of the $15 million will directly
becomes available in future years.
                                                              assist households that make less than 80% of the median
By comparing 2010 data to 2018 data, in fact, the 2020        household income with rent (at up to $1,056 per house-
State of Housing report provides an important example         hold). The program aims to provide assistance to more
of how such a data baseline can help a region understand      than 8,000 households.10 When the program opened to
the impacts of a major disruption, whether a pandemic,        renter applicants, its funds were exhausted in a matter of
an economic recession or both. Many of the trends dis-        hours. Harris County and private philanthropy have each
cussed in this report reflect on the ways that Houstonians    set up similar fund to support low-income families that
have recovered or not recovered from the Great Recession.     likely will face a similar surge in demand.11
In future reports, both the short and long-term impacts of
                                                              It is clear that the need for assistance far outstrips what
COVID-19 will become more apparent.
                                                              such a program can provide. Using the city program
That being said, the impact of COVID-19 on Houstonians        as an example, data shows that before COVID-19 there
and the housing sector writ large is clear. In areas where    were 298,800 renter households in the city of Houston
vulnerabilities already existed, such as a large number       making less than 80% of the median household income
of households spending an unsustainable amount of             and spending more than 30% of their income on housing,
their income on housing, COVID-19’s impacts will only         meaning that even with the program in place, at least
deepen the challenge. For many, the challenges creat-         290,000 qualifying households will not be assisted at the
ed by COVID-19 compound those already laid bare by            current funding levels.12
Hurricane Harvey. This report documents a number of
overlapping challenges facing Houstonians, particularly

 8                                                                                     Rice University Kinder Institute for Urban Research
INTRODUCTION
Kinder Houston Area Survey Housing Topics
The Kinder Houston Area Survey (KHAS) — now in its residents (Figure 2). In addition, 31% of Harris County
39th year — sheds light on Houstonians’ evolving hous- respondents either moved or considered moving in the
ing preferences and decision-making. Several pieces past year. Of those saying they considered moving, the
of KHAS connect directly to the state of the housing need for more space or a bigger house and affordability
system and residents. In 2020, for example, nearly concerns were the main motivators. (Figure 3). One
40% of Harris County respondents indicated not having stark shift the survey has tracked since the recession
enough money saved to afford a $400 emergency pay- is the growing preference for smaller homes in a more
ment, which is a reminder of how pervasive economic urbanized area relative to larger yards in single-family
vulnerabilities are in our community (Figure 1). This neighborhoods (Figure 4).
figure is more pronounced among black and Hispanic
FIGURE 1 Could Not Come up FIGURE 3 During the Past 12 Months,
With $400 for an Have You or Your Family
Unexpected Emergency Ever Seriously Considered
Moving to a Different
Neighborhood in the
Houston area
19% Pay for it with existing
savings
Borrow the money
31%
20% 61% No
Would not be able to
come up with that kind Yes
of money right now 69%
Source: Kinder Houston Area Survey, 2020. Source: Kinder Houston Area Survey, 2020.
FIGURE 2 Could Not Come up With FIGURE 4 If You Could Choose
$400 to deal with an Where to Live in the
Unexpected Emergency Houston Area, Would
by Race/Ethnicity You Prefer:
61.3% 60%
56.0%
55%
49.4%
50%
45%
30.2%
40%
16.2% 35%
30%
2008 2010 2012 2014 2016 2018
A single-family home with big yard, where need to drive almost everywhere.
US-born Anglos All Asians US-born Blacks US-born Hispanic A smaller home in more urbanized area, within walking distance of shops
Hispanics immigrants and workplaces.
Source: Kinder Houston Area Survey, 2020. Source: Kinder Houston Area Survey, 2008–2018.
The 2020 State of Housing in Harris County and Houston 9SECTION 1. ECONOMIC TRENDS
Section 1. Economic Trends
W ithout a doubt, the COVID-19 crisis and government responses aimed at
reducing transmission have altered the reality and expectations of economic
growth. This section does not include an in-depth look at post-COVID-19 impacts;
rather, it looks at the economic trends influencing the housing markets in Harris
County and Houston in the pre-COVID-19 era.
Overall, national and state trends affirm the relative In addition to looking at national trends, a summary of
strength of the housing sector and parallel what has been local housing prices is included in this section. The values
seen at the local level. In general, Texas and the Houston and prices of for-sale homes and the median gross rent
Metropolitan Statistical Area have been more robust paid by renters are two foundational pieces to under-
than the nation as a whole—despite an economic decline standing the entire housing system.
between 2015 and 2016.
Texas and the Houston metropolitan area have seen
Much of that growth has been directly tied to the housing moderate growth rates since the Great Recession,
sector, with overall construction and residential construc- growing an average of 1.6% and 2.2%, respectively,
tion spending having outpaced the nation. However, the every year, despite a considerable decline in
pace of growth in residential construction spending, as economic activity between 2015 and 2016.
well as the growth in new single-family homes, has been
The last decade saw the longest ever bull market and the
slower every year since 2010. This signals a response to
robust economic activity carried over to Houston and
the major population growth of the period, but also a rec-
Texas, despite some local declines in economic activity
ognition that the housing supply caught up with demand
related to the oil sector slowdown of 2015 and 2016 (Figure
in many places.
5). The levels of economic activity of the U.S., Texas, and
Despite low interest rates for much of the past decade, the Houston MSA were compared using a GDP price
Americans have taken on declining levels of debt and lia- index of the current dollar to real GDP output.13 Growth
bilities related to housing. This is a response to the long- in economic activity since the Great Recession has been
term impacts of the Great Recession and the instability it moderate, averaging an annual growth of 1.7% nationally,
created for many households. Nationally, between 2008 1.6% in Texas and 2.2% in the Houston metropolitan area.
and 2014, there was a general trend in declining mortgage Houston and Texas have had higher economic growth
liabilities as people recovered from the Great Recession, rates outside of the decline in economic activity between
though in the past four years that has slowly grown again. the 2015 and 2016 oil bust.14
Similarly, home equity loans have seen a more substantive
Growth in total and residential construction
decline, signaling that fewer homeowners are taking out
expenditures in the Houston metro outpaced
loans to improve, repair or remodel homes. These trends
growth nationally between 2010 and 2018.
are somewhat surprising given low interest rates.
10 Rice University Kinder Institute for Urban ResearchSECTION 1. ECONOMIC TRENDS
FIGURE 5 GDP Price Index in FIGURE 6 Total Residential Spending for
the United States, Texas, the U.S. and Houston MSA,
and Houston Metro Percent Difference from 2010
140%
110
120%
100 100%
Index = 100 in 2012
80%
90
60%
80
40%
70 20%
0%
60 2011 2012 2013 2014 2015 2016 2017 2018
2000 2002 2004 2006 2008 2010 2012 2014 2016 2018 -20%
Recession Houston MSA Texas U.S. % Difference in Total Residential Construction Spending - Houston Metro from 2010
% Difference in Total Residential Construction Spending - U.S. from 2010
US, Texas, and Houston MSA Gross Domestic Product, 2000–2019. Source: Houston Metro Construction Spending: Dodge Data & Analytics retrieved from GHP
Bars indicate recessions defined by the National Bureau of Economic Research. National Construction Spending: U.S. Census Bureau, Construction Spending
Nationally, total construction and total residential con-
FIGURE 7 U.S. Housing Starts by Type
struction spending have increased every year since 2011.
Total construction spending grew 62% since 2010, while 900000
800000
residential construction expenditures grew by 116%—
700000
more than doubling in the period between 2010 and 2018.
600000
However, growth has slowed for both measures, stagnating 500000
Units
after 2013. Locally, overall construction spending has seen 400000
steady growth throughout the 2010–18 period, with a sharp 300000
200000
increase during 2014 and 2015 due to a building boom,
100000
and a big drop during the oil sector bust in 2015 and 2016. 0
Across the whole decade, spending increased by 157%.
May 2010
September 2010
May 2011
September 2011
May 2012
September 2012
May 2013
September 2013
May 2014
September 2014
May 2015
September 2015
May 2016
September 2016
May 2017
September 2017
May 2018
September 2018
January 2010
January 2011
January 2012
January 2013
January 2014
January 2015
January 2016
January 2017
January 2018
Houston-area residential construction spending did not
see the same sharp increase in 2014 as the overall con-
U.S. MF 12-Month Rolling Average U.S. SF 12-Month Rolling Average
struction industry. But residential construction spending
Source: Housing Starts: U.S. Census Bureau and U.S. Department of Housing and Urban Development.
has outpaced the growth of national expenditures every Retrieved from FRED, Federal Reserve Bank of St. Louis.
year except for 2017. Across that period, local residential
construction spending averaged yearly growth of 12%,
though the pace of growth slowed between 2015 and 2017, FIGURE 8 Texas and Houston MSA
before picking back up in 2018. (Figure 6) New Housing Starts by Type
10000
Nationally, single-family and multi-family (five or more
8000
units) construction each saw steady growth between 2010
6000
Units
and 2018 (Figure 7). Single-family homes still represent
4000
the clear majority of new units across the nation, but
2000
multi-family housing starts increased by more than 200%
0
between 2010 and 2014. The development of multi-fam-
May 2010
September 2010
May 2011
September 2011
May 2012
September 2012
May 2013
September 2013
May 2014
September 2014
May 2015
September 2015
May 2016
September 2016
May 2017
September 2017
May 2018
September 2018
January 2010
January 2011
January 2012
January 2013
January 2014
January 2015
January 2016
January 2017
January 2018
ily units slowed after 2015, before a slight uptick in 2018.
After an 8% decline in 2011, single-family new starts saw
an average 10% yearly growth.
Texas - MF 12-Month Rolling Average
Texas - SF 12-Month Rolling Average
Single-family starts in Houston and Texas have closely Houston MSA - MF 12-Month Rolling Average
followed national trends. The Houston MSA saw the Houston MSA - SF 12-Month Rolling Average
most growth in single-family units between 2010 and 2014 Source: Housing Starts: U.S. Census Bureau and U.S. Department of Housing and Urban Development.
Retrieved from FRED, Federal Reserve Bank of St. Louis.
before seeing a dip between 2015 and 2016. The growth of
The 2020 State of Housing in Harris County and Houston 11SECTION 1. ECONOMIC TRENDS
FIGURE 9 Mortgage Rate and Household FIGURE 10 Change in Median Home
Mortgage Liabilities in the Value, Harris County
United States and Houston 2010–2018
9 $170,000
Household Mortgage Liability Level (Billions)
$10,000.00 8
7
$8,000.00 $160,000
6
5
Percent
$6,000.00
4 $150,000
$4,000.00
3
2
$2,000.00
$140,000
1
$0.00 0
2000
2001
2002
2003
2004
2005
2006
2007
2008
2009
2010
2011
2012
2013
2014
2015
2016
2017
2018
2019
$130,000
Harris County The City of Houston
Annual Household Mortgage Liability Level
30-Year Fixed Mortgage Rate (Quarterly Average) Year 2010 (Inflation-adjusted) Year 2018
Source: FRED, Federal Reserve Bank of St. Louis; https://fred.stlouisfed.org/ Source: U.S. Census Bureau, American Community Survey 5-Year Estimates, 2010 and 2018.
multi-family projects in Texas have closely mirrored the since the Great Recession has been a boon for
national trend while the Houston MSA saw the highest homeowners. In 2018, homes sales in all of Harris
growth rate in multi-family new starts — four times as County totaled just over $15 billion in value, more
many in 2014 compared to 2010 — before a decline in new than doubling the amount from 2011.15
constructions between 2015 and 2017. (Figure 8)
Median Home Value
National interest rates have remained near zero
Across both Harris County and Houston, the median
in the previous decade, while mortgage rates
home value increased between 2010 and 2018. In all of
have averaged 3% to 4%. Despite the favorable
Harris County, the median value rose from $153,238 (in-
market conditions, mortgage liabilities continued
flation-adjusted) in 2010 to $165,300 in 2018 — an increase
to decline through the third quarter of 2014.
of 8%. The city of Houston’s median home value also
National interest rates have generally declined in the pre- increased, from $144,046 (inflation-adjusted) in 2010 to
vious decade compared to the 2000s. While the effective $161,300 in 2018 — an increase of 12%. (Figure 10)
federal funds rate has been virtually zero for much of the
The city’s slightly higher increase reflects the growth in
preceding decade, the low-interest-rate environment did not
value for homes in traditionally high-demand areas, such
influence home mortgage rates much between 2010 and 2018.
as the Heights, and in quickly redeveloping parts of the
Household mortgage liabilities decreased from the first city, such as Oak Forest, which each saw value increases of
quarter of 2010 through the third quarter of 2014 before more than 80%. There are also large increases in commu-
growing every quarter since, once again reaching 2010 lev- nities that have experienced significant redevelopment and
els by the first quarter of 2018. Similarly, revolving home gentrification pressures, such as Independence Heights,
equity loans from all commercial banks have decreased where home values increased by more than 60%, or the
from a peak in mid-2009, falling from $600 billion in Near Northside, where values increased by more than 20%.
January 2010 to $349 billion in December 2018. (Figure 9)
There are some exceptions to the growth in value, though.
Each of these indicators shows the long-term chilling Nine lower-income CTAs with predominately non-white
effects of the Great Recession, with mortgages and home residents have seen values fall between 2010 and 2018.
equity loans declining even though the general economy Settegast, for example, saw home values drop 18%, and
returned to prosperity during the 2010s. East Little York saw a decline of just over 8%. The com-
munities where values have dropped experienced fewer
Home values have steadily increased in the county
redevelopment pressures, though the decreasing values
and city, with the steepest increases within the
could open the door to speculative purchases in some
city. Home sales prices have also increased.
cases. Decreasing values also represent a significant loss
Both show how the housing sector’s recovery
in the biggest asset of many households.
12 Rice University Kinder Institute for Urban ResearchSECTION 1. ECONOMIC TRENDS
FIGURE 11 Annual Median Sales Price, FIGURE 12 Median Sales Value by Home
Harris County and Houston, type, Harris County and
2010–2018 Houston, 2011 and 2018
$300,000 $300,000
$292,000
$290,000
$250,000
$241,250
$240,000
$200,000
$223,140
$211,500
$200,000
$170,000
$142,250
$139,000
$134,900
$100,000
$110,000
$101,000
$150,000
$100,000 $0
Year Year Year Year Year Year Year Year Year 2011 Year 2018 Year 2011 Year 2018
2011 2012 2013 2014 2015 2016 2017 2018 Harris County The City of Houston
Harris County The City of Houston Single-family Townhouse Condominium
Source: Houston Association of Realtors Source: Houston Association of Realtors
Median Sales Price16 by 36%, from $950,000 to $1,480,500. Even areas where
The median home sales price adds an even more nuanced the median sales price is well below the county median,
reflection of the market than the value, as it captures prices increased greatly. In East Houston, for example,
the actual price at the time of sale, which is often higher the median sales price increased from $33,000 in 2010 to
than assessed value or median values captured by the $95,000 in 2018.
U.S. Census. A caveat about the available sales price data
Single-family homes saw the largest consistent gains in
is that it only applies to places where closed sales are
both the county and city, but townhomes and condomini-
recorded, so this indicator is limited in places with few
ums also saw increases in the median sales price. Again,
sales. In both Harris County and the city of Houston,
prices within the city of Houston were higher compared
sales prices increased in step with the median value
to all of Harris County, with townhomes, which tend to be
between 2011 and 2018. The county’s median sales price
newer builds in high-demand neighborhoods, having the
increased from $139,000 to $220,000, a 37% increase, and
highest median sales price (Figure 12).
the city’s median sales price also increased, from $167,900
to $268,900, a 38% increase. (Figure 11) Median gross rent has increased since 2010
across all rental units and represents almost
Both county and city have median home sales prices
exactly 30% of the median renter household
well above the median value, indicating a strong, com-
income, the edge of affordability. This belies the
petitive home-buying market in both jurisdictions. This
fact that in 2018, 164,182 renter households paid
also highlights growing issues with affordability and
rent that was greater than 50% of their income.
access to homeownership for lower- and middle-income
residents. Median sales prices in both jurisdictions are Across Harris County, median gross rent increased from
above the level that many potential homeowners can $954 to $1,031, or 8%, between 2010 and 2018. The city of
sustainably afford, particularly in high-demand areas. As Houston’s median gross rent increased from $923 to $990,
section 4 — Affordability and Access to Housing — will show, or 7%, in the same time period. The increase in median
first-time homeowners increasingly are only able to find gross rent in the county is attributable to the fact that
homes in distant areas of Harris County or in city com- most newer and larger rental units are available outside of
munities undergoing significant neighborhood change. the city. (Figure 13)
The fact that sales prices inside the city of Houston’s were Median gross rent grew fastest in areas with high rental
much higher than the county’s, and that the gap grew demand and many amenities, such as East Downtown,
between 2011 and 2018, reflects the demand for homes in where median rent rose by 221% from 2010 to 2018. Other
high-amenity, in-demand areas in particular. CTAs with CTAs fitting this pattern are Fourth Ward, Washington
the highest median prices included several higher-income Avenue and Downtown. Some areas facing redevelop-
areas such as Memorial Villages, where prices increased ment pressure, such as Settegast, saw gross rents increase
The 2020 State of Housing in Harris County and Houston 13SECTION 1. ECONOMIC TRENDS
FIGURE 13 Change in Median Gross
Rent, Harris County and
Houston, 2010–2018
$1,100
$1,050
$1,000
$950
$900
$850
$800
Harris County The City of Houston
Year 2010 (inflation-adjusted) Year 2018
Source: U.S. Census Bureau, American Community Survey 5-Year Estimates, 2010 and 2018.
Photo by Demond Henderson/flickr
FIGURE 14 Change in Median Gross Rent
in the Five Fastest-growing
CTAs, 2010–2018
250%
200%
150% greatly, but at much lower overall levels than many of
the hottest rental markets. (Figure 14) Rent increases in
100% lower-income or gentrifying communities, though, raise
concerns about the displacement of long-term residents as
50% communities change.
0% With the rise in gross rents, the percentage that a median
East Downtown Fourth Ward Settegast Washington /
Memorial Park
Downtown
renter household pays toward rent ticked up slightly be-
Source: U.S. Census Bureau, American Community Survey 5-Year Estimates, 2010 and 2018. tween 2010 and 2018 and hovers at the 30% threshold con-
sidered affordable in both Harris County and Houston.
Overall, a small majority of renting households in Harris
FIGURE 15 Gross Rent as a Percentage County pay about 30% of their income in rent. However,
of Household Income, the 30% figure hints at the precariousness of many renting
Harris County, 2010–2018 households’ situations. As Figure 15 shows, about 23% of
180,000 renter households in the county paid greater than 50% of
160,000 their income on rent in 2018. And nearly that many again
140,000
paid more than 30% of their income toward rent. If rents
120,000
continue to rise or if incomes remain flat, significantly
100,000
more renter households could become cost-burdened.
80,000
60,000 Additional issues around affordability for both homeown-
40,000 ers and renters are explored in Section 4, Affordability and
20,000 Access to Housing.
0
Less than 10 to 19.9% 20 to 29.9% 30 to 39.9% 40 to 49.9% 50% or more
10%
Year 2010 Year 2018
Source: U.S. Census Bureau, American Community Survey 5-Year Estimates, 2010 and 2018.
14 Rice University Kinder Institute for Urban ResearchSECTION 2. POPULATION TRENDS AND THE DEMAND FOR HOUSING
Section 2. Population Trends
and the Demand for Housing
D emand is a critical element of the housing sector. This section provides
findings related to population dynamics and household characteristics.
These components help shape housing demand in Harris County and the city of
Houston — including where people live, socioeconomic conditions of the population
and household size — and suggest what shifts in those indicators might mean for
the market in the future.
Jobs and economic activity continue to concentrate
in Harris County even though the population is FIGURE 16 Population Growth in
growing at a faster pace beyond the county. Metropolitan Houston,
1980–2018
Between 2010 and 2018, the population of Harris County 8,000,000
increased by 15%, from 4,092,459 in 2010 to 4,698,619 18%
7,000,000
in 2018. Similarly, although at a slower rate, the city
6,000,000
of Houston saw a population increase of 11% — from 15%
5,000,000
2,068,026 in 2010 to 2,295,982 in 2018. The city’s growth
rate has slowed since 2016 and may continue at that pace 4,000,000
in the coming years due to the rapid decline in immi- 3,000,000 11%
gration, particularly refugee resettlement. Before 2017, 2,000,000
Houston was the country’s leading city in resettling ref- 1,000,000
ugees.17 However, since 2017, federal immigration policies 0
1980 1990 2000 2010 2018
have drastically cut international immigration and refu-
Metropolitan Population Harris County Population Houston Population
gee resettlement in the United States, slowing population
growth in areas that usually absorb those groups.18 Source: Population of the 100 Largest cities and other urban places in the United States: 1790 TO 1990
(https://www.census.gov/population/www/documentation/twps0027/twps0027.html); The Census Bureau’s
Population Estimates Program (https://www.census.gov/programs-surveys/popest.html); Population of States
The broader metropolitan area’s population growth of and Counties of the United States: 1790 to 1990 (https://www.census.gov/population/www/censusdata/
pop1790-1990.html)
18% continues to outpace both the county and city. Many
residents are settling in suburban counties such as Fort
Bend and Montgomery even though most of the jobs and Harris County accounted for over 80% of all gross domes-
economic activity remain in Harris County and Houston. tic product in the metropolitan statistical area in 201819.
(Figure 16 and 17) Though still dominant, this was a decline from 84% in
2001. (Figure 17)
The 2020 State of Housing in Harris County and Houston 15SECTION 2. POPULATION TRENDS AND THE DEMAND FOR HOUSING
FIGURE 17 Real Gross Domestic Product FIGURE 18 Renter Households by Race/
Share, Harris County and Ethnicity, Harris County and
Houston MSA, 2001–2018 Houston, 2010 and 2018
$450 80%
69%
$400 70%
63% 62% 63%
Chained 2012 Dollars (Billions)
61%
$350 59%
60% 55%
53%
50% 51%
$300
50%
43%
$250 39% 38% 39%
40%
$200 32%
29%
30%
$150
20%
$100
$50 10%
$0 0%
Year 2010 Year 2018 Year 2010 Year 2018
01
02
03
04
05
06
07
08
09
10
11
12
13
14
15
16
17
18
20
20
20
20
20
20
20
20
20
20
20
20
20
20
20
20
20
20
City of Houston Harris County
Houston MSA minus Harris County Harris County
White Black Hispanic Asian
Source: U.S. Bureau of Economic Analysis, Gross Domestic Product (GDP) by County, Metro, and other Areas. Source: U.S. Census Bureau, American Community Survey 5-Year Estimates, 2010 and 2018.
There are more renters than homeowners in Harris County was close to that of white households.
the city of Houston, and renters are nearing a However, the Asian renter rate is much higher in Houston
majority in all of Harris County. (Gulfton, Sharpstown and other areas with large Asian
immigrant populations in rental apartments are all in the
In the city of Houston, renter households already con-
city of Houston).
stitute 57% of the population, up from 53% in 2010. In all
of Harris County, the proportion of renters grew to 45% Rapidly aging residents and populations with
in 2018, up from 42% in 2010. More than 70% of renter a disability status are concentrated in inner
households in Harris County have an income of less than suburban communities, which may present future
$50,000, creating a growing need to make homes afford- challenges for local governments.
able and available to this group. As the Housing Supply
The share of the population over the age of 65 grew sig-
section will show, though, the county and city both are
nificantly in both Harris County and the city of Houston
lagging in the production of housing for this group.
between 2010 and 2018. Overall, this group grew by 45%
Across all races and ethnicities, the rate of households in Harris County and 27% within Houston. The neighbor-
that are renters increased between 2010 and 2018 in both hoods with the highest growth and the overall number
Houston and Harris County—in line with population of people who are 65 or over predominantly are located
growth and the corresponding decline in homeownership in suburban communities on the perimeter of Beltway
rates seen in previous analyses (Figure 18). This, again, 8 — suggesting many older Houstonians are aging in
may be indicative of a higher propensity among residents place. Given Houston’s low-density, car-dependent neigh-
to rent due to the rising costs associated with purchasing borhoods, meeting the needs of this aging population may
a home. be a challenge, as driving becomes a barrier to many as
they age.20
The percentage of households renting is highest among
black households in both Houston and Harris County. As Similarly, between 2012 (when the Census began collect-
of 2018, just under two-thirds of all black households in ing data on disability status in the ACS) and 2018, the pop-
Harris County were renters, compared to only one-third ulation of residents living with a disability grew by 14% in
of all white households. In Houston, the percentage of Harris County and by 5% in Houston. Again, the majority
white residents that were renters was slightly higher, ac- of the neighborhoods that saw the fastest growth among
counting for younger and older residents living in apart- people living with disabilities are located in the suburbs.
ment rentals in dense, walkable neighborhoods. Residents living with disabilities often have particular
needs when it comes to housing—wider hallways, acces-
The percentage of Hispanic households renting held
sible bathrooms and sloped sidewalks—which may be
relatively steady between 2010 and 2018. Among Asian
achievable in newer housing units but can be difficult to
households, the percentage of households renting in
retrofit in older homes.
16 Rice University Kinder Institute for Urban ResearchSECTION 2. POPULATION TRENDS AND THE DEMAND FOR HOUSING
FIGURE 19 Neighborhoods with the FIGURE 20 Neighborhoods with the
Fastest Growth of Persons over Fastest Growth of Young
65 Years of Age and People Adults (Aged 25–39),
with Disabilities, 2010–2018 2010–2018
Source: U.S. Census Bureau, American Community Survey 5-Year Estimates, 2010 and 2018. Source: U.S. Census Bureau, American Community Survey 5-Year Estimates, 2010 and 2018.
Figure 19 shows the areas with the fastest growing popu- Households with children continue to locate outside of
lations of older residents and residents with disabilities. the city of Houston. Across the county, 38% of households
had children in 2018, compared to only 33% in the city of
Though suburban growth remains strong among
Houston. Both jurisdictions experienced a slight decrease
all age groups, Inner Loop communities near
since 2010, attributable both to aging populations and
Downtown are experiencing a surge in young
the movement of households with children to outside of
adults (ages 25–39). Households with children
Harris County.
continue to locate at greater rates outside of the
city of Houston. Both Harris County and Houston continue to
be racially diverse overall. The most diverse
Although the rate of growth among those over 65 is much
neighborhoods are attracting more diversity,
higher for Houston and Harris County, the growth in the
while most racially segregated communities
region’s young adult population (ages 25–39) is another
continue to lose diversity. Hispanics are
trend the housing industry is and will continue to con-
integrating into several historically black
sider. Between 2010 and 2018, both Harris County and
neighborhoods. The number of black and white
Houston saw an increase of roughly 15% among those
residents are declining in the city.
between the ages of 25 and 39.
The Racial Diversity Index (RDI) measures the probabili-
The suburbs continue to grow and remain strong contend-
ty that two randomly chosen people in a given geographic
ers for new residents regardless of age in Houston and
area will be of a different race. A higher number indicates
Harris County. Within the top 10 neighborhoods, Humble
a more racially diverse population.21
South, Lake Houston, Cypress South and Tomball
Southwest saw substantial growth among young adults As expected, both the city of Houston and Harris County
25–39, many of these CTAs also have low home prices. are racially diverse, with an RDI value of 0.69 in both 2010
and 2018.
Unsurprisingly, given the propensity for millennials to
prefer dense, walkable neighborhoods, communities clos- The region’s most diverse neighborhoods tend to cluster on
est to downtown Houston also saw notable growth among the west side of the city, with some diverse neighborhoods
young adults—particularly areas such as the Washington close to the city center or within Loop 610 (East Downtown,
Corridor, Upper Kirby / Greenway Museum Park, East Museum Park and Astrodome). Notably, a few of Harris
Downtown and Third Ward. (Figure 20) County’s growing outer suburbs are among the region’s
most diverse (Cypress South, 1960 / Cypress Creek North).
The 2020 State of Housing in Harris County and Houston 17SECTION 2. POPULATION TRENDS AND THE DEMAND FOR HOUSING
FIGURE 21 Percent Change in Hispanic FIGURE 22 Population Distribution by
Population in Select CTAs, Race and Ethnicity, Harris
2010–2018 County and Houston,
1400
1,259
2010–2018
100%
1200 6% 7% 6% 7%
90%
80%
1000
70% 40% 42%
43% 45%
60%
800
50%
19%
600 40% 19% 24%
22%
30%
362 20%
400 34% 30% 27%
10% 25%
191 180 168
200 0%
Year 2010 Year 2018 Year 2010 Year 2018
0 Harris County City of Houston
MacGregor Sunnyside Cinco Ranch: Barrett Clinton Park Tri-
Harris Community White Black Hispanic Asian Other
Source: U.S. Census Bureau, American Community Survey 5-Year Estimates, 2010 and 2018. Source: U.S. Census Bureau, American Community Survey 5-Year Estimates, 2010 and 2018.
By contrast, neighborhoods that are the least diverse tend
FIGURE 23 CTAs with largest foreign-
to reflect historically segregated neighborhoods clustered
born population, 2010–2018
closer to the center of the city within Loop 610 and points
70000
east, southeast and northeast (Magnolia Park, Pecan
Park, Denver Harbor). Many of these neighborhoods are 60000
predominantly composed of minorities and tend to be 50000
lower income. In a few cases, Hispanic populations are
40000
moving into black neighborhoods such as Clinton Park
Tri-Community, Sunnyside and McGregor. (Figure 21) 30000
20000
Overall, shifts in the racial makeup of residents in the
county and city reflect these trends in RDI. White resi- 10000
dents have declined slightly in the city of Houston (from 0
27% in 2010 to 25% in 2018) and in Harris County (from Alief Sharpstown Pasadena Bear Creek Gulfton
2010 2018
34% in 2010 to 30% in 2018). Between 2010 and 2018, the
share of the population identified as black in the city of
Houston decreased from 24% to 22%, but held steady in Source: U.S. Census Bureau, American Community Survey 5-Year Estimates, 2010 and 2018.
Harris County at 19%. In contrast, the share of the popu-
lation identified as Hispanic increased within the city of
Alief, Sharpstown, Pasadena, Bear Creek and Gulfton
Houston and Harris County (roughly 3 percentage points
were the Harris County CTAs with the highest number
for both, up to the mid-40s), while the share of the popula-
of foreign-born residents in 2018. These neighborhoods
tion identified as Asian held steady at about 7%. (Figure 22)
account for nearly 20% of all of the foreign-born popula-
Houston and Harris County remained hubs tion in Harris County and housed a significant share of
for new immigrants in the United States, with immigrants during this time period. (Figure 23)
five neighborhoods housing nearly 20% of all
Notably, a couple of suburban areas, including Barrett
immigrants (Alief, Sharpstown, Pasadena, Bear
and Humble South, saw the largest increase of for-
Creek and Gulfton).
eign-born residents between 2010 and 2018, recording
Between 2010 and 2018, Houston and Harris County’s 370% and 185% increases respectively. (Figure 24)
foreign-born population (a proxy for immigration) grew
by 16% and 21%, respectively.
18 Rice University Kinder Institute for Urban ResearchYou can also read