2018 The Land UDIA State of
←
→
Page content transcription
If your browser does not render page correctly, please read the page content below
UDIA State of
The Land                      2018
National Residential Greenfield and Multi-Unit Market Study
Image: Jacksons View by Cartagen

                                                  The NLSP is a research initiative that aims to communicate the role
                                          and performance of the nation’s major Greenfield residential land markets.

                                   Currently, the NLSP is supported by Research 4’s proprietary National Greenfield
                                performance and active supply data and Charter Keck Cramer’s proprietary data for
                                                                                 future non-developed land supply

                                     2018 UDIA STATE OF THE LAND RESEARCH PARTNERS

                       2018 UDIA STATE OF THE LAND MULTI-UNIT DATA PROVIDER

Front cover images (Clockwise from top left)
Marina Square at Wenworth Point by Billbergia Group
Alkimos Beach by LandCorp and Lendlease
The Barkly by ID_Land
Springwood by Arcadian Communities
Fairwater by Frasers Property Australia
Welcome to tenth annual State of the Land report

The Urban Development Institute of Australia (UDIA) State of the Land report has evolved over
the last decade to become regarded as the most authoritative annual overview of the state of
the nation’s greenfield land markets.

In this 10th anniversary edition the reporting remit of the State of the Land report has been
expanded to include analysis of the multi-unit infill market utilizing exclusive data from
CoreLogic. In addition, the report for the first time includes coverage of the ACT new home
market.

For the fourth year running the National Land Survey Program (NLSP) undertaken by Research4
and Charter Keck Cramer provides the core data and analysis underpinning the report’s
greenfield analysis.

The NLSP is a rare “bottom-up” analysis of the critically important greenfield land market. The
NLSP analyses the market performance of over 1,000 new residential land estates across the
nation on a quarterly basis. UDIA is delighted to showcase the latest NLSP data and insights
in this year report – which once again highlights the fundamentally important role of the
greenfield sector for housing our growing population.

The customised multi-unit data provided by CoreLogic has allowed this year’s report to provide
analysis of the dynamic apartment and infill development sector evolving across the nation. As
our urban regions continue to mature and policy settings continue to emphasize urban renewal
and urban consolidation the role of multi-unit development will only increase across our
nation’s housing markets.

The new residential housing estates emerging in greenfield land release areas and the
apartment projects being developed within established areas are where public policy hits the
ground on issues such as housing affordability, population, city structure, economic growth, land
release, infrastructure and energy use.

Ultimately the new communities being housed in the new estates and apartment complexes
are home to a new generation of Australians. For these residents these new residential
communities hold their aspirations for their families and their hopes for economic security.

As the recently elected National President of the UDIA it is my pleasure to commend the 2018
State of the Land report to you.

Darren Cooper
UDIA National President
CONTENTS
                                                National Residential Market Overview   5
                                                     Greenfield Market Summary         9
                                                     Multi-Unit Market Summary         12
                                                     Outlook                           16
                                                     Recommendations                   18
                                                South East Queensland                  20
                                                Sydney                                 28
                                                Melbourne                              40
                                                Adelaide                               50
                                                Perth                                  58
                                                ACT                                    66
                                                About UDIA                             73

Image: Ellenbrook by Ellenbrook Joint Venture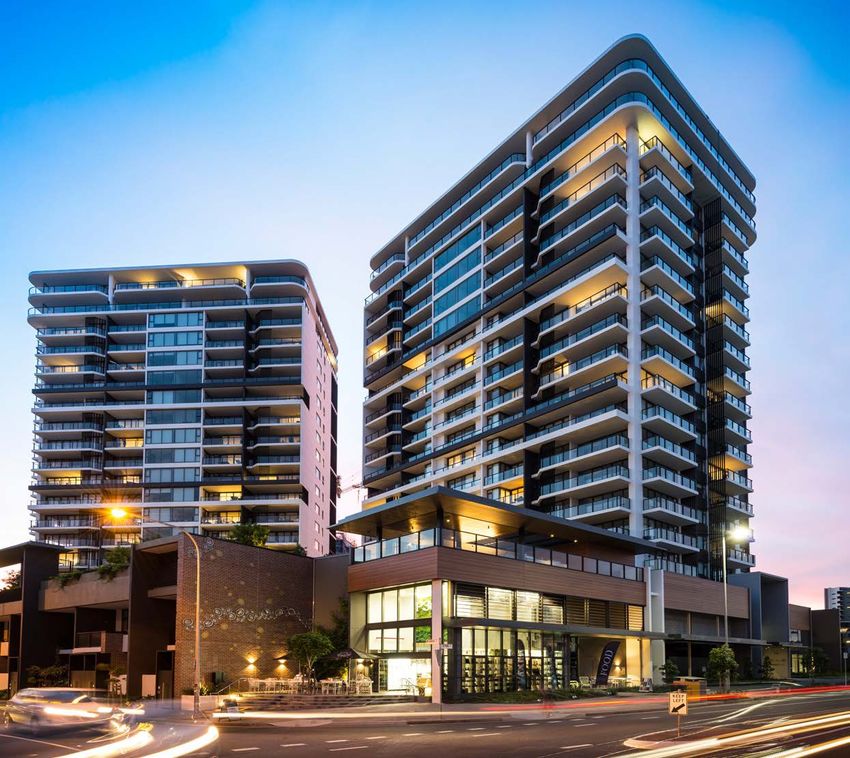
:
NATIONAL RESIDENTIAL
MARKET OVERVIEW
Australia’s residential developers have                   also recorded a similar level of residential
continued to respond to the national housing              production to the preceding year with 25,200
supply challenge with record levels of lot                lots/multi-units in 2017 – which accounted for
releases in residential greenfield land estates           19% of national capital city supply.
and record levels of completions of multi-
unit/infill developments across the 2017                  Residential supply from Perth has retracted
calendar year.                                            sharply over the last three years, with the
                                                          2017 output of 11,900 lots/multi-units
A combined total of 132,600 new greenfield                representing 9% of national capital city supply,
housing lots and new multi-unit/infill                    down from the 16% national market share
dwellings were created across the major                   with 17,900 lots/multi-units in 2015.
capital cities in 2017, which while only
representing a 2% increase on 2016 levels is a            Adelaide produced a total of 4,300 lots/
remarkable 51% increase on 2014 output.                   multi-units in 2017 which represented 3%
                                                          of national capital city supply. While this
The heighted levels of new residential supply             production was a 12% increase on 2016,
being delivered has been led by Melbourne                 more new residential supply was achieved in
which recorded a total production of almost               2017 in the ACT – with a regional population
49,000 lots/multi-units in 2017, which                    approximately one third the size of Adelaide.
was 96% increase on 2014. Melbourne’s
total market output accounted for 37% of                  Population growth, or lack of it, is the primary
the combined capital city lots/multi-unit                 driver of demand for new dwellings. This is
production in 2017.                                       reflected in the population growth profiles
                                                          across the capital cities with the booming
Sydney accounted for 28% of total market                  new home markets of Melbourne and Sydney
supply in 2017 with 37,740 lots/multi-units               attracting the majority of recent metropolitan
completions, which reflected a similar                    area population growth, accounting for
production output to 2016 and a 48% uplift                39% (+527,200 people) and 29% (+392,000
on 2014. South East Queensland                            people) of growth across 2011 to 2016 period
                                                          respectively.
Combined Capital City New Residential Market Supply

  140,000

  120,000

  100,000

   80,000

   60,000

   40,000

   20,000

        -
                 2011         2012         2013         2014        2015            2016   2017

                              Multi-Unit Completions      Greenfield Lot Releases

Source: UDIA; National Land Survey Program; CoreLogic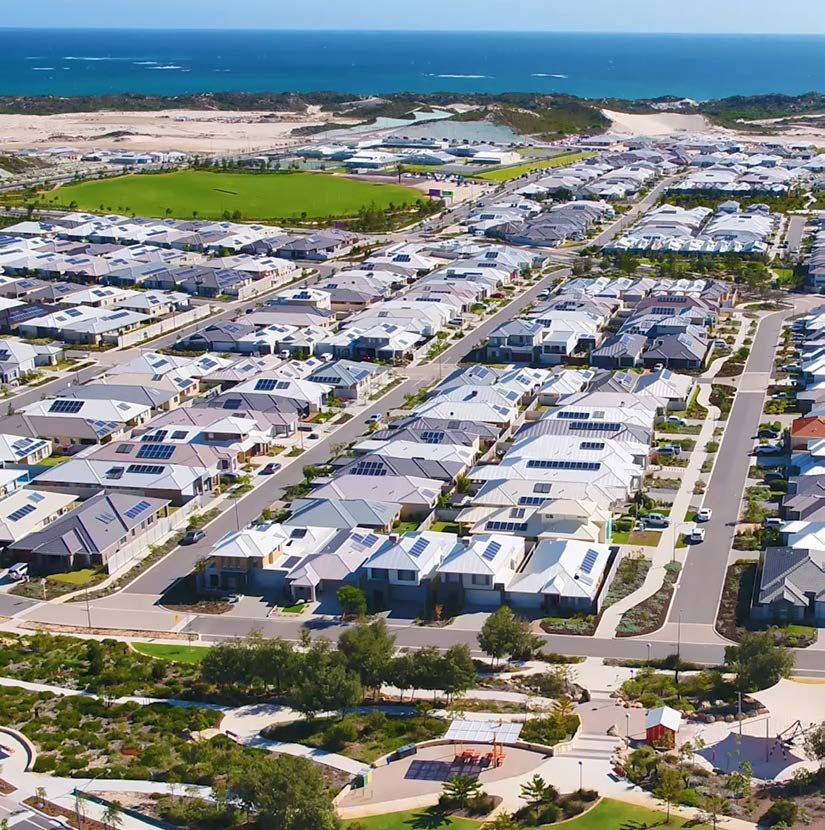
NATIONAL RESIDENTIAL
    MARKET OVERVIEW
    Capital City Population in 2011 & Growth to 2016

                           5,000,000
                           4,500,000
                           4,000,000
                           3,500,000
        Total Population

                           3,000,000
                           2,500,000
                           2,000,000
                           1,500,000
                           1,000,000
                            500,000
                                  -
                                       Sydney      Melbourne   Brisbane       Perth       Adelaide   Canberra

                                           2011 Population     Population Growth 2011 - 2016

    Source: ABS (Note: based off Significant Urban Areas Estimated Resident Population counts)

    Job growth is another macro-economic factor                        growth, the weaker housing markets exhibit
    underpinning the performance of housing                            relatively benign employment growth. The
    market performance. Consideration of recent                        contrast between the average annual job
    employment data highlights that while the                          growth in Victoria (2.8% per annum) versus
    stronger performing capital city markets have                      Western Australia (0.6%) starkly reinforces
    all been attracting robust employment                              this point.
    Average Annual Employment Growth 2014-2017

        Vic                                                                                               2.8%

      NSW                                                                  1.6%

       ACT                                                      1.3%

       Qld                                                     1.3%

       WA                                   0.6%

        SA                                 0.6%

    Source: ABS

6
    Image: Alkimos Beach
    by Landcorp and Lendlease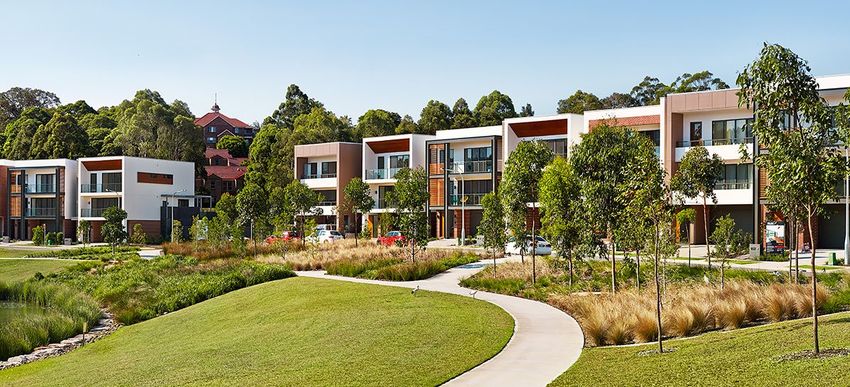
The varied performance of the nation’s major        Benchmarking cities from a variety of
housing markets underscores the on-going            developed economies (including the
challenge faced by the development industry.        USA, Canada and UK) on the basis of this
In addition to the requirement to adapt to          median house price to median income
evolving market conditions and demand               basis the latest Demographia International
profiles, the development industry is also          Housing Affordability Survey (2018) ranks
confronted with persistent alteration of            all of Australia’s capital cities as ‘severely
policy and regulatory settings, at all levels of    unaffordable’; with Sydney currently ranked
government, which impacts in different ways         the second most unaffordable city in the
on residential development.                         rankings – well ahead of other global cities
                                                    such as New York and London, and behind
The on-going deterioration of housing               only Hong Kong.
affordability across the nation is both a
wicked public policy issue for government           Aspiring First Home Buyers (FHBers) are a key
while also presenting a major challenge for         group impacted by the housing affordability
the development industry. Across various            crisis which is reflected in the wholesale
measures it is far more expensive, and with         reduction of FHBers in the contemporary
much higher barriers of entry, to ‘afford’ to       national housing market. Across all
access the housing market than it was even          jurisdictions, except Western Australia, the
a decade ago. As at September 2016 the              proportion of FHBers in the market is lower
median house price to median household              than the long term trend. In NSW the retreat
income ratio was 8.3 in Sydney and 7.1 in           of FHBers is most pronounced with a 2017
Melbourne. This had increased from a ratio of       market presence of 11% of total home loans
5.8 in Sydney and 4.1 in Melbourne in 2001.         as compared to 17% across the 1991-2017
                                                    period. In Victoria the FHBer cohort has
                                                    declined from 21% to 17% and South Australia
                                                    16% to 12%.

Housing Affordability Measures (as at September 2016)

                                                               % of household
                                          % of household                      % of household
                                                                   income
                          Price to income     income                              income
                                                                 required to
                                ratio     required for a                      required to rent
                                                                service a 80%
                                           20% deposit                            a home
                                                               LVR mortgage

 Sydney                          8.3               168%              44%                29%
 Melbourne                       7.1               143%              38%                26%
 Brisbane                        5.7               114%              30%                25%
 Adelaide                        6.2               124%              33%                26%
 Perth                           5.5               111%              29%                22%
 ACT                             5.2               104%              27%                21%
Source: CoreLogic

                                                                                                     7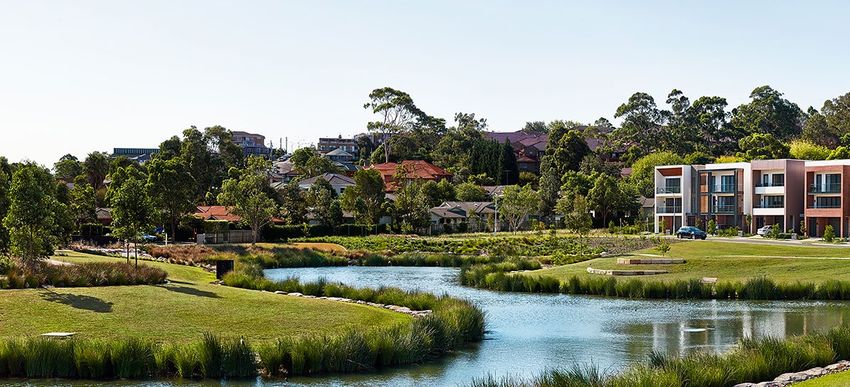
The key to long term, sustainable, housing        Across all jurisdictions the development
    affordability is matching supply to demand        industry faces a number of market and policy
    including delivery of a diversity of housing      challenges in 2018. As the historically high
    products. While the development industry          levels of population growth experienced
    has been able to respond to the significant       over the last few years appear to be ‘the
    increase in demand over the last three years,     new norm’ it is critical that new planning
    the reality is that Sydney and Melbourne (in      policy formulation promotes efficiency and
    particular) need to continue to deliver supply    transparency and enables the industry to
    at these historically high levels year-on-year    continue to deliver housing to market in a
    for the next two decades.                         timely manner.

    First Home Buyers as a % of Total Home Loan Market

                         ACT

      Western Australia

          South Australia

                        QLD

                    Victoria

                       NSW

                               0%     5%        10%        15%         20%        25%         30%

                                    % FHBers: 1991-2017     % FHBers: 2017

    Source: ABS

8
    Image: Jacksons View
    by Cartagen Properties
NATIONAL RESIDENTIAL
MARKET OVERVIEW
GREENFIELD MARKET SUMMARY
LOT PRODUCTION
After four straight years of growth in After a historic peak in production in 2016,
residential land lot release output, 2017 saw Sydney recorded a 13% decline in lot releases
a 6% reduction from 2016 production levels, in 2017 to 9,400 due to a lack of zoned and
with 55,270 lot releases recorded for the serviced land.
calendar year across the major capital city
markets. Melbourne maintained its 40% share The maintenance of challenging market
of the nation’s new lots but appears to have conditions in Perth is underscored by the
reached its development production ceiling at 20% annual decline in releases to 6,885 –
circa 23,000 lots per annum. representing half the volumes achieved in
2014. The smaller markets of Adelaide and
South East Queensland was the only market the ACT also recorded modest net reductions
to record an increase in lot releases (+2%) in releases in 2017, which broadly reflects
and comfortably retains the mantle of second the moderation of momentum experienced
most important greenfield market in the across the national housing market.
country with 13,200 lots released.
Annual Lots Released
25,000
20,000
15,000
10,000
5,000
-
2009 2010 2011 2012 2013 2014 2015 2016 2017
Sydney SEQ Perth Adelaide ACT Melbourne
Source: National Land Survey Program
9NATIONAL RESIDENTIAL
MARKET OVERVIEW
LOT PRICES
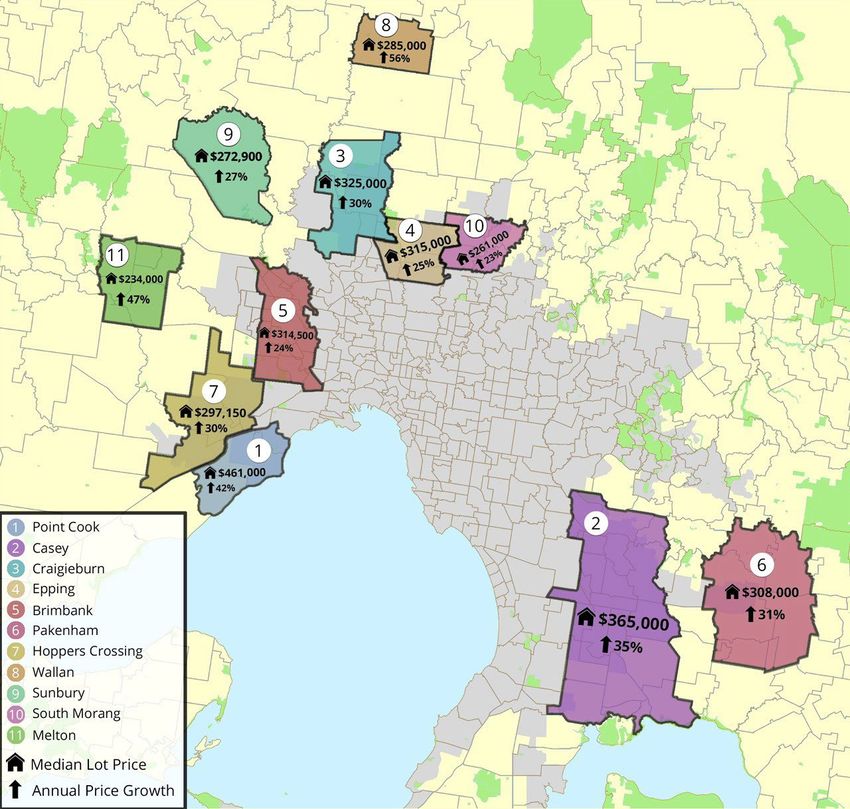
The national median lot price rose 10% across Price growth was most prolific in Melbourne
2017 to finish the December Quarter at which grew by 24% to $281,000 per lot in
$313,000. 2017 which represents the strongest annual
price growth metropolitan Melbourne
Sydney remains the most expensive land has recorded since 2009. SEQ once again
market with a median advertised lot price recorded a modest growth in pricing (+1.6%)
across 2017 of $476,000, which has grown with Perth lots reducing in price for the
40% since 2014 but only 3% across the 2017 fourth consecutive year to an annual figure
calendar year. The ACT has experienced a 64% of $227,000. Adelaide remains the most
increase in the median lot price since 2014 to affordable capital city with a median lot
continue to close the gap on Sydney pricing – price of $167,000 which is lower than the
albeit this is calculated off comparatively low median pricing achieved in 2008 reflecting
sales volumes. the enduring and general weakness in the
Adelaide land market.
Median Lot Price
$500
$450
$400
Median Lot Price ('000s)
$350
$300
$250
$200
$150
$100
$50
$0
2009 2010 2011 2012 2013 2014 2015 2016 2017
Sydney SEQ Perth Adelaide ACT Melbourne
Source: National Land Survey Program
LOT SIZES
The trend of declining lot sizes highlighted the median lot size across the year was 502
in previous State of the Land reports has sqm. Perth retains the smallest median lots
continued through 2017, with a 1.8% decline sizes in the country at 375 sqm. Developers
for the year to average 422 sqm which are reducing lot size in response to
represents and a 16% reduction from 2014. In affordability constraints and in certain cases
all markets the median lot size is now below limited supply and the high cost of land.
500 sqm, with the exception of the ACT where
10Median Lot size
700
600
Median Lot Size (sqm)
500
400
300
200
100
0
2009 2010 2011 2012 2013 2014 2015 2016 2017
Sydney SEQ Perth Adelaide ACT Melbourne
Source: National Land Survey Program
LAND PRICE
The reduction in lot sizes coupled with the to $692 per sqm. The ACT also experienced
rises in lot prices has delivered a significant a strong 15% annual growth in land price
increase in the price of land on a per square to average $868 per sqm. Far more modest
metre basis (per sqm). The national median annual growth in land pricing was experienced
price as at the end of the December quarter in Sydney (+4%), however at $1,202 per sqm,
was $746 per sqm which represents annual Sydney’s land price is 62% above the national
growth of 11.2%. average and has grown a substantial 89% in
four years.
Melbourne’s land price grew 27% in 2017
Median Land Price ($/Sqm)
$1,400
$1,200
$1,000
Land Price ($/PSM)
$800
$600
$400
$200
$0
2009 2010 2011 2012 2013 2014 2015 2016 2017
Sydney SEQ Perth Adelaide ACT Melbourne
Source: National Land Survey Program
11NATIONAL RESIDENTIAL
MARKET OVERVIEW
MULTI-UNIT MARKET SUMMARY
This year’s State of the Land report includes market’ data analysis in future reports.
an overview of the performance of the
residential multi-unit/urban infill market The term ‘multi-unit’ is this report refers
across the capital cities utilising customized to the following residential typologies/
data provided by CoreLogic. This multi- dwelling descriptors: apartments/flats/
unit sector analysis represents a significant units/multi-unit/row/terrace/townhouse.
evolution and expansion of the State of the Other categories of multi-unit development
Land report and a progressive step towards including aged-care/retirement and student
presenting complete and ‘whole of housing housing is excluded from the analysis.
MEDIAN NEW UNIT SALE PRICE
CoreLogic have examined the settled sales expensive than Melbourne’s units ($519,000)
transactions of all new residential multi-units and 63% more expensive than the ACT
across the capital cities between 2011 and ($495,000).
2017. Resale transactions of established unit
stock have been removed from the analysis. Prices have been contracting over the last
two years for new units in Brisbane, which
The median sale price profile of new units recorded a median sale price in 2017 of
highlights, once again, the significant pricing $435,000. Meanwhile in Perth there has been
premium the Sydney market commands. a four year slide in pricing which has now
Despite a 1% annual contraction in median been surpassed by Adelaide with median
unit pricing in 2017 (and no overall growth price points for new units sitting at $400,000
since 2015) Sydney units are still 37% more and $412,500 respectively.
Median New Multi-Unit Sale Price
$800,000
$700,000
$600,000
Multi-Unit Median Sale Price
$500,000
$400,000
$300,000
$200,000
$100,000
$0
2011 2012 2013 2014 2015 2016 2017
Sydney Melbourne Brisbane Adelaide Perth ACT
Source: CoreLogic
12MULTI-UNIT COMPLETIONS
Based on CoreLogic’s estimates a record high impact on the ability to reach the NSW State
77,365 multi-unit completions took place in Government’s annual housing targets.
2017 across the major capital cities - based on
completions within projects yielding 10-units Melbourne recorded an estimated 25,900
or more. This represented an 8% increase on multi-unit completions in 2017 which
2016 and a 64% growth on unit completions represented a 25% increase on 2016
from three years earlier. completions and a 53% increase on 2015
completions. Expectations are that 2017 will
Sydney and Melbourne have been the focal represent a peak year of multi-unit supply
point for the significant uplift in multi-unit in Melbourne as the forward development
dwelling supply over the last two years pipeline indicate a moderation in production
accounting for 68% of net additions to the output over the coming two years.
national housing market.
Multi-unit supply has started retracting
There was an estimated 28,300 multi- modestly in Brisbane (-3% annual change)
unit completions in Sydney in 2017 which and very significantly in Perth (-38% annual
accounted for 73% of total dwelling change). While both comparatively low
completions across the metropolitan region. volume multi-unit markets to the other capital
This underscores the critical role that multi- cities, the ACT and Adelaide both recorded
unit production plays in the Sydney housing strong production increases in 2017 of 100%
market. A significant decline in multi-unit and 39% respectively.
production would have a very significant
Multi-Unit Completions
30,000
Annual Multi-Unit Completions
25,000
20,000
15,000
10,000
5,000
-
2011 2012 2013 2014 2015 2016 2017
Sydney Melbourne Brisbane Adelaide Perth ACT
Source: CoreLogic
13
Image: RV Homebase Fraser Coast
by RV Homebase Fraser CoastNATIONAL RESIDENTIAL
MARKET OVERVIEW
MULTI-UNIT COMPLETIONS BY GEOGRAPHIC DISTRIBUTION
The distribution of new multi-unit supply This spatial distribution of multi-unit
is highly geographically variable across the supply reflects Sydney’s longer history and
capital cities. Sydney exhibits the most even greater market acceptance of apartment
spread of new unit stock completions across development across the metropolitan area
the metropolitan area with: as compared to all the other capital cities.
By way of contrast, 65% of Adelaide’s new
• 21% in the central and inner ring 5km supply is within the 5km inner ring, 63% of
from the Sydney GPO; Brisbane’s supply is within the inner ring, with
Melbourne also having 47% of all new multi-
• 33% within the 5km-10km band; unit supply emerge in 2017 also from this
inner 5km ring.
• 28% within the 10km-20km band;
and
• 18% within the 20km-50km band.
Multi-Unit Completions by Geographic Zone
70%
Proportion of Completions by Geographic Zone
60%
50%
40%
30%
20%
10%
0%
Sydney Melbourne Brisbane Perth Adelaide Canberra
Within 5km 5km to 10km 10km to 20km 20km to 50km
Source: CoreLogic
14Image: Unison by Mirvac 7
MARKET OUTLOOK
                              The residential land development industry is
                              expected to sell a similar level of greenfield
                              lots in 2018, however, supply will be
                              challenged as the sector navigates capacity
                              constraints in Sydney and Melbourne and
                              weak demand persists in Perth and Adelaide.

                              The multi-unit sector is set for another strong
                              year with robust pipelines of projects in
                              place across the nation. While the bulk of
                              new supply will continue to emerge primarily
                              from Sydney, Melbourne and Brisbane the
                              remaining capital cities will continue to also
                              add new stock – albeit at a lower level than
                              2017.

                              The stimulus to the housing market provided
                              by the historically and enduringly low interest
                              rates has passed well past the peak as banks
                              continue to ratchet up mortgage lending rates
                              and tighten the lending for investors. While
                              tougher access to bank finance is impacting
                              retail consumers, developers are also facing
                              significant funding challenges. With the
                              retreat of the major institutional banks,
                              particularly for multi-unit projects in deemed
                              ‘risky’ locations, alternative wholesale
                              and retail funding sources are emerging –
                              including crowd-source funding platforms.

                              A range of additional macro scale economic,
                              regulatory and political challenges may also
                              impact the residential development sector
                              in the year ahead while other drivers will
                              vary from city to city. This includes economic
                              growth, or lack of it, the state of supply and
                              a range of political measures which could be
                              stimulatory.

                              South East Queensland has a positive
                              outlook ahead with expectations of increases
                              in employment and population growth
                              (including increasing levels of interstate

16   Image: Cantala by ICON
     Development & SJB
migration from NSW and Victoria) to support Maintenance of robust supply pipelines in
housing construction following downturns Melbourne’s greenfield market revolves
in mining investment and weather impacts around reform to the inefficient post-Precinct
earlier in the decade. The greenfield sector Structure Plan environment - which is
is expected to perform strongly again this plagued by inefficiencies and delays. For infill
year with land products generally being made development there is also need for planning
available in locations and price points that reform and improvement, as the increasingly
match consumer demand. In terms of infill temperamental nature of planning system
areas, an over-supply of investor grade units is compromising business and investment
in some inner Brisbane locations will continue certainty. Not-with-standing these issues 2018
to be slowly absorbed across another promises to be another strong year for the
generally challenging year for apartment Melbourne development sector.
developers.
Adelaide’s infill development market is
In Sydney it is expected that 2018 will expected to remain strong with several
present another robust year for the housing government initiatives continuing to drive
market with slightly higher levels of new demand for CBD apartments. Very low
completions expected to total circa 40,000. population growth will continue to constrain
However, there is medium-term concern with expansion of the residential greenfield
sales volumes trending downwards for new market. The 2018 State Election will bring a
apartments following a slowdown in obtaining period of adjustment as the incumbent or
approvals, particularly for major projects. new government determines the exact shape
These slowdowns resulted from the planning of the new planning system.
hiatus of Council mergers and 18 months of
‘Draft District Plans’ from the Greater Sydney The Perth housing market is expected to
Commission causing uncertainty. Policy move more fully into recovery mode during
uncertainty is also impacting investment the course of the year with various positive
acquisition in the greenfield corridors with economic and market signs beginning to
further development taxes and levies being emerge. Also on a positive footing is the
mooted. greater clarity emerging regarding the policy
environment within which the development
Maintenance of robust supply pipelines in industry operates in Western Australia.
Melbourne’s greenfield market revolves Government strategy and policy settings
around reform to the inefficient post-Precinct are likely to generate new development
Structure Plan (PSP) environment - which is opportunities which coupled with increasing
plagued by inefficiencies and delays. For infill consumer confidence provides a generally
development there is also need for planning positive development industry outlook.
reform and improvement, as the increasingly
temperamental nature of planning system The ACT’s robust population growth rate will
is compromising business and investment continue to underpin strong housing market
certainty. Not-with-standing these issues 2018 performance. While multi-unit production will
promises to be another strong year for the likely moderate from the historic high of 2017
Melbourne development sector. there is a strong expectation of an uplift in
lot sales with several estates moving into the
next release stages.
17RECOMMENDATIONS
Providing sufficient volumes of appropriately While ranking highly on quality of life
located, accessible and affordable housing for and liveability leaderboards, Australia’s
Australia’s rapidly growing population is one cities continue to rank amongst the most
of the greatest on-going challenges facing the unaffordable in the world (as previously noted
nation. based on a median household to median
house price measurement). To robustly
The property development sector is united in address the affordability crisis it is critical that
responding to the on-going housing challenge governments at all levels continue to address
while a variety of changes continue to sweep underlying inefficiencies that increasingly
across the industry resulting in a need to undermine the delivery of affordable land
adapt and alter the nature and character of supply and new home construction.
business operations.
Taxes and charges remain high with some
The multi-unit sector will continue to expand governments foreshadowing further levies
with the need for a greater supply of medium on development which must be avoided
density or ‘missing middle’ housing to if government is serious about improving
compliment the higher volumes of apartment housing affordability.
projects being delivered.
A recent research report by the Reserve Bank
The polycentric city model will continue to of Australia entitled The Effect of Zoning
become more of a focus for urban planning on House Prices presents a compelling
and with the mounting costs of congestion argument for wholesale reform of Australia’s
weighing on productivity we will be building planning systems. The analysis quantifies the
more urban centres and nodes and less contribution that zoning regulations have had
traditional suburbs as we look to embrace the on raising the cost of housing by restricting
’30-minute city’ aspiration. supply. As of 2016 it was determined that
zoning restrictions had raised detached house
Transport infrastructure will be critical to prices 73% above marginal costs in Sydney,
access these centres and to attract new 69% in Melbourne, 42% in Brisbane and
knowledge intensive jobs to these locations. 54% in Perth. Zoning was also found to have
Public transport needs to evolve to be less raised the price of apartments well above the
radial to the CBD and is likely to include marginal cost of supply, especially in Sydney.
more light rail, and in time driverless
buses and mini-buses. The opportunities The UDIA makes the following
to embrace efficiencies based on smart recommendations to improve housing
city technology harnessing the Internet of affordability and support jobs and economic
Things (IoT) will enable greater productivity, growth in Australia’s development industry:
which is ultimately the goal for our global
competitiveness.
UDIA will continue to forge a leadership
position championing new and innovative
urban planning initiatives and policies
designed to facilitate the planning and urban
development outcomes our cities need to
thrive and flourish into the future.
18
Image: Allara
by Satterley and LandCorpFederal Government should: • Remedy the unintended consequences
from restrictions on foreign purchasers
• Focus on policies that address housing of agricultural land by clarifying the
affordability on boosting supply Agricultural Land definition used by the
and providing a certain regulatory Foreign Investment Review Board to
environment for industry; exempt land that is clearly designated for
residential purposes.
• Closely tie the National Cities
Performance Framework to how and State and Local Governments should:
where future City Deals are struck, by
highlighting locations where liveability, • Undertake major planning reform to
productivity and future prosperity can be increase the supply of urban land and
enhanced through alignment of planning, reduce delays and uncertainty associated
investment and governance between with zoning, planning and the approvals
the three levels of government, the processes;
community and the private sector;
• Move away from stamp duty on property
• Restart the National Housing Supply transactions and replace it with a more
Council to benchmark costs and provide efficient broad-based form of taxation,
leadership in planning a national housing which more reasonably shares the burden
supply strategy to address the housing of new infrastructure;
affordability crisis;
• Carefully consider the application of
• Support foreign investment that assists value capture mechanisms to fund new
unlocking supply of new housing; infrastructure and ensure that they aren’t
just another tax on new housing and
• Increase funding to the National Housing that all beneficiaries of the “Value Gain”
Infrastructure Facility to further catalyse contribute to the value capture;
housing supply;
• Reduce up front charges and levies on
• Commonwealth uses its balance sheet new housing by favouring the recovery of
to deliver infrastructure investment for costs through broad base recurrent taxes
public and social infrastructure using over longer time frames;
sound infrastructure prioritisation
methodologies; • State and Local governments need to
ensure planning agreements for rezonings
• Maintain existing arrangements for do not become betterment taxes; and
negative gearing and capital gains tax;
Carefully examine the effect of capital • Remove foreign buyer and developer
adequacy requirements on the supply taxes and surcharges.
and affordability of housing, and move
immediately to remedy any unintended
consequences; and
19SOUTH EAST
QUEENSLAND
SUMMARY
The land development industry in South East Queensland
(SEQ) continues to operate at a high level. This has been the
fourth year of high land development activity. Lot sales and
supply are well matched overall across the growth corridors
to meet customer demand.
Significant apartment construction has occurred since 2015
in Brisbane with over supply present in some markets. This
stock is having some effect on existing apartment prices and
rents, however take up of stock will be assisted by improving
Queensland population and employment. Population growth
will however create a challenge to increase lot supply levels
while limiting price increases. There are some concerns
regarding land supply and levels of demand on the Gold
Coast, Moreton Bay and Sunshine Coast sub-markets. The SEQ
land market in general has performed well in maintaining high
supply levels and particularly prices.
It is critical policy, planning processes and particularly
infrastructure provision arrangements maintain pace to not
cause price pressures.
GREENFIELD MARKET ANALYSIS
Lot releases in SEQ rose again in 2017 to 13,268 for the year,
up 2.2% on 2016. This was the highest of recent high levels
since 2014. Current sales levels are well matched to supply,
with current trading stock (stock in hand) tight but improved
to an equivalent to three months of supply (from 2.7 months
in 2016). In general land product is being made available in
locations that match customer demand and the product is
reflecting its customers’ wants.
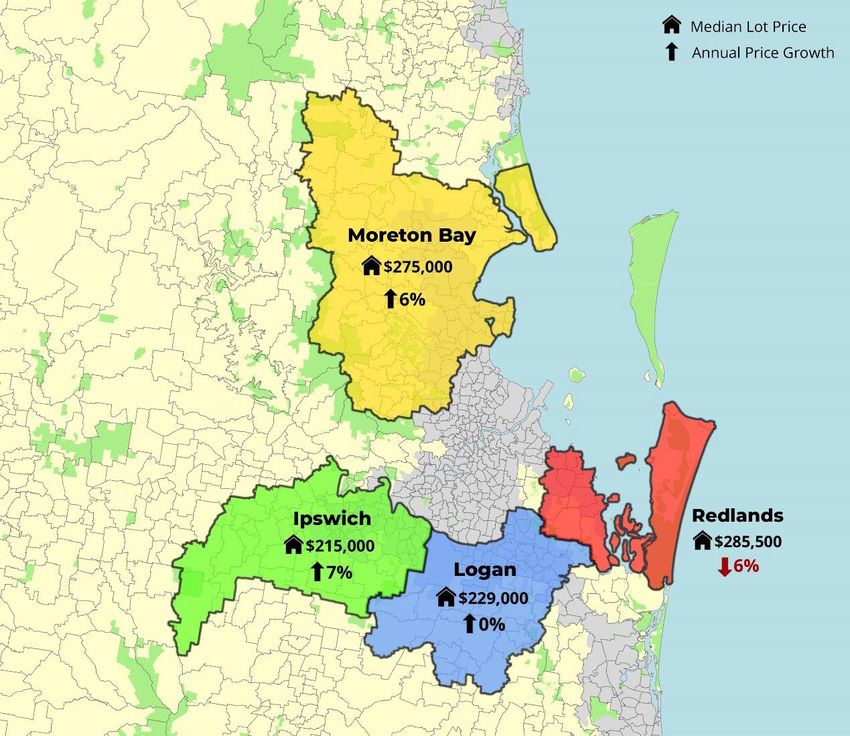
The median lot price for SEQ remained stable at $264,000 with
a 1.5% increase from December 2016. Median prices by local
government area included:
● Ipswich $215,000;
● Logan $229,000;
● Moreton Bay $275,000;
● Redland $285,500;
● Sunshine Coast $287,000;
● Gold Coast $309,000; and
● Brisbane $419,000.
The Logan median price increased over the year, likely
reflecting greater acceptance and maturation of estates in the
area. With limited affordable land estate options on the Gold
Coast and a stronger developer profile, Logan appears to be
developing as a real Gold Coast alternative.
20 Image: The Melbourne Residences
by ARIA Property GroupAnnual Greenfield Activity
Source: National Land Survey Program
Median Lot Price, Land Price ($/SQM) and Median Lot Size
Source: National Land Survey Program
21NLSP Summary Table
Average
Annual
Number of Annual Median
Annual Net Lot Active Estates Median Lot Annual Median Land Price
Sales per Quarter Size (sqm) Lot Price ($/M)
2009 5,238 84 622 $248 $398
2010 5,586 107 623 $247 $396
2011 4,161 129 617 $246 $399
2012 4,749 148 603 $242 $401
2013 7,752 158 559 $239 $428
2014 10,958 170 509 $245 $481
2015 10,383 144 489 $256 $523
2016 11,773 143 470 $260 $554
2017 12,356 163 447 $264 $591
Source: National Land Survey Program
BROADER MARKET TRENDS
A declining housing land supply market share In the fourth quarter of 2017, 58% of vacant
in the Moreton Bay Region (15% of SEQ lots in SEQ were under 450sqm and the
activity) is noted with a greater share being Sunshine Coast had supplied 14% of new
picked up by Sunshine Coast developments lots in the quarter at under 250sqm. No lots
(18%). The median land price in Moreton sub 250sqm were released to market in the
Bay also increased by 6% over the past year. Brisbane or Gold Coast areas. These local
This may reflect some development delays in governments are not realising the opportunity
greenfield areas of the corridor. The potential of small lots (at least without a body
impact of this includes difficulties for the local corporate control
community in finding well located land, higher
costs and reduced affordability, and greater The price per sqm of land rose by 9% to $601
pressure on other markets in the region and per sqm over the year to December 2017. It
services. appears lot size is being increasingly traded by
buyers to maintain overall lot affordability.
A number of larger developments,
representing around 20% of supply, are
providing more affordable product to the
market and are being well supported by
buyers. The SEQ median lot size continued its
long term decline to 447 sqm, down from 470
in December 2016. The median size in 2017
was however the second largest of the states
surveyed.
nd
ckla
22 Sto
a by
Aur
ge:
ImaSOUTH EAST
QUEENSLAND
South East Queensland NLSP Greenfield Sub-Market Reporting corridors:
Median Lot Price (Q4 2017) & Annual Price Growth (2017)
Source: Research4; UDIA
23SOUTH EAST
QUEENSLAND
MULTI-UNIT|INFILL ANALYSIS
The multi-unit sector across Greater Brisbane Apartment pricing also moderated across
recorded 11,900 new completions in 2017 2017 with the median new unit sale price of
which represented a 3.3% reduction from $435,000 representing a 3.3% contraction
the preceding year. Despite the slightly from the 2016 result.
lower volume in 2017 this supply level was
still 138% higher than the annual average The number of building approvals for
recorded across the 2011 - 2014 period. apartment buildings of 4 storeys and above
had increased to more than double the long
High numbers of apartment completions term level in 2015. This has now returned to
occurred in the Bowen Hills, Fortitude Valley, around the long term rate.
Newstead and Herston areas immediately to
the north of the CBD and to the south around Oversupply of investor- style units is reported
South Brisbane, West End, and Highgate Hill. in some inner Brisbane locations. This is
evident in some modest negative impact on
In the next 12 months substantial unit prices of older stock and rental vacancies.
numbers are forecast to be completed around Gross yields however remain favourable
the same areas as well as 1,915 new units compared to other east coast cities.
around Dutton Park, Woolloongabba South Oversupplied stock will be slowly absorbed in
East of the CBD, and 1,490 new units in the these areas.
central CBD, Spring Hill, and Petrie Terrace
areas.
Multi-Unit Summary Table (Greater Brisbane)
Annual
2017
Change
Median Multi-Unit Settled Sale Price
$435,000 -3.30%
(new stock/first time sales)
Total New Multi-Unit Completions 11,900 -3.30%
Median Multi-Unit Rental Asking Price - per week
$380 -1.30%
(all of market)
5.60% 6.00%
Vacancy Rate
(Dec 2017) (Dec 2016)
Source: CoreLogic
24 Image: Sanctuary Cove
By Mulpha Sanctuary CoveMedian New Unit Price & Annual Unit Completions (Greater Brisbane)
Source: CoreLogic
25Multi-Unit Completions by 2017, by postcode
Source: CoreLogic, UDIA
BROADER MARKET TRENDS
The population of Queensland increased by Building approvals of 2 or more storey
79,580 in 2016/17 and up from a 64,659 townhouses and terraces have also increased
increase the previous year. Overseas and in number since late 2015 and are nearly
interstate migration comprised 39.1% and 50% higher than long term levels. Difficult
21.9% respectively of the year’s growth and economic circumstances in some regional
both have been increasing since 2015. areas are restraining home construction in
those areas compared to SEQ.
Housing demand is strongly related to growth
in employment and over the year to January The overall outlook for the State is for
2018 the number of people employed in continued increases in employment and
Queensland increased by 110,400 in trend population growth to support housing
terms. Job advertisements in the year to construction following downturns in mining
January 2018 also increased 12.5% to 33,000. investment and weather impacts earlier
in the decade.
Dwelling building approval numbers remained
high at 41,193 for the year to December
2017. High numbers of apartment building
approvals obtained during 2014 to 2016 have
returned closer to the long term average.
Higher numbers of detached house approvals
are keeping approval numbers at high levels.
nd
ockla
y St
26 ater b
tw
:Brigh
Im ageSOUTH EAST
QUEENSLAND
STATE POLICY ENVIRONMENT
The Queensland industry faces a number of A strategic assessment of the Commonwealth
policy challenges in 2018. To meet the South and State environmental significance of SEQ
East Queensland Regional Plan forecasts growth areas is to be carried out. This process
the industry and government will need to has been undertaken in other states and
increase dwelling provision over time by could reduce approval processes. The review
around 20 per cent. Research conducted for will also examine the concerning proliferation
the UDIA Queensland looked at infill and near of local government environmental controls.
urban greenfield land resources. Startlingly,
the majority of source lots (51%) are less than Other concerns for the industry include:
0.5ha in size, most (~98%) are less than 5ha,
while the overall average lot size is 1.01ha. • The proposed project bank account
that will require a greater
It is critical that additional growth areas administrative burden on building
are investigated and the Institute obtained projects to improve subcontractor
State Government support of a program to payment security
the address issues that are involved in the
developing fragmented areas. Improved • The proposed banning of developer
infrastructure delivery arrangements will also donations to political parties
be critical. which unnecessarily besmirches the
industry without addressing the
A related challenge for the industry is in uncertainty of local government
effective Local Government Infrastructure development assessment decision
Plans (LGIPs). A number of LGIPs have recently making
been completed planning for transport, land
for parks, and community facilities but some • Proposed increased charges on
of these overly aim to reduce infrastructure foreign buyers of property.
costs on local government.
The State Government is continuing the
Environmental legislative controls will likely $20,000 First Home Owners Grant for new
increase in 2018 with new koala conservation homes in 2018. The grant has been an
controls, water quality requirements on important building stimulus.
smaller developments, and vegetation
clearing controls.
27SYDNEY
SUMMARY
The Sydney metropolitan housing market experienced a
record year of new supply in 2017 with 38,700 new dwellings
being added to the established housing stock. This represents
a 14% increase on 2016 completions and a 23% lift on the
four-year average. More importantly, this represents a high
watermark for Sydney dwelling completions across the last
sixty years. Significantly, over 73% of this new supply in
Sydney in 2017 came from multi-unit development.
Despite representing a peak level of supply this is still below
the quantum of annual completions required for the next
twenty years to deliver the forecast 825,000 new homes
by 2036. On the government’s current growth estimates
exhibited in the Greater Sydney Region Plan an average of
41,250 dwelling are required each year to satisfy underlying
demand and address the pent-up demand resulting from a
decade of undersupply.
While some of the heat has come out of the broader housing
market, evidenced by a moderation of median house price
growth and lower auction clearance rates, the Sydney new
home market remains robust with a knock-out year for multi-
unit completions and near peak year for sales of greenfield
lots.
Securing new development sites at an economical price
for both apartment and greenfield subdivision projects
is one of the development industry’s major challenges in
Sydney. Additional taxes and levies being foreshadowed on
development by the NSW government is of major industry
concern. With the new dwelling construction sector powering
the State economy at present, the NSW government needs to
be careful not to ‘kill the golden goose’.
GREENFIELD MARKET ANALYSIS
The metropolitan Sydney new land market since June 2008,
has on average responded to 19% of estimated underlying
demand for new housing across Greater Sydney. The role of
the greenfield market in responding to underlying housing
demand has increased over the past 2 years, with the new land
market responding to an estimated 27% of underlying total
metropolitan housing demand.
Despite the increased role, the Sydney new land market’s
supply response, of 27%, is well below the role of greenfield
markets in other states. The Melbourne new land market
responds to 50% of underlying demand; South East Queensland
responds to 52%; and in Perth, greenfield supply typically
responds to 61 percent of estimated underlying demand for
housing.
Image: Putney Hill terraces and
28 houses by Frasers Property
AustraliaAnnual Greenfield Activity
Source: National Land Survey Program
According to the NLSP the Sydney new land current land sale volumes are 50% below
market has averaged 772 lot sales per month what was sold in 2014.
for the 2017 year, continuing on from a strong
2016 year where monthly average lot sales The Sydney new land market for the 2017
were 826 lot sales. This translates into an year produced 9,410 lots from an estimated
annual sales volume for 2017 of 9,269 lots 83 residential land estates. The sale to
which represents a decline of 7% on 2016. production ratio was close to 1:1. The market
has seen a fall away in the number of trading
The South West greenfield market accounted estates, mainly due to smaller estates located
for 35% of total activity while the North in the North West market coming to an end
West represented 42% of total net lots sales of trading. The North West market has relied
for the wider Sydney new land market. The upon a larger number of smaller estates
West greenfield market accounted for 13 to maintain supply. At its peak, there were
percent of total activity. The performance of 54 trading estates; currently there are 32.
the Western corridor has been held back by The challenge will be ensure that there is a
a lack of trading estates. In 2014, this market reliable pipeline of new estates to replace the
represented 18% of total Sydney land activity; rapid sell down of smaller ones.
29Median Lot Price, Land Price ($/SQM) and Median Lot Size
Source: National Land Survey Program
The South West market has experienced less levels this low would trigger upward price
movement in the number of trading estates, movement, however, the market is aware
mainly due to the fact that this market has a that lot prices are in line with the established
greater proportion of larger residential land housing market price points.
estates with stronger supply lines. However,
the estimated supply remaining in these The median lot price for the December 2017
South West estates is low; suggesting that quarter was $488,000. The median lot price
the South West will need to bring on an for Sydney lifted by 2.7% for the quarter and
estimated, 26 new trading estates overs the is 4.5% higher for the year.
next 5 years for expected underlying demand
to be addressed.
The Liverpool sub-market (as defined by the
NLSP) is currently the most expensive sub-
There was an estimated 849 lots ready for market in Sydney with a median lot price
sale at the close of the December NLSP across 2017 of $550,000. This position has
survey. The December result represents a 22% been maintained over the last two years and
reduction in total stock for the quarter. The is primarily the function of being comprised of
current level of stock is equal to 1.1 months of just six active estates which have all benefited
trading, which suggests that the supply side is
under pressure, or that there should be some
upward pressure on prices. Stock levels have
been fairly even throughout 2017, albeit, the
level of stock has been low. Normally, stock
30 Image: Spring Cove Estate
By Spring Cove DevelopmentsSYDNEY
from close proximity/good accessibility to the The South West sub-market’s new land price
now operational Edmondson Park rail station. has traditionally averaged 44% of the median
All of these Liverpool corridor estates have Sydney house price. This ratio has been fairly
maintained strong median sales performance stable since 2008, however more recently; it
(i.e. +$525,000) across 2017. has jumped to 49%. A jump in the ratio can be
a result of a change in the markets perception
The North West market has traditionally been of value in the place. A higher ratio generally
the most expensive metropolitan Sydney indicates that the market places a greater
corridor, but with 32 active trading estates value on the location and people are prepared
offering a broad range of product it has been to pay more to live in the area.
consistently eclipsed by Liverpool on a median
pricing basis. Finally, the West sub-market’s new land
pricing is currently more-or-less in line with
Never-the-less the North West is the only the long running pricing relationship with
other sub-market where the median lot the Sydney housing market, with a current
price is above $500,000 with an average of average of 47% of the metropolitan median
$523,000 for 2017. In terms of “fair value”, house price – against a traditional average of
the North West market is arguably $50,000 50%.
undervalued. New land across this market
has traditionally averaged 62% of the median In summary, Sydney land prices are in
Sydney house price, over the past year the line with the established housing markets
ratio has been 54%. The reduced ratio is likely price points. Residential land estates have
to have been driven by the changing role and demonstrated self-discipline when it comes
location of the North West market. to holding price. Estates could have been
tempted to push prices due to very low
With the market now moving further out and stock levels and a falling count of trading
with a greater number of trading estates, estates; however, estates have at a macro
the relationship between land and housing level resisted this temptation. This level of
has been adjusted downward. It can be sensibility has helped the Sydney new land
suggested that affordability across the North market to retain market share and to see its
West has been improved via the introduction role increase.
of additional supply and more importantly
competition. The estimated affordability gain
would be equal to 8% of the median Sydney
house price.
31NLSP Summary Table
Average
Annual
Number of Annual Median
Annual Net Lot Active Estates Median Lot Annual Median Land Price
Sales per Quarter Size (sqm) Lot Price ($/M)
2009 2,378 38 520 $269 $517
2010 3,337 41 524 $293 $560
2011 3,771 48 498 $295 $592
2012 4,344 63 508 $295 $580
2013 8,206 67 509 $323 $635
2014 8,712 49 456 $340 $745
2015 7,659 54 455 $440 $968
2016 9,909 87 402 $463 $1,154
2017 9,269 83 396 $476 $1,202
Source: National Land Survey Program
up
Gro
erty
s Prop
r
ase
s by Fr
se
hou
es and
rrac
32 ill te
tney H
: Pu
ImageSYDNEY
Sydney NLSP Greenfield Sub-Market Reporting corridors: Median Lot Price (Q4
2017) & Annual Price Growth (2017)
Source: National Land Survey Program
3320
Image: Marina Square
By Billbergia GroupSYDNEY
UDIA NSW SYDNEY LAND SUPPLY FORECAST
UDIA NSW, based on consultation with key There is deep concern across UDIA NSW
development industry participants, expects a members on the medium and longer term
gradual increase in greenfield lot production over impact on greenfield supply from various
the next five years. policy and regulatory changes – both
announced and in the wind. The uncapping
Based on the traditional historical of Section 94 charges and new draft Special
development split of 70:30 between infill Infrastructure Contribution (SIC) levies being
and greenfield dwelling production, Sydney foreshadowed by the NSW Government adds
will need to produce a minimum of 12,375 to uncertainty – which is translating into a
greenfield lots per annum for the next slow-down in development site acquisition
twenty years in order to meet current NSW activity – particularly in the fragmented
Government forecasts for a additional 1.7 North West Growth Centre. The downstream
million people to 2036. consequences of reduced acquisition activity
(particularly from the medium and smaller
The latest UDIA NSW forecasts indicate scale developers) is difficult to accurately
development industry capacity to exceed this quantify however it is certainly likely to impact
annual benchmark production figure across on the depth of the forward supply pipeline.
each of the forward years to 2021/22. This is,
however, contingent on various supportive
factors remaining in place including
maintenance of the current demand profile.
5 Year
Council 2017/18 2018/19 2019/20 2020/21 2021/22 Forecast
Camden 2,860 3,000 1,960 2,190 2,300 12,310
Liverpool 1,650 1,850 1,550 1,700 1,400 8,150
Campbelltown 960 1,700 1,700 1,700 1,450 7,510
Wollondilly 250 800 1,150 1,000 1,300 4,500
Fairfield - - 100 100 100 300
Sutherland 160 - - - - 160
Penrith 400 1,100 1,050 1,350 1,200 5,100
Blacktown 3,600 2,950 3,100 3,300 3,250 16,200
The Hills Shire 2,400 2,400 2,500 2,700 2,500 12,500
Hornsby - - 200 200 - 400
Northern Beaches - - 200 200 200 600
Hawkesbury 300 400 400 450 450 2,000
Total 12,580 14,200 13,910 14,890 14,150 69,730
Source: UDIA NSW Land Development Committee
35SYDNEY
MULTI-UNIT|INFILL ANALYSIS
The significant lift in overall dwelling supply Sydney has the most geographically diverse
being brought to market across the Greater supply of new units with completions
Sydney region over the last four years has observed across the Sydney basin. The central
been underpinned by multi-unit production. city and inner city band up to 5km from the
Sydney GPO held 21% of completions in 2017.
CoreLogic estimates that there were a total of 33% of units were then completed in the
28,300 multi-unit completions in 2017 which 5-10km band, followed by 28% in the 10-
represents a 6% increase on 2016 and 68% on 20km band followed by 18% in the 20-50km
the volume achieved in 2014. band.
Sydney holds the most expensive multi-unit The broad geographic spread of new unit
stock in the nation with the median price for supply is underscored by the point that the
new product sales in 2017 sitting at $710,000. second and third ranked postcodes in terms of
This median pricing reflects settled sale new unit supply were postcode 2127 (Sydney
transactions and represents a 37% premium Olympic Park/Newington/Wentworth Point)
on median sales pricing in Melbourne and and postcode 2118 (Carlingford/Kingsdene) is
63% premium on Brisbane – the other major located in the 10-20km middle ring band.
capital city multi-unit markets.
It is expected that 2018 will present a year
The median weekly rental asking price in of modest price growth for the broader
2017 across Greater Sydney was $520 which Sydney market with sales volumes for
reflected a 1.9% growth on the 2016 rate. new apartments trending downward
The vacancy rate at December 2017 was 3.8% following slowdowns in obtaining approvals,
which was the lowest of the major capital particularly for major multi-unit projects.
cities. These slowdowns resulted, in part, from the
planning hiatus of Council mergers and 18
The very strong demand profile driving the months of Draft District Plans preparation
Sydney apartment market showed various and amendments from the Greater Sydney
signs of softening across 2017 in response, Commission – causing industry uncertainty.
in part, to tighter macroprudential measures
and a crack-down on foreign investors. Price It is feared that these approval slowdowns will
growth plateaued across the broader market be reflected in falling completions over the
in 2017 with various sub markets experiencing medium term and the high levels of supply
modest price growth corrections. added to the market over the past few years
will not be replicated – despite demand
remaining at a similarly high level.
Multi-Unit Summary Table
Annual
2017
Change
Median Multi-Unit Settled Sale Price
$710,000 -0.70%
(new stock/first time sales)
Total New Multi-Unit Completions 28,300 5.8
Median Multi-Unit Rental Asking Price - per week
$530 1.90%
(all of market)
3.8% 4.2%
Multi-Unit Vacancy Rate (all of market)
(Dec 2017) (Dec 2016)
Source: CoreLogic
36Median New Unit Price & Annual Unit Completions
Source: CoreLogic
Multi-Unit Completions by 2017, by postcode
Source: CoreLogic; UDIA
37BROADER MARKET TRENDS
The Sydney housing market performance Elevated net overseas migration (NOM)
across 2017 was underpinned by high has been the driver behind higher levels of
population and solid employment growth. population growth into the Sydney market. In
An estimated total of 94,000 additional the twelve months to June 2017, 81% of net
people were added to the base metropolitan population growth was attributable to NOM
Sydney population in the 12 months to June across NSW, as compared to an average of
2017. This is the highest population gain 62% for the 2013-2015 period.
recorded over the last twenty five years, over
which time the average has been 53,740 Newly arrived migrants from various
net population growth. The current NSW Asia Pacific nations including China, India
Government population forecasts (medium and Korea are strongly represented in
series) indicate that an average growth in the the contemporary NOM profile. This
population of 85,000 per annum is expected has translated into elevated demand for
for the next two decades to 2036. Accordingly, apartments (in particular) across metropolitan
this (approximate) level of population growth Sydney, as apartment living is the accepted
achieved in 2017 should be the expected as norm in the country of origin for many of the
the ‘new norm’. new arrivals.
In the latest CommSec ‘State of the States’
"THE 2017 SYDNEY MULTI-UNIT MARKET economic performance report card (January
RECORD DELIVERY OF 28,300 HOMES 2018), NSW secured the top ranking on five
- 73% OF ALL NEW HOUSING STOCK out of the eight economic indicators: retail
IN 2017 - RESULTED FROM PLANNING trade, dwelling starts, equipment investment,
DECISIONS TAKEN IN 2013, 2014 AND construction work and unemployment. As a
2015. THE DRAMATIC SLOWDOWN IN result NSW was ranked on top of the national
MAJOR PROJECT APPROVALS IN 2016 performance rankings – a position maintained
AND 2017 WILL PREVENT THESE LEVELS across 2017. The cornerstone to this outcome
FROM BEING ACHIEVED IN COMING has been strong population growth which
YEARS. UNCERTAINTY CAUSED BY has underpinned the housing market
COUNCIL MERGERS AND ITERATIONS performance.
OF ‘DRAFT’ DISTRICT PLANS HAS HAD
THE UNINTENDED CONSEQUENCE
OF CREATING UNCERTAINTY FOR THE
INDUSTRY AND PLANNING AUTHORITIES
ALIKE. COUPLED WITH GOVERNMENT
AND BANKING INITIATIVES AIMED AT
LIMITING INVESTOR PURCHASES OF
NEW HOUSING, THIS WILL ULTIMATELY
INCREASE THE COST OF RENTAL HOUSING
AS SLOWING SUPPLY TIGHTENS THE
RENTAL STOCK OVER THE NEXT TWO TO
THREE YEARS."
Rick Graf, Development Director
Billbergia Group
nts
pme
elo
Dev
ove
ringC
By Sp
e
38 Estat
ove
gC
Sprin
ge:
ImaYou can also read