2020 The Land National Residential Greenfield and Apartment Market Study - Urban Development Institute of Australia
←
→
Page content transcription
If your browser does not render page correctly, please read the page content below

UDIA State of
    The Land                    2020
    National Residential Greenfield and Apartment Market Study

1
Glenside by Cedar Woods

                                             2020 STATE OF THE LAND SPONSOR

                                   2020 STATE OF THE LAND RESEARCH PARTNERS

Front cover images:
West Village by Sekisui House Australia
Parkville by Oliver Hume
Cirque Mount Pleasant by Stirling Capital
Arundel Springs by Villa World
  1
Oceanside   by Stockland
Welcome to 2020 annual State of the Land report
                            At a time of flux in housing markets, the Urban Development
                            Institute of Australia (UDIA) State of the Land report remains the
                            industry’s most crucial and comprehensive overview of new home
                            and apartment markets across our capital cities.
                            We know how important new dwelling construction is to the
                            national economy – with direct and indirect output generating
                            more than $300 billion in economic activity, or 7.5% of the national
          Simon Basheer
                            economy. Jobs, wages and prosperity up and down supply chains
                            depend on housing construction.
          UDIA National
          President         So too do the dreams of home ownership for millions of
                            Australians. The State of the Land report provides robust analysis
                            and insights into the fortunes of the sector across our capital cities.
                            An important feature of this report is its ability to deep dive into the
                            supply pipeline. Official data suggest other elements of the housing
                            market – prices and loan approvals, for example – have begun to
                            stabilise after two years of decline.
                            Notwithstanding recent improvements in market activity in terms
                            of sales and finance availability, the State of the Land report reveals
                            that in 2019 land sales and new home construction remained soft
                            and median prices were flat.
                            That is why so much of UDIA National’s advocacy efforts are geared
                            towards working with governments to boost supply pipelines –
                            breaking the back of inefficient planning systems, streamlining red
                            and green tape and reducing excessive property taxes.
                            We need to foster a balanced market that better matches supply
                            to demand and reduces the risk of escalating price rises that freeze
                            out homebuyers.
                            Producing these reports takes the time, commitment and
                            collaboration of our partners and we greatly value their work.
                            Research4 and CoreLogic serve as our research partners and
                            deserve credit for the quality and comprehensive nature of their
                            work. I’d also like to commend the endeavours of the team in
                            the UDIA NSW office which took the lead on the report this year
                            and each of the other UDIA State offices which contribute to the
                            project.
                            We hope you find it a valuable resource and look forward to
                            continuing to work with you on critical issues facing the industry in
                            the year ahead.

                                                                                                       2
The Grange at Marsden Park by Winten Property Group
MUSE by HELM

                              CONTENTS
                   National Residential Market Overview    6
                   South East Queensland                  23
                   Sydney                                 33
                   Melbourne                              43
                   Adelaide                               53
                   Perth                                  63
                   ACT                                    73

3
UDIA State of the Land 2020
Greenfield Summary
NEW RELEASES (2019) Annual Change
NATIONAL ANNUAL LOT SALES TRADING MONTHS OF STOCK (as at Q4 2019)
11,964
2017
MEL 36%
Melbourne 4.6
SEQ 8,188 29% 53,544 SEQ 4.2
PER 6,763 1%
2018 Perth 9.2
SYD 4,864 26% 39,434 Sydney 2.6
2019 Adelaide 6.2
ADL 2,494 19% 28,000
ACT 5.6
ACT 1,470 9%
NATIONAL ANNUAL MEDIAN LOT SIZE (sqm) MEDIAN LOT PRICES (2018 v 2019)
505 498 500 493
2018
472 $488k $457k
456 451 2019
$459k
$423k
428 428 421 $339k
417 $330k
$266k $271k
$222k
$217k $175k $179k
2009 2010 2011 2012 2013 2014 2015 2016 2017 2018 2019 Melbourne SEQ Perth Sydney Adelaide ACT
Multi-Unit Summary
NEW UNIT COMPLETIONS (2019) Annual Change
UNIT VACANCY RATES (as at Q4) UNITS PIPELINE (as at Q4 2019)
SYD 26,992 14% SYD 84k 67k 39k
MEL SYD
MEL 22,782 9% 4.4% SEQ MEL
49k 58k 33k
2.8%
SEQ 12,586 7% 3.6% PER SEQ
17k 35k 10k
17k 13k 5k
PER 4,288 45% PER Total Early Planning
ADL
5.5%
Total Approved
ADL 3,227 90%
ACT ADL
4k 2k
2.8% 5k Total Under Construction
2.4% 18k 6k
ACT 2,413 14%
ACT
4k
ANNUAL NATIONAL NEW UNIT COMPLETIONS MEDIAN SALE PRICE OF NEW UNITS (2018 v 2019)
83,516
75,089 73,256 72,288
62,689 $739k
$712k
Sale Price 2018
49,356 $565k $605k Sale Price 2019
42,114
36,994 $435k $430k $395k $445k $470k
$368k $370k $385k
2012 2013 2014 2015 2016 2017 2018 2019 Sydney Melbourne SEQ Perth Adelaide ACT
4
UDIA State of the Land 2020
Capital City Market Performance Dashboard – Annual Change (2018 – 2019)
                             Greater    Greater    Greater    Greater
                     SEQ                                                  ACT
                             Sydney    Melbourne   Adelaide    Perth

                     -7%     -16%        -6%        47%        5%         -9%
  Total Market
     Supply

                    -26%     -25%        -48%        -7%       -3%        51%
  Greenfield Lot
      Sales

                                                                                  Greenfield Market
                    -29%     -26%        -36%       -19%        1%         9%
 Greenfield Lot
   Releases

                     2%       -6%         -3%        3%        -2%        -8%
  Greenfield
Median Lot Price

                    435sqm   380sqm     395sqm     449sqm     375sqm      494qm
 Greenfield
Median Lot Size

                    -26%       0%        -16%         1%       -26%       -13%
 Multi-Unit Sales

                                                                                  Multi-Unit | Infill Market
 Volume (New)

                     -7%      -14%        9%         86%       45%        -14%
    Multi-Unit
   Completions

                     -2%       -4%        7%          1%        -3%        4%
Multi-Unit Median
 Sale Price (New)

                     -46%      -6%       -15%        -1%       20%        24%
     Under
  Construction

   5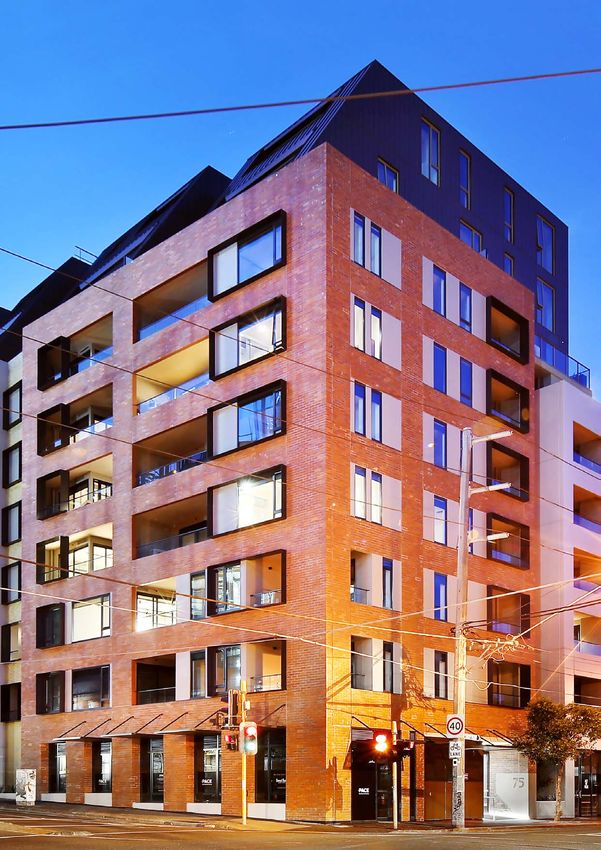
NATIONAL RESIDENTIAL
MARKET OVERVIEW
The national development industry encountered           Perth
a challenging operating environment at the
commencement of 2019. This was highlighted by             •      New residential supply completions in the
soft demand in most capital city markets as the                  metropolitan region remain subdued and was
housing correction continued to unwind in the midst              26% lower than the 7-year average.
of political uncertainty with the federal election on   Adelaide
the horizon. The tide began to turn mid-year with
a rebound in consumer confidence and improved             •      Recorded a 48% annual increase in completed
access to finance translating into heightened levels             new market supply in 2019, which was driven
of sales transactions and dwelling value growth.                 by a significant lift in multi-unit completions.
 •    A combined total of approximately 117,000[1]      ACT
      new homes were completed in greenfield
      release areas and urban infill locations          •      Saw an annual reduction in completed new
      across the major capital cities in 2019. This            market supply in 2019 (-9%) which was driven
      represented an 7% reduction in annual market             primarily by a fall in multi-unit completions.
      supply and the lowest quantum of completions
      since 2015.                                       Combined Capital City New Residential
 •    UDIA estimates that there were approximately      Market Supply
      43,000 completions of detached houses in the
      nation’s greenfield release areas in 2019 which
      represented a 15% annual retraction. This
      reduction in greenfield output underpinned the
      overall combined market supply pull-back.
 •    Of the 380,000 new dwellings delivered over
      the last three years (2017-2019), 60% have
      been multi-unit stock. At a combined capital
      city scale apartments, townhouses and other
      medium density dwellings are the dominant
      new residential supply typology.                  *UDIA estimates
                                                        Source: UDIA; CoreLogic; Research4
Melbourne
 •    Continues to provide the largest volume of
                                                        Capital City New Residential Market
      year-on-year housing supply across the capital
                                                        Supply
      cities with a total of 41,600 new dwellings
      completed in 2019.
Sydney
 •    Achieved a total supply output of
      approximately 34,100 dwellings in 2019. This
      was a 16% annual reduction in completions,
      with lower supply from both greenfield housing
      (-23%) and multi-unit (-14%) projects.
SEQ
 •    Recorded a 7% annual reduction in new             *UDIA estimates
      dwelling completions, driven by retraction        Source: UDIA; CoreLogic; Research4
      in both multi-unit and greenfield housing
      completions.                                      [1] This figure includes annual estimations of detached houses being completed in greenfield
                                                        release areas, and multi-unit projects being completed across each of Australia’s major
                                                        metropolitan regions. There are additional dwelling completions which are not covered under State
                                                        of the Land reporting including small scale infill subdivisions and secondary/knock down rebuild
                                                        dwellings. As such the combined new market supply estimates are likely lower than actual realised
                                                        new supply.

                                                                                                                                                            6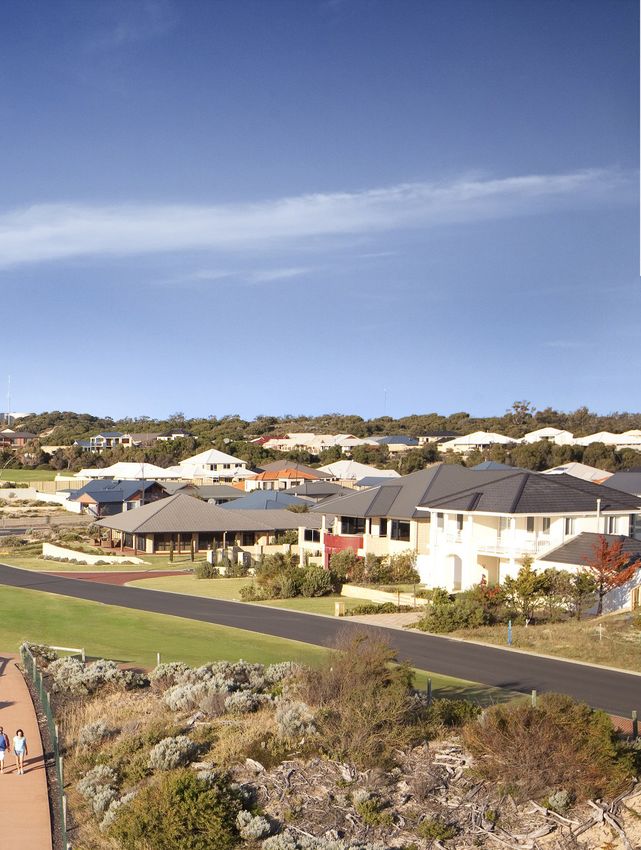
NATIONAL RESIDENTIAL
    MARKET OVERVIEW
    GREENFIELD MARKET ANALYSIS
    The National Land Survey (NLS) undertaken by Research4 provides the core market intelligence underpinning
    the State of the Land's greenfield market analysis. The following summary paragraphs highlight the key
    capital city comparative headline trends for 2019.

    Lot Production
     •   National residential lot production declined       •   Sydney recorded a 26% decline in lot
         by 25% in 2019, with a total of 35,740 lots            production in 2019 to total just 4,860 releases.
         released across the capital city markets.              This is the lowest annual quantum released
                                                                since 2013 and reflects extremely modest
     •   Melbourne maintained its prominent role as             releases in the first half of the year, however
         the nation’s largest greenfield market with            production improved considerably in the
         a total production of 11,960, lots despite             second half.
         recording a startling 36% annual decline.
                                                            •   Adelaide's developers released 19% less
     •   SEQ recorded a 29% retraction in lot output in         annual lots in 2019, with a total of 2,490
         2019 with a total of 8,190 releases, although          releases.
         it still comfortably retained the mantle of the
         second largest greenfield market in the country.   •   The ACT was the only market which recorded a
                                                                notable year-on-year increase in lot production
     •   The continuation of challenging market                 output (+9%) in 2019 with the release of 1,470
         conditions in Perth is underscored by another          lots.
         year of modest output with a total of 6,760
         releases which, while 1.3% above the 2018
         output, represented a 23% decline on the ten-
         year average.

          Annual lots Released

          Source: UDIA; Research4

7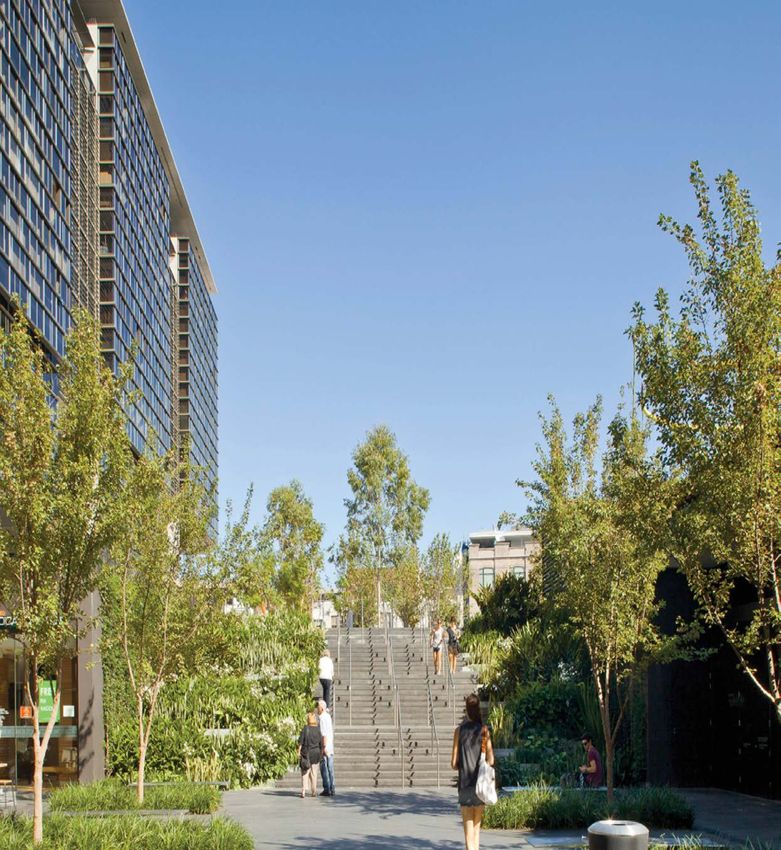
Lot Prices ($)
 •   Median lot pricing declined across many of the         •   SEQ recorded a 2% annual price growth to
     nation’s greenfield markets in 2019.                       $270,800. At this median price-point level SEQ
                                                                holds a considerable affordability advantage
 •   For the first time since 2013, Melbourne                   over the other two major east coast housing
     recorded an annual decrease in median lot                  markets, being 70% cheaper than Sydney and
     pricing, dropping by 3%, to finish the year at             22% cheaper than Melbourne.
     $330,300.
                                                            •   Perth’s median lot pricing declined 2% in 2019
 •   The nation’s most expensive greenfield market,             to $217,000 (which was the fifth straight year
     Sydney, recorded a 6% drop in median pricing               of price reduction) and the ACT saw median
     in 2019 with a year-end lot price of $458,900.             pricing retract 8% to $423,000.
     This is the first annual pricing decrease
     recorded for Sydney over the NLS time series of        •   Adelaide recorded an 3% annual price increase
     10 years.                                                  in 2019 to $179,500 and remains Australia’s
                                                                most affordable market by some margin.

      Median Lot Price

      Source: UDIA; Research4

Land Price ($/sqm)
The reduction in lot prices coupled with the minimal rise in lot sizing has delivered further slight decreases in
the price of land on a per square metre basis.
 •   Sydney's land price dropped 7% to $1,209 per sqm.
 •   ACT recorded an 8% reduction in land price to $856 per sqm.
 •   Melbourne’s land price declined 1% in 2019 to $837 per sqm.
 •   SEQ recorded 1% growth in land pricing to $622 per sqm.
 •   Perth's land price retracted by 2% to $579 per sqm.
 •   Adelaide recorded a 4% annual reduction to $400 per sqm.

                                                                                                                    8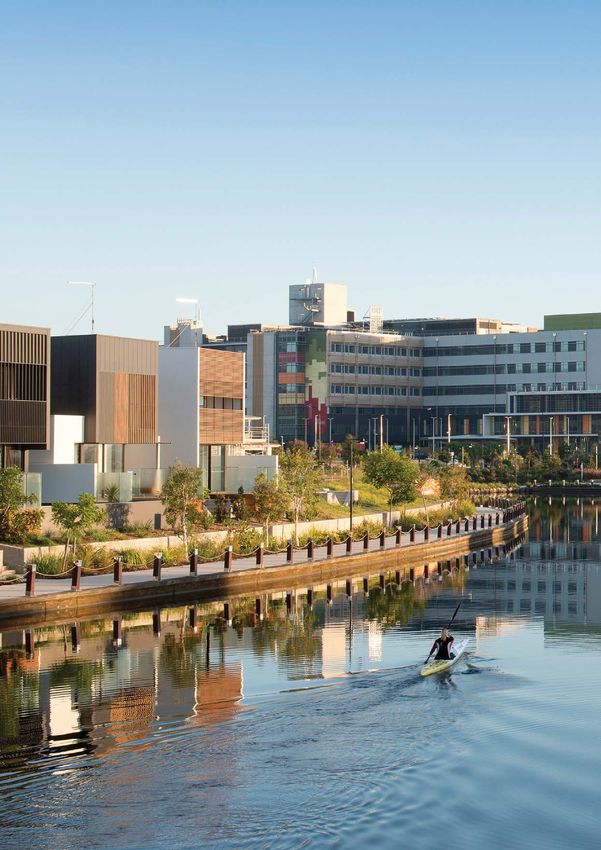
NATIONAL RESIDENTIAL
    MARKET OVERVIEW
         Median Land Price

         Source: UDIA; Research4

    Lot Sizes (sqm)
    •   The trend of declining lot sizes highlighted in previous State of the Land reports has paused in 2019 with
        only Melbourne and SEQ recording smaller median lot sizes than the preceding year. Perth retains the
        smallest median lot sizes in the country at 375 sqm, while Sydney finished 2019 at 380 sqm with a 1%
        annual size increase.
    •   The largest median lot sizes are still found in the nation’s capital with the ACT recording a 1% increase in
        lot sizing to finish 2019 at 494 sqm.

         Median Lot Size

         Source: UDIA; Research4

9
West Village by Sekisui House Australia 10
NATIONAL RESIDENTIAL
     MARKET OVERVIEW
     MULTI-UNIT MARKET ANALYSIS
     This year’s State of the Land overview of the residential multi-unit/urban infill markets across the capital
     cities utilises an expanded suite of customised and exclusive data provided by CoreLogic.
     The term 'multi-unit' in this report refers to the following residential typologies: apartments/flats/units/row/
     terrace/townhouse. Other categories of multi-unit development including aged care/retirement and student
     housing is excluded from the analysis.

     Median New Unit Sales Price and Volume
     Key Findings: Sales Pricing                                  Key Findings: Sales Volumes
      •   Sydney recorded a 4% annual contraction of                •   Multi-unit sales volumes of new supply
          new unit pricing to average $712,000, which is                remained subdued across the capital cities in
          44% more expensive than the combined capital                  2019.
          city new unit average of $495,000.
                                                                    •   Sydney recorded 7,913 settled new unit sales
      •   Melbourne recorded a 7% annual price growth                   in 2019 which is down 72% from the 2015
          in 2019 to record a new unit median price of                  peak.
          $605,000, which was 15% cheaper than Sydney
          and 22% above the combined capital city                   •   Melbourne's annual new multi-unit settled
          average.                                                      sales volume (5,095) was 76% below the 2016
                                                                        peak, despite increasing 26% since May 2019.
      •   SEQ new unit prices rose by 2% over the year,
          recording a median new unit sale price of                 •   Perth new unit sales fell by 26% over the year
          $458,000.                                                     to 1,536 units.

      •   Perth continued its ongoing pricing contraction           •   There were 1,337 settled new unit sales in SEQ
          in 2019 (down -3%) to finish the year at                      in 2019, the lowest amount seen in the last
          $385,000. This reflects a 20% reduction for new               decade.
          unit stock pricing since 2014.                            •   Adelaide recorded 792 settled new unit sales
      •   ACT units saw the highest median sale value                   in the year, similar to 2018 levels.
          growth across the capital cities, going up 6% to          •   ACT multi-unit sales also remained low at just
          $470,000.                                                     300 annual settled sales.
      •   Adelaide's new unit pricing remained flat at
          $370,000, confirming Adelaide as the most
          affordable multi-unit market in the country,
          being 34% cheaper than the combined capital
          city average and 92% cheaper than Sydney.

                                                                                          rojex
                                                                                      meP
                                                                                y For
                                                                             02b
                                                                       ta ge
11                                                                o .S
                                                             le&C
                                                        Hurt
Annual Median New Multi-Unit Sale Price
Source: UDIA; CoreLogic
Annual Median New Multi-Unit Sales Volumes
Source: UDIA; CoreLogic
12Multi-Unit Completions
• There was a 2% annual reduction in total • Melbourne recorded 22,800 multi-unit
multi-unit dwelling completions in 2019 across completions in 2019 which represented a 9%
the combined capital cities, with a total supply increase on 2018 volumes.
yield of 69,090 units. While this was the lowest
output since 2015 it still reflected an 16% • Brisbane supply reduced by 15% in 2019 with
increase on the long run average. a total volume of 9,150 units completed. This
production output still comfortably positioned
• Sydney and Melbourne remain the focal Brisbane as the third largest capital city multi-
point for multi-unit production with 72% of unit volume market and was 5% above the long
completions attributed to Australia’s largest run average.
and most mature housing markets.
• The comparatively low volume capital city
• Sydney remains the largest new multi-unit markets saw significant rises. Perth increased
capital city market with a total of 26,990 45% (total output of 4,300 units) and Adelaide
completions in 2019. This was, however, a 14% increased 90% (total output of 3,500 units).
reduction on the 2018 yield and notably the
first drop in volume recorded across the last • ACT recorded a fall in production in 2019 with
ten years. a total output of 2,410 units, which reflected a
14% annual retraction.
Annual Median New Multi-Unit Completions
Source: UDIA; CoreLogic
The geographic distribution of new multi-unit supply across the capital cities varies considerably.
• In Brisbane, Adelaide and Canberra over 60% of all new supply in 2019 occurred within a 5km band
from the CBD.
• This highly centralised supply picture contrasts with the far more even spread of supply recorded in
Sydney, Melbourne and Perth where only 15% to 30% of new supply occurred in the 5km inner band,
with far greater volumes occurring in the middle and outer ring areas.
• The pattern of a broader geographic distribution of new unit supply in Melbourne and Perth is an
interesting feature of the 2019 data which is a marked change from the far more centralised supply
picture reported in last year’s State of the Land report.
13NATIONAL RESIDENTIAL
MARKET OVERVIEW
Multi-Unit Completions by Geographic Zone*
*Measured by distance to Capital City GPO
Source: UDIA; CoreLogic
Multi-Unit Pipeline
CoreLogic has produced point-in-time estimates on the multi-unit pipeline across the capital cities, based on
December 2018 and December 2019 snapshots of their industry leading Cordell Construction database.
Key Findings
• The forward pipeline of possible unit yields (comprising units in the ‘Under Construction’, ‘Approved’
and ‘Early Planning’ categories) has remained steady for both Sydney and Melbourne across 2018 and
2019, at circa 191,000 units and 140,000 units respectively.
• SEQ recorded an overall 23% decrease in potential forward yield in 2019 (to total 61,250 units)
• Perth saw a slight 1% decrease in the 2019 pipeline to total 35,200 units.
• As at December 2019, there was a combined capital city apartment yield of 91,527 units under
construction, with 43% of this stock in Sydney (39,500 units) and 36% in Melbourne (32,500 units).
• The remaining under construction supply was split between Brisbane with 6,240 units (7%), the ACT
with 6,180 units (7%), Perth with 4,930 units (5%), and Adelaide with 2,170 units (2%).
Capital Cities Multi-Unit Pipeline by Status
Source: UDIA; CoreLogic
14NATIONAL RESIDENTIAL
MARKET OVERVIEW
BROADER MARKET TRENDS, NATIONAL
Population
• Population growth is the primary driver of demand for new dwellings. This is reflected in the population
growth profiles across the states, with the largest new home markets of Victoria and New South Wales
attracting most of the recent growth. The latest available demographic data from the ABS shows that,
collectively, Victoria and New South Wales accounted for 65% of national growth over the 2018-19
financial year.
• Victoria recorded a net population growth of 132,785 which reflected an average annual growth rate
(AAGR) of 2.1%. This was the fastest rate of growth across the capital cities but was slightly down from
its 2017-18 growth rate of 2.5%.
• New South Wales added 109,358 persons to the base population at an AAGR of 1.4%, followed by
Queensland which grew by 85,676 persons at an AAGR of 1.7%.
State Population Growth and Annual Growth Rate, 2018-19
Source: UDIA; ABS
Employment Growth
• ABS employment data highlights that the ACT, Victoria, and New South Wales dominated the national
job creation landscape in the last financial year.
• There were 92,000 new jobs created in Victoria at a growth rate of 2.7%, while 96,400 jobs were added
in New South Wales at 2.4%.
• Queensland and Western Australia had more modest employment growth (1.6% and 1.3%), while
South Australia recorded negligible employment growth of just 0.1% and the highest unemployment
rate (6.1%).
• With the nation's lowest unemployment rate (2.8%) and fastest employment growth rate (3.1%), the
ACT displayed the most buoyant capital city economic profile.
15Annual Employment Growth Rates (2019) & Unemployment Rates
(December 2019)
Source: UDIA; ABS
Housing Affordability
• As of June 2019, the median dwelling value to median household income ratio was 8.2 in Sydney and
7.2 in Melbourne according to CoreLogic calculations. This has increased from a ratio of 7.8 and 6.8 in
2014 for Sydney and Melbourne respectively.
• The number of years required to save a 20% deposit has ratcheted up to 11.0 in Sydney and 9.6 in
Melbourne, up from 10.4 and 8.1 years in 2014.
• This measure has remained flat over the period in Brisbane and Adelaide, while it has improved in
Perth.
Housing Affordability Measures (as of June 2019)
Source: UDIA; CoreLogic
• As at June 2019, housing affordability had improved across the nation following a downturn in dwelling
values. This marked a turning point as dwelling values again began to outpace household incomes
across most markets.
16Capital City Dwelling Price to Income Ratios
Source: UDIA; CoreLogic
• The deterioration of housing affordability in our largest population centres relates to substantial
increases in dwelling values while wage growth has been relatively benign. There are a host of drivers
underpinning house price growth, which include the high rates of population growth coupled with a
generally insufficient supply response. Another key factor is the ongoing increase of government taxes
and charges on development, which ultimately flow through to retail pricing.
First Home Buyers
• Aspiring First Home Buyers (FHBs) are a key group impacted by the housing affordability crisis. Despite
the reality that the hurdles to home ownership have never been higher, an examination of 2018 versus
2019 housing finance data highlights an uptick in the proportional share of FHB activity across the
country. The rise in FHB presence reflects the retreat of investors, moderation in dwelling value growth,
further interest rate cuts and the on-going provision of various FHB grants and subsidies.
First Home Buyers as a % of Total Home Loan Market
Source: UDIA; ABS
17NATIONAL RESIDENTIAL
MARKET OVERVIEW
Dwelling Approvals
• The key to long term sustainable, housing affordability is matching supply with demand, including the
delivery of a diversity of housing products.
• While the development industry has been able to respond to the significant increase in demand over
the last four years, the reality is that Sydney and Melbourne (in particular) will need to continue to
deliver supply at these historically high levels year-on-year for the next two decades.
• The subdued market conditions in 2018 and the first half of 2019 have precipitated a free-fall in capital
city dwelling approvals which puts significant doubt on whether the forward pipeline can sustain the
production levels needed to keep pace with population growth.
• Over the 2019 calendar year dwelling approvals fell:
31% in Sydney;
27% in Melbourne;
33% in Brisbane;
11% in Perth;
9% in Adelaide and;
40% in the ACT.
Capital City Dwelling Approvals, 2018 and 2019
Source: UDIA; ABS
18RECOMMENDATIONS
The transformation of Australia’s cities and regions Australia has the capital, the land and, above
continues to escalate. Rapid population growth, all, a well-credentialled housing industry to fix
densification and demographic and technological the problem. Our 2020 National Policy Priorities
change are combining to reshape our urban document, ‘Building a Better Australia’ chronicles
environments. the recommendations we make to government
to improve housing affordability, boost economic
Every policy lever available to governments across growth and sustain jobs.
the nation needs to be harnessed in the name of
improved liveability. Central to this challenge is We look forward to working with our members and
housing affordability. governments to deliver on them.
The State of the Land report is a timely reminder of 1. Streamline Environmental Planning Practices
the long-term challenges facing Australia’s housing
markets. UDIA National recommends using the
Commonwealth’s independent review of
There are tentative signs of a recovery in demand the Environment Protection and Biodiversity
and improved access to credit; yet supply pipelines Conservation (EPBC) Act to achieve the following
are thin. If the trend continues, the collision priorities:
between stronger demand, increasing pricing and
stalled supply will fuel another cycle of diminishing 9 Ensuring proposed listings of matters
affordability. of national environmental significance are
underpinned by clear evidence and science
That is why the Urban Development Institute – and accompanied by a Regulatory Impact
of Australia (UDIA) is actively collaborating with Statement which also details potential
federal, state and local governments on designing economic impacts;
fit-for-purpose policy solutions.
9 Progress towards the ‘one-stop shop’
Sound population policy allows us to more premise that underpins the EPBC Act and
accurately forecast and plan for growth. Robust absorbs lessons from existing processes which
infrastructure investment lets us to stay ahead work well;
of the congestion curve. Understanding growth
corridors affords us the opportunity to plot and 9 A fixed timeline for completing bilateral
construct the next generation of housing. agreements and strategic assessments (as
well as updating existing bilateral agreements)
However, we also need to remain focused on to strip out duplication and eliminate
the regulatory barriers across land use planning, opportunities for different tiers of government
development approval systems, and red and green to revisit earlier assessment outcomes;
tape that inhibit good development.
9 Development and application of statutory
Where governments are responding well, we timeframes for responding to applicants, and
applaud their actions. More sensible lending introduce the concept of ‘deemed consent’
standards, better population and settlement when they are not met;
analysis, new investment in rail networks, a deeper
understanding of housing markets and a review of 9 Providing a simpler and more effective
green tape are welcomed. regime for offsets;
There is more work to do however and over the 9 Lifting the quality, consistency and
year ahead UDIA will be seeking stronger efforts transparency of guidance – particularly
by governments to streamline environmental through the referral process.
approvals, address inefficient planning systems,
coordinate cities policy and overhaul inefficient
and inequitable taxes on property.
d
Worl
il la
yV
g sb
prin
19 el S
nd
Aru2. Busting the Barriers to Housing Supply 3. Reducing the Red Tape on Housing
The expanded mandate for the National Housing UDIA urges the Commonwealth to unveil a new
Finance and Investment Corporation (NHFIC) should productivity agenda to spur housing supply by
include: designing a framework for using incentives to
improve housing supply, land release and planning
9 Welcoming industry leadership and dialogue systems. This includes:
to the table, with the appointment of private
sector leaders to an advisory group to help 9 Analysing the best method for utilising the
inform research priorities and outcomes; Commonwealth’s balance sheet strength to
encourage state and local governments to act;
9 Aligning populated data from the pending
Intergenerational Report and new Centre 9 Testing the capacity for the National
for Population with the analysis that informs Affordable Housing Agreement (NAHA), City
NHFIC’s supply and demand estimates; Deals and Commonwealth investment in
infrastructure to serve as the best vehicle for
9 Introducing financial incentives that prompt driving change;
state and local governments to pursue genuine
planning and approvals reforms and meet 9 Establishing a series of benchmarks that
housing supply targets; state and territory governments will need to
meet to access incentive payments, including:
9 Identifying and recommending removal
of inefficient red and green tape, as well as • The capacity of strategic plans and land
statutory charges, that act as both a handbrake release programs to meet population
and a cost impost on the delivery of new projections and housing demand;
housing;
• Improvements to major project
9 Mapping the current mix of taxes, charges assessment regimes to lift the efficiency
and levies which are imposed on new housing of land release and housing development;
– and establishing a league table benchmarking
the states and territories; • Ongoing progress against housing supply
targets for greenfield and brownfield
9 Assessing the relative efficiency (or housing.
inefficiency) and equity (or inequity) of each
tax, charge or levy – and chart a short, medium • Red tape reduction targets that seek to
and long-term path for eliminating taxes that reduce both the quantum of regulatory
are better captured through more equitable costs imposed on new housing, and
and broad-based revenue measures; individual priority areas (such as
depoliticised development assessment);
9 Refining the income thresholds attached to
the First Home Loan Deposit Scheme to ensure • Measures to demonstrably reduce the
they are tailored to reflect the intersection of time taken to progress developments
house prices and incomes in different cities; through each phase of the approval
process (ie: subdivision to development
9 Aligning house price caps under the Scheme approval).
with state-based first homebuyer stamp duty
concession thresholds.
20RECOMMENDATIONS
4. Leveraging Infrastructure to Diversify Housing 5. Aligning the Agenda
Stock
Building national prosperity, fostering stronger
The Commonwealth Government should be cities and delivering more housing that meets the
seeking a better return on its substantial outlay on needs of the market today and generations to come
infrastructure via project partners across the states, requires good and efficient government.
territories and local government, including:
In the interests of aligning the work across
9 Identifying and securing long-term growth government in support of these goals, UDIA National
corridors – for both infrastructure and housing recommends:
– to ensure they are aligned to population
forecasts and strategic plans; 9 Using the refresh of the Intergenerational
Report in 2020 to establish a common baseline
9 Auditing all current infrastructure projects of data and assumptions that feed into all
– as well as proposals from states and policy making;
territories – to interrogate whether land use
opportunities are being maximised; 9 Consistently applying the new population
projects to underpin the work of government
9 Linking infrastructure investments to local agencies and initiatives, starting with:
regions prepared to accept their fair share of
population growth and housing supply; 9 The National Housing Finance and
Investment Corporation;
9 Increasing the focus on local-scale
infrastructure which can generate significant • Infrastructure Australia;
improvements based on a small spend and in • The Centre for Population and National
turn kickstart new housing; Population Plan, and;
9 Charting and removing the barriers to the • The National Cities Performance
delivery of more diversified housing stock, Framework.
particularly Build-to-Rent and mixed tenure
affordable housing; 9 Ensuring states and territories devise
strategic land use and infrastructure plans
9 Planning for the ageing population by based on these common population
ensuring the diversity and facilitation of projections;
housing choice for seniors is accommodated.
9 Crafting an Infrastructure Accord that seeks
to immunise the identification, funding and
delivery of major infrastructure projects from
partisan politics;
9 Establishing a rolling pipeline of City Deals
to strategically invest in and plan growth ‘hot
spots’ across our cities and regions – and
benchmark the performance of ones already
underway.
2122 Jordan Springs by Lendlease
SOUTH EAST
                      QUEENSLAND
                      SUMMARY

                       •       The SEQ region recorded an 11% annual reduction in new dwelling
                               completions in 2019 which was driven primarily by a contraction in
                               multi-unit completions.
                       •       While the combined (greenfield and multi-unit completions) new
                               market supply was lower than the yield achieved in 2018 it still
                               remained 13% higher than the long run average.
                       •       The marketplace remains challenged in many areas due to lower
                               demand following unprecedented multi-unit supply in 2015/16 and
                               moderated new lot sales from 2017/18.
                       •       Restrictive lending had a severe impact on local investors,
                               confidence, and home buyer purchasing power, with investor
                               activity well below long term levels.
                       •       Lot and apartment sales remain subdued but well placed in terms
                               of value to buyers. Increased activity is expected in 2020, provided
                               government regulatory frameworks do not impact adversely on the
                               forward supply pipeline.

                      New Residential Market Supply[1]

                      *UDIA Estimates
                      Source: UDIA; CoreLogic; Research4
                      [1] This figure includes annual estimations of detached houses being completed in greenfield release areas, and multi-unit projects being
                      completed. There are additional dwelling completions which are not covered under State of the Land reporting including small scale infill
                      subdivisions and secondary/knock down rebuild dwellings. As such the combined new market supply estimates are likely lower than actual

Seachange Riverside   realised new supply.

Coomera by
   18 Property
   23
Pradella
Ventures
GREENFIELD MARKET ANALYSIS
Sales and Release Activity
• The market recorded a 26% reduction in annual • Sales volumes were low, particularly in the June
land sales in 2019 to average 642 net lot sales quarter when there were just 535 net lot sales
per month. This reflects a maintenance of a per month, resulting in a build-up of unsold
two-year declining trend in land sales activity inventory. This translated into a 6-year annual
from the 2017 peak when an average of 1,030 average high of 5.6 trading months held in
net lot sales per month were being transacted. stock.
• Industry responded to the softer market • Stock levels now appear to be dropping with
conditions by releasing lower levels of stock in clearance levels moving up to 120% of that
2019, with a total of 8,188 annual lot releases, produced.
which was 29% lower than 2018 and 41% lower
than 2017.
Annual Greenfield Activity
Source: UDIA; Research4
Active Estates & Industry Capacity
• Actively trading estates were down across • Despite the lower levels of competition, the
the year with the highest count in the March industry profile in the December quarter is
quarter with 180 estates leading to the assessed by the Research4 Development
December quarter closing with 161 estates. Capacity Ratio (DMR) as a ‘balanced market’
with production potential for 2.4 lots for every
• The lower levels of active estates across the lot that is required.
year reflects smaller subdivisions (less than 250
lots) not being replaced with new projects.
24Median Lot Pricing
• The December quarter median lot price was • In line with long term trends there was once
$272,000 which represented 51% of the again only minimal growth in the SEQ median
Greater Brisbane established median house lot price across 2019 (+1.9%).
price of $538,000 (CoreLogic) as at November
2019. • The flat-lining of land pricing is a direct result
of the highly competitive landscape across SEQ
• This compares to the long run average of 53% which is keeping a cap on pricing.
of the median house price (across 2009-2018)
indicating that lot pricing is currently under a
‘fair-value’ benchmark and represents a strong
retail value proposition.
Median Lot Price, Land Price ($/sqm) and Median Lot Size
Source: UDIA; Research4
Median Lot Sizes
• The SEQ median lot size for the December • Smaller lots have significant market
quarter 2019 was 428 sqm which reflected a acceptance, and this has helped edge-up per
drop of 4% from December 2018. square metre land rates to $622 per square
metre for the year which is up 1.3% from 2018.
• The gradual retraction in lot sizing reflects the
market seeking to provide a product at a price
affordable to home buyers.
ents
lopm
D eve
a
ess
byT
e s
om
nh
25 Tow
on
o ret
MSOUTH EAST
QUEENSLAND
Greenfield Sub-markets
• The 2019 market performance across the • The state government's Land Supply and
majority of the SEQ submarkets can be Development Monitoring Report indicates low
described as ‘steady’ with marginal movement levels of uncompleted lot approvals relative
in median pricing for all but Ipswich (+9%) and to sales rates in Gold Coast, Sunshine Coast,
Brisbane (-13%). Redland City, Brisbane, and Moreton Bay.
• The median lot prices for the 2019 December quarter for the SEQ LGAs were:
Logan: $218,000
Ipswich: $228,000
Moreton Bay: $271,000
Redlands: $295,000
Gold Coast: $314,000
Sunshine Coast: $327,000
Brisbane: $355,000
Greenfield Market Performance Summary Table
Source: UDIA; Research4
26SOUTH EAST
QUEENSLAND
MULTI-UNIT|INFILL ANALYSIS
Sales Activity
• Multi-unit sales activity in SEQ remains subdued after a steep decline in 2016-2017.
• There was a total of 16,880 settled apartment sales (whole of market) in the year to November 2019;
the lowest level of activity seen in at least the last decade. This is 53% below the peak of 36,100
experienced in 2015, as areas of oversupply, retreat of foreign purchasers and financing restrictions
began to bite.
• Sales volumes for new apartments fell 91% from the peak in 2015 (13,990 sales) to just 1,337 sales in
the 12 months to November 2019.
• The negative growth in sales volumes for the broader apartment market has slowed considerably in
recent years, with the year-on-year decline of 10%.
• As SEQ continues to experience high population growth, UDIA expects the sales activity to improve in
response to an emerging undersupply of apartments. Development activity more recently has focused
on owner-occupier buyers, however investors are expected to reemerge in the coming 12 months.
Multi-Unit Sales, Whole of Market & New Sales (Settled)
Source: UDIA; CoreLogic
Median Unit Pricing
• In contrast to the dramatic movements of sales • This represents a 12% increase on the 2009
volumes, the median price of apartments in price of $356,450.
SEQ has remained relatively stable over the last
decade. • The median price of a new apartment was
$458,700, representing growth of 2% over the
• The median price of all SEQ multi-units year to November 2019, and an increase of
remained at $399,060 over the 12 months to 14% on the 2009 median price of $401,360.
November 2019.
27Construction Activity
• There were 12,580 new apartments completed • The next highest proportion (28%) occurred
across SEQ in 2019. This is down 7% from 2018 greater than 50km from the Brisbane city
and is 9% lower than the long term average. centre, demonstrating the prominence of the
Gold Coast and Sunshine Coast in the SEQ
• This reflects the decline in the SEQ apartment apartment market.
pipeline following a historic high of 17,020
completions in 2017. • Reflecting the above, the top three postcodes
for multi-unit completions were 4000, 4006,
• More than 40% of the new multi-unit and 4101, all in the Brisbane inner city. The
completions in SEQ occurred within 5km of the next highest were 4209 and 4212, both in the
Brisbane city centre, with 4,887 new units built Gold Coast.
in 2019.
Median New Unit Price & Annual Unit Completions
Source: UDIA; CoreLogic
Multi-Unit Active Pipeline Analysis
Source: UDIA; CoreLogic
28Pipeline Analysis
• CoreLogic has produced point-in-time • The total active multi-unit pipeline across SEQ
estimates of the multi-unit pipeline based was 61,240, down 30% from 2018. This is
on a December 2018 and a December 2019 made up of units under construction (down
snapshot of the industry leading Cordell 46%), approved units yet to start construction
Construction database. (down 26%), and units in early planning (down
28%).
• These estimates show that the forward supply
of apartments in SEQ is declining and at risk. • With completions numbers already declining,
it’s likely that a boost in the pipeline in the near
term will be needed to meet future demand.
Multi-Unit Completions 2019, by Postcode
Source: UDIA; CoreLogic
Sub-Market Analysis
• The majority of 2019 apartment sales activity • These regions also fared best in terms of
in South East Queensland occurred in Brisbane price, with the Gold Coast, Sunshine Coast and
City and the Gold Coast, with 6,295 and 6,359 Brisbane City remaining stable over the year.
apartment sales respectively.
• Moreton Bay’s median apartment price fell by
• This was followed by the Sunshine Coast with 5%, while median apartment prices in Redland,
2,152 sales and Moreton Bay with 1,052 sales. Scenic Rim, Logan, and Ipswich all fell by an
average of 7%.
29SOUTH EAST
QUEENSLAND
Multi-Unit Market Performance Summary Table
Source: UDIA; CoreLogic
BROADER MARKET TRENDS
• The population of Queensland increased by • Lot sales per calendar month have been low
85,676 in 2018/19, steady with the previous through 2019 in line with the reduced demand
year and continues the stronger than longer precipitated by financing restrictions.
term average growth.
• Economic and population calculations suggest
• Net interstate migration continues strongly at an underlying demand for around 780 to 800
levels not exceeded since the 2000s. lots per month average for 2020. The industry
will need to watch demand outcomes closely to
• Housing demand is strongly related to growth ensure supply can be brought on.
in employment. Over the year to December
2019 employment growth in Queensland • Multi-unit completions slowed further in many
increased 1.6%. Job advertisements however areas and face headwinds including increasing
have declined 6% from 2017/18 levels. local government requirements. However, with
underlying demand likely to take up stock,
• Underlying demand for all detached and evidenced by declining valuation issues for
attached dwelling types is forecast to average some off-the-plan sales, suggests opportunities
2,427 per month over the coming year. for further development activity in the
apartment market.
30SOUTH EAST
QUEENSLAND
STATE POLICY ENVIRONMENT
• The Queensland development industry has • Other important changes also coming
been challenged to respond to a range of policy through include increased minimum on-
announcements and it looks like there's no let- site carparking standards for apartments in
up in 2020. State Government departments are Brisbane; increased energy infrastructure costs;
moving on a number of fronts with numerous rental reforms; changes to cultural heritage
releases of draft strategies and policies for processes; new bushfire requirements; new
consultation and regulation changes. The rapid building project trust account requirements;
pace of this change represents significant risks and increases to taxes on foreign related
to the smooth delivery of housing to meet the development activity.
population growth needs of the community.
As always, uncertainty is a major threat to • Land supply for greenfield and infill projects
industry operations. is a critical issue, with increasing difficulty
in accessing well serviced affordable land
• Key among the challenges is responding supply stocks, which are a significant driver
to regulation change around the Koala underpinning affordable stock provision for
Conservation Strategy, planning scheme homebuyers. Substantial concerns are present
changes that increase costs on development, for greenfield land supplies in the Redland City,
declining land supply resources and increasing Gold Coast, and Sunshine Coast. In Moreton
reliance on fragmented raw land stocks. Bay good land supply and planning outcomes
have been delayed by structure planning and
• Government has stated that new koala infrastructure issues.
habitat mapping, increased areas of clearing
prohibition and removal of some previous • The industry however has significant hopes
exemptions for new housing in zoned housing for the state government’s Growth Monitoring
areas is expected to remove the potential Program and action on the slow-moving
for 4,300 homes. However, the industry is underutilised fragmented land areas. Early
presently assessing this and expects that outcomes on structure planning and other
with edge effects, continuation and potential tools would enable the industry to better
expansion of local government overlays, the activate these areas in a timely manner. We are
impact will be far greater. also hopeful for more infrastructure investment
from all levels of government that can catalyse
• UDIA QLD’s position is that a more strategic better land supply and liveability in this region.
landscape scale approach should be taken to
koala habitat protection,
ensuring sustainable
corridors and national "The outlook for the SEQ greenfield market is
parks for koalas and other positive on the back of increased infrastructure
species separate from expenditure by the State Government and
urban areas. Our most continued population growth. Environmental
iconic species is not well and planning policy changes have impacted
served by small fragmented supply across all growth corridors and continues
patches of habitat close to to create uncertainty for new investment
highly urbanised areas. and supply. The only impediment to housing
Michael Stone
growth over the short term is the strict bank
General Manager
finance conditions and inconsistent valuations
Development, QLD
the industry has experienced over the past 18
Peet Limited
months."
3132 Oceanside by Stockland
SYDNEY
                   SUMMARY

                     •      Sydney’s new housing market experienced a roller-coaster ride
                            in 2019, featuring a deeply challenging first half of the year
                            followed by a more positive second half of the year, with rebuilding
                            consumer confidence causing the industry to rebound.
                     •      The Sydney housing market recovery was underpinned by the
                            continued stimulus provided by lower interest rates, improved
                            access to home loan finance, and greater certainty following the
                            State and Federal elections.
                     •      New product sales improved markedly in the second half of the
                            year with greenfield lot sales more than doubling and off-the-
                            plan apartment enquiries and sales also picking up strongly in the
                            second half.
                     •      Despite the positive end to the year, Sydney recorded a 16% annual
                            decrease in completed new market supply in 2019 with reduced
                            production across both greenfield housing (-23%) and multi-unit
                            (-14%) project completions, however new market supply was still
                            11% higher than the long term average.

                   New Residential Market Supply[1]

                   *UDIA Estimates
                   Source: UDIA; CoreLogic; Research4

                   [1] This figure includes annual estimations of detached houses being completed in greenfield release areas, and multi-unit projects being
                   completed. There are additional dwelling completions which are not covered under State of the Land reporting including small scale
                   infill subdivisions and secondary/knock down rebuild dwellings. As such the combined new market supply estimates are likely lower than
                   actual realised new supply.
Central Park by
Frasers Property
   18
   33
Australia
GREENFIELD MARKET ANALYSIS
Sales and Release Activity
• The Sydney greenfield market recorded a 25% industry confidence steadily returned through
reduction in annual land sales in 2019 to an the year with December quarter releases
average of 351 net lot sales per month. This totalling a year-high of 1,662 lots.
is the lowest volume of lot sales recorded for
Sydney since 2011, with the 2019 aggregate of • Clearance rates improved across the year, with
4,219 sales down 57% from the peak of 2016. a 100% rate achieved in the December quarter,
as compared to 75% in the March quarter.
• Challenging market conditions lead to the The strong end of the year helped clear a
comparatively low levels of stock released to backlog of unsold inventory, but the sluggish
market across 2019. There was a total of 4,860 clearance rates achieved in the first half of the
annual releases which was 26% lower than year resulted in the average trading months of
2018, with the average quarterly release of unsold stock for the year equalling 5.4 months
1,216 lots being 24% lower than the long-term – up from 3.9 months in 2018.
average (2009-2019). While releases were
particularly low in the March quarter (872 lots),
Annual Greenfield Activity
Source: UDIA; Research4
Active Estates & Industry Capacity
• Despite the low sale and release volumes, the • A number of estates are set to trade-out
average number of active trading estates (81) in 2020, particularly in the South West of
across the year remained in line with the estate Sydney, so new estates will need to quickly
counts recorded in recent years – including replace them to maintain the positive forward
2016 which delivered more than double the production momentum, and retain a healthy
output. competitive trading profile.
34Median Lot Pricing
• The median lot price contracted by 6% across • The December quarter median lot price was
2019 to average $459,000. This is the first time $459,000 which represented 49% of the
negative lot price growth has been observed established median house price of $905,000
for the Greater Sydney market over the 11 (CoreLogic as at Nov19) for Greater Sydney.
years of the NLS time series. This compares to the long run average of 51%
of the median house price (across 2009-2018),
• The moderation of land pricing is a direct indicating that lot pricing is currently under
result of the competitive landscape operational a ‘fair-value’ benchmark and represents a
across the metropolitan area, in addition to positive retail value proposition.
the correction in broader established housing
market values.
Median Lot Price, Land Price ($/sqm) and Median Lot Size
Source: UDIA; Research4
Median Lot Sizes
• The median lot size sold across Sydney in 2019 was 380 sqm which reflects a 1% increase on the 2018
average lot size and has arrested the trend of average block size contraction observed year-on-year
since 2012, albeit only slightly.
• In line with median lot price contraction, the annual median land price per square metre reduced by
7% in 2019 to average $1,209 psm which represents the lowest rate recorded since 2016. Despite
the reduction, the Sydney land price per square metre is currently 44% higher than Melbourne – the
nation’s second most expensive land market.
p
Grou
rty
rope
nP
inte
byW
rk
n Pa
de
Mars
35 e at
n g
ra
eG
ThSYDNEY
Greenfield Sub-markets
• Greater Sydney currently has only two • The major active supply precincts in the
substantive active sub-markets: the North South West have been East Leppington,
West and the South West. The NLS also tracks Edmondson Park and Oran Park which have
the West and Liverpool sub-markets however each consistently accounted for circa 20% each
these two sub-markets accounted for negligible of net lot sales per month.
activity in 2019.
• Over the last three years the majority of sales
• The South West has historically been a bigger activity in the North West have occurred in
volume market than the North West due to a Marsden Park (32%), Box Hill/Box Hill Industrial
larger number of estates with greater capacity. (27%), and the Riverstone (19%) precincts.
This is underscored in the December quarter
2019 with the South West capturing 58% of net
lot sales, followed by the North West with 36%
of sales.
Greenfield Market Performance Summary Table
Source: UDIA; Research4
36SYDNEY
MULTI-UNIT|INFILL ANALYSIS
Sales Activity
• Multi-unit sales activity in Greater Sydney staged a second half of the year recovery after a steep
decline over two years. There were 30,009 settled multi-unit dwelling sales (whole of market) in the
year to November 2019, representing a 15% increase from the low of 26,104 (rolling annual average)
experienced in June 2019.
• New multi-unit dwelling sales have also recovered, rebounding 19% since June 2019 to reach 7,913 in
November. Despite this recent recovery, multi-unit sales activity is still down significantly from the peak
experienced in early 2016; with new multi-unit dwelling sales 72% below the 2016 peak, and whole-of-
market multi-unit sales down 50%.
Median Unit Pricing
• The median sale price of multi-unit dwellings • For new multi-unit dwellings, the median price
in Greater Sydney was $700,000 in the year to in the year to November 2019 was $711,990,
November 2019, representing a decline of 3% down 4% on the year and 6% below the peak
over the year, and down 5% from the peak in also in late 2017 of $755,000.
late 2017 of $736,000.
Multi-Unit Sales, Whole of Market & New Sales (Settled)
Source: UDIA; CoreLogic
37Construction Activity
• There were 26,992 new multi-unit dwellings of multi-unit residential development across
completed in Greater Sydney in 2019. This is Greater Sydney in areas outside of the inner
an annual decline of 14%, bringing completions city.
back in line with the long run average after an
historic high in 2018. • This is highlighted by the postcodes with
the highest levels of multi-unit dwelling
• The majority (58%) of the new multi-unit completion. While three of the top five
dwelling completions in Greater Sydney postcodes were within 10km of the city centre,
occurred between 10km and 50km away from postcode 2155 (Rouse Hill) contributed the
the Sydney city centre. second highest volume of completions of any
metropolitan postcode with 1,372 units and
• These completions were split evenly between postcode 2750 (Penrith) contributed fifth most
the 10km to 20km and the 20km to 50km with 895 units.
distance bands, and highlights the significance
Median New Unit Price & Annual Unit Completions
Source: UDIA; CoreLogic
Multi-Unit Active Pipeline Analysis
Source: UDIA; CoreLogic
38Pipeline Analysis
CoreLogic have produced point-in-time estimates of the multi-unit pipeline based on a December 2018 and a
December 2019 snapshot of the market leading Cordell Construction database.
• The total active pipeline number is 191,337 units.
• This is made up of units under construction (down 6% from 2018), approved units yet to start
construction (up 3%) and units in early planning (down 2%).
Multi-Unit Completions 2019, by Postcode
Source: UDIA; CoreLogic
Sub-Market Analysis
• The City of Sydney had the most multi-unit • The LGAs (with more than 100 sales in the
sales activity (by LGA) in Greater Sydney, year) experiencing the best multi-unit dwelling
despite experiencing a 7% decline in annual price movement were Mosman (up 4%),
sales with over 3,000 units sold in the year Burwood (down 1%) and The Hills Shire (down
to November 2019, at a median sale price of 1.5%).
$862,250.
• The City of Sydney faced a decline in annual
• This was followed by Parramatta with 1,968 pricing of 2% and Parramatta multi-unit prices
sales, the Northern Beaches with 1,947 sales, fell by 5%.
and Sutherland Shire with 1,687 sales.
39SYDNEY
Multi-Unit Market Performance Summary Table
Source: UDIA; CoreLogic
BROADER MARKET TRENDS
Approvals • To provide housing for Greater Sydney’s
growing population profile, Research4
• Dwelling approvals in Greater Sydney have estimates there an estimated underlying
been falling dramatically in the last two years, demand for all dwelling types of approximately
putting the forward pipeline of dwelling supply 2,784 per month.
of the city at risk.
Finance
• Approvals declined by 26% in 2018, bringing
them to 43% below the peak of 60,318 • Housing finance activity in New South Wales
recorded in September 2016. started to improve in the final months of
2019 after declining in the recent downturn,
• Apartments comprised the largest component although the total value of lending (excluding
of the decline, with approvals for apartments refinancing) in New South Wales still fell 14%
with 4 stories or taller down 33% on the year over the year.
and down 59% since the 2016 peak.
• This was driven primarily by falling investor
Population activity, with the total value of lending to
• The population of New South Wales grew by investors retracting by 23% over the year.
123,000 in 2019, a step down from the high Investor lending comprised 48% of the market
seen in 2016 but above the decade average of in mid-2017, and just 34% in December 2019.
104,000. • The situation is beneficial for first home buyers,
• New South Wales continues to have negative who made up 15% of the market in December
Net Interstate Migration with a net loss of 2019, up from 12% in December 2018.
47,000 people in 2019, losing 13% more
people to other states than in 2017.
• This is balanced by strong on-going Net
Overseas Migration, which has been
maintained above 90,000 since 2016, and
robust levels of Natural Increase.
40You can also read