OutlookYear-End | 2019 - JLL
←
→
Page content transcription
If your browser does not render page correctly, please read the page content below

Outlook
Canada Investment

                    Year-End | 2019
                                  Page 1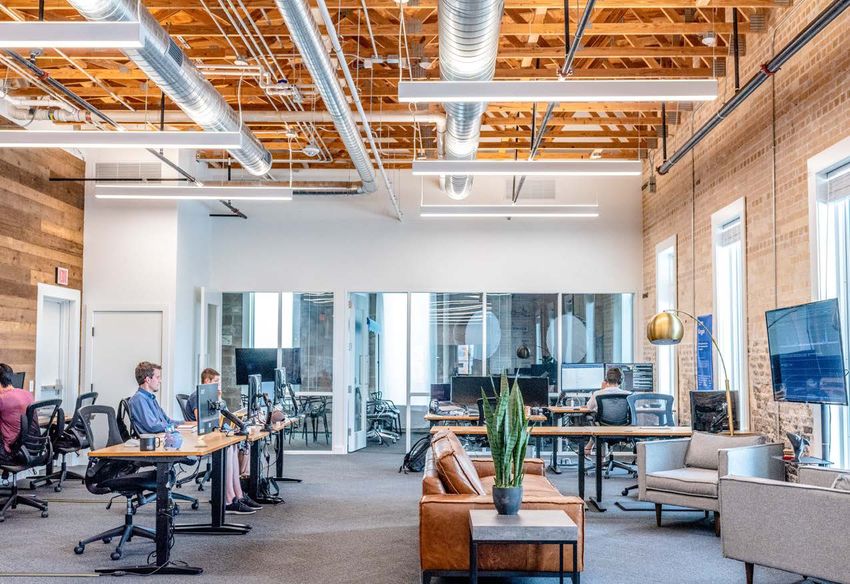
Table of

Contents
Economic Overview   3

Key Trends          6

Toronto             12

Montréal            17

Montréal (french)   22

Vancouver           27

Calgary             32

Edmonton            37

Ottawa              42

Contact             47

                         Page 2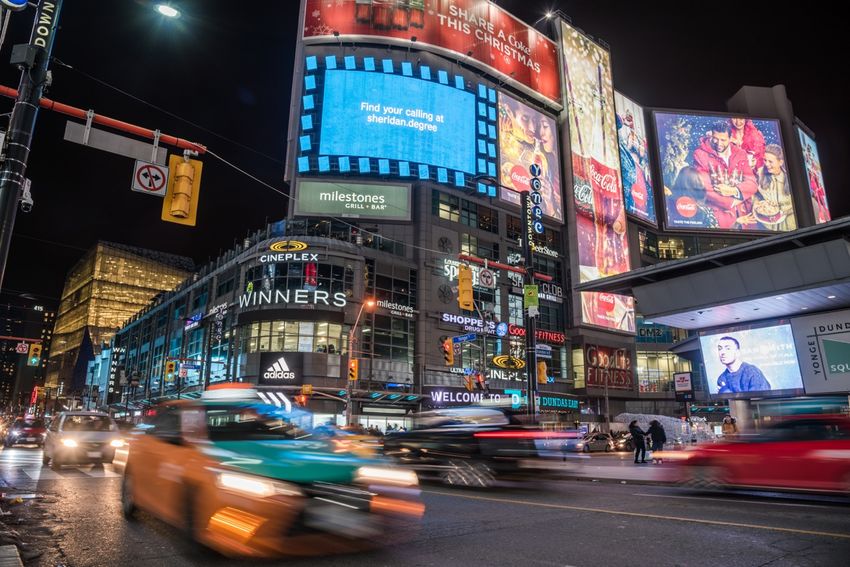
Canada Investment Outlook | Year-End 2019
                                                                                                    Economy                                                    Canadian

Macroeconomic Overview
As Canada looks forward to a new decade, we are confident and optimistic                                                  5%                         Canada GDP Growth
about the country’s prospects. However the same uncertainties that have
                                                                                                                                            Quarterly GDP Growth
lingered for the past two years remain, and are intensifying. If one wants to                                             4%
                                                                                                                                            Annual GDP Growth
understand if the economy is healthy or not, there is compelling evidence to
support both sides of this debate.                                                                                        3%

                                                                                                                          2%
Pessimists will point to an abnormally strong second quarter in 2019 that was
an anomaly, propped up by accommodative monetary policy and the end to                                                    1%
U.S. aluminum and steel sanctions. Removing Q2 2019 from the trendlines,
quarterly growth has been anemic going back into 2018, and generally falling                                              0%
since 2017. From July to December the national economy grew by just 0.5%
and job growth reached just 80,000. Business investment continues to lag                                                 -1%
and remains well short of where it was over five years ago.                                                                      2014      2015       2016        2017       2018        2019

The headwinds facing Canada’s export sector are escalating. GDP growth is                                                                    Job Growth and Unemployment
expected to slow in the EU, Japan, Latin America, and Asia Pacific. Meanwhile
                                                                                                                         160               Quarterly Job Growth, Thousands                          10%
in the United States, which consumes nearly 75% of Canada’s exports, erratic
trade policy is undermining business confidence and investment. Yields on                                                140                Unemployment Rate
                                                                                                                                                                                                    8%
Bank of Canada (BoC) short-term bonds are higher than those on long-term                                                 120
bonds. This phenomenon, known as the inverted yield curve, has been                                                      100                                                                        6%
associated with past recessions and therefore must be treated as a red flag.
                                                                                                                           80
Inflation indicators are flat at around 2%, but in an “asset light” world, there is
                                                                                                                           60                                                                       4%
growing evidence that conventional inflation numbers don’t capture the
actual cost of living. Rising housing prices do, and after slowing temporarily                                             40
                                                                                                                                                                                                    2%
due to the B20 stress tests, they are resuming a trajectory of steep increases                                             20
in major urban centres, which is straining household budgets.                                                                -                                                                      0%
                                                                                                                                 2014      2015       2016        2017       2018        2019
The optimists will point out that the economy generated nearly 400,000 jobs
last year and pushed unemployment down to 5.6%, its lowest point since
                                                                                                                                          Western Canadian Select vs. West Texas
before the Global Financial Crisis. This has boosted labour force participation
and has led to tangible wage growth across the employment spectrum.                                                      $120                         Intermediate
                                                                                                                         $110
Population growth is strong and Canada continues to be an attractive                                                     $100
                                                                                                                                                                              WTI premium to WCS
destination for families, businesses, and investors. On the external front,                                               $90                                                 WTI, USD/Barrel
recent developments give hope that Canada has made it through the worst.                                                  $80                                                 WCS, USD/Barrel
The United States and China are coming closer to a Phase One trade                                                        $70
agreement, and there are signs that trade tensions between them could ease.                                               $60
                                                                                                                          $50
Canada and several European countries are negotiating the Comprehensive
                                                                                                                          $40
Economic and Trade Agreement (CETA), which will give Canadian exporters                                                   $30
preferential access to a 50-million- person consumer market. CETA will also                                               $20
include a newly-sequestered United Kingdom that will be eager to find new                                                 $10
trade partners. Finally, the updated version of NAFTA has been ratified in the                                             $-
U.S. congress and is now an inevitability. The new agreement leaves most of                                                       2014       2015       2016        2017        2018        2019

                                                                                                                                 Source: JLL Research, BoC, Oxford Economics, StatCan

© 2020 Jones Lang LaSalle IP, Inc. All rights reserved. All information contained herein is from sources deemed reliable; however, no representation or warranty is made to the accuracy thereof.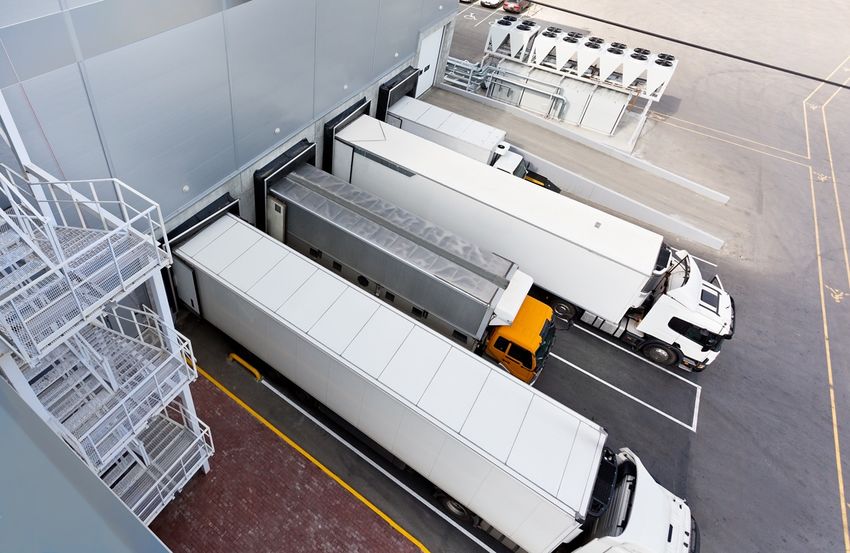
Canada Investment Outlook | Year-End 2019
                                                                                                    Economy                                                             Canadian

Macroeconomic Overview
the original language intact, but will seek to bring more manufacturing                                                                                Real Estate Investment by Market, %
activity back to the United States and Canada.                                                                                  100%

Canada will navigate these issues with a new government that is more                                                                   80%
fragmented and polarized. Prime Minister Justin Trudeau and the Liberal
                                                                                                                                       60%
Party were re-elected in October, but with a smaller delegation than four
years ago. In this context, we can expect to see more negotiation between                                                              40%
the parties. The Federal Court of Appeals decided in early 2020 to allow
                                                                                                                                       20%
construction of the TransMountain Pipeline to move forward – perhaps a sign
of acquiescence to Conservative pressure. The pipeline will stretch from                                                                 0%
Edmonton to Vancouver, giving landlocked Albertan oil producers the ability                                                                      2014         2015      2016          2017         2018     2019
to ship oil by sea and access world markets. Canadians can also expect an                                                                      Other         GCA     GEA        NCR          GTA      GVA     GMA
increase in spending from their new administration. The Parliamentary
Budget Office’s non-partisan review of the Liberals’ plan forecasts the deficit
to grow by over $4 billion in 2020-2021, and to add an average of $8 billion                                                                              Buyer and Seller Profile, 2019
annually for the next four years.                                                                                                      $25
                                                                                                                                                    Buyer

With the market slowing towards the end of 2018, few would have predicted                                                              $20          Seller
                                                                                                                       CAD, Billions

2019 to be the second-best year on record for Canada’s commercial real
                                                                                                                                       $15
estate investment market. After a slow first quarter in 2019, the BoC’s
decision in early 2019 to halt interest rate hikes led to a fall in bond yields,                                                       $10
which widened spreads on cap rates. The market roared back and, spurred
by a flurry of fourth quarter deal-making, reached $47 billion in total property                                                         $5
sales. Real estate debt and equity financing hit a new record. The S&P/TSX
Capped REIT Index rose by more than 17%, reversing its fall toward the end of                                                            $-
2018. However, the market is growing more geographically fragmented.                                                                            Foreign       Fund   Pension       Private         Public    User
Investment volumes in British Columbia and Alberta in 2019 were well below                                                                                   Manager Fund
their 10-year averages, and 75% of all commercial real estate investment
flowed into either Ontario or Quebec.                                                                                                          Real Estate Investment by Canadian Capital

                                                                                                                                                    International
Buoyed by the BoC’s plan of keeping interest rates “lower for longer,” we                                                                $70
expect the Canadian market to remain strong in 2020. Despite high                                                                                   Domestic
                                                                                                                                         $60
                                                                                                                         CAD, Billions

valuations and significant competition, investors are increasingly compelled
by some of the strongest fundamentals the market has ever seen. Rents in                                                                 $50
much of the country are at record highs, while vacancy is at record lows. Real                                                           $40
estate liquidity is also at an all-time high globally, as is dry powder. Fund
managers are increasingly driven by the “T.I.N.A.” principle (There Is No                                                                $30
Alternative), and are deploying capital on assets with low cap rates just to                                                             $20
earn a return. Many are exploring club deals and joint ventures to minimize
risk and access quality product. While no one can predict the future, we                                                                 $10
expect 2020 to follow a similar trend as the past year: resilience and stability                                                          $-
amidst external volatility.                                                                                                                       2014        2015       2016         2017         2018     2019

                                                                                                                                               Source: JLL Research, Real Capital Analytics (all
                                                                                                                                               transactions over $5m, including entity-level)
© 2020 Jones Lang LaSalle IP, Inc. All rights reserved. All information contained herein is from sources deemed reliable; however, no representation or warranty is made to the accuracy thereof.
Canada Investment Outlook | Year-End 2019
Economy Canadian
Debt Capital Markets Overview
The supply of debt capital was widely available in the Canadian market in Canadian REITs: Equity and Debt Issuances
2019. However it should be noted that lenders, both foreign and domestic, $12
Equity
are becoming more selective in their exposure. Lending allocations are Debentures
$11
Secured Mortgage Bonds
reflecting investment flows more generally: skewing towards the office, $10
multifamily, and industrial sectors, shying away from non-core and non- $9
CAD, Billions
grocery-anchored retail, and giving heightened consideration to covenant, $8
$7
stability of cash flow, asset quality, and micro-location. Geographically,
$6
there is a widening schism between Toronto, Vancouver, and Montreal and $5
the rest of the country in terms of perceived risk. As investors are seeing $4
the business cycle near its peak, the largest funds are moving their $3
allocations more towards these markets to mitigate portfolio risk. $2
$1
With the S&P/TSX Canadian Capped REIT Index rising by 17%, Canadian $-
REITs are flush with cash and have fortified their balance sheets. This is 2010 2011 2012 2013 2014 2015 2016 2017 2018 2019
allowing them borrow on much more favourable terms. Consequently,
REIT fundraising reached record levels in 2019, with over $7 billion in equity 10-Yr GoC Loan vs. 10-Yr Commercial Mortgage Spreads
issuances and over $4 billion in debentures. Given strong property
5%
fundamentals and the likelihood of an accommodative interest rate 10-Year GoC Yield
context, we expect REITs to continue their strong performance in 2020, 10-Yr Commercial Mortgage Spread
4%
albeit with the potential for less lofty returns.
3%
One year ago, there seemed to be some consensus that interest rates
would continue to rise. Yet uncertainty with respect to the export market 2%
and global trade more broadly, as well as high household indebtedness,
has postponed these plans and analysts are now forecasting one or two 1%
rate cuts for 2020. Yields have moved around quite a bit since the
beginning of the year. Using the 10-year GoC bond as a reference, the rate 0%
decreased ~70 bps or 40% through the first 8 months of 2019 but have since
1Q14
2Q14
3Q14
4Q14
1Q15
2Q15
3Q15
4Q15
1Q16
2Q16
3Q16
4Q16
1Q17
2Q17
3Q17
4Q17
1Q18
2Q18
3Q18
4Q18
1Q19
2Q19
3Q19
4Q19
bounced back a bit since September. 10-year commercial mortgage
spreads have generally fluctuated around 170-180 basis points over the
past year. Canada Yield Curve
2.50%
The yield curve has been inverted since this past summer and the current 2.25%
differential between the 2- and 10-year bonds is about 5-10 basis points, 2.00%
signalling 1) concern over a potential economic slowdown and resulting in
investors taking a more cautious approach to their strategy, and 2) 1.75%
investors aiming to lock in longer dated mortgage terms where 1.50%
Q4 2017
appropriate. Notwithstanding the movement in GoCs, credit spreads have Q4 2018
1.25%
remained steady with plenty of capital competing for investment Q4 2019
opportunities, providing borrowers with many options. 1.00%
6M 1YR 2YR 3YR 5YR 7YR 10YR 20 YR
Source: JLL Research, Bloomberg, BMO
© 2020 Jones Lang LaSalle IP, Inc. All rights reserved. All information contained herein is from sources deemed reliable; however, no representation or warranty is made to the accuracy thereof.
Key Trends                                                                                      Canada Investment Outlook | Year-End 2019

    Office
                                                                                                              Historical Office Investment
•   Co-working not going anywhere: Despite WeWork’s well-publicized
    struggles over the past year, we believe that co-working will continue
    to grow for years to come. Many small and medium-sized                                    $20      Qtr1
    enterprises are shifting to an “asset light” strategy, and most owners                    $18      Qtr2
    are looking to grow their exposure to co-working operators.                                        Qtr3
                                                                                              $16
•   Rethinking layouts: Open plan workspaces and hot desking were                                      Qtr4
                                                                                              $14

                                                                              CAD, Billions
    considered to be the vanguard a few years ago, but we are seeing
    pushback as tenants are seeking more of a mix of private spaces for                       $12
    concentration.
                                                                                              $10
•   Customized worker experiences: The growing availability of
                                                                                               $8
    workplace data – through surveys, occupancy sensors, commute
    analysis, etc. – combined with more effective ways of analyzing it, are                    $6
    leading to a workplace experience that is more customized to                               $4
    individual preferences rather than generalized.
                                                                                               $2
•   Race for amenities: Office owners are investing heavily in enhancing
    users’ experience by building out more amenities, such as food                             $-
    courts, gyms, bars, and day cares.                                                               2010 2011 2012 2013 2014 2015 2016 2017 2018 2019
•   Downtown Class A cap rates plateauing: In all major markets with
    the exception of Montreal, cap rates for Downtown Class A office
    properties have plateaued over the past year – an indication that
    buyers are gaining more leverage and sellers are conceding a bit.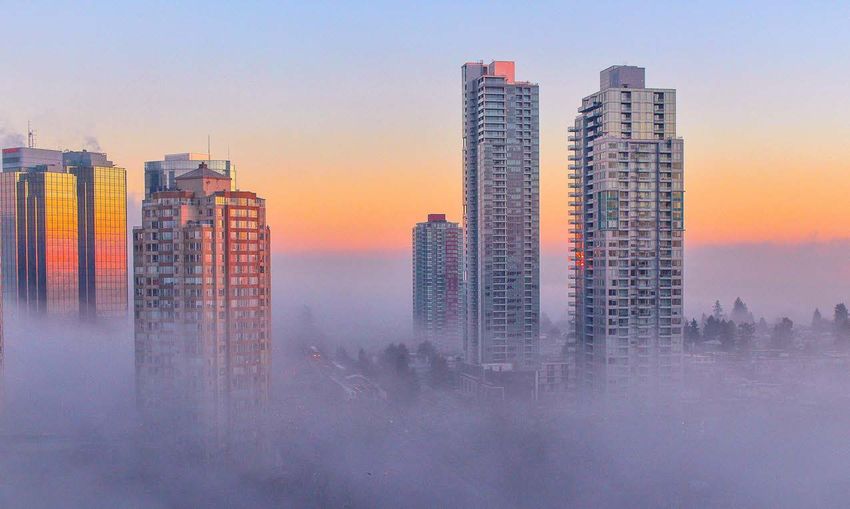
Key Trends                                                                                      Canada Investment Outlook | Year-End 2019

    Multifamily
                                                                                                               Historical Multifamily Investment
•   Record year for Canadian multifamily: With rental vacancy at its
                                                                                              $10
    lowest point in decades, Canada’s multifamily sector has become
    the darling of investors, setting a record with over $9 billion in                         $9     Qtr1
    acquisitions. Booming demand and lagging supply are putting                                       Qtr2
    considerable upward pressure on rents, especially in Ontario and                           $8     Qtr3
    British Columbia. Meanwhile, municipalities and provincial                                        Qtr4
                                                                                               $7

                                                                              CAD, Billions
    governments are under pressure to streamline their processes for
    permitting and approving new housing developments.                                         $6
•   Starlight dominates the buyer pool: Starlight Investments deployed                         $5
    over $3 billion to acquire rental apartments this year, about one third
    of all national multifamily investment.                                                    $4
•   RCFI program producing results: The Canadian Housing and                                   $3
    Mortgage Corporation’s Rental Construction Financing Initiative
    (RCFI) program – which offers lower interest loans and longer                              $2
    amortization periods on purpose-built rental projects – has been
                                                                                               $1
    effective in generating more supply. The government is planning on
    increasing allocations for this program by up to 15%.                                      $-
•   Short-term rentals under fire: Tight residential vacancy is putting                             2010 2011 2012 2013 2014 2015 2016 2017 2018 2019
    renters of short-term lodging such as AirBnB’s on the defensive. City
    councils in Toronto, Vancouver, Ottawa, and Calgary voted in favour
    of new restrictions and licensing fees on these hosts in an effort to
    free up more housing for the conventional rental market.
•   The rise of “Hipsturbia”: The high cost of living in the urban core is
    driving large-scale, transit-oriented developments in suburban
    nodes that will feature many aspects of urban life like walkability,
    restaurants, and nightlife. Expect to see more of this, especially in
    Toronto, Vancouver, and Montreal.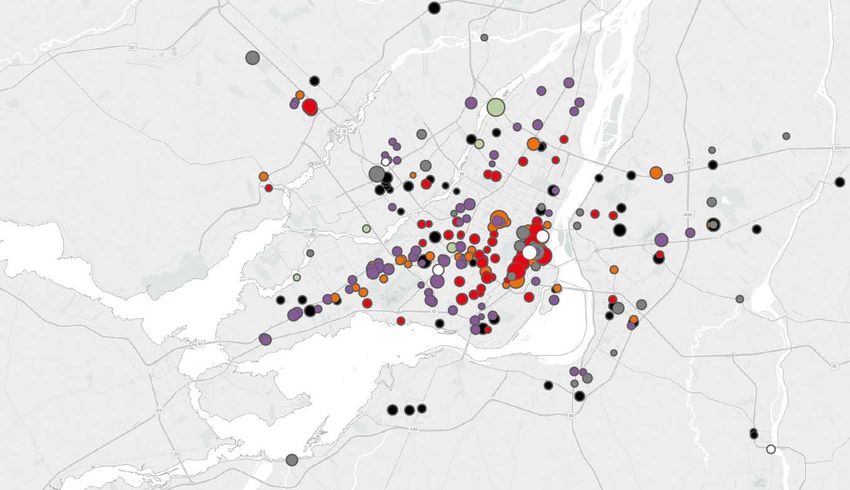
Key Trends                                                                                        Canada Investment Outlook | Year-End 2019

    Retail
•   Retail investment slowing: With $5.7 billion in overall sales, the retail                                    Historical Retail Investment
    market had its slowest year since 2011. Private groups made up
                                                                                                $18
    about 70% of the disclosed buyer pool.                                                                Qtr1
•   Turbulent cannabis rollout: The first year of legal cannabis in Canada                      $16       Qtr2
    has been mostly underwhelming. A restrictive permitting process in                                    Qtr3
    Ontario and British Columbia has kept stores from opening, though                           $14
                                                                                                          Qtr4
    sales have been stronger in Alberta. National sales have increased

                                                                                CAD, Billions
                                                                                                $12
    steadily and we expect much better performance in 2020.
•   Flight to density: Institutional investors and REITs are selling off                        $10
    assets in low-density secondary and tertiary markets and using the
                                                                                                 $8
    proceeds to finance projects in high-density, urban environments.
    Malls and strip centres with ample parking are increasingly being                            $6
    redeveloped with high-rise housing in mind.
•   Technology shaping user experience: Retailers and mall owners are                            $4
    investing in technology to make shopping easier. Cadillac Fairview is
                                                                                                 $2
    piloting a browsing app that allows customers to search for brands
    and products in the store.                                                                   $-
•   E-commerce and pre-ordered groceries an emerging force: E-                                        2010 2011 2012 2013 2014 2015 2016 2017 2018 2019
    commerce has grown to about 10% of retail sales, and about 40% of
    manufacturers are selling directly to customers. This is causing
    retailers to move more of their inventory from the store to the
    warehouse. Sobey’s and Walmart are investing in automated
    sorting, selecting, and delivery technologies to accommodate an
    expected shift to online grocery shopping.
Key Trends                                                                                    Canada Investment Outlook | Year-End 2019

    Industrial
                                                                                                            Historical Industrial Investment
•   Completions at cyclical high: 2019 caps off the decade with nearly 18
    million square feet in completions, marking a cyclical high for the                     $12      Qtr1
    national industrial market. However even this feat is not enough to                     $11      Qtr2
    relieve market pressures; vacancy has fallen to its lowest point on
                                                                                            $10      Qtr3
    record nationally as well as in Toronto, Vancouver, Montreal and
    Ottawa. Net rents are up by over 7% nationally.                                          $9      Qtr4

                                                                            CAD, Billions
•   E-commerce driving historically strong fundamentals: The supply                          $8
    chain shift toward e-commerce, which requires up to three times as                       $7
    much warehouse space as traditional retail, has led to record                            $6
    demand for space. Transportation and warehousing are increasingly
                                                                                             $5
    driving the industrial market, rather than manufacturing which has
    seen setbacks stemming from volatility in export markets.                                $4
•   Industrial earns highest returns: According to MSCI/Realpac,                             $3
    Canada’s industrial sector saw annual returns of 16.4% in 2019,                          $2
    highest among any asset class. Total sales were strong at $7.8b for                      $1
    the year.
                                                                                             $-
•   Rethinking industrial footprints: The space crunch in Canada's                                2010 2011 2012 2013 2014 2015 2016 2017 2018 2019
    largest markets is forcing developers to be more creative. In
    Vancouver, Oxford Properties has announced plans to build the
    country's first multi-storey warehouse at Riverbend Business Park. In
    Mississauga, Greyson Construction is building an 80-foot high
    warehouse that takes up one fourth of the footprint of a typical
    structure.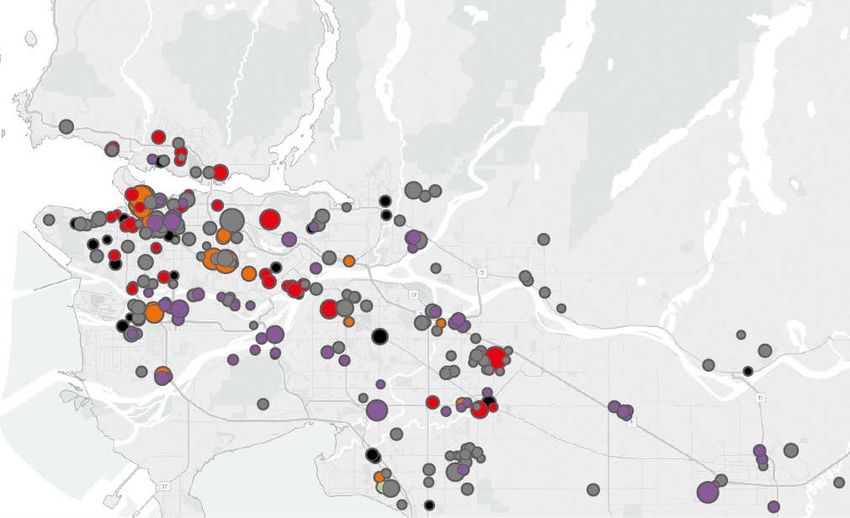
Key Trends                                                                                     Canada Investment Outlook | Year-End 2019

    Alternative Assets
                                                                                                       Historical Alternative Assets Investment
•   Record year for alternative assets: 2019 saw over $4 billion in total                   $4.5
    sales for alternative assets, which include senior housing, student
                                                                                                        Qtr1
    housing, data centres, self storage, cold storage, and other niche                      $4.0
    property types. Socioeconomic trends suggest strong growth for                                      Qtr2
    these assets.                                                                           $3.5        Qtr3

                                                                            CAD, Billions
•   Ventas makes big senior housing play: U.S.-based Ventas REIT spent                                  Qtr4
                                                                                            $3.0
    nearly $2 billion to acquire an 85% share in a Quebec seniors
    housing portfolio previously owned by Le Groupe Maurice. With a                         $2.5
    capture rate nearly twice as high as the rest of Canada and a large
    elderly population, the province of Quebec shows exceptional                            $2.0
    promise for seniors housing.
                                                                                            $1.5
•   Downsizing is driving growth in self storage: Data from CMHC
    suggests that apartment units across Canada are shrinking on                            $1.0
    average. This will likely drive more demand for self storage units,
    particularly in Canada’s largest urban centres.                                         $0.5
•   5G and edge computing will drive data centre market: The rollout of
                                                                                             $-
    the 5G mobile communications network will significantly increase
                                                                                                    2010 2011 2012 2013 2014 2015 2016 2017 2018 2019
    demand for data processing and storage. Meanwhile, edge
    computing – data processing power at the edge of a network rather
    than in a cloud or central data warehouse – is expected to see
    double-digit annual growth over the medium term.
$47B
Total investment volume, 2019 2019 Buyer Domicile
Kuwait Sweden
Germany 0.30% 0.12% Rest of World
1.43% 0.13%
United States
13%
Canada
85%
Edmonton
$ 2.7B
Vancouver
$ 6.3B Calgary
$ 1.9B Ottawa
$ 2.3B
Montréal
Toronto
$ 8.9B
Real Estate Investment Volumes by Asset Class $ 18.3B
Multifamily Land
$60 Hotel Industrial
Office Retail
$50 Alternative Assets
2019 Buyer Profile
CAD, Billions
$40 4%
Foreign
$30 11% 16%
Fund Manager
$20 Pension Fund
20% Private
$10
44% Public
$- User
2014 2015 2016 2017 2018 2019 5%
Source: RCA, RealNet , Gettel Network, Commercial Edge, CoStar.
All transactions > $5m, Direct and Entity Level
Note: Market data as of latest availableToronto Canada Investment Outlook | Year-End 2019
Toronto
 Canada Investment Outlook | Year-End 2019
Historic Real Estate Investment by Sector 2019 Buyer Profile
$25 Multifamily Land
Hotel Industrial 4%
Office Retail 5%
$20 Foreign
Alternative Assets 10%
Fund Manager
CAD, Billions
$15 30% Pension Fund
Private
39%
$10 Public
12% User
$5
$-
2014 2015 2016 2017 2018 2019
Source: RCA, RealNet , Gettel Network, Commercial Edge, CoStar.
All transactions > $5m, Direct and Entity Level
Note: Market data as of latest available
Toronto Buyer Domicile: YTD 2019
Canada U.S. Kuwait Rest of the world Unknown
82% 3% 1% 0.2% 14%
Multifamily Office
Land Retail
Hotel Alternative Assets
Industrial
* Higher point size represents
larger deal sizeToronto Canada Investment Outlook | Year-End 2019
General Office Investment Volumes and Price PSF
• From an investment perspective, Toronto is approaching top-tier Total Investment
status among global gateway markets thanks to strong demographics Avg. PSF: Downtown Class A
and the continued expansion and diversification of its economic base. $10 $1,000
Avg. PSF: Suburban Class A
$9 $900
Avg. Sale Price PSF
Toronto is among the global leaders in rental growth for office,
CAD, Billions
industrial, and multifamily assets. $8 $800
• The federal government has committed CAD $1 billion in funding for $7 $700
public transport in the Greater Toronto Area (GTA). The money will go $6 $600
primarily toward alleviating congestion at the Bloor-Yonge station, the $5 $500
busiest transit node in Canada, as well as other operational
$4 $400
expenditures.
$3 $300
• A recent report released by the Council of Tall Buildings and Urban
$2 $200
Habitat shows that Toronto is densifying more than any other city in
the western hemisphere. Currently, there are 67 skyscrapers with $1 $100
another 31 under construction and 59 more proposed. By the time $- $-
these are all finished, Toronto will have more skyscrapers than any 2014 2015 2016 2017 2018 2019
other North American city besides New York.
• The GTA saw about CAD $18.3 billion in total investment sales for the Office Net Rents and Vacancy
year, the second highest total on record after 2017. The top-
Average Net Rent, Downtown
performing asset classes were office ($4.4b), multifamily ($3.7b), and Average Net Rent, Suburbs
industrial ($3.3b). Notably, there were over $4 billion in trades for $40 20%
Total Vacancy Rate, Downtown
development sites. This reflects investors’ growing interest in ground- $35 Total Vacancy Rate, Suburbs
Avg. Rent (SF/Year)
up development as way to earn a higher return in a low cap rate
environment. $30 15%
Vacancy Rate
$25
Office $20 10%
• Toronto’s red-hot office market finished 2019 with a bang. Strong $15
absorption highlighted by the delivery of two fully leased buildings – $10 5%
500 Lakeshore and 80 Atlantic - pushed vacancy to 2% downtown
$5
while net rents are up an astonishing 10% from the previous quarter
and 20% from a year ago. The suburbs saw vacancy fall 80 bps on the $- 0%
year to 11.7%, with rents climbing mildly and reaching an average of 2014 2015 2016 2017 2018 2019
$16.34 psf. In all, Toronto was responsible for roughly half of all large
block office leasing this past year in Canada. Office Cap Rates
• While the investment market remains strong, this past year saw fewer
10% Avg. Cap Rate: Downtown Class A
Class A properties available for sale. Sellers are generally reluctant to
9% Avg. Cap Rate: Suburban Class A
let go of these prized assets as they see runway for further
8% GoC 10-yr Bond
appreciation.
7%
• Downtown cap rates have flatlined this past year, averaging 4.2% after 6%
several years of compression. However the benchmark suburban rate 5%
is down 20 bps from a year ago, now at 5.6%. We believe this is a 4%
harbinger of strengthening suburban markets that are benefitting from
3%
spillover as tenants and investors are increasingly priced out of
2%
downtown. We estimate that asset inflation is around 7-10% from last
1%
year, with the average downtown sale price at $826 psf.
0%
• The buyer pool was fairly diversified between fund managers, pension 2014 2015 2016 2017 2018 2019
funds, REITs, and privates. Foreign buyers were noticeably absent,
accounting for only $250m in liquidity, compared to nearly $2b in 2018. Source: JLL Research, JLL REIS, Altus ITS, Altus Realnet, Real Capital Analytics
All transactions > $5m, including entity-level
© 2019 Jones Lang LaSalle IP, Inc. All rights reserved. All information contained herein is from sources deemed reliable; however, no representation or warranty is made to the accuracy thereof.
Page 14Toronto Canada Investment Outlook | Year-End 2019
Multifamily Investment Volumes and Cap Rates
Multifamily $4.0
Total Investment
8%
$3.5 Avg. Cap Rate: Downtown 7%
• Toronto’s multifamily market exploded this year, reaching a record of Avg. Cap Rate: Suburbs
$3.8b in total investment volume. About two thirds of these trades $3.0 GoC 10-yr Yield 6%
were in the city and the remaining third in the suburbs.
CAD, Billions
$2.5 5%
Avg. Cap Rate
• There are currently 12,367 rental units under construction, more than
at any point since the 1970s. This rising supply has lifted rental $2.0 4%
vacancy to 1.5%, its first hike since 2012. However this did not slow
rental growth, which is up by 7% over last year according to data from $1.5 3%
CMHC. The past year saw a 43% increase in development applications
$1.0 2%
for rental housing, suggesting that supply will remain strong.
• Starlight Investments purchased over $3 billion in apartment units $0.5 1%
throughout Canada this past year, including the largest multifamily
$- 0%
transaction in Canadian history when they acquired 6,271 suites for
2014 2015 2016 2017 2018 2019
$1.7 billion in the Continuum REIT privatization. These acquisitions
make them the biggest apartment owner in Toronto, while also Multifamily Sale Price Per Unit and Vacancy
gaining exposure into Ottawa, Vancouver, and the Waterloo Region.
$500 5%
• Developers are responding positively to supply-side policies from the Avg. PPU, Downtown
provincial government, including the lifting of rental controls in 2018,
Avg. PPU, Suburban
and Bill 108, a pillar of its Housing Supply Action Plan initiative. The $400 4%
CAD, Thousands
Vacancy Rate
bill is intended to remove many of the administrative hurdles facing
Vacancy RAte
developers. Key objectives include streamlining the approval process $300 3%
for development applications and bylaw amendments, and the
removal of Section 37 which gave municipalities authority to extract
$200 2%
development concessions.
• Toronto's Local Planning and Appeals Tribunal voted to uphold
$100 1%
restrictions and increase taxes for short-term rental units, in an effort
to incentivize more long-term rental availability.
$- 0%
2014 2015 2016 2017 2018 2019
Retail
Retail Investment Volumes and Cap Rates
• Toronto’s retail market ended the year at $1.4b in total sales, the
$4.0 8%
slowest year since 2014. The majority of sellers were REITs and the Total Investment Regional Malls
majority of buyers were private investors. $3.5
Power Center Food Anchored Strip
7%
GoC 10-yr Bond
• Cap rates for retail assets are up for all retail sub-classes in the past
year amidst greater investor scrutiny. However, moving forward, we $3.0 6%
anticipate strong appetite for urban streetfront retail that is
surrounded by density. $2.5 5%
Avg. Cap Rate
CAD, Billions
• Though the deal has not officially closed, Cadillac Fairview agreed to $2.0 4%
sell a 50% interest in Sherway Gardens to TD Asset Management, as
part of a greater portfolio purchase involving CF’s Carrefour Laval as $1.5 3%
well. The transaction indicates strong interest in core enclosed retail
assets that are well located, well managed, and well tenanted. A $1.0 2%
portion of the funds will be recycled into the East Harbour
$0.5 1%
development project. Located at the future junction of the Relief Line
and GO Train, this project features a long pipeline of mixed use
$- 0%
density. 2014 2015 2016 2017 2018 2019
• Retail owners are looking to non-traditional tenants to backfill
vacancies including co-working operators, gyms, and healthcare. Source: JLL Research, Altus ITS, CMHC
© 2019 Jones Lang LaSalle IP, Inc. All rights reserved. All information contained herein is from sources deemed reliable; however, no representation or warranty is made to the accuracy thereof.
Page 15Toronto Canada Investment Outlook | Year-End 2019
Industrial Investment Volumes and Price PSF
Industrial
$5.0 $250
• Industrial investment fell from its historic peak in 2018 but still finished Total Investment
$4.5
the year at $3.3b, second-best on record.
$4.0 Single Tenant $200
• Cap rates continue to compress with the benchmark cap rate for
CAD, Billions
Multi Tenant
single-tenant assets at 4.3% and multi-tenant at 4.5%. This reflects a $3.5
Avg. Price PSF
fall of 20 and 30 basis points, respectively, from a year ago. Average $3.0 $150
purchase price on a per-square-foot basis has risen by 20% over 2018, $2.5
with single-tenant assets averaging $192 psf and multi-tenant assets
$2.0 $100
averaging $202 psf.
• Industrial vacancy stands at 1.3%, one of the lowest in North America $1.5
thanks to an insatiable demand. While this is up 10 basis points from $1.0 $50
Q3, it represents a fall of 30 basis points from a year ago. Asking rents $0.5
are up an astonishing 20% from 2018. Moving forward, we see some
$- $-
relief coming to the market as only 63% of new supply for 2020 is
2014 2015 2016 2017 2018 2019
currently pre-leased. This should push vacancy up slightly as these
facilities are completed.
Average Industrial Net Rent and Vacancy
• Bombardier announced that Toronto's Pearson Airport will be home
to their Global Manufacturing Centre. They completed a 38-acre land Avg. Rent
$10 5%
lease with the Greater Toronto Airports Authority to build a 1m s.f. Avg. Vacancy Rate
Aircraft Assembly facility. It is expected to churn out 100 new aircrafts $9
per year beginning in 2023. $8 4%
Avg. Net Rent, sf/yr
$7
Vacancy Rate
• GWL made the largest single-asset purchase of the year for the
Canadian industrial market, acquiring DSV’s 1m s.f. distribution centre $6 3%
in Milton in a $180m sale leaseback transaction. $5
• Hamilton’s John C. Munro International Airport is expected to $4 2%
becoming a significant cargo hub in the coming years. DHL has
$3
announced a $100m investment in a handling facility adjacent to the
airport that will feature a fully automated sorting system with capacity $2 1%
for processing up to 15,000 packages per hour. $1
$- 0%
2014 2015 2016 2017 2018 2019
Alternative Assets
• The largest alternative asset purchase in the GTA this year was Summit Industrial Cap Rates
REIT’s 50% share sale to AIMCo of its Barker Business Park data centre. 7%
Known as DC1, the state-of-the-art, 10-megawatt facility was
6%
developed by Summit along with Urbacon in early 2018 and leased to
a major cloud provider under a 15-year lease. 5%
• Chicago-based Oxford Capital (not to be confused with Oxford Single Tenant
4%
Properties) has grown a portfolio of 11 seniors housing facilities in the Multi Tenant
past year in secondary markets in Ontario. In October, they acquired 3% GoC 10-yr Bond
six independent living facilities formerly operated by Revera Living.
The portfolio includes assets from Fort Erie to Waterloo and the GTA. 2%
1%
0%
2014 2015 2016 2017 2018 2019
Source: JLL Research, JLL REIS, Altus ITS
© 2019 Jones Lang LaSalle IP, Inc. All rights reserved. All information contained herein is from sources deemed reliable; however, no representation or warranty is made to the accuracy thereof.
Page 16Montréal Canada Investment Outlook | Year-End 2019
Montréal
   Canada Investment Outlook | Year-End 2019
Historic Real Estate Investment by Sector 2019 Buyer Profile
4%
$10 Multifamily Land
$9 Hotel Industrial
10% Foreign
$8
CAD, Billions
Office Retail
$7 Alternative Assets 28% Fund Manager
$6 Pension Fund
$5
$4 Private
46%
$3 12% Public
$2
User
$1
$-
2014 2015 2016 2017 2018 2019
Source: RCA, RealNet , Royal Chabot Grant Thornton.
All transactions > $5m, Direct and Entity Level
Note: Market data as of latest available
Montréal Buyer Domicile, 2019
Canada Sweden Unknown
U.S.
72% 24% 1% 3%
Multifamily
Land
Hotel
Industrial
Office
Retail
Alternative Assets
* Higher point size represents
larger deal sizeMontréal Canada Investment Outlook | Year-End 2019
Office Investment Volumes and Price PSF
General
• According to the Conference Board of Canada, Montreal $2.5 Total Investment $500
experienced the highest economic growth rate out of any major Avg. PSF, Downtown
$450
Avg. PSF, Suburban
Avg. Sale Price PSF
Canadian metropolitan area for 2019. The economy expanded by
CAD, Billions
$2.0 $400
over 3% for the third consecutive year, driven by manufacturing,
$350
finance, real estate, scientific and technical services. Montreal is
$1.5 $300
becoming one of the top cities for foreign direct investment, with
most of this funding going into high-tech sectors. $250
$1.0 $200
• With $8.9b in total investment volume, Montreal more than
doubled its previous record. Institutional investors are flocking to $150
Montreal as fundamentals are very strong and cap rates are higher $0.5 $100
than Toronto and Vancouver. Investment activity was fairly $50
diversified across several sectors: office ($2.2b), alternative assets $- $-
($2.1b), multifamily ($1.5b), retail ($1.1b), and industrial ($1b). 2014 2015 2016 2017 2018 2019
• The Canada Infrastructure Bank is working with the Montreal Port
Authority on a proposed container terminal in Contrecoeur. They Office Net Rents and Vacancy
are hoping that the project, which could cost as much as $1 billion, Average Net Rent, Downtown
can begin construction as early as mid-2020. Average Net Rent, Suburbs
• The Port of Montreal surpassed 40 million metric tons of cargo $20 Total Vacancy Rate, Downtown 20%
Total Vacancy Rate, Suburbs
handled in 2019, the first time it reached this feat. Total traffic was $18 18%
Avg. Rent (SF/Year)
up by almost 4% from the previous year. $16 16%
Vacancy Rate
$14 14%
Office $12 12%
$10 10%
• With about 3.1 million square feet in positive net absorption,
Montreal’s office market had its most active year in nearly two $8 8%
decades. Leasing activity was up across all submarkets, but was $6 6%
particularly strong in Midtown and Downtown. $4 4%
• Downtown vacancy plunged 300 basis points from the beginning $2 2%
of the year, finishing at 7.3%. Net rents grew by over 30% y-o-y, $- 0%
now averaging $20.38 psf. The suburbs also fared well, with 2014 2015 2016 2017 2018 2019
vacancy falling by over 100 bps and net rents climbing over 8%.
• On the investment front, total liquidity in the GMA office market Office Cap Rates
tripled from a year ago. Benchmark cap rates fell for downtown (to
10%
4.8%) and midtown (to 5.7%), but were slightly up in the suburbs at Avg. Cap Rate: Downtown Class A
6.1%. Downtown saw price inflation of more than 10% y-o-y. 9%
Avg. Cap Rate: Suburban
8%
• Several prominent downtown and midtown trades occurred in GoC 10-yr Bond
7%
2019. Oxford and PSP sold 1250 Rene Levesque to
BentallGreenOak, Kevric acquired National Bank’s headquarters at 6%
600 De La Gauchetiere, Crestpoint acquired 1010 De La 5%
Gauchetiere, and Spear Street Capital purchased 6650 St. Urbain. 4%
• The most aggressive office investor this year was Allied REIT, a 3%
developer that actively targets tech-based tenants. Using a 2%
significant equity offering issued early in the year, they acquired 1%
over 2m square feet of Montreal office, including 700 De La 0%
Gauchetiere, the World Trade Centre, and the RCA building. 2014 2015 2016 2017 2018 2019
Source: JLL Research, JLL REIS, Altus ITS
© 2019 Jones Lang LaSalle IP, Inc. All rights reserved. All information contained herein is from sources deemed reliable; however, no representation or warranty is made to the accuracy thereof.
Page 19Montréal Canada Investment Outlook | Year-End 2019
Multifamily Investment Volumes and Cap Rates
Multifamily Total Investment Vacancy Rate
• Montreal’s multifamily market transacted over $1.5 billion in 2019, $2.0 Downtown Midtown 8%
just shy of the market record in 2015. Suburban
Minto was an important player in 2019, breaking into the Montreal
CAD, Billions
• $1.5 6%
market with nearly $700m in acquisitions including Rockhill
Avg. Cap Rate
Apartments, Le 4300, and Haddon Hall. Also active was Ottawa-
based InterRent REIT, who raised over $200m in equity and $1.0 4%
promptly deployed it to acquire five buildings and over 700 units.
• The buyer pool was dominated by private groups, who accounted $0.5 2%
for 55% of total market liquidity.
• Downtown cap rates continued to slide, with the benchmark rate $- 0%
falling to 4.1%. Midtown cap rates stayed flat, averaging 4.6%, and 2014 2015 2016 2017 2018 2019
suburban cap rates fell slightly to 4.5%.
• Pricing climbed steadily with downtown units now trading near
$230,000 per unit on average. Suburban pricing remained flat at Multifamily Sale Price Per Unit and Vacancy
$170,000 per unit. $250 Avg. PPU, Downtown 8%
Avg. PPU, Midtown
• According to the Canadian Housing and Mortgage Corporation, 7%
Avg. PPU, Suburban
Montreal’s rental vacancy rate fell to 1.5% in 2019 and average rent $200 Vacancy Rate
CAD, Thousands
is now $841 per month. Of all Canadian cities with a population 6%
above 300,000, only Quebec City has lower apartment rents. 5%
Vacancy RAte
$150
4%
Retail $100 3%
• Retail investment reached $1.1b for 2019, more than in any other 2%
city aside from Toronto. This marked the first time since 2014 that $50
1%
Montreal saw over $1 billion in retail properties sold.
• Canada’s largest enclosed mall sale for the year was Ivanhoe $- 0%
Cambridge and CPPIB’s joint venture sale of Carrefour de l’Estrie in 2014 2015 2016 2017 2018 2019
Sherbrooke to Groupe Mach for $236m at a 7.34% cap rate.
Cadillac Fairview sold a 50% interest in Carrefour Laval to TD Asset
Retail Investment Volumes and Cap Rates
Management, with details forthcoming. $2.0 10%
• Montreal is currently facing high vacancy for streetfront retail, Total Investment Regional Malls
9%
prompting city council to launch a study to understand how to Power Center Food Anchored Strip
8%
rectify the situation. With unemployment at near record lows and $1.5 GoC 10-yr Bond
the economy flourishing, experts are pointing to high property 7%
CAD, Billions
Avg. Cap Rate
taxes, online shopping, and excessive supply as the culprits. In 6%
response, the city is lowering property tax on the first $625,000 of $1.0 5%
assessed value for commercial properties.
4%
• Montreal and surrounding areas saw a handful of retail portfolio
3%
transactions this year. Partners REIT sold a $147m 8-asset $0.5
portfolio to Forum, which was valued at a 7.5% cap rate. First 2%
Capital, seeking to recycle capital for its core urban retail initiative, 1%
sold a $165m retail portfolio to Trudel at a 7.25% cap rate. $- 0%
Cominar also sold a sizeable retail portfolio valued at nearly 2014 2015 2016 2017 2018 2019
$160m.
Source: JLL Research, Altus ITS, CMHC
© 2019 Jones Lang LaSalle IP, Inc. All rights reserved. All information contained herein is from sources deemed reliable; however, no representation or warranty is made to the accuracy thereof.
Page 20Montréal Canada Investment Outlook | Year-End 2019
Industrial Investment Volumes and Price PSF
Industrial
$1.4 $160
• Industrial investment volumes surpassed $1 billion for only the second Total Investment
$1.2 Multi Tenant $140
time on record. Appetite for stabilized product is extremely high, and
pricing on a per-square-foot basis has jumped by over 25% for both Single Tenant $120
CAD, Billions
$1.0
single-tenant and multi-tenant spaces.
Avg. Price PSF
$100
• Cap rates have plunged from a year ago; average single-tenant cap $0.8
rates fell from 5.7% to 5% and multi-tenant cap rates fell from 5.9% to $80
5.3%. Montreal industrial rents and sale prices are generally the lowest $0.6
$60
among major Canadian markets on a per-square-foot basis.
$0.4
• With so many tenants being squeezed out of Vancouver and Toronto $40
at the moment, this is putting pressure on the Montreal market. This $0.2 $20
past year saw a record of 4.8 million square feet of positive net
absorption, pushing vacancy down 120 basis points from last year to a $- $-
record low of 2.7%. Net rents jumped by 10% for the second straight 2014 2015 2016 2017 2018 2019
year, now at $7.30 psf.
• E-commerce continues to re-shape the industrial landscape in favour Average Industrial Net Rent and Vacancy
of more modern infrastructure and higher clear heights. However the Avg. Rent
growing demand is coming into conflict with municipalities that are $8 Avg. Vacancy Rate 8%
focused on promoting mixed-use zoning in infill areas. Despite the
large supply pipeline at the moment, available land remains limited $7 7%
and this will continue to drive price appreciation in the medium term. $6 6%
Avg. Net Rent, sf/yr
• 80% of the buyer profile consisted of private investors. The remaining
Vacancy Rate
$5 5%
20% pertains to the HOOPP portfolio sale, which was purchased by
PIRET in the largest industrial transaction in Montreal’s history. The $4 4%
$260m portfolio works out to $180 per square foot. $3 3%
• Amazon has announced that they will open their first Quebec $2 2%
fulfilment centre in Lachine, and they plan to have it open in time for
the 2020 holiday shopping season. $1 1%
• Canadian Pacific has announced a new multi-modal transload $- 0%
terminal to be built at their Cote St. Luc railyard. The terminal will be 2014 2015 2016 2017 2018 2019
built by CP and operated by Quebec-based freight operator TYT.
Industrial Cap Rates
Alternative Assets 8%
• Senior housing penetration in Quebec is estimated at 18%, more than 7%
twice the rate for the rest of the country. Multi-residential housing is 6%
far more common in Montreal, so people are more likely to live in a
multi-residential community in their elder years. 5% Single Tenant
Multi Tenant
• The largest real estate transaction in Canada this year was Le Groupe 4% GoC 10-yr Bond
Maurice’s 85% share sale of a senior housing portfolio to Ventas REIT. 3%
The portfolio was sold for over CAD $2 billion, and consists of 31
stabilized properties, and 4 development sites, with 8,917 beds in all. 2%
The transaction was valued at a 5.52% cap rate. 1%
• Maisons Vivalto, a consortium that includes a prominent French senior
0%
housing developer, has acquired a portfolio of more than 500 beds in
2014 2015 2016 2017 2018 2019
Montreal for $80m.
Source: JLL Research, JLL REIS, Altus ITS
© 2019 Jones Lang LaSalle IP, Inc. All rights reserved. All information contained herein is from sources deemed reliable; however, no representation or warranty is made to the accuracy thereof.
Page 21Montréal Aperçu des marchés des capitaux | T4 2019
Montréal
   Aperçu des marchés des capitaux | T4 2019
Investissement immobilier par catégorie d'actif Profil des Investisseurs immobiliers du marché,
2019
$10 Multi-résidentiel Terrains 4% Étranger
$9 Hôtels Industriel
Gestionnaires de
$8 Bureaux Détail 10%
CAD, Milliards
Placement
$7 Actifs Alternatifs 28%
Fonds de Pension
$6
$5 Privé
$4 46%
12% Publique
$3
$2
Utilisateur
$1
$-
2014 2015 2016 2017 2018 2019
Source : RCA, RealNet, Royal Chabot Grant Thornton,
Domicile des acquéreurs, 2019 transactions > 5 millions $, directement et au niveau des entités
Canada États-Unis Suède Inconnue
72% 24% 1% 3%
Multi-résidentiel
Terrains
Hôtels
Industriel
Bureaux
Détail
Résidences pour
personnes âgées
* La taille du cercle
correspond au montant de la
transactionMontréal Aperçu des marchés des capitaux | T4 2019
Investissement Total et Prix par Pied Carré
Général
$1.8 investissement total $600
• Selon le Conference Board du Canada, Montréal a affiché le taux de
croissance économique le plus élevé de toutes les grandes régions $1.6 centre-ville, Cat. A
métropolitaines canadiennes en 2019. L'économie a connu une croissance $500
de plus de 3 % pour une troisième année de suite, grâce aux secteurs $1.4 banlieue, Cat. A
Prix par pied carré
manufacturier, financier, et immobilier, ainsi que des services scientifiques
$1.2 $400
CAD, Milliards
et techniques. Les industries axées sur le savoir, en plein essor actuellement
à Montréal, stimulent la demande dans les secteurs des immeubles de $1.0
bureaux et industriels, qui se répercute sur le commerce de détail et le $300
secteur résidentiel. $0.8
• En affichant un volume d'investissement total de 8,9 milliards $, Montréal a
plus que doublé son record précédent, établi l'année dernière. Les $0.6 $200
investisseurs institutionnels continuent d’affluer vers Montréal, à la $0.4
recherche de meilleurs taux de capitalisation, par rapport à ceux de Toronto $100
et de Vancouver, ce qui stimule la liquidité du marché. L'activité $0.2
d'investissement a été plutôt diversifiée, car répartie dans plusieurs secteurs
: bureaux (2,2 milliards $), actifs alternatifs (2,1 milliards $), multi-résidentiel $- $-
(1,5 milliard $), détail (1,1 milliard $) et industriel (1 milliard $). 2014 2015 2016 2017 2018 2019
• La Banque de l’infrastructure du Canada travaille avec l'Administration
portuaire de Montréal sur un projet de terminal à conteneurs à Contrecœur.
Le début de la construction du terminal, qui pourrait coûter jusqu'à un Loyers et taux d’inoccupation (bureaux) de la GRM
milliard de dollars, est prévu vers le milieu de l'année 2020.
loyers moyen net, centre-ville
Bureaux 25%
loyers moyen net, banlieue
taux d'inoccupation, centre-ville $25
Loyer net moyen (du pied carré)
• Ayant affiché une absorption nette positive d'environ 3,1 millions de pieds taux d'inoccupation, banlieue
20% $20
carrés en 2019, le marché des bureaux de Montréal a connu son année la Taux d’inoccupation
plus active depuis près de deux décennies. L'activité de location a augmenté
dans tous les sous-marchés de Montréal, mais elle a été particulièrement 15% $15
forte dans le Centre-ville et le Centre-de-l’île.
• Le taux d'inoccupation au Centre-ville a chuté de 300 points de base, depuis
10% $10
le début de l'année, pour finir à 7,3 %. Les loyers nets ont augmenté de plus
de 30 % par rapport à l'année précédente, et atteignent actuellement une
moyenne de 20,38 % du pied carré. Les sous-marchés de la banlieue ont 5% $5
également connu une bonne performance, affichant une baisse du taux
d'inoccupation de plus de 100 points de base et une hausse des loyers nets
0% $-
de plus de 8 %.
• Du côté de l'investissement, la liquidité totale du marché des bureaux de la 2014 2015 2016 2017 2018 2019
grande région de Montréal a triplé par rapport à l'année dernière. Les taux
de capitalisation de référence ont baissé dans les sous-marchés du Centre- Taux de capitalisation, bureau
ville (à 4,8 %) et du Centre-de-l’île (à 5,7 %), mais ont légèrement augmenté
en banlieue, à 6,1 %. Le Centre-ville a connu une inflation des prix de plus de 10% centre-ville, Cat. A
10 %, sur une période d’un an. 9% banlieue, Cat. A
• Cette année, plusieurs transactions d’envergure ont eu lieu dans les sous- 8% obligations du Canada de 10 ans
marchés du Centre-ville et du Centre-de-l’île. Oxford et PSP ont vendu le
1250, boulevard René-Lévesque Ouest à BentallGreenOak, Kevric a acquis le 7%
siège social de la Banque Nationale situé au 600, rue De La Gauchetière 6%
Ouest, Crestpoint a acheté le 1010, rue De La Gauchetière Ouest, et Spear 5%
Street Capital s’est porté acquéreur du 6650, rue Saint-Urbain dans le Mile-
Ex. 4%
• L'investisseur le plus actif sur le marché des immeubles de bureaux cette 3%
année a été le FPI Allied. Tirant parti d'une importante émission d'actions 2%
effectuée au début de l'année, le FPI Allied a acquis plus de 2 millions de
pieds carrés d’espaces de bureaux, à Montréal, dont le 700, rue De La 1%
Gauchetière Ouest, le Centre de commerce mondial de Montréal et l'édifice 0%
RCA. Allied prévoit cibler un bassin de locataires en pleine croissance à 2014 2015 2016 2017 2018 2019
Montréal, soit celui provenant du secteur technologique.
Source : Recherche JLL, REIS JLL, Altus ITS
© 2019 Jones Lang LaSalle IP, Inc. All rights reserved. All information contained herein is from sources deemed reliable; however, no representation or warranty is made to the accuracy thereof.
Page 24Montréal Aperçu des marchés des capitaux | T4 2019
Investissement Total et taux d'capitalization multi-résidentiel
investissement total
Multi-résidentiel $2.5 centre-ville 8%
banlieue
• Le marché multi-résidentiel de Montréal a enregistré des transactions d’une 7%
périphérie
valeur de plus de 1,5 milliard $, en 2019, soit un peu moins que le record $2.0 obligations du Canada de 10 ans 6%
établi dans ce marché en 2015.
taux d'inoccupation
CAD, Milliards
• Minto a été un acteur important sur le marché des bureaux montréalais en 5%
2019, où il a effectué des acquisitions de plus de 700 millions $, dont, $1.5
notamment, Les Appartements Rockhill, Le 4300 et Haddon Hall. La société 4%
InterRent REIT, basée à Ottawa, a également été très active. Elle a amassé $1.0
plus de 200 millions $ en capitaux propres, pour ensuite les déployer 3%
rapidement afin d’acquérir cinq immeubles, comptant plus de 700 unités. 2%
• Le profil des acheteurs est principalement celui des groupes privés, ceux-ci $0.5
ayant représenté 55 % de la liquidité totale du marché. 1%
• Les taux de capitalisation ont continué à baisser, au Centre-ville, le taux de
référence tombant à 4,1 %. Les taux de capitalisation dans le sous-marché $- 0%
du le Centre-de-l’île sont demeurés stables, à 4,6 % en moyenne, tandis que 2014 2015 2016 2017 2018 2019
les taux de capitalisation des sous-marchés de la banlieue ont légèrement
baissé, à 4,5 %.
• Les prix des unités multi-résidentielles ont augmenté régulièrement, ceux du Prix par pi2 et taux d'inoccupation multi-résidentiel
Centre-ville se négociant désormais à près de 230 000 $, en moyenne, tandis
$250 centre-ville périphérie 8%
que les prix en banlieue sont restés stables, à 170 000 $ l'unité.
• Selon la Société canadienne d'hypothèques et de logement, le taux banlieue taux d'inoccupation
7%
Prix par Unite, Milliers
d'inoccupation des logements locatifs est tombé à 1,5 %, à Montréal, en
$200
2019, et le loyer moyen est maintenant de 841 $ par mois. De toutes les villes 6%
taux d'inoccupation
canadiennes de plus de 300 000 habitants, seule la ville de Québec a des
loyers multi-résidentiels moins élevés. $150 5%
4%
Commerce de détail $100 3%
• L'investissement dans les immeubles de commerce de détail a atteint 1,1
milliard $, en 2019, plus que dans toute autre ville canadienne, à l'exception 2%
de Toronto. C'est la première fois depuis 2014 qu’il s’est vendu des $50
immeubles de commerce de détail d’une valeur de plus d'un milliard $ à 1%
Montréal, au cours d’une année.
$- 0%
• Au cours de la dernière année, la plus importante vente de centre
commercial fermé, au Canada, fut la vente, par Ivanhoé Cambridge et 2014 2015 2016 2017 2018 2019
l'OIRPC, du Carrefour de l'Estrie, à Sherbrooke, au Groupe Mach, qui l’a
acquis pour la somme de 236 millions $, représentant un taux de
capitalisation de 7,34 %. Pour sa part, Cadillac Fairview a vendu une Taux de capitalization, commerce de détail
participation de 50 % dans le Carrefour Laval à Gestion de Placements TD,
$2.0 Investissement Total 10%
dont les détails sont à venir.
Régional
• Montréal est actuellement confrontée à un taux d’inoccupation élevé pour 9%
les locaux de commerce de détail ayant pignon sur rue, ce qui a incité le Grande surface
Linéaire (alimentation) 8%
conseil municipal à lancer une étude pour tenter de trouver des solutions à $1.5
cet égard. Compte tenu du taux de chômage frôlant un creux historique et Obligations du Canada de 10 ans 7%
CAD, Milliards
d’une économie florissante, les experts pointent le doigt vers les taxes
6%
foncières élevées, les achats en ligne et une offre excessive. En réaction, la
taxe foncière sera réduite sur les premiers 625 000 $ de la valeur foncière des $1.0 5%
propriétés commerciales.
4%
• Quelques portefeuilles de commerce de détail ont fait l’objet de
transactions à Montréal et dans ses environs au cours de l’année. Partners 3%
REIT a vendu un portefeuille de huit actifs à Forum Properties pour la $0.5
somme de 147 millions $, représentant un taux de capitalisation de 7,5 %. 2%
First Capital a vendu un portefeuille de 165 millions $ au FPI Trudel Alliance, 1%
représentant un taux de capitalisation de 7,25 %, en vue de réaffecter les
capitaux provenant de cette vente à son programme de commerce de détail $- 0%
urbain. Cominar a également vendu un important portefeuille de vente au 2014 2015 2016 2017 2018 2019
détail d'une valeur de près de 160 millions $.
Source : Recherche JLL, Altus ITS, CMHC
© 2019 Jones Lang LaSalle IP, Inc. All rights reserved. All information contained herein is from sources deemed reliable; however, no representation or warranty is made to the accuracy thereof.
Page 25Montréal Aperçu des marchés des capitaux | T4 2019
Investissement total industriel et prix par pi2
$1.4 $160
Industriel investissement total
$1.2 multi-locataire $140
Le marché industriel de Montréal a également établi un record l'année
dernière grâce à une absorption nette positive de 4,8 millions de pieds locataire unique
$120
carrés. Ce niveau d’absorption record a fait chuter le taux d'inoccupation de $1.0
CAD, Milliards
120 points de base par rapport à l'année dernière, pour atteindre 2,7 %. Les
Prix par pi2
$100
loyers nets ont bondi de 10 % pour la deuxième année consécutive, et $0.8
atteignent maintenant 7,30 $ du pied carré. $80
Le commerce en ligne continue de transformer le marché industriel en $0.6
faveur d'infrastructures plus modernes ayant des hauteurs libres sous $60
plafond plus élevées. Toutefois, la demande croissante pour ce type
d’installations se bute aux administrations municipales, qui privilégient des $0.4
$40
immeubles à usage mixte pour les aménagements intercalaires. Malgré
l'importance des projets de actuellement en cours de construction ou à $0.2 $20
l’étape de la planification, les terrains disponibles demeurent rares, ce qui
maintiendra les prix à la hausse, à moyen terme. $- $-
Le volume des investissements industriels a dépassé le milliard de dollars 2014 2015 2016 2017 2018 2019
pour la seconde fois seulement. L'attrait des actifs industriels existants est
extrêmement élevé actuellement, comme en font foi les prix au pied carré Loyers nets industriels et taux d'inoccupation
des installations à locataire unique et à locataires multiples, qui ont bondi
de plus de 25 %. Les taux de capitalisation ont chuté par rapport à l'année Loyers nets
dernière : le taux de capitalisation moyen pour les actifs à locataire unique $8 8%
Taux d'inoccupation
sont passés de 5,7 % à 5 %, tandis que celui des actifs ayant plusieurs
locataires est passé de 5,9 % à 5,3 %. Toutefois, il est important de souligner $7 7%
que les loyers et les prix de vente au pied carré des actifs industriels de
loyers nets par pi2
Montréal sont généralement parmi les plus bas de tous les principaux $6 6%
taux d'inoccupation
marchés canadiens. $5 5%
En 2019, les investisseurs privés représentaient 80 % des acquéreurs d’actifs
industriels. Les autres 20 % concernent la vente, par HOOPP Realty, d’un $4 4%
portefeuille de 11 propriétés industrielles à PIRET, dans le cadre de la plus
grande transaction industrielle de l'histoire de Montréal. Ce portefeuille de $3 3%
260 millions $ représente une valeur de 180 $ du pied carré.
$2 2%
Amazon a annoncé qu'elle ouvrira son premier centre d’expédition au
Québec à Lachine, et qu'elle prévoit l'ouvrir à temps pour la période des $1 1%
Fêtes, à la fin de 2020.
Le Canadien Pacifique a annoncé la construction d'un nouveau terminal de $- 0%
transbordement multimodal à sa gare de triage de Côte Saint-Luc. Le 2014 2015 2016 2017 2018 2019
terminal sera construit par le CP et exploité par le transporteur TYT, basé au
Québec.
Taux de capitalisation industriel
8%
Actifs alternatifs 7%
En raison du fait que les logements multi-résidentiels sont beaucoup plus 6%
courants à Montréal que dans les autres villes canadiennes, les gens d'ici
sont beaucoup plus réceptifs à l'idée de vivre dans une communauté multi- 5%
résidentielle pour personnes âgées. Il n'est pas surprenant qu’au Québec, le multi-locataire
taux de pénétration du marché de l'habitation pour personnes âgées soit 4% locataire unique
estimé à 18 %, soit deux fois plus que dans le reste du pays. 3% obligations du Canada de 10 ans
La plus grande transaction immobilière au Canada, cette année, fut la vente
par Le Groupe Maurice de 85 % d'un portefeuille de logements pour 2%
personnes âgées à la fiducie de placement immobilier Ventas. Le
portefeuille a été vendu pour plus de 2 milliards CAD et comprend 31 actifs 1%
existants et 4 sites en développement, pour un total de 8 917 lits. Le taux de
capitalisation attribué à la transaction est de 5,52 %. 0%
Maisons Vivalto, un consortium qui inclut un important promoteur français 2014 2015 2016 2017 2018 2019
de logements pour personnes âgées, a acquis un portefeuille de plus de 500
lits à Montréal, pour 80 millions $. Source : Recherche JLL, REIS JLL, Altus ITS
© 2019 Jones Lang LaSalle IP, Inc. All rights reserved. All information contained herein is from sources deemed reliable; however, no representation or warranty is made to the accuracy thereof.
Page 26You can also read