Current Status and Future Outlook for Hydropower - VALUING FLEXIBILITY IN EVOLVING ELECTRICITY MARKETS: IEA Hydro
←
→
Page content transcription
If your browser does not render page correctly, please read the page content below
VALUING FLEXIBILITY IN EVOLVING
          ELECTRICITY MARKETS:
    Current Status and Future Outlook
.
             for Hydropower

                                IEA Hydro Technical Report

                    Annex IX
      Valuing Hydropower Services – Phase II
                    June 2021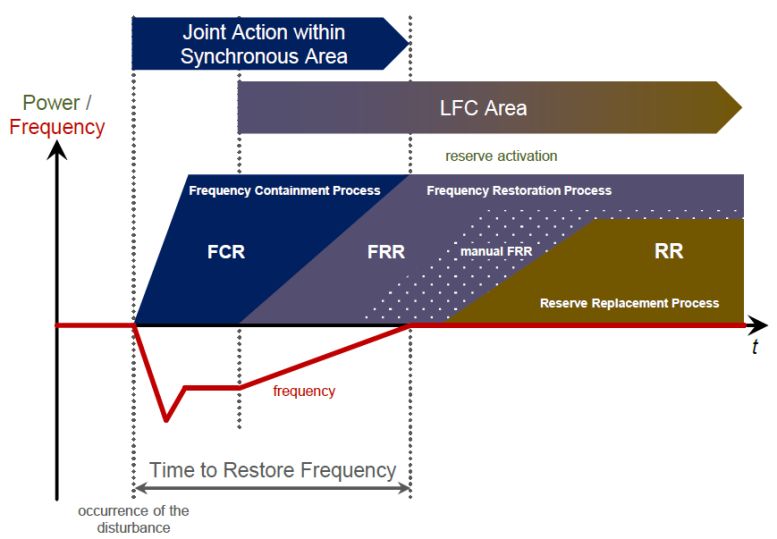
Contents
Acknowledgements ....................................................................................................................................... 5
Summary ........................................................................................................................................................ 6
1      Introduction ........................................................................................................................................... 7
2      System Flexibility Needs ........................................................................................................................ 8
3      Survey of Flexibility Services in Current Systems ................................................................................10
    3.1        Energy and Capacity Mix in Participating Systems ......................................................................10
    3.2        Survey Summary ..........................................................................................................................12
       3.2.1          Flexibility Services ................................................................................................................12
       3.2.2          Procurement of Flexibility Services .....................................................................................13
       3.2.3          Compensated Services .........................................................................................................14
       3.2.4          Hydropower Contribution to Flexibility Services .................................................................15
       3.2.5          Market Size and Price Description .......................................................................................16
       3.2.6          Trends and Future Developments .......................................................................................17
4      International Case Studies of Flexibility Services ................................................................................19
    4.1        Switzerland: Coordination of Flexibility Services with Continental Europe ................................19
    4.2        Norway: Large-scale Hydropower for Balancing Wind and Solar Power in Northern Europe ....21
    4.3        Canada: Flexibility Requirements and Services in Hydro Québec ...............................................23
    4.4        USA: Flexibility Requirements and New Market Initiatives in California ISO ..............................25
    4.5        Brazil: Maintaining Long-term Resource Adequacy through Public Auctions .............................28
    4.6        Australia: The Need for Deep Storage – an Uncertain Pathway .................................................30
    4.7        Japan: VRE Integration and the Role of Pumped Storage Hydropower ......................................32
5      Main Observations from Survey and Case Studies ..............................................................................34
6      Conclusion and Future Directions........................................................................................................36
7      References ...........................................................................................................................................38
8      Appendix A: Survey Response Summaries by Timescale ....................................................................41
    8.1        Sub-Second to Second Timescale ................................................................................................41
    8.2        Second to Minute Timescale .......................................................................................................43
    8.3        Minutes to Hours Timescale ........................................................................................................47
    8.4        Hours to Days Timescale ..............................................................................................................51
    8.5        Days to Months, Months to Years’ Timescale .............................................................................55
    8.6        Trends and Developments ...........................................................................................................58
9      Appendix B: Terminology.....................................................................................................................61

                                                                                                                                                                2
      IEA Hydro Annex IX: Valuing Flexibility in Evolving Energy Markets. June 2021.
List of Figures
FIGURE 1 INTERRELATION OF FLEXIBILITY NEEDS IN PERSPECTIVES OF SPACE AND TIME (BASED ON HILLBERG ET AL. 2019) ...................... 9
FIGURE 2 GENERATING RESOURCE MIX IN 2019 FOR PARTICIPATING SYSTEMS (SOURCE: SURVEY INPUTS, IEA DATA AND STATISTICS
(HTTPS://WWW.IEA.ORG/DATA-AND-STATISTICS), EIA HTTPS://WWW.EIA.GOV/INTERNATIONAL/OVERVIEW/WORLD). ............. 11
FIGURE 3 CAPACITY MIX IN 2019 FOR PARTICIPATING SYSTEMS. NOTE THAT TECHNOLOGY BREAKDOWN DIFFERS BETWEEN COUNTRIES (I.E.
NATURAL GAS AND COAL INCLUDED IN OTHER FOSSILS FOR CZECH REPUBLIC, GERMANY, INDIA, TURKEY, FINLAND, AND COLOMBIA).
(SOURCE: SURVEY INPUTS, IEA DATA AND STATISTICS (HTTPS://WWW.IEA.ORG/DATA-AND-STATISTICS), EIA
HTTPS://WWW.EIA.GOV/INTERNATIONAL/OVERVIEW/WORLD). ....................................................................................... 11
FIGURE 4 RENEWABLE ELECTRICITY GENERATION IN COUNTRIES /REGIONS PARTICIPATING IN SURVEY. (SOURCE: SURVEY INPUTS, IEA DATA
AND STATISTICS (HTTPS://WWW.IEA.ORG/DATA-AND-STATISTICS), EIA
HTTPS://WWW.EIA.GOV/INTERNATIONAL/OVERVIEW/WORLD). ....................................................................................... 12
FIGURE 5 NUMBER OF SPECIFIC FLEXIBILITY SERVICES REPORTED IN SURVEY RESPONSES GROUPED BY GENERAL SERVICE TYPE AND
TIMESCALE. ............................................................................................................................................................. 13
FIGURE 6 SUMMARY OF PROCUREMENT METHODS BY TIMESCALE, AS REPORTED BY SURVEY RESPONSES. NOTE THAT THE SUM OF THE
PERCENTAGES WITHIN EACH TIMESCALE IS GREATER THAN 100% BECAUSE SERVICES MAY BE PROCURED THROUGH MORE THAN ONE
PROCUREMENT MECHANISM. ALSO, DATA WAS NOT COMPLETE FOR ALL OF THE 14 RESPONDENTS FOR EACH OF THE PROCUREMENT
METHODS. INDIVIDUAL RESPONSES ARE INCLUDED IN APPENDIX A. .................................................................................... 14
FIGURE 7 OVERVIEW OF COMPENSATED FLEXIBILITY SERVICES. NOTE THAT NOT ALL COUNTRIES/REGIONS PROVIDED A RESPONSE FOR EACH
TIMESCALE AND THAT THE NUMBER OF RESPONSES MAY EXCEED THE NUMBER OF RESPONDENTS AS A SERVICES MAY BE OFFERED
THROUGH MORE THAN ONE PROCUREMENT MECHANISM. ALSO, THE TOTAL FOR A SPECIFIC SERVICE WITHIN A TIMESCALE MAY VARY
FROM THE RESULTS PRESENTED IN FIGURE 5 BECAUSE THERE ARE CASES WHERE A SERVICE MAY BE COMPENSATED THROUGH MORE
THAN ONE MECHANISM. THE DETAILED RESPONSES ARE PRESENTED IN APPENDIX A. ............................................................. 15
FIGURE 8 RESPONSES TO THE QUESTION OF WHETHER HYDROPOWER PROVIDES FLEXIBILITY SERVICES ACROSS TIMESCALES . PERCENT OF
RESPONDENTS ANSWERING YES, NO, OR NO RESPONSE. DETAILED RESPONSES ARE INCLUDED IN APPENDIX A. ............................ 15
FIGURE 9 MARKET SIZE BY TIMESCALE FOR NON-ENERGY SERVICES. SYSTEMS AND TIMESCALES WITH NO RESPONSES ARE EXCLUDED . THE
DETAILED RESPONSES ARE PRESENTED IN APPENDIX A...................................................................................................... 16
FIGURE 10 MARKET SIZE BY TIMESCALE FOR ENERGY SERVICES. SYSTEMS AND TIMESCALES WITH NO RESPONSES ARE EXCLUDED . THE
DETAILED RESPONSES ARE PRESENTED IN APPENDIX A...................................................................................................... 17
FIGURE 11 TIME DOMAIN HIERARCHY OF THE LOAD-FREQUENCY CONTROL PROCESS (ENTSO-E 2018B) .......................................... 21
FIGURE 12 PROJECTED POWER GENERATION DIFFERENT RESOURCES IN THE NORDIC COUNTRIES (I.E. NORWAY, SWEDEN, DENMARK, AND
FINLAND, BUT EXCLUDING ICELAND) (BASED ON DATA FROM: NVE 2020). ........................................................................ 22
FIGURE 13 OVERVIEW OF HVDC CONNECTORS IN OPERATION (BLACK) AND UNDER CONSTRUCTION (RED, DOTTED) TO/FROM THE NORDIC
AREA (DATA FROM ENTSO-E. MAP FROM WIKIMEDIA). ................................................................................................. 23
FIGURE 14 HOURLY LOAD (MW) IN QUÉBEC, 2019 (RÉGIE DE L’ÉNERGIE QUÉBEC 2020)............................................................. 24
FIGURE 15 THE GENERATION MIX (MW) ON APRIL 1, 2020 IN CAISO (DATA SOURCE: CAISO) .................................................... 26
FIGURE 16 ABSOLUTE SCHEDULING ERRORS IN DAM AND FIVE-MINUTE MARKET IN CAISO IN 2019, AS PERCENTAGE OF LOAD (DATA
SOURCE: CAISO) ..................................................................................................................................................... 26
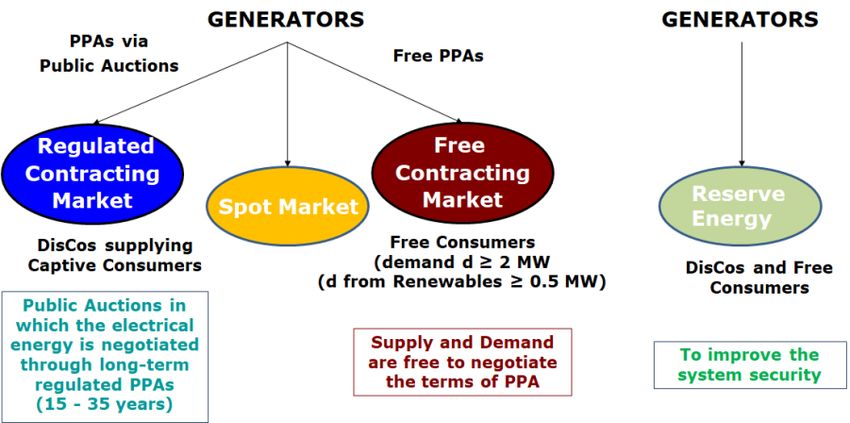
FIGURE 17 CONTRACT ENVIRONMENTS FOR ELECTRICITY IN BRAZIL. ............................................................................................ 29
FIGURE 18 RESULTS OF PUBLIC AUCTIONS IN BRAZIL: 2008-2015. ............................................................................................ 30
FIGURE 19 PROJECTED RETIREMENTS AND REPLACEMENTS IN AUSTRALIA (AEMO 2020). ............................................................. 31
FIGURE 20 ELECTRICITY SUPPLY AND DEMAND IN LIGHT -LOAD SEASON, APRIL 2019 (KYUSHU). ...................................................... 33
3
IEA Hydro Annex IX: Valuing Flexibility in Evolving Energy Markets. June 2021.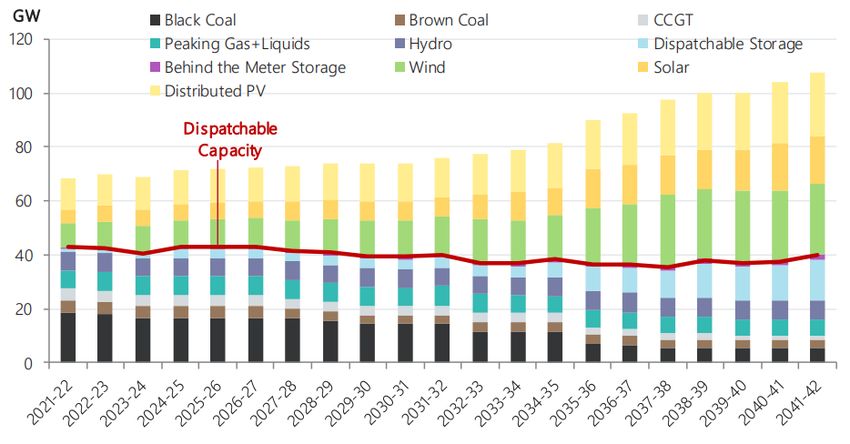
List of Tables
TABLE 1 FLEXIBILITY SERVICES ACROSS DIFFERENT TIMESCALES (SOURCE: IEA 2018). ...................................................................... 8
TABLE 2 SUMMARY OF FLEXIBILITY SERVICE TYPES BY TIMESCALE ................................................................................................ 13
TABLE 3 SUMMARY OF MARKET PRICES FOR FLEXIBILITY SERVICES . MIN, MAX, AND MEAN VALUES ACROSS COUNTRIES/REGIONS THAT
     PROVIDED MARKET PRICE DATA . NOTE THAT PRICES WERE ESTIMATED BASED ON SURVEY INPUTS , ACCOUNTING FOR EXCHANGE RATES
     AND DIFFERENCES IN THE FORMAT OF RESPONSES . .......................................................................................................... 17
TABLE 4 SUMMARY OF FUTURE TRENDS AND DEVELOPMENTS . ................................................................................................... 18
TABLE 5 REQUIRED OPERATING RESERVES IN QUÉBEC. ............................................................................................................. 24
TABLE 6 FLEXIBLE RESOURCE ADEQUACY CONSTRUCTS IN CAISO ............................................................................................... 27

                                                                                                                                                             4
      IEA Hydro Annex IX: Valuing Flexibility in Evolving Energy Markets. June 2021.
Acknowledgements
Editors and authors: Audun Botterud, Chris O’Reilley, Abhishek Somani
Authors: Alex Beckitt, Osamu Kato, Magnus Korpås, Albert Cordeiro Geber de Melo, Luke Middleton,
Linn Emelie Schäffer, Guillaume Jean Tarel, Elena Vagnoni, Donald Vaughan, Cesar Zani
Reviewers: Hill Balliet, Sam Bockenhauer, Atle Harby, Lori Nielsen, Niels Nielsen
We also acknowledge the following individuals for their input to the survey on power system flexibility
and hydropower summarized in Chapter 3: Zuzana Sadlova, CEZ Group (Czech Republic), Orkan Appinar,
Schluchtseewerke (Germany), Furkan Yardimci, Elektrik Üretim (Turkey), Marja Rankila, Finnish Energy
(Finland), S.S.Barpanda, POSOCO (India). Inputs for other countries were provided by the report authors.
The IEA Technology Collaboration Programme On Hydropower
The IEA Technology Collaboration Programme on Hydropower (IEA Hydro) is a working group of
International Energy Agency member countries and others that have a common interest in advancing
hydropower worldwide. Current members of the IEA Hydro TCP are Australia, Brazil, China, EU, Finland,
Japan, Norway, Switzerland, USA. Sarawak EB is a sponsor. Member governments either participate
themselves, or designate an organization in their country to represent them on the Executive
Committee (ExCo) and the working groups (Annexes), through which IEA Hydro’s work is carried out.
Some activities are collaborative ventures between the IA and other hydropower organizations.
Vision
Through the facilitation of worldwide recognition of hydropower as a well-established and socially
desirable energy technology, advance the development of new hydropower and the modernization of
existing hydropower
Mission
To encourage through awareness, knowledge, and support the sustainable use of water resources for the
development and management of hydropower.
To accomplish its Mission, the Executive Committee has identified the following programme- based
strategy to:
• Apply an interdisciplinary approach to the research needed to encourage the public acceptance
of hydropower as a feasible, socially desirable form of renewable energy.
• Increase the current wealth of knowledge on a wide array of issues currently associated with
hydropower.
• Explore areas of common interest among international organizations in the continued use of
hydropower as a socially desirable energy resource.
• Bring a balanced view of hydropower as an environmentally desirable energy technology
to the worldwide debate.
• Encourage technology development.
IEA Hydro is keen to promote its work programmes and to encourage increasing involvement of non-
participating countries. All OECD and non-OECD countries are eligible to join. Information about
membership and research activities can be found on the IEA Hydro website www.ieahydro.org
5
IEA Hydro Annex IX: Valuing Flexibility in Evolving Energy Markets. June 2021.Summary
The rapid expansion of variable renewable energy (VRE) resources combined with retirements of
thermal generation give rise to increasing needs for flexibility at transmission, distribution, and the
individual resource levels in the power system. The fundamental challenges associated with VRE
integration and corresponding power system flexibility needs are similar across the world. A number of
different solutions are being developed to address these challenges, from infrastructure investments
(e.g. in flexible generation, increased transmission, energy storage, and demand response) to enhanced
algorithms for forecasting, planning and operations, and improved electricity market design. Hence,
important lessons can and should be learned between countries and regions as part of the ongoing shift
towards cleaner electricity systems with a lower carbon footprint and more variable resources.
In this report, we present a system-level review of how flexibility services are defined, procured, and
valued in selected electricity markets, with a particular focus on the status and outlook for hydropower.
We find that there is a wide range of solutions to address flexibility challenges in current power systems.
Although the definitions of flexibility services are similar in the 14 systems reviewed in this report,
substantial variations exist in terms of how these services are procured and remunerated. Challenges in
many systems include a lack of appropriate remuneration or a clear price signal for some flexibility
services, particularly in the shortest timescale, and limited incentives for long-term investments in
flexible technologies like hydropower. Still, a common feature across systems is that hydropower plays
an important role providing flexibility services across all timescales. This observation highlights the
unique characteristics of hydropower in its ability to provide the full spectrum of flexibility needs to the
system, from short-term stability services to long-term seasonal storage through management of hydro
reservoirs. With the increasing penetration of VRE sources and corresponding retirements of traditional
thermal generators, we expect that the value of hydropower and other flexible low-carbon resources
will increase in the future. However, it is important that the services provided by these resources are
fully remunerated for the values they provide to the electricity grid. The findings from this review may
inform improved electricity market design and regulations for the future power grid.
This report is the second publication in a series by the IEA Hydropower TCP (Annex IX, Phase 2) on the
valuation of hydropower services. The first publication, White paper #1 entitled “Flexible hydropower
providing value to renewable energy integration” (Harby et al. 2019), discussed the role of hydropower
in grid integration of VRE and emphasized that hydropower is unique in its ability to provide system
flexibility across timescales.
6
IEA Hydro Annex IX: Valuing Flexibility in Evolving Energy Markets. June 2021.1 Introduction
This report is the second publication in a series by the IEA Hydropower Technology Collaboration
Programme (IEA Hydro) Annex IX, to encourage collaboration and knowledge sharing, raise awareness of
the important role of hydropower in contemporary electricity system integration and to explore issues
and solutions to fully realize the value of its contributions to electricity systems. The target audience is
the electric power industry, the hydropower industry, regulators and other authorities, system
operators, researchers, and other stakeholders with an interest in electricity markets, hydropower and
other renewable energy sources.
The rapid expansion of variable renewable energy (VRE) around the world has led to new challenges and
opportunities for planners and operators of power systems and electricity markets, and for the market
participants operating within these complex systems. The key challenge of integrating VRE, such as wind
and solar into the power grid, is to address the variability and uncertainty in these resources in the
planning and operation of the power grid. In general, a more flexible power system is needed to achieve
a cost-efficient integration of VRE. Towards this end, a number of different solutions are being
developed, from infrastructure investments (e.g. in flexible generation, increased transmission, energy
storage, and demand response) to enhanced algorithms for forecasting, planning and operations, as well
as improved electricity market design.
Hydropower, as a clean and flexible generation resource, can clearly play an important role in meeting
VRE integration challenges. The first IEA Hydro Annex IX white paper (Harby et al. 2019) discussed the
role of hydropower in grid integration of VRE and concluded that hydropower is unique in its ability of
provide system flexibility across the timescales, from very short-term operational decisions to long-term
planning. This report delves deeper into flexibility services, including how these services are defined
across different timescales, how flexibility is procured and compensated in different electricity markets
across timescales, and the status and future outlook for hydropower in evolving power grids.
This report is organized as follows. First, we give a brief introduction to the fundamental flexibility needs
in the power system and different mechanisms for procuring these services (Chapter 2). In Chapter 3,
we summarize the findings from an international survey conducted to compare how flexibility services
are managed across 14 different countries/regions. In Chapter 4, we present 7 case studies that provide
perspectives on hydropower, VRE integration, and system flexibility from different geographical,
temporal, and regulatory perspectives. Finally, in Chapter 5, we discuss key observations from survey
and case studies, followed by concluding remarks in Chapter 6. Detailed survey responses are provided
in Appendix A, and a list of terminology in Appendix B.
7
IEA Hydro Annex IX: Valuing Flexibility in Evolving Energy Markets. June 2021.2 System Flexibility Needs
The power system is dependent on flexibility across different timescales in order to maintain overall
reliability by balancing supply and demand and keeping frequency and voltage within their limits in a
cost-effective manner. Table 1 gives a brief overview of flexibility services, as defined by IEA (2018). The
shortest timescales focus on system stability and frequency control. The intermediate timescales focus
on dispatch and scheduling processes to meet current and projected electricity demand across minutes,
hours, and days. The long-term time horizon addresses supply adequacy over months to years through
coordinated long-term scheduling processes and ultimately investments and capacity planning. The
different timescales are closely connected, as the ability to ensure stability in the very short-term
ultimately depends on scheduling, planning and adequacy decisions that are made in the medium and
long-term. Increasing VRE levels impose more uncertainty and variability in the system, which has
implications across timescales, from short-term stability to long-term resource adequacy.
Table 1 Flexibility services across different timescales (Source: IEA 2018).
Flexibility services can also be categorized by the specific area supported within the power grid. The IEA
Technology Collaboration Programme on Smart Grids (ISGAN – International Smart Grids Action
Network) has proposed a combined method for categorizing services that allows for the categorization
of both specific services and the general area of grid flexibility support provided. ISGAN defines four (4)
categories of flexibility services (Hillberg et al. 2019):
1. Flexibility for Power – Short-term equilibrium between power supply and power demand, a
system wide requirement for maintaining the frequency stability (examples include fast
frequency response, inertia, and demand side response).
2. Flexibility for Energy - Medium to long-term equilibrium between energy supply and energy
demand, a system wide requirement for demand scenarios over time (examples include energy
storage and generation, optimization).
3. Flexibility for Transfer Capacity - Short to medium-term ability to transfer power between
supply and demand, where local or regional limitations may cause bottlenecks resulting in
8
IEA Hydro Annex IX: Valuing Flexibility in Evolving Energy Markets. June 2021.congestion costs (examples include network topology control, location of generation, storage,
and demand response capable of responding to grid events).
4. Flexibility for Voltage - Short-term ability to keep the bus voltages within predefined limits, a
local and regional requirement (examples include coordinated reactive power and voltage
control, automatic voltage regulators, flexible AC transmission system (FACTS)).
Figure 1 presents this categorization of flexibility and correlates the four different types of flexibility with
the timescales presented in Table 1.
Figure 1. Interrelation of flexibility needs in perspectives of space and time (based on Hillberg et al. 2019)
In general, system flexibility is provided by electricity generation technologies, the transmission
network, energy storage, and demand resources, but there are a variety of solutions for how flexibility is
procured across different timescales. At the same time, forecasting methods, optimization algorithms,
operational practices, and market rules also contribute to determine the amount of flexibility that is
available in the power system. Hydropower plants provide short-term power and voltage flexibility
through its ability to respond rapidly to conditions in the grid. Moreover, hydropower provides long-
term energy flexibility though large-scale energy storage in hydro reservoirs. A detailed discussion of
different solutions for how hydropower technologies can contribute to future flexibility needs in
European electricity markets is provided in (XFLEX 2020a).
Chapter 3 presents a survey of how system flexibility is addressed in current power systems and
electricity markets.
9
IEA Hydro Annex IX: Valuing Flexibility in Evolving Energy Markets. June 2021.3 Survey of Flexibility Services in Current Systems
Understanding the flexibility needs of the grid allows for the identification of suitable solutions as well as
the resources needed to provide the flexibility services. In general, the most suitable flexibility solutions
depend on the system needs, but must also consider situational restrictions and regulations, capabilities
and availability of power system equipment, and commercial and environmental aspects (Hillberg et al.
2019). IEA Hydro Annex IX developed a survey to gain an understanding of system flexibility services,
how these services are procured, and the potential physical requirements and monetary value of the
flexibility services in different markets around the world. IEA Hydro Annex IX conducted a survey of 14
countries/regions to better understand the various flexibility services used across timescales, how these
services are procured, and to what extent hydropower resources contribute to provide these services.
The survey was comprised of six (6) categories of information, as listed below, with responses to be
provided for each of the timescales in Table 1. We also requested information about capacity and
energy mix for the countries/regions participating in the survey.
Survey requests for information:
1) Please provide a brief overview of relevant grid flexibility services and products.
2) How are these flexibility services currently procured?
3) Are these services compensated?
4) Does hydropower currently provide these services to the power grid?
5) How much is normally procured of this service?
6) List important current and future developments related to these flexibility services.
This chapter summarizes the key results from the flexibility survey, based on the survey responses of the
14 participating countries/regions (full survey responses are included in Appendix A). This is not a
scientific survey with a statistically significant sample, and the survey results and comparisons are only
meant to give an overview of how flexibility services are handled in the respective systems. The results
should be interpreted accordingly.
3.1 Energy and Capacity Mix in Participating Systems
The resource portfolio in a system has an impact on what flexibility services are needed, how these
services are provided at the different timescales, and the technologies that provide the respective
services. Figure 2 and Figure 3 summarize the energy and capacity mix of the 14 systems that
participated in the survey. The penetration levels of renewable electricity generation are illustrated in
Figure 4. The amount of hydropower generation varies from a modest amount, around 4% of generation
in Germany and Czech Republic, to more than 90% of generation in Hydro Québec and Norway. The
combined penetration of wind and solar is negligible in Colombia and as high as 28% in Germany. These
numbers compare to a hydropower electricity share of 16% and a total renewable electricity share of
26% at the global level in 2018. In countries where thermal generation are being replaced with VRE, the
flexibility services available through these thermal plants will need to be replaced as well. For example,
Germany, based on the survey response, is planning to retire its nuclear plants by 2022 and its coal
plants by 2038. These two thermal technologies currently comprise 42% of Germany’s total electricity
generation, which will be replaced by renewables including VRE.
Note that the ability of an individual generator to provide the flexibility services when needed also will
depend on the specific state of the generator (e.g. operating, reserve provision, warm start, cold start,
10
IEA Hydro Annex IX: Valuing Flexibility in Evolving Energy Markets. June 2021.and possibly black start). At the same time, the ability to offer flexibility services over longer durations
also involves understanding the resource planning and policy decisions within the given system.
Figure 2. Generating resource mix in 2019 for participating systems (Source: Survey inputs, IEA Data and
Statistics (https://www.iea.org/data-and-statistics), EIA https://www.eia.gov/international/overview/world).
Figure 3. Capacity mix in 2019 for participating systems. Note that technology breakdown differs between
countries (i.e. natural gas and coal included in other fossils for Czech Republic, Germany, India, Turkey, Finland,
and Colombia). (Source: Survey inputs, IEA Data and Statistics (https://www.iea.org/data-and-statistics), EIA
https://www.eia.gov/international/overview/world).
11
IEA Hydro Annex IX: Valuing Flexibility in Evolving Energy Markets. June 2021.Figure 4. Renewable electricity generation in countries/regions participating in survey. (Source: Survey inputs,
IEA Data and Statistics (https://www.iea.org/data-and-statistics), EIA
https://www.eia.gov/international/overview/world).
3.2 Survey Summary
The following sections present a summary of the survey results for each of the six survey areas. We
present the results in the context of the timescales for flexibility services, as illustrated in Table 1. More
detailed survey responses are provided in Appendix A.
3.2.1 Flexibility Services
Table 2 summarizes the different types of flexibility services defined within each timescale across the 14
systems, as reported in the survey responses. Note that most timescales correspond to multiple types of
flexibility services. For instance, the shortest timescale (subsecond- seconds) include 6 different service
types. Figure 5 illustrates the distribution of specific flexibility services by each timescale. Some services
span multiple timescales. For instance, frequency support (which includes several specific sub-
categories) is the most prevalent service offered across multiple timescales. Energy is the second most
prevalent flexibility service offered.
Note that there is a substantial variation in the terms used for flexibility services in different
regions/countries. Table 2 contains general types of flexibility services. Some of these specific services
have been consolidated for presentation. For example, the frequency support services listed includes all
frequency related services including primary and secondary frequency response (e.g. fast frequency
reserve (FFR), frequency containment reserve (FCR), and frequency response reserves (FRR)). Figure 5
presents the number of specific flexibility services, as defined by the responding countries/regions,
within and across timescales. For example, within the sub-second to second timescale, a total of five
specific frequency support services were reported by survey respondents. The full list of specific
flexibility services offered within each country/region, as reported in the survey responses, is included in
Appendix A.
12
IEA Hydro Annex IX: Valuing Flexibility in Evolving Energy Markets. June 2021.Table 2 Summary of flexibility service types by timescale
TIMESCALE SERVICES
1) Inertia 4) Frequency support
2) Reactive power 5) Spinning reserve
Sub-second - seconds
3) Voltage control 6) Special protection Systems
Seconds - minutes 1) Frequency support 2) Last minute dispatch
1) Energy 3) Black start
Minutes - hours 2) Frequency support 4) Power unit dispatch
1) Energy 3) Long term reserves
Hours – days 2) Ancillary services 4) Demand response
Days-months; Months - years 1) Resource adequacy 2) Storage
Figure 5. Number of specific flexibility services reported in survey responses grouped by general service type and
timescale.
3.2.2 Procurement of Flexibility Services
The respondents were requested to describe which procurement methods are used to obtain the
different flexibility services, i.e. broken into three categories: market-based (e.g. auction-based
procurement), bilateral contracts (e.g. between system operator and individual generators to provide a
service for a certain time period), or interconnection agreements (e.g. provision of a service is part of
the agreement signed before connecting an asset to the system). Figure 6 summarizes how flexibility
services are procured within each timescale. Based on the responses, during the short timescales (sub-
second to second and seconds to minutes), bilateral contracts represent the predominant procurement
mechanism. In contrast, market-based procurement represents the more prevalently used procurement
method during the medium- and long-term timescales.
13
IEA Hydro Annex IX: Valuing Flexibility in Evolving Energy Markets. June 2021.Figure 6. Summary of procurement methods by timescale, as reported by survey responses. Note that the sum of
the percentages within each timescale is greater than 100% because services may be procured through more
than one procurement mechanism. Also, data was not complete for all of the 14 respondents for each of the
procurement methods. Individual responses are included in Appendix A.
3.2.3 Compensated Services
The survey respondents were asked if the flexibility services are compensated through market
structures, bilateral contracts, and/or interconnection agreements across different timescales. Although
interconnection agreements usually just define the specific requirements and specifications for
physically interconnecting an energy asset to the grid, these may also contain a service component that
is either compensated for directly or indirectly contingent on providing the service to the
interconnection and, thus, are included as a potential source of compensation.
Figure 7 shows the breakdown of compensation mechanisms by timescale. Overall, markets and
bilateral contracts are the most common compensation mechanisms. More specifically for each
timescale:
• Sub-second to seconds: most of the services are compensated through either bilateral contracts
or interconnection agreements.
• Seconds-to minutes: the procurement mechanisms shift more towards market-based.
• Minutes to hours: the procurement mechanisms are evenly distributed among markets, bilateral
contracts, and interconnection agreements.
• Hours-to-days: mostly procured through market mechanisms.
• Days-months, months-years: most often procured through bilateral contracts.
14
IEA Hydro Annex IX: Valuing Flexibility in Evolving Energy Markets. June 2021.Figure 7. Overview of compensated flexibility services. Note that not all countries/regions provided a response
for each timescale and that the number of responses may exceed the number of respondents as a services may
be offered through more than one procurement mechanism. Also, the total for a specific service within a
timescale may vary from the results presented in Figure 5 because there are cases where a service may be
compensated through more than one mechanism. The detailed responses are presented in Appendix A.
3.2.4 Hydropower Contribution to Flexibility Services
Survey respondents were asked whether hydropower currently provides flexibility services to the power
grid. Figure 8 summarizes the responses to this question and shows that hydropower plays a substantial
role in providing flexibility services across all timescales. Note that the survey question did not request
which specific flexibility services that hydropower provides, only if hydropower was providing some or
all of the services at the respective timescales.
Figure 8. Responses to the question of whether hydropower provides flexibility services across timescales.
Percent of respondents answering yes, no, or no response. Detailed responses are included in Appendix A.
15
IEA Hydro Annex IX: Valuing Flexibility in Evolving Energy Markets. June 2021.3.2.5 Market Size and Price Description
The market size and market prices for flexibility services vary significantly across systems and within
each timescale. In some cases, this variation may be attributed to system size and market maturity (e.g.
for how long the market has been in place). At the same time, a specific market structure may or may
not exist for the different flexibility services within a given timescale. Based on survey responses, we
evaluated the market within each timescale by total size.
Figure 9 and Figure 10 summarizes the results for non-energy and energy services, respectively. If a
country is not listed or has no data presented, this indicates that no response was received. If a country
responded but did not provide data for a specific timescale, that indicates that there is no market within
that timescale. Table 3 presents a brief summary of the minimum and maximum prices for the
identified flexibility services. Since different services definitions are used among the countries/regions,
it is hard to compare market size and price results directly. More detailed responses from the individual
markets are provided in Appendix A.
16
IEA Hydro Annex IX: Valuing Flexibility in Evolving Energy Markets. June 2021.Figure 9. Market size by timescale for non-energy services. Systems and timescales with no responses are
excluded. The detailed responses are presented in Appendix A.
Figure 10. Market size by timescale for energy services. Systems and timescales with no responses are excluded.
The detailed responses are presented in Appendix A.
Table 3 Summary of market prices for flexibility services. Min, max, and mean values across countries/regions
that provided market price data. Note that prices were estimated based on survey inputs, accounting for
exchange rates and differences in the format of responses.
Min Max Mean
17
IEA Hydro Annex IX: Valuing Flexibility in Evolving Energy Markets. June 2021.Energy $15.10/MWh $198.00/MWh $59.91/MWh
Frequency Response $3.74/MW-h $62.5/MW-h $26.0/MW-h
Spinning Reserve $0.47/MW-h $17.98/MW-h $11.29/MW-h
Non-Spinning Reserve $3.79/MW-h $3.79/MW-h $3.79/MW-h
Reactive Power $1.80/MVarh $3.54/MVarh $2.67/ MVarh
3.2.6 Trends and Future Developments
Flexibility services requirements, how these services are procured, and the availability of resources to
provide the services change over time based on technology characteristics, generation mix, and policy,
and regulatory environments. Table 4 presents a high-level description of the planned developments,
both technical and from a policy perspective, across timescales, as reported in the survey responses.
There are trends and developments occurring across all timescales, but with the highest number of
reported changes happening at the shortest timescales. More detailed descriptions of these trends and
development are presented in the survey response data in Appendix A.
Table 4 Summary of future trends and developments.
TIMESCALE DEVELOPMENT AND TRENDS
Subsecond- 8 of 12 respondents are planning developments within this timescale. Focus is on flexibility service
seconds pricing, market developments/improvements, and planning for changes in generation mix.
7 of 12 respondents are planning developments within this timescale. Developments include market
Seconds - design, implementation, and modification, adding additional services, technology developments, and
Minutes changes in generation mix.
7 of 12 respondents are planning developments within this timescale. Developments include
technology improvements, changes in generation mix, market development and enhancements.
Minutes - Hours
3 of 12 respondents are planning developments within this timescale. New market products, market
Hours - Days structures for offering products, changes in generation mix.
5 of 12 respondents are planning developments within this timescale. System and technology
Days-Months; enhancements to support resource adequacy, refinement of market structures, and development of
Months-Years new markets.
18
IEA Hydro Annex IX: Valuing Flexibility in Evolving Energy Markets. June 2021.4 International Case Studies of Flexibility Services
In this chapter we take a closer look at some of the ongoing power system flexibility challenges and
solutions in different parts of the world, through brief case studies from seven different countries. These
case studies provide different perspectives on VRE integration, flexibility services, and the role of
hydropower. The first two case studies, from Switzerland and Norway, focus on how short-term
balancing and operating reserve services are managed through coordination within Europe. Next, case
studies from Canada (Hydro Québec), the United States (California ISO), and Brazil discuss flexibility
across a wider range of timescales, including long-term planning, and illustrate very different contractual
and market arrangements to maintain power system reliability in the long run. Finally, case studies from
Australia and Japan focus on the need for long-duration storage and pumped storage hydro (PSH) in
systems with increasing VRE shares, and the importance of adequately compensating these resources.
4.1 SWITZERLAND: Coordination of Flexibility Services with Continental Europe
Switzerland is part of the Continental European (CE) Synchronous Area (SA) interconnected grid and is
connected to the four neighbouring countries (Austria, France, Germany, and Italy) through 41
transmission lines. In accordance with Article 22 of the Electricity Supply Ordinance, Swissgrid (the Swiss
local system operator) has been purchasing ancillary services since Jan 1st 2009 in a transparent, non-
discriminatory and market-based procedure (Swissgrid 2020 a,b). The invitations to tender (i.e. submit
bids and offers) take place daily, weekly, or monthly, depending on the market product, in accordance
with the technical specifications of the European Network of Transmission System Operators for
Electricity (ENTSO-E).
A common European balancing market was established by the European Commission in 2017 (EC 2017a),
to facilitate the sharing of resources used by the TSO of each country by fostering effective competition,
non-discrimination, transparency and effective integration of new participants (ENTSO-E 2018a,b). This
international coordination specifies the regulations for provision of ancillary services, especially for
frequency control to ensure secure operation of the electricity grid at a constant frequency of 50 Hz. This
allows the power system to be more secure and efficient.
The result of this framework for balancing the European power system is a multi-stage control procedure
as illustrated in Figure 11. Each control procedure, as briefly outlined below, is coordinated by dedicated
international platforms for the corresponding market products (EC 2017b). The framework is currently
being implemented across large parts of Europe.
• Frequency Containment Reserve (FCR) requires a fully operating response to the power system
within 30s (primary frequency control). The procurement of FCR required for Switzerland is
realized by a combined auction between Belgium, Denmark, Germany, France, Netherlands,
Austria, and Switzerland. This process is called "FCR Cooperation" and procures about half of the
FCR in CE SA (ENTSO-E 2020). In the coming years, this cooperation should increasingly include
more countries. Switzerland provides approximately 70 MW each year, out of 1473 MW provided
by the FCR cooperation, with a frequency deviation of ±200 mHz.
• Frequency Restoration Reserve (FRR) is actuated to restore the system frequency to its set point
value (i.e. nominal value of 50Hz) and to restore the balance between the active power generation
and demand within the load frequency control (LFC) area. A distinction is drawn between FRR
with automatic activation (aFRR) and with manual activation (mFRR). aFRR, which formally
corresponds to secondary frequency control, is automatically actuated in the connected power
19
IEA Hydro Annex IX: Valuing Flexibility in Evolving Energy Markets. June 2021.stations by the central grid controller after a few seconds and is typically completed within a
maximum time of 5 minutes to restore the system frequency back to its set point value and to
keep the power interchange program among LFC areas. In CE SA, the aFRR service has a standard
product, to be traded in the pan-European platform PICASSO (Platform for the International
Coordination of Automated Frequency Restoration and Stable System Operation) by 2021 for the
exchange of balancing energy from aFRR. Switzerland is currently an observer and not an official
member of the platform and participates to provide FRR up to approximately ±400 MW. In
contrast, mFRR is activated by individual TSO instructions and requires a full activation time of
less than 15 minutes. By 2021, mFRR will have a standard product definition, to be exchanged in
the pan-European platform MARI (Manually Activated Reserves Initiative) for the exchange of
balancing energy from mFRR.
• Replacement Reserve (RR) progressively replaces the activated FRR and/or supports the FRR
control process with an activation time of less than 30 minutes. RR has a standard product traded
in the pan-European platform TERRE (Trans-European Replacement Reserves Exchange) for the
exchange of balancing energy from RR.
Within this control framework, the implementation of a European platform for imbalance netting
(International Grid Control Cooperation, IGCC) was established in 2019 to coordinate the activation of
aFRR between TSOs, and avoid the simultaneous counter-activation of different participating and adjacent
LFC areas via imbalance netting power exchange.
To ensure adequate harmonization, both, standardized technical requirements and common market rules
among all participating TSOs are essential. Therefore, the aforementioned platforms for market-based
exchange of reserves and balancing energy are characterized by standardized definitions of products
(ENTSO-E 2018) for the aFRR, mFRR and RR balancing services.
In this context, hydropower is already a key-player in providing ancillary services thanks to the flexibility
from generating and consuming (i.e. in PSH plants) active power. However, the decarbonization process
and the increasing share of VRE generation are progressively challenging power system assets and system
stability by requiring greater availability and provision of the ancillary services to assure the continuous
balance between supply and demand.
In 2018, Switzerland’s electricity generation amounted to 67 TWh and, in the same year, 62TWh was
consumed in Switzerland, while ±30TWh was imported/exported across neighbouring countries in
Europe. 57% of the total electricity generation in Switzerland was supplied by hydropower which,
therefore, has a major role in the national electricity production. This is also reflected in the ancillary
services for frequency regulation provided by Switzerland across the entire CE SA interconnected grid,
which are almost entirely provided by hydropower. In particular, reservoir and PSH power are essential in
the provision of FCR, aFRR, mFRR and RR services to balance the European power system. Fast dynamics
combined with flexible and reliable operations are the main challenges for hydropower’s contribution to
the ancillary services markets. These system demands require that the hydroelectric units operate in off-
design conditions, and increase the number of transitions, such as start-ups and shut-downs, and
regulating movements by leading to increasing loads and mechanical stresses impacting the lifetime of
the components. As a consequence, maintenance of the hydroelectric units may be required more
frequently, by causing shortfalls for the operators in terms of increasing costs for maintenance and loss in
revenue due to the unavailability of the hydroelectric unit for energy production. These disadvantages
highlight the need of adequate remuneration levels in the balancing markets to incentivize and motivate
the participation of the hydropower sector. However, the technical challenges can be overcome by
enhancing existing hydroelectric technologies and by improving the predictive maintenance of the power
20
IEA Hydro Annex IX: Valuing Flexibility in Evolving Energy Markets. June 2021.plants to strengthen the market participation of hydropower and its contribution to the stability of the
future power system (XFLEX HYDRO 2020b).
Figure 11. Time domain hierarchy of the load-frequency control process (ENTSO-E 2018b)
4.2 NORWAY: Large-scale Hydropower for Balancing Wind and Solar Power in Northern
Europe
Background
Hydropower provides around 90% of the total power supply in Norway, and most of the plants are
connected to large hydro reservoirs, many of them with seasonal storage capacities. This makes the
Norwegian power supply very flexible both with respect to short-term and long-term balancing
capability. As more and more wind and solar PV are installed in Norway and the neighboring countries
(Figure 12), the need for flexibility from the existing hydropower plants is increasing. Moreover, HVDC
interconnectors to continental Europe and UK enhances the value of hydropower flexibility. In turn, this
leads to more opportunities for upgrading plant power capacities and building new pumping capacity
between existing reservoirs (Graabak et al. 2019).
21
IEA Hydro Annex IX: Valuing Flexibility in Evolving Energy Markets. June 2021.Figure 12. Projected power generation different resources in the Nordic countries (i.e. Norway, Sweden,
Denmark, and Finland, but excluding Iceland) (Based on data from: NVE 2020).
Operating reserve markets in the Nordic area
To handle imbalances in the Nordic power system, operating reserves are procured through different
markets. Four types of reserve products are used by Statnett - the Norwegian TSO (Statnett 2019),
similar to the ENTSO-E definitions in Figure 11. FCR is divided into reserves for normal operations (FCR-
N) and reserves for disturbances (FCR-D). This reserve product is procured through a weekly and a daily
market. The maximum activation time for aFRR is two minutes. Today’s reserve markets are dominated
by power producers, but reserves can also be provided by the demand side. The Nordic countries
collaborate to decide on the required volumes and distribution between countries, but the reserves are
secured through national markets. A common Nordic market for aFRR is planned to become operational
in 2022 and a platform for a European market for exchange of aFRR is expected to be in operation by
2024. The maximum activation time of mFRR is 15 minutes. Through the Nordic collaboration the TSO is
required to procure 1200 MW mFRR, and it procures an additional 500 MW to handle regional
differences within Norway. This capacity is procured and activated through a common Nordic market
(RKM). Finally, Fast Frequency Reserves (FFR) are reserves that are activated quickly (1 second) when
larger faults occur in the power system. This reserve is necessary to ensure system stability and is a
result of an increasing number of hours with limited rotating mass connected to the grid. Statnett
carried out a demonstration project for FFR in 2020 that is being continued in 2021. This Norwegian
demo-market for FFR is based on two products: one seasonal product to cover the need during night
and on the weekends, and a flexible, short-term product ordered on-demand. FFR is closely related to
the need for inertia in the system.
Balancing and interconnectors
Historically, HVDC interconnectors from Norway (Figure 13) have been used primarily for spot market
trade. With increasing wind and solar PV integration in Europe, it can be beneficial to also use these
interconnectors for different balancing products and reserve provision (Gebrekiros 2015). For the latest
expansion of the HVDC cable between Norway and Denmark (Skagerrak 4), 110 MW out of 700 MW
22
IEA Hydro Annex IX: Valuing Flexibility in Evolving Energy Markets. June 2021.capacity was allocated for reserve power, in order to make more of the Norwegian hydropower
available for balancing of uncertain wind power generation in Denmark. Previous research has shown
that it is possible to improve the utilization of interconnectors even more by opening for dynamic
allocation of reserve capacity on the cables (Hjelmeland et al. 2019).
Figure 13. Overview of HVDC connectors in operation (black) and under construction (red, dotted) to/from the
Nordic area (data from ENTSO-E. Map from Wikimedia1).
Challenges
With new interconnectors to continental Europe and the UK, new opportunities for Norwegian
hydropower arise as it can provide energy and balancing services in three different synchronous
systems. Within each of these systems, there are several market products available. The spectrum of
market products provide access to additional revenue streams for Norwegian hydropower. At the same
time, operating optimally within such a complex market system is challenging due to the number of
bidding options in the short term, which must be weighed against the future value of stored water in the
long term. However, the increased market harmonization across Europe can make it easier to optimize
hydropower production in this complex system (Håberg and Doorman 2019), so that the hydropower
flexibility is utilized in a way that benefits the European power system and contributes to keeping
balancing costs of wind and PV at acceptable levels. Another important challenge for hydropower in
Norway is to meet environmental restrictions. Many power plants need to renew the terms of license,
and it is expected that power plants discharging into salmon rivers may not be allowed to operate with
rapid water flow changes. This will limit their ability to regulate power generation for short-term needs
in the power grid. Hydropower plants with outlets in reservoirs, lakes and the sea will still be able to
operate with high flexibility.
4.3 CANADA: Flexibility Requirements and Services in Hydro Québec
Flexibility Requirements
Québec’s load has had a strong correlation with winter temperatures for decades, due to the extensive
development of electric heating in households. In 2019, peak power demand in Québec reached a
maximum of 36159 MW (Hydro Québec 2020). The load in the Québec system in 2019 is shown in Figure
1 https://commons.wikimedia.org/wiki/File:Blank_map_Europe_with_borders.png
23
IEA Hydro Annex IX: Valuing Flexibility in Evolving Energy Markets. June 2021.14. To be able to safely manage the power system in Québec, 1000 MW of reserves are required in the
very short term, and up to 1500 MW in the day-ahead horizon, as summarized in Table 5. A more
detailed description of reserve requirements in Québec is provided in Milligan et al. (2010) and Hydro
Québec (2019).
More recently, following a series of calls for tenders that started in the 2000s, wind power generation
has been added to Québec’s grid, and will eventually exceed 3800 MW by 2021 (Hydro Québec 2020).
Wind power in Québec has a relatively high peak contribution, i.e. estimated to be 36% of its installed
capacity in the winter (Régie de l’énergie Québec 2019). However, wind generation adds to the existing
variability in the system.
Figure 14 Hourly load (MW) in Québec, 2019 (Régie de l’énergie Québec 2020).
Table 5 Required operating reserves in Québec.
SHORT-TERM MEDIUM TERM
Sub-seconds to seconds Seconds to minutes Minutes to hours Hours to days
Frequency responsive services
between 500 MW and 1500 MW 1500 MW of 30-min reserve,
Stability reserve (Frequency
Containment Reserve), typically 1500 MW of 30-min reserve, incl. 1000 MW of 10-min reserve energy balancing reserves, up to
1000 MW; includes 250 MW of incl. 1000 MW of 10-min reserve energy balancing reserves, 1500 MW (day-ahead)
spinning reserve typically 500 MW 2 hours ahead
Reactive power and voltage
control
24
IEA Hydro Annex IX: Valuing Flexibility in Evolving Energy Markets. June 2021.Flexibility Procurement
In Québec, distribution and transmission entities are regulated. The generation branch, Hydro Québec
Production (HQP), is unregulated and operates more than 36000 MW of hydropower generation (Hydro
Québec 2020).2
There is no spot market for electricity and ancillary services. By law, most of the supply is delivered to
Hydro Québec’s Distribution branch (HQD) by HQP, through the so-called “Heritage pool contract”
(Québec National Assembly, 2000). Following that law, from 2001 HQP must deliver up to 165 TWh of
energy to HQD every year, but also a set of 8760 hourly “sticks” (hourly slices) of capacity, between
11420 MW and 34342 MW. When it comes to flexibility services, the heritage pool contract must also
include “all services necessary and generally considered as essential to make this supply safe and
reliable”. This includes spinning reserve, reactive power, voltage control, frequency responsive services
and provision for load forecasting errors (Hydro Québec 2016). In addition, HQP must manage its
reservoirs to ensure the deliverability of the heritage energy, even in the case of sustained dry
conditions (at a 2% probability of occurrence or once in 50 years). For the year 2020, the heritage
contract price is 27.99$CAD/MWh. Because the heritage contract price blends energy, capacity and
ancillary services, there is therefore no specific price signal for most flexibility services.
The additional variability coming from wind generation is managed through a separate wind integration
contract that has a 3 years duration. HQP absorbs wind generation in real-time and guarantees 40% of
installed wind capacity in winter. The contract covers intra-hourly, hourly and annual variations, as
specified by the regulator for energy, Régie de l’énergie Québec. Finally, when needed, additional
capacity or energy is procured by HQD through calls for tenders. For example, a 500 MW contract for
capacity has been signed between HQP and HQD for a duration up to 2038. This capacity can be called
up to 4 hours in advance.
In conclusion, outside one thermal peaker plant, hydropower provides the majority of energy and
flexibility services to the Québec power grid. For most of those services, there is no specific price signal,
as compensation is provided through the long-term contracts described above.
4.4 USA: Flexibility Requirements and New Market Initiatives in California ISO
The main reasons for the increased system flexibility needs in CAISO can primarily be attributed to a) the
variability and b) the uncertainty of VRE resources, with wind and solar PV providing almost 20% of the
electricity generation in 2019. We briefly discuss the two concepts and the associated manifestations in
CAISO next.
Variability
Figure 15 presents the generation profiles of different generation resources in CAISO on April 1, 2020.
The solar generation ramps up from 0 to 9,000 MW in a span of two morning hours (07:00 to 09:00). The
solar output then ramps down by an equivalent amount during the evening hours (17:00 to 19:00).
2In addition to the generating capacity of its own facilities, Hydro-Québec has access to almost all the output from
Churchill Falls generating station (5,428 MW) under a contract with Churchill Falls (Labrador) Corporation Limited
that will remain in effect until 2041.
25
IEA Hydro Annex IX: Valuing Flexibility in Evolving Energy Markets. June 2021.You can also read