Distributed Wind Market Report: 2021 Edition - Department of ...
←
→
Page content transcription
If your browser does not render page correctly, please read the page content below
Distributed Wind Market Report: 2021 Edition

DISCLAIMER

This report was prepared as an account of work sponsored by an agency of the United States Government. Neither
the United States Government nor any agency thereof, nor Battelle Memorial Institute, nor any of their employees,
makes any warranty, express or implied, or assumes any legal liability or responsibility for the accuracy,
completeness, or usefulness of any information, apparatus, product, or process disclosed, or represents that its use
would not infringe privately owned rights. Reference herein to any specific commercial product, process, or service
by trade name, trademark, manufacturer, or otherwise does not necessarily constitute or imply its endorsement,
recommendation, or favoring by the United States Government or any agency thereof, or Battelle Memorial
Institute. The views and opinions of authors expressed herein do not necessarily state or reflect those of the United
States Government or any agency thereof.

This report is being disseminated by the U.S. Department of Energy. As such, this document was prepared in
compliance with Section 515 of the Treasury and General Government Appropriations Act for Fiscal Year 2001
(Public Law 106-554) and information quality guidelines issued by the U.S. Department of Energy. Though this
report does not constitute “influential” information, as that term is defined in the U.S. Department of Energy’s
Information Quality Guidelines or the Office of Management and Budget’s Information Quality Bulletin for Peer
Review, the study was reviewed both internally and externally prior to publication. For purposes of external review,
the study benefited from the advice and comments from eight industry consulting and association representatives,
project developers, state agency representatives, and federal laboratory staff.

                                PACIFIC NORTHWEST NATIONAL LABORATORY
                                                    operated by
                                                   BATTELLE
                                                       for the
                                  UNITED STATES DEPARTMENT OF ENERGY
                                        under Contract DE-AC05-76RL01830

                                          Printed in the United States of America

                                     Available to DOE and DOE contractors from the
                                     Office of Scientific and Technical Information,
                                       P.O. Box 62, Oak Ridge, TN 37831-0062;
                                                   ph: (865) 576-8401
                                                   fax: (865) 576-5728
                                             email: reports@adonis.osti.gov

                          Available to the public from the National Technical Information Service
                                         5301 Shawnee Rd., Alexandria, VA 22312
                                                 ph: (800) 553-NTIS (6847)
                               email: orders@ntis.gov http://www.ntis.gov/about/form.aspx
                                            Online ordering: http://www.ntis.gov

                            FOR MORE INFORMATION ON THIS REPORT (PNNL-31729):
                                              Alice Orrell, PE
                                               Energy Analyst
                                               509-372-4632
                                           alice.orrell@pnnl.gov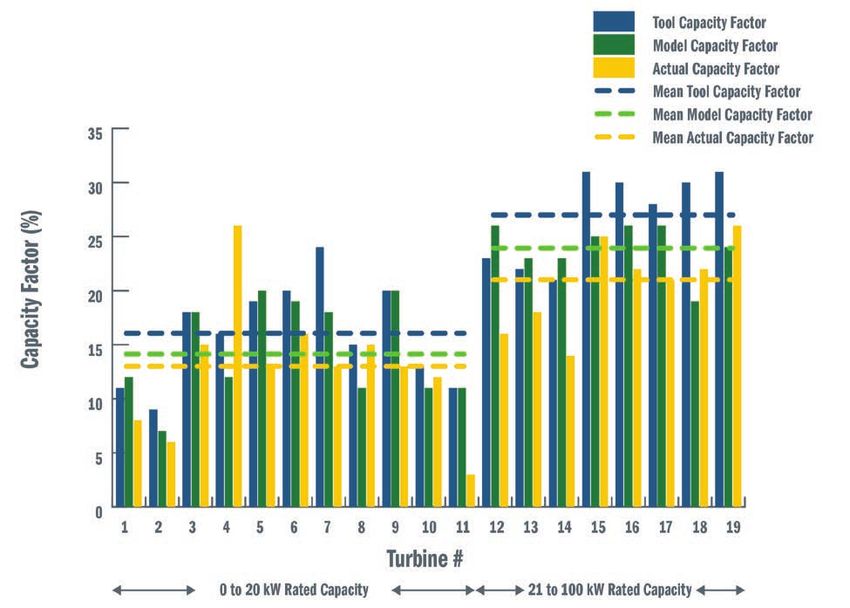
DISTRIBUTED WIND MARKET REPORT: 2021 EDITION

Preparation and Authorship
This report was prepared for the U.S. Department of Energy, Office of Energy Efficiency and Renewable
Energy, Wind Energy Technologies Office.

Report authors are Alice Orrell, Kamila Kazimierczuk, and Lindsay Sheridan of Pacific Northwest National
Laboratory.

                                                    iii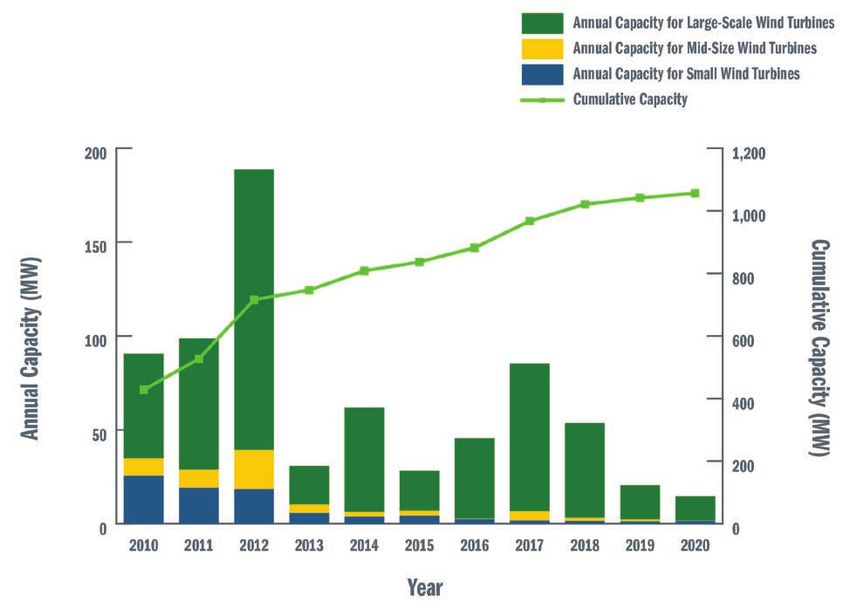
DISTRIBUTED WIND MARKET REPORT: 2021 EDITION

Acknowledgments
The authors wish to thank the following people for their help in producing this report: Robert Marlay,
Patrick Gilman, Liz Hartman, and Michael Derby (U.S. Department of Energy’s Wind Energy Technologies
Office); Bret Barker, Coryne Tasca, Gage Reber, and Kaitlyn Roach (in support of U.S. Department of
Energy’s Wind Energy Technologies Office); and Mike Parker, Kelly Machart, Mary Ann Showalter, Jamie
Gority, and Bethel Tarekegne (Pacific Northwest National Laboratory).
The authors wish to thank the following people for their review and/or contributions to this report: Isaac
Maze-Rothstein (Wood Mackenzie); Shawn Martin (International Code Council-Small Wind Certification
Council); Brent Summerville, Eric Lantz (National Renewable Energy Laboratory); Kelsey Bartz (American
Clean Power Association); Jereme Kent (One Energy Enterprises LLC); Mitch Hyde (Bluestem Energy
Solutions); Michael Leitman (National Rural Electric Cooperative Association); Mark Mayhew (New York
State Energy Research and Development Authority).
The authors wish to thank the following companies for contributing data, information, and support for
this report: Advanced Energy Systems, LLC; Aegis Renewable Energy; AeroMINE; All Energy
Management; All Star Electric; Alternative Energy Services; Amberg Renewable Energy; Anemometry
Specialists; APRS World; Barber Wind Turbines; Bergey Windpower; Be-wind LLC; Blue Pacific Energy;
BlueSkyWind, LLC; Buffalo Renewables; Carter Wind Systems; Colite; Computronics Windmatic; Ducted
Wind Turbines; Dyocore; Energy Options; Eocycle Technologies Inc.; ESPE; Ethos Distributed Energy; Great
Rock Windpower; Halus Power; Hi-VAWT Technology Corp.; Hudson Valley Wind Energy; Kettle View
Renewable Energy; Minnesota Renewable Energies, Inc.; Northern Power Systems; Off Grid Enterprises;
Power Grid Partners; Primus Wind Power Inc.; Priority Pump and Supply; QED Wind Power; Renewable
Energy Solutions; Rockwind Venture Partners; Ryse Energy; Skylands Renewable Energy, LLC; Star Wind
Turbines; Twin Turbine Energy; WES Engineering Inc.; Whidbey Sun & Wind; Williams Power Systems;
Wind Turbines of Ohio; Windlift; WindStax.
The authors wish to thank representatives from the following utilities and state, federal, and
international agencies for contributing data, information, and support for this report: Alaska Energy
Authority; Alaska Industrial Development and Export Authority; Alabama Department of Economic and
Community Affairs; Austin Energy; Australian Clean Energy Regulator; Blue Ridge Mountain Electric
Membership Corporation; Brazil Agência Nacional de Energia Eléctrica; California Energy Commission;
Central Iowa Power Cooperative; Central Lincoln People’s Utility District; Chelan County Public Utility
District; China Wind Energy Equipment Association; City of Ashland, OR; City of Brenham, TX; Colorado
Energy Office; Colorado State University; Connecticut Public Utilities Regulatory Authority; Danish Energy
Agency; Delaware Department of Natural Resources and Environmental Control; Delaware Sustainable
Energy Utility; Detroit Lakes Public Utility; El Paso Electric; Energy Trust of Oregon; Eugene Water and
Electric Board; Evergy; FirstEnergy; Florida Office of Energy; Gestore dei Servizi Energetici; Georgia
Environmental Finance Authority; Golden Valley Electric Association; Grays Harbor Public Utility District;
Holy Cross Energy; Idaho Power; Indiana Michigan Company; Indiana Office of Energy Development; Iowa
Utilities Board; Kansas State University; Kauai Island Utility Cooperative; Klein-Windkraftanlagen; La Plata
Electric Association; Louisiana Department of Natural Resources; Louisiana Technology Assessment
Division; Maryland Energy Administration; Massachusetts Clean Energy Center; Mississippi Energy Office;
Mohave Electric Cooperative; Montana Department of Environmental Quality; National Grid; National
Renewable Energy Laboratory Wind for Schools; Nebraska State Energy Office; New Hampshire Public
Utilities Commission; New Jersey Board of Public Utilities; New York State Electric and Gas Corporation;
New York State Energy Research and Development Authority; North Carolina GreenPower; North Carolina
Sustainable Energy Association; Northwestern Energy; NV Energy; Ohio Department of Development;
Okanogan County Public Utility District; Pacific Gas and Electric; PacifiCorp; Pennsylvania Department of
Environmental Protection; Puget Sound Energy; Red River Valley Rural Electric Association; Renew
Wisconsin; Rhode Island Office of Energy Resources; Runestone Electric Association; Salt River Project; San
Diego Gas and Electric; Santee Cooper; South Carolina Energy Office; Tennessee Valley Authority; Texas

                                                     iv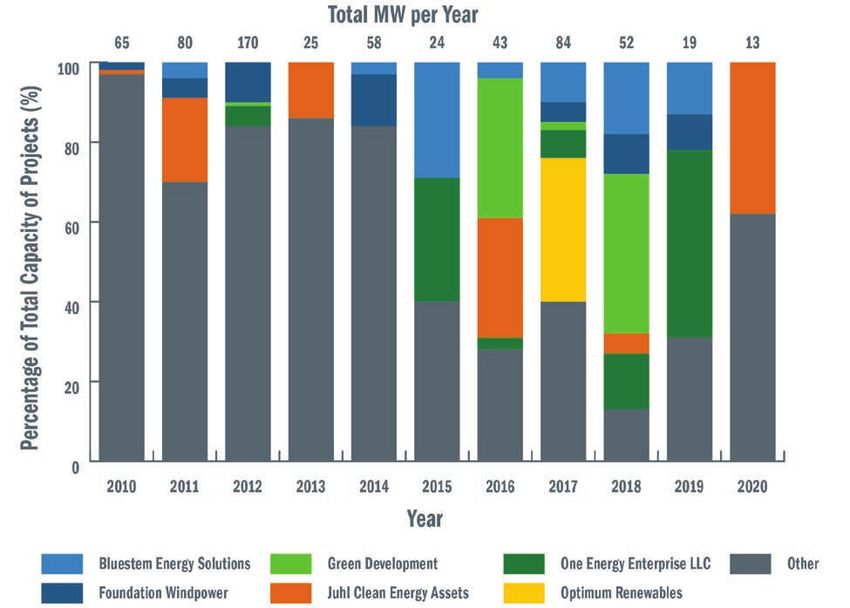
DISTRIBUTED WIND MARKET REPORT: 2021 EDITION

State Energy Conservation Office; United Illuminating Company Power; U.S. Department of Agriculture
Rural Energy for America Program; Utah Clean Energy; Vermont Electric Power Producers; Virginia
Department of Mines, Minerals, and Energy; Washington D.C. Department of Energy and Environment;
Washington State University Energy Program; West Virginia Energy Office; Xcel Energy.

                                                   v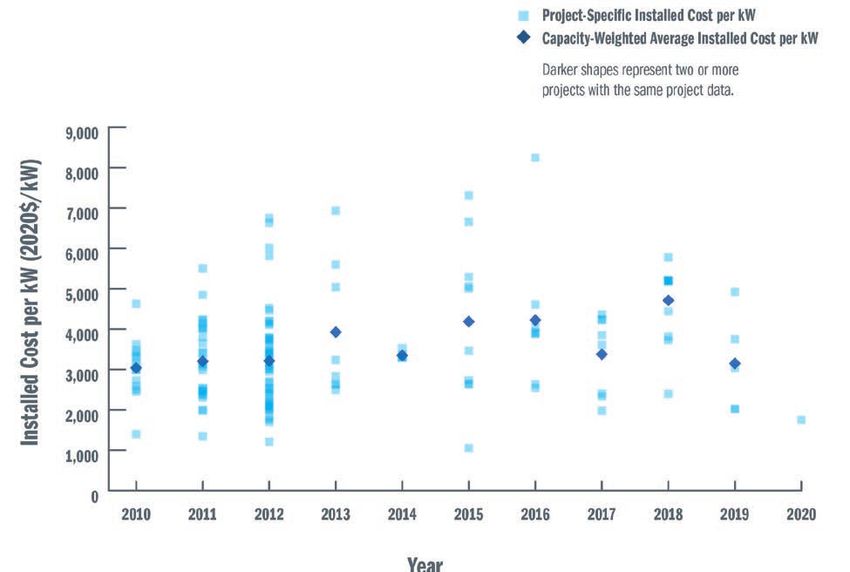
DISTRIBUTED WIND MARKET REPORT: 2021 EDITION

List of Acronyms
ACP          American Clean Power Association
AWEA         American Wind Energy Association
CIP          Competitiveness Improvement Project
DOE          U.S. Department of Energy
EIA          Energy Information Administration
FIT          feed-in tariff
GE           General Electric
ICC-SWCC     International Code Council-Small Wind Certification Council
IEC          International Electrotechnical Commission
IRS          U.S. Internal Revenue Service
ITC          investment tax credit
kWh          kilowatt hour(s)
kW           kilowatt
LCOE         levelized cost of energy
MEA          Maryland Energy Administration
MW           megawatt
NPS          Northern Power Systems
NREL         National Renewable Energy Laboratory
NYSERDA      New York State Energy Research and Development Authority
O&M          operations and maintenance
PNNL         Pacific Northwest National Laboratory
PTC          production tax credit
REAP         Rural Energy for America Program
USDA         U.S. Department of Agriculture
VAWT         vertical-axis wind turbine
VDER         Value of Distributed Energy Resources

                                                  vi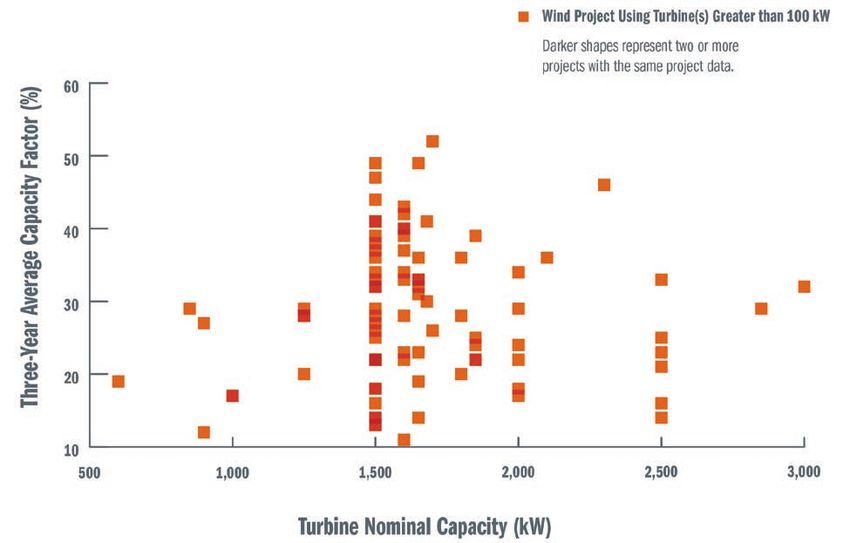
DISTRIBUTED WIND MARKET REPORT: 2021 EDITION

Executive Summary
The annual Distributed Wind Market Report provides stakeholders with market statistics and analysis along
with insights into market trends and characteristics. Key findings for this year’s report include the following:

Installed Capacity
Cumulative U.S. distributed wind capacity installed from 2003 to 2020 now stands at 1,055 megawatts
(MW) from over 87,000 wind turbines across all 50 states, Puerto Rico, the U.S. Virgin Islands, and Guam.
Distributed wind turbines are distributed energy resources connected at the distribution level of an electricity
system, or in off-grid applications, to serve specific or local loads.
In 2020, eleven states added a total of 14.7 MW of new distributed wind capacity representing 1,493
turbine units and $41 million in investment. These numbers are down from 20.5 MW in 2019 and 53.7 MW
in 2018. Some of this annual variation can be contributed to the project-development cycles of a handful of
developers.
Since 2015, six different developers have been responsible for at least 40% of the distributed wind
capacity from projects using turbines greater than 100 kW. Each developer works almost exclusively with
one turbine manufacturer and in one state rather than nationally, causing annual capacity additions to reflect
installations from a few manufacturers and to be concentrated in a few different states year to year.
Iowa and Minnesota led the United States in 2020 capacity additions as a result of two projects that
combined represent 95% of the 2020 installed distributed wind capacity.
Of the 14.7 MW installed in 2020, 12.9 MW came from distributed wind projects using large-scale
turbines (greater than 1 MW in size), 0.16 MW came from projects using mid-size turbines (101 kilowatts
[kW] to 1 MW in size), and 1.6 MW came from projects using small wind turbines (up through 100 kW in
size).
The 12.9 MW from projects using turbines greater than 1 MW is down from the 18.2 MW documented
in 2019, and the 50.5 MW documented in 2018. Large-scale wind turbines continue to account for most of
the distributed wind capacity additions; however, changing policies and long project-development cycles have
contributed to the varying capacity additions from year to year for projects using turbines greater than 1 MW.
Projects using mid-size turbines continue to represent a small part of the distributed wind market. The
0.16 MW of capacity from projects using mid-size turbines in 2020 is down from 1 MW in 2019 and 1.6 MW
in 2018.
A total of 1.6 MW of small wind was deployed in the United States in 2020, representing 1,487 turbine
units and $7 million in investment. Small wind deployment has been relatively flat for the past few years,
with 1.3 MW in 2019 and 1.5 MW in 2018. However, small wind manufacturers and installers have reported a
brighter outlook for 2021, given the role distributed energy can play in decarbonizing the U.S. economy.

Deployment Trends
Large-scale turbines, and the distributed wind projects that use them, are getting bigger. In 2003, the
average turbine capacity used in distributed wind projects with turbines greater than 100 kW was 1 MW.
In 2020, the average capacity size was 2.2 MW. As such, the average project size has almost tripled from
1.5 MW in 2003 to 4.4 MW in 2020.
The use of mid-size turbines remains limited. A limited number of mid-size turbines are commercially
available, which may account for the lower level of deployment but also may account for the use of
refurbished turbines in this size sector. Of the five new projects using mid-size turbines in 2018, 2019, and
2020, three used refurbished turbines.

                                                        vii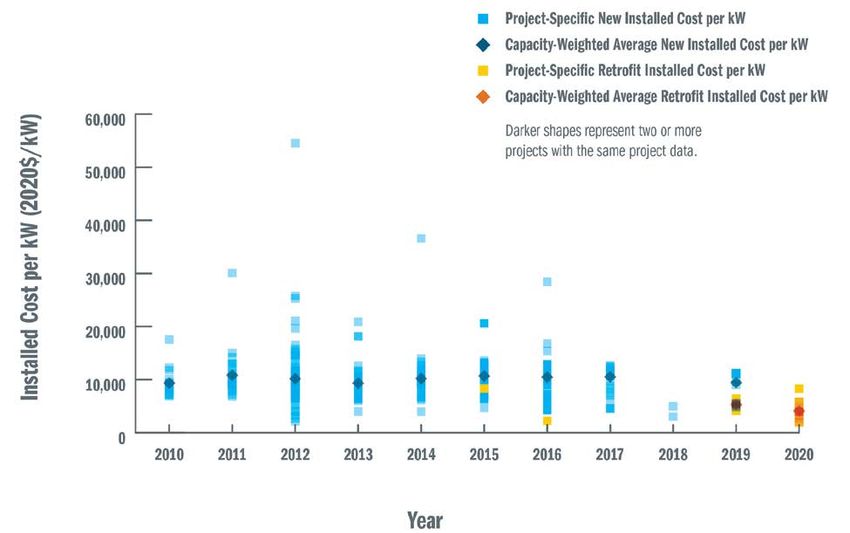
DISTRIBUTED WIND MARKET REPORT: 2021 EDITION

Small wind retrofits make up an increasing amount of the small wind capacity deployment. Retrofits are
new turbines installed on existing towers and foundations to replace nonfunctioning turbines or to upgrade the
technology. Small wind retrofits contributed 80% of total installed small wind capacity in 2020 and 36% in
2019. No small wind retrofits were reported in 2018.

Customer Types
In 2020, utility customers accounted for 58% of the total documented distributed wind capacity,
compared to 42% in 2019 and 53% in 2018. After utility customers, industrial customers represented the next
largest portion of distributed wind end users, accounting for 37% of capacity installed in 2020, compared to
54% in 2019 and 20% in 2018.
Agricultural customers accounted for 36% of the number of projects installed in 2020, followed by
residential customers, who represented 24% of installed projects. However, agricultural and residential end-use
customers accounted for only a combined 2% of the documented capacity installed in 2020, consistent with
past years (3% in 2019 and 1% in 2018) as agricultural and residential customers predominantly use small
wind turbines.
A total of 45% of all documented distributed wind capacity from 2010 through 2020 provides electricity
for on-site use while the balance (55%) provides electricity for local use. Distributed wind projects for on-
site consumption are typically behind-the-meter installations for rural or suburban homes, farms, schools, and
manufacturing facilities. Distributed wind projects for local use, typically referred to as front-of-meter
installations, are connected to the distribution grid to serve loads interconnected to the same distribution grid.

Small Wind Domestic Sales and Exports
Small wind turbine sales by size segment vary year to year as a result of inconsistent sales, due to changing
market conditions and turbine manufacturer business operations. For example, newly manufactured turbines in
the size segment of 11–100 kW represented 42% of sales capacity in 2020, 24% in 2019, and 44% in 2018
while refurbished turbines rated 11–100 kW represented 26% of sales capacity in 2020, 8% in 2019, and 0% in
2018.
Small wind exports from U.S.-based manufacturers have decreased to just under 200 kW reported in
2020, compared to just under 500 kW in 2019 and almost 1 MW in 2018. The primary markets for U.S. small
wind exports over the years had been the United Kingdom, Italy, and Japan because of feed-in tariff programs
in those countries, but those programs have been discontinued or drastically reduced since exports peaked at
21.5 MW in 2015. U.S.-based small wind manufacturers still reported some exports to Japan in 2020, but not
to the same levels as past years.

Incentives and Policies
The combined value of U.S. Department of Agriculture Rural Energy for America Program grants,
state rebates, and state production tax credits given to distributed wind projects in 2020 was $4.8 million
across six states. This is down from $7 million in 2019 and $15 million in 2018. The decline in recent years
primarily reflects fewer state incentives being paid and a reduction in Iowa production tax credit payments as
some projects have completed their 10-year eligibility period.
A total of eight small wind turbine models are certified to the American Wind Energy Association
(AWEA) 9.1-2009 standard or International Electrotechnical Commission 61400 standards as of May
2021. One turbine model completed the full certification process in 2021, but the total number of certified
turbine models is down (from 10 in June 2019) because some manufacturers let their certifications expire.
Certification requirements are increasingly common in the global market and can allow wind turbine
manufacturers to demonstrate compliance with regulatory and incentive program requirements. The American
Clean Power Association (successor to AWEA) is developing a new standard that is intended to eventually
supersede the AWEA 9.1-2009 standard.

                                                        viii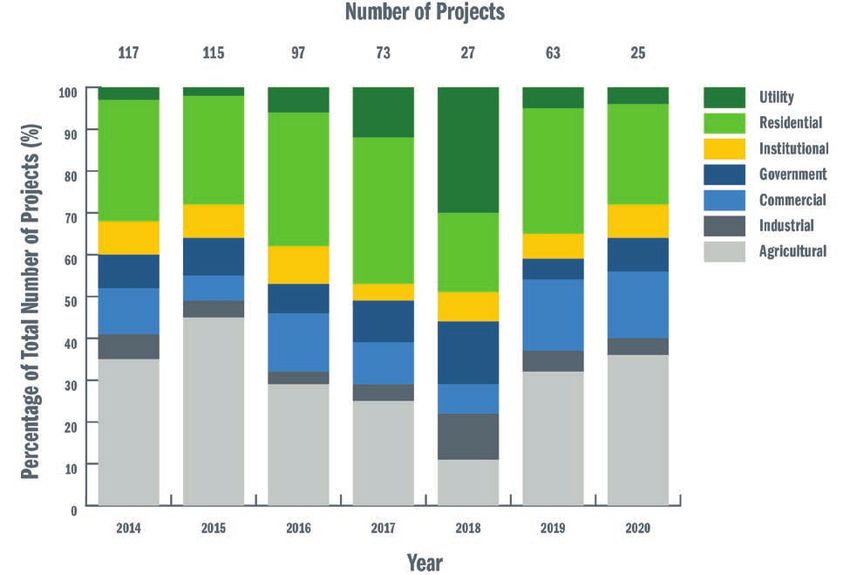
DISTRIBUTED WIND MARKET REPORT: 2021 EDITION

Performance and Installed Costs
For a sample of distributed wind projects, the three-year average capacity factor was 16% for projects
using small wind turbines, 20% for mid-size turbines, and 29% for large-scale turbines. The analysis was
based on annual generation amounts recorded for 2016, 2017, and 2018, from projects installed from 2009
through 2015.
No new small wind project costs were reported to PNNL in 2020; only costs for small wind retrofits were
reported. The average per-kilowatt installed cost of new small wind projects (in 2020 dollars) with known
costs and rated turbine capacities in the United States from 2010 through 2019 was approximately $9,500/kW.
The average per-kilowatt installed cost for small wind retrofit projects was approximately $4,100/kW in 2020
and $5,300/kW in 2019. Approximately one-third of the 2020 small wind retrofits used refurbished turbines.
PNNL only obtained one installed cost report for projects using turbines greater than 100 kW in 2020.
The availability of cost information for distributed wind projects using turbines greater than 100 kW varies
from year to year. The average per-kilowatt cost of distributed wind projects using turbines greater than
100 kW installed in the United States from 2010 through 2019 (in 2020 dollars) was approximately
$3,640/kW.

                                                      ix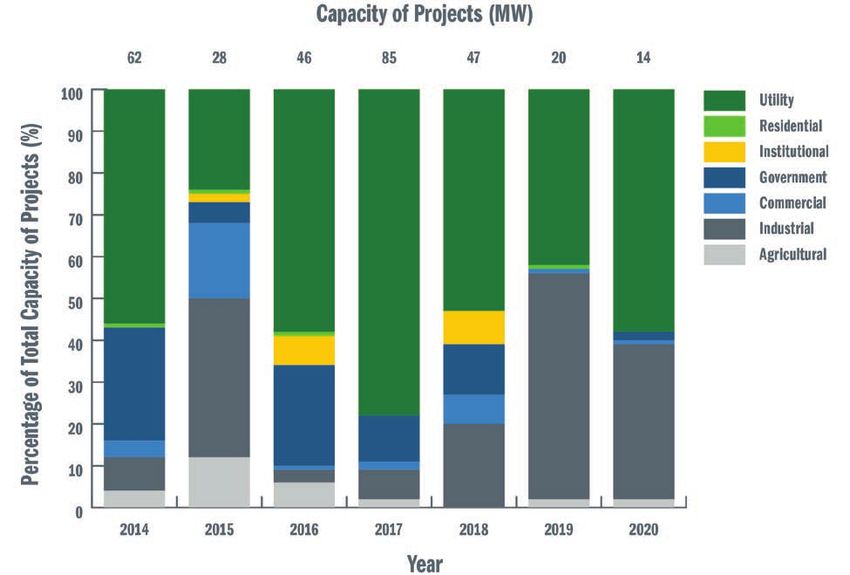
DISTRIBUTED WIND MARKET REPORT: 2021 EDITION

Table of Contents
Preparation and Authorship ............................................................................................................................ iii
Acknowledgments ............................................................................................................................................ iv
List of Acronyms................................................................................................................................................ vi
Executive Summary ......................................................................................................................................... vii
1     Introduction .................................................................................................................................................. 1
      1.1 Purpose of Report .......................................................................................................................... 1
      1.2 Distributed Wind Applications....................................................................................................... 1
      1.3 Wind Turbine Size Classifications ................................................................................................. 2
      1.4 Data Collection, Categorization, and Analysis Methodologies .................................................... 2
2     U.S. Distributed Wind Deployment ........................................................................................................... 4
      2.1 Top States for Distributed Wind: Annual and Cumulative Capacity ........................................... 4
3     U.S. Distributed Wind Projects, Sales, and Exports ............................................................................... 9
      3.1 Mid-Size and Large-Scale Turbines .............................................................................................. 9
      3.2 Small Wind .................................................................................................................................. 10
      3.3 Small Wind Exports ..................................................................................................................... 12
      3.4 Global Small Wind Market ......................................................................................................... 13
4     Policies, Incentives, and Market Insights ............................................................................................. 15
      4.1 Policies and Incentives ............................................................................................................... 15
      4.2 Market Insights ........................................................................................................................... 20
5     Installed and Operations and Maintenance (O&M) Costs ................................................................. 22
      5.1 Small Wind Installed Costs ........................................................................................................ 22
      5.2 Installed Costs for Projects Using Wind Turbines Greater Than 100 kW................................ 23
      5.3 Operation and Maintenance Costs ............................................................................................ 24
6     Performance ............................................................................................................................................. 26
      6.1 Capacity Factors ......................................................................................................................... 26
      6.2 Actual versus Estimated Small Wind Performance .................................................................. 28
7     Levelized Cost of Energy ......................................................................................................................... 30
8     Distributed Wind Markets ....................................................................................................................... 31
      8.1 Customer Types .......................................................................................................................... 31
      8.2 On-Site Use and Local Loads ..................................................................................................... 33
      8.3 Off-Grid and Grid-Connected ...................................................................................................... 35
      8.4 Wind Turbine Sizes ..................................................................................................................... 35
      8.5 Type of Towers ............................................................................................................................ 38
9     Summary ................................................................................................................................................... 39
References ....................................................................................................................................................... 40
Appendix A: Wind Turbine Manufacturers and Suppliers ........................................................................ A.1
Appendix B: Methodology ............................................................................................................................. B.1

                                                                                  x
DISTRIBUTED WIND MARKET REPORT: 2021 EDITION
List of Figures
Figure 1. U.S. distributed wind capacity ......................................................................................................... 4
Figure 2. U.S. cumulative (2003–2020) capacity and 2020 capacity additions for
distributed wind by state............................................................................................................................ 5
Figure 3. Project developers using turbines greater than 100 kW, 2010–2020 ....................................6
Figure 4. States with distributed wind capacity greater than 20 MW, 2003–2020 ...............................7
Figure 5. States with small wind capacity greater than 2 MW, 2003–2020 ...........................................8
Figure 6. Wind turbine manufacturers of turbines greater than 100 kW with a U.S. sales
presence, 2012–2020 ............................................................................................................................ 10
Figure 7. U.S. small wind turbine sales, 2010–2020 ............................................................................... 11
Figure 8. U.S. small wind turbine exports, 2014–2020 ........................................................................... 13
Figure 9. U.S. distributed wind incentive awards, 2013–2020 ............................................................... 15
Figure 10. USDA REAP grants by technology, 2010–2020 ..................................................................... 19
Figure 11. USDA REAP loans by technology, 2010–2020 ....................................................................... 19
Figure 12. Average and project-specific U.S. new and retrofit small wind installed project
costs, 2010–2020 ................................................................................................................................... 23
Figure 13. Average annual and project-specific installed costs for projects using turbines
greater than 100 kW, 2010–2020 ....................................................................................................... 24
Figure 14. NYSERDA small wind capacity factors ..................................................................................... 26
Figure 15. Capacity factors for projects using turbines greater than 100 kW...................................... 27
Figure 16. Actual and estimated performance for NYSERDA small wind projects .............................. 29
Figure 17. Distributed wind end-use customer types by number of projects, 2014–2020................ 32
Figure 18. Distributed wind end-use customer types by capacity of projects, 2014–2020 ............... 33
Figure 19. Distributed wind for on-site use and local loads by number of projects, 2010–
2020........................................................................................................................................................... 34
Figure 20. Distributed wind for on-site use and local loads by capacity of projects, 2010–
2020........................................................................................................................................................... 35
Figure 21. Average size of turbines greater than 100 kW in distributed wind projects and
average size of those projects, 2003–2020 ....................................................................................... 36
Figure 22. U.S. small wind sales capacity by turbine size, 2010–2020 ................................................ 37
Figure 23. U.S. small wind sales percentage of capacity by turbine size, 2010–2020 ...................... 37
List of Tables
Table 1. Global Small Wind Capacity Reports ............................................................................................ 14
Table 2. Certified Small Wind Turbines ....................................................................................................... 21
xiDISTRIBUTED WIND MARKET REPORT: 2021 EDITION
1 Introduction
The U.S. Department of Energy’s (DOE’s) annual Distributed Wind Market Report provides stakeholders with
market statistics and analysis along with insights into market trends and characteristics.
Distributed wind turbines are distributed energy resources connected at the distribution level of an electricity
system, or in off-grid applications, to serve specific or local loads. Distributed wind systems can range from a
less-than-1-kW 1 off-grid wind turbine at a remote cabin or oil and gas platform, to a 15-kW wind turbine at a
home or farm, to several multimegawatt wind turbines at a university campus, at a manufacturing facility, or
connected to the distribution system of a local utility.
Individuals, businesses, and communities install distributed wind to offset retail power costs or secure long-
term power cost certainty, support grid operations and local loads, and electrify remote locations and assets not
connected to a centralized grid. Depending on its application, distributed wind can either provide grid
independence or potentially improve system resilience, power quality, reliability, and flexibility.
1.1 Purpose of Report
The annual Distributed Wind Market Report is part of DOE’s Wind Energy Technologies Office distributed
wind research program, which aims to enable wind technologies as distributed energy resources to contribute
maximum economic and energy system benefits now and in the future.
To that end, the Distributed Wind Market Report analyzes distributed wind projects of all sizes. By providing a
comprehensive overview of the distributed wind market, this report can help guide future investments and
decisions by industry, utilities, federal and state agencies, and other interested parties. This report provides key
information to help stakeholders understand and access market opportunities and inform distributed wind
industry research and development needs.
1.2 Distributed Wind Applications
Distributed wind can be classified by where the turbine is installed relative to the local distribution grid. Grid-
connected turbines are typically either behind-the-meter or front-of-meter installations. 2 A behind-the-meter
wind turbine is one that is always connected to the local distribution grid behind a customer’s utility meter—
typically to offset all or some of the on-site energy needs. Behind-the-meter wind turbines displace retail
electricity demand and can be net metered to credit excess output flowing onto the grid. A wind turbine
connected to a distribution grid as a generating resource is considered a front-of-meter installation. Front-of-
meter wind projects provide energy and grid support to the distribution system and serve the interconnected
local loads on the same distribution system.
A wind turbine can be off grid in a remote location as a distributed energy source for on-site energy needs. An
off-grid wind turbine is not connected to the local distribution grid. Off-grid distributed wind is typically
deployed with battery or other form of energy storage because the wind turbine is not connected to a local
distribution grid that could provide backup energy or accept excess energy.
Distributed wind can be part of a microgrid or isolated grid, either as behind the meter or front of the meter. A
microgrid is a group of interconnected loads and distributed energy resources within defined electrical
boundaries that can operate in either a connected or disconnected (islanded) mode from the local distribution
11 gigawatt (GW) = 1,000 megawatts (MW); 1 MW = 1,000 kilowatts (kW); 1 kW = 1,000 watts (W)
2 Grid-connected distributed wind turbines can be physically or virtually connected to the distribution grid or on the customer side of the meter. Virtual (or
remote) net metering allows a member to receive net-metering credit from a remote renewable energy project as if it were located behind the customer’s
own meter.
1DISTRIBUTED WIND MARKET REPORT: 2021 EDITION
grid (Ton and Smith 2012). An isolated electrical grid system, such as for a remote village, is not connected to
a larger grid system.
1.3 Wind Turbine Size Classifications
The distributed wind market includes wind turbines and projects of many sizes. When appropriate, this report
breaks the market into the following three wind turbine size classifications:
• Small wind turbines are up through 100 kW (in nominal, or nameplate, capacity) 3
• Mid-size wind turbines are 101 kW to 1 MW
• Large-scale wind turbines are greater than 1 MW.
For projects using turbines greater than 100 kW, the project’s total nominal power capacity is used in this
report’s cost-per-kW analysis and related analyses. For small wind, this report uses the total rated power
capacity of the project in the cost-per-kW analysis and related analyses, rather than nameplate capacity. 4 A
certified small wind turbine’s rated capacity is its power output at 11 meters per second (m/s) per the American
Wind Energy Association (AWEA) 9.1-2009 standard. For small wind turbines that are not certified, the power
output at 11 m/s is assigned as the turbine’s rated, or referenced, capacity. Rated capacities for the small wind
turbine models included in this report are listed in Appendix B.
1.4 Data Collection, Categorization, and Analysis Methodologies
To collect data on distributed wind installations, sales, and related activities that occurred in calendar year
2020, the Pacific Northwest National Laboratory (PNNL) team issued data requests to distributed wind turbine
manufacturers, suppliers, 5 developers, installers, and operations and maintenance (O&M) providers; state and
federal agencies; utilities; trade associations; and other stakeholders. This report includes data from past data
requests and presents the distributed wind market from 2003 through 2020. In some cases, because of data
availability and quality, some analyses use different time periods within the time range of 2003 to 2020.
A project dataset was created to capture all projects installed in 2020 identified through the data-request
process. That dataset has been consolidated with those created for past years to create a master project dataset
that is available (with a free registration) on PNNL’s website.
In 2020, the PNNL team reviewed all projects in the master project dataset to confirm that projects met the
distributed wind definition—i.e., providing electricity for specific or local loads—and determine whether they
should remain in the dataset. The PNNL team updated the master project dataset based on its findings. In
addition, when the PNNL team identifies projects that were installed in past years but were not previously
recorded, the team adds those projects to the master project dataset. Further, the PNNL team removes turbines
known to be decommissioned from the dataset. Consequently, the cumulative capacity amounts presented in
this report differ from previous reports, and capacity allocations by state and by year will continue to differ
slightly from year to year.
Many small wind units sold are not tracked at the project level, such as off-grid turbine units sold by the
manufacturer to distributors for resale to end users, so the PNNL team is unable to include them in the master
project dataset. The master project dataset is used to make year-to-year comparisons; allocate capacity amounts
3 The U.S. Internal Revenue Service (IRS) also defines small wind as up through 100 kW for the purpose of federal investment tax credit (ITC) eligibility
(see Section 4.1.2).
4 The nominal, or nameplate, capacity of a wind turbine is what manufacturers use to describe, or name, their wind turbine models. In the case of small
wind, the nameplate capacity can be significantly different from a turbine’s rated capacity. As a result, small wind rated capacities are used in this report’s
per-kW analyses to provide a consistent baseline. For turbines greater than 100 kW, the turbine’s nameplate capacity matches the turbine’s pitch-regulated
maximum power output, allowing the nameplate capacity to be the consistent baseline.
5
In relation to manufacturers, suppliers provide refurbished turbines.
2DISTRIBUTED WIND MARKET REPORT: 2021 EDITION
across states; analyze installed costs; identify incentive funding levels; and characterize distributed wind
customers, types of turbines and towers, and project applications.
The PNNL team also created a separate small wind sales dataset based on manufacturers’ and suppliers’ sales
reports. 6 The reported total number of small wind turbine units and capacity deployed, domestically and
abroad, come from this small wind sales dataset. For small wind, this report details capacity figures for the
same calendar year as sales reported by the manufacturers and suppliers to tally annual deployed capacity.
Appendix B provides more details for the data collection, categorization, and analysis methodologies.
6
Most manufacturers report precise turbine units sold, but at least one manufacturer provides estimated turbine units sold because the company’s less-than-
1-kW size turbine units are shipped in bulk to distributors for resale to end users.
3DISTRIBUTED WIND MARKET REPORT: 2021 EDITION
2 U.S. Distributed Wind Deployment
From 2003 through 2020, over 87,000 wind turbines were deployed in distributed applications across all 50
states, Puerto Rico, the U.S. Virgin Islands, and Guam, totaling 1,055 MW in cumulative capacity, as shown in
Figure 1. 7 In 2020, 11 states added at total of 14.7 MW of new distributed wind capacity representing 1,493
turbine units and $41 million in investment. 8 Those numbers are down from both 2019 (20.5 MW in 19 states
representing 2,180 turbine units and $67 million in investment) and 2018 (53.7 MW in 13 states representing
2,685 turbine units and $245 million in investment).
Figure 1. U.S. distributed wind capacity
2.1 Top States for Distributed Wind: Annual and Cumulative Capacity
New distributed wind projects were documented in 11 states (California, Colorado, Iowa, Minnesota, Montana,
New Jersey, New York, North Carolina, Ohio, Texas, and Wisconsin) in 2020 and have been documented in
all 50 states, the District of Columbia, Puerto Rico, the U.S. Virgin Islands, and Guam since 2003, as shown in
Figure 2.
7
The data presented in the figures are provided in an accompanying data file available for download at https://energy.gov/windreport.
8
All dollar values are nominal unless otherwise noted. Annual and cumulative capacity amounts are based on nameplate turbine-capacity sizes.
4DISTRIBUTED WIND MARKET REPORT: 2021 EDITION
Figure 2. U.S. cumulative (2003–2020) capacity and 2020 capacity additions for distributed wind by state
Iowa and Minnesota led the United States in new distributed wind power capacity in 2020 as a result of the
front-of-meter 7.9-MW Mason City Wind project in Iowa for a utility customer and the on-site 5-MW Rock
County Wind Fuel project in Minnesota serving a biodiesel production facility. These two projects combined
represent 95% of the 2020 installed distributed wind capacity.
In recent years, the concentration of a few projects using large-scale turbines in a few states can be attributed
to the project-development cycles of a handful of developers. Project developers, such as Juhl Clean Energy
Assets in Minnesota; One Energy Enterprises LLC (One Energy) in Ohio; Green Development, LLC in Rhode
Island; Foundation Windpower in California; Optimum Renewables in Iowa; and Bluestem Energy Solutions
in Nebraska, may not install new projects every year, as shown in Figure 3, because each project takes multiple
years to develop. The COVID-19 pandemic may also delay some project development. These six developers
have accounted for at least 40% of the distributed wind capacity from projects using turbines greater than 100
kW since 2015.
Because each company works almost exclusively in a single state rather than nationally, annual distributed
wind capacity additions can be concentrated in a few states. To illustrate, Ohio led the United States in new
distributed wind power capacity in 2019 as a result of large-scale turbine projects installed by One Energy. The
21 MW of distributed wind that Green Development added to its portfolio in Rhode Island in 2018 accounted
for almost half of the documented 2018 distributed wind capacity. The “other” category in Figure 3 primarily
includes project owners (e.g., universities, municipalities), other third-party developers with a less consistent
presence, and unknown developers.
5DISTRIBUTED WIND MARKET REPORT: 2021 EDITION
Figure 3. Project developers using turbines greater than 100 kW, 2010–2020
Annual installations vary across the states, as illustrated in Figure 4 and Figure 5. Figure 4 shows states with
cumulative distributed wind capacities greater than 20 MW. Figure 5 shows states with cumulative capacities
from small wind greater than 2 MW.
Iowa and Minnesota lead all the states in both new capacity in 2020 and cumulative capacity from 2003
through 2020, with both states exceeding 100 MW, as shown in Figure 4. Both states have strong wind
resources and have received the largest share of U.S. Department of Agriculture (USDA) Rural Energy for
America Program (REAP) funding for wind projects since 2003 (see Section 4.1.3).
New York had the most reported small wind projects in 2020, as shown in Figure 5, as the New York State
Energy Research and Development Authority (NYSERDA) Small Wind Turbine Incentive Program made
some final payments after expiring at the end of 2019. Iowa, Alaska, and Nevada are the top three states for
cumulative capacity from small wind.
6DISTRIBUTED WIND MARKET REPORT: 2021 EDITION
Figure 4. States with distributed wind capacity greater than 20 MW, 2003–2020
7DISTRIBUTED WIND MARKET REPORT: 2021 EDITION
Figure 5. States with small wind capacity greater than 2 MW, 2003–2020
8DISTRIBUTED WIND MARKET REPORT: 2021 EDITION
3 U.S. Distributed Wind Projects, Sales, and Exports
Of the 14.7 MW of distributed wind added in 2020, 12.9 MW (88%) came from projects using turbines greater
than 1 MW, 0.16 MW (1%) came from mid-size turbines, and 1.6 MW (11%) came from small wind.
3.1 Mid-Size and Large-Scale Turbines
A total of 12.9 MW of the 2020 distributed wind capacity came from projects using turbines greater than
1 MW and 0.16 MW came from mid-size turbines. The total of 13.1 MW from turbines greater than 100 kW
represents $34 million in investment. 9
The 12.9 MW from projects using turbines greater than 1 MW is down from the 18.2 MW documented in
2019, and the 50.5 MW documented in 2018. Projects using mid-size turbines continue to represent a small
part of the distributed wind market. Installed capacity from mid-size turbines has been under 5 MW annually
since 2013, typically from just a few projects. The 0.16 MW of mid-size capacity in 2020 represents a project
with a single mid-size turbine. The capacity from projects using mid-size turbines was 1 MW from 2 projects
in 2019 and 1.6 MW from 2 projects in 2018.
Manufacturer representation in U.S. distributed wind projects changes from year to year and the mid-size and
large-scale turbine markets often rely on imports. However, some manufacturers are consistently represented
in distributed wind projects. General Electric (GE) Renewable Energy has been the only consistent U.S.-based
manufacturer of large-scale turbines used in distributed wind projects over the past nine years and is the
turbine provider for Foundation Windpower in California. Goldwind is the sole turbine supplier for One
Energy, a distributed wind project developer based in Ohio, and Green Development, LLC in Rhode Island
uses Vensys turbine models. Reported U.S. distributed wind projects using turbines greater than 100 kW in
2020 used three different turbine models from GE Renewable Energy and a refurbished Danwin turbine model.
The number of mid-size and large-scale turbine manufacturers and suppliers with installations in the United
States has generally declined since 2012, as shown in Figure 6. Some manufacturers are no longer active in the
U.S. market or are no longer in business at all, which can be at least partially attributed to the decline in
available incentives after 2012 (discussed in Section 4.1). For turbines greater than 100 kW, there are 17
manufacturers represented in the “other” category in Figure 6 in 2012, meaning a total of 25 manufacturers and
suppliers provided turbines for distributed wind projects in 2012 compared to two in 2020 and three in 2019.
9
This investment value reflects the estimated installed cost of the deployed capacity, not just the turbine hardware costs. The same is true for the small
wind investment value.
9DISTRIBUTED WIND MARKET REPORT: 2021 EDITION
Figure 6. Wind turbine manufacturers of turbines greater than 100 kW with a U.S. sales presence, 2012–2020
3.2 Small Wind
In 2020, 1.6 MW of small wind was deployed in the United States, representing 1,487 units and $7.2 million in
investment. Small wind deployment has been relatively flat for the past few years with 1.3 MW, 2,168 units,
and $7.6 million of investment in 2019, and 1.5 MW, 2,661 units, and $8.2 million of investment in 2018.
The COVID-19 pandemic had a non-uniform effect on the small wind industry. Some small wind turbine
manufacturers and installers reported that the COVID-19 pandemic caused supply chain and shipping delays
(Loo 2021) and project cancellations due to the general economic downturn, while others reported there was
no disruption to their business. Either way, small wind manufacturers and installers have reported a brighter
outlook for 2021, given the role distributed energy can play in decarbonizing the U.S. economy. Small wind
turbine manufacturers based in the United States self-report that they rely mostly on a domestic supply chain
for most of their mechanical, electrical, tower, and blade components. However, some parts and materials,
namely generator magnets, are imported either directly by the manufacturer or by a supply chain vendor.
Based on 2020 global sales in terms of capacity (megawatts of domestic sales and exports), the top three U.S.
small wind turbine manufacturers and suppliers were Primus Wind Power of Colorado, Bergey WindPower of
Oklahoma, and All Energy Management of Wisconsin (supplying refurbished Endurance E-3120 turbine
models).
Since 2012, the number of small wind turbine manufacturers both operating and participating in the U.S.
market has decreased. The eight small wind turbine manufacturers or suppliers with a 2020 U.S. sales presence
accounted for in this report consist of six domestic manufacturers headquartered in six states (i.e., Colorado,
Minnesota, New York, Oklahoma, Vermont, and Wisconsin) and two importers. In comparison, 31 small wind
turbine manufacturers reported U.S. sales in 2012.
10DISTRIBUTED WIND MARKET REPORT: 2021 EDITION
In 2020, Eocycle Techologies Inc., a Canadian small wind turbine manufacturer with sales in the United
States, announced its merger with Belgian wind turbine manufacturer XANT (Eocycle 2020). The 100-kW
XANT M-21 turbine has been rebranded as the EOX M-21. The 25-kW Eocycle EO25 turbine has been
rebranded as the EOX S-16.
In 2019, Northern Power Systems (NPS) completed sales of multiple business units (Globe Newswire 2019;
McQuiston 2019) and permanently ceased U.S. commercial operations as of August 23, 2019 (SEC 2019).
Prior to ceasing operations, NPS sold its Italian subsidiary, NPS SRL, to Boreas Ventures Ltd, a United
Kingdom corporation. This sale enables Boreas to service and maintain the Italian fleet of NPS-installed
turbines (SEC 2019). Since October 2019, NPS SRL has operated as the engineering, manufacturing, and sales
organization for global deployment and service of NPS wind turbines (NPS 2020).
U.S.-based manufacturers of new small wind turbines accounted for 71% of the domestic small wind sales
capacity in 2020, as shown in Figure 7, compared to 84% in 2019 and 76% in 2018. Newly manufactured
small wind turbines by U.S.-based manufacturers represent a smaller percentage of overall sales in 2020
because of an increase in small wind refurbished turbine sales. Only two foreign small wind manufacturers
reported sales in the United States in 2020.
Although PNNL did not document any refurbished small wind turbine sales from 2015 through 2018, their
market presence has increased in recent years, with refurbished turbines accounting for 8% of U.S. small wind
sales in 2019 and 26% in 2020. However, given the inconsistent presence of foreign manufacturers in the U.S.
small wind market and recent growth in refurbished turbine sales, these market-share divisions could shift
again.
Figure 7. U.S. small wind turbine sales, 2010–2020
11DISTRIBUTED WIND MARKET REPORT: 2021 EDITION
3.3 Small Wind Exports
U.S. small wind turbine manufacturers also export to international markets. Since 2014, more than 50 MW of
U.S. small wind turbines have been exported globally (Figure 8). These exports have declined in recent years.
Three U.S.-based small wind manufacturers exported turbines totaling nearly 200 kW in capacity with an
estimated value of $1.1 million in 2020. These numbers are down from nearly 500 kW valued at $3 million
from three manufacturers in 2019 and down significantly from a peak of 21.5 MW valued at $122 million from
six manufacturers in 2015.
Italy, the United Kingdom, and Japan had been key export markets for U.S. small wind turbine manufacturers
due to those countries’ feed-in tariff (FIT) programs. In the peak year for exports, 2015, 99% of U.S. small
wind turbine manufacturers’ exports went to these three countries. The FIT programs in Italy, the United
Kingdom, and Japan have since been discontinued or drastically reduced, thus reducing the attractiveness of
these markets for U.S. small wind turbine manufacturers.
The FIT rate in Italy ranged between €0.11 and €0.25 ($0.13 to $0.29) 10 per kilowatt-hour (kWh) from 2015 to
2016 before expiring in 2017. It was replaced by the FER1 Decree, which provides rates of €0.15 ($0.18) per
kWh for small wind (0–100 kW) projects (Dentons 2020). The United Kingdom closed its FIT program to new
applicants on April 1, 2019, and has introduced the Smart Export Guarantee program. Under the Smart Export
Guarantee program, applicants now receive a tariff determined by the buyer, rather than a fixed price
determined by the government (Ofgem 2021). Japan’s FIT rates have steadily declined since 2015, with a peak
of ¥55 ($0.50) per kWh that subsequently fell to ¥19 ($0.17) per kWh as of 2019 for turbines less than 20 kW.
FIT rates for turbines 20 kW and greater reduced from ¥21–¥22 ($0.19–$0.20) in 2015 to ¥19 ($0.17) as of
2019.
10
All currency conversions are based on the exchange rates per U.S. Department of Treasury Reporting Rates as of March 31, 2021, found in
https://www.fiscal.treasury.gov/reports-statements/treasury-reporting-rates-exchange/ for reference.
12DISTRIBUTED WIND MARKET REPORT: 2021 EDITION
Figure 8. U.S. small wind turbine exports, 2014–2020
3.4 Global Small Wind Market
An examination of the global small wind market provides a point of comparison for the U.S. small wind
market. For 2020, PNNL documented 30 MW of new small wind capacity from five countries, in addition to
the United States, that have agencies willing to share data with PNNL, as shown in Table 1. This is an increase
from the 26 MW of international small wind PNNL documented for 2019.
The 26 MW of small wind installed in China in 2020 accounts for 84% of the documented 2020 global
capacity. China experienced a 20% increase in small wind installations from 2019 to 2020. Italy had
significant capacity additions through 2017, no reports in 2018–2019, and then 0.65 MW of small wind added
in 2020. Although less generous than past FIT schemes, this uptick coincides with Italy’s FER1 Decree on July
4, 2019 (Gestore dei Servizi Energetici 2020). The FER1 Decree applies to new renewable energy projects not
already incentivized under previous FIT schemes (Dentons 2020).
Total global installed cumulative small wind capacity is estimated to be about 1.8 GW as of 2020 as shown in
Table 1. Small wind is generally defined as turbines up through 100 kW, but deviations from this definition are
noted in the table footnotes.
13DISTRIBUTED WIND MARKET REPORT: 2021 EDITION
Table 1. Global Small Wind Capacity Reports
Cumulative
Country 2013 2014 2015 2016 2017 2018 2019 2020 Cumulative Years
(MW)
Australiaa * 0.02 0.03 * 0.02 * 0.01 0.00 1.47 2001–2020
Brazilb 0.03 0.02 0.11 0.04 0.11 0.29 0.44 0.07 1.11 2013–2020
Canadac * * * * * * * * 13.47 As of 2018
Chinad,e 72.25 69.68 48.60 45.00 27.70 30.76 21.40 25.65 610.61 2007–2020
Denmarkf,g 11.04 7.50 24.78 14.61 2.58 0.40 0.18 0.05 610.88 1977–2020
Germanyh 0.02 0.24 0.44 2.25 2.25 1.00 2.50 2.50 35.75 As of 2020
Italyi,j 7.00 16.27 9.81 57.90 77.46 * * 0.65 190.08 As of 2020
Japank * * * * * * * * 12.88 As of 2019
New Zealandl * * * * * * * * 0.19 As of 2015
South Koream 0.01 0.06 0.09 0.79 0.08 0.06 0.00 * 4.08 As of 2019
UKn 14.71 28.53 11.72 7.73 0.39 0.42 0.43 * 141.51 As of 2019
United States 5.70 3.67 4.32 2.43 1.74 1.51 1.30 1.55 152.65 2013–2020
Global 110.75 126.01 99.90 130.75 112.32 34.43 26.25 30.46 1774.68
* Data not available
a www.cleanenergyregulator.gov.au
b www.aneel.gov.br
c The Atlas of Canada – Clean Energy Resources and Projects
d China Wind Energy Equipment Association
e Chinese Wind Energy Association
f www.energinet.dk
g Danish Energy Agency, Master Data Register of Turbines
h Bundesnetzagentur; Bundesverband Kleinwindkraftanlagen; 0–50-kW capacity (estimate)
i www.assieme.ed; 0–250-kW capacity
j Gestore dei Servizi Energetici
k Japan Small Wind Turbine Association
l SustainableElectricity Association of New Zealand
m Korea Energy Association
www.gov.uk, Monthly Microgeneration Certification Scheme and Renewables Obligation Order Feed-in Tariffs
n degression statistics
14DISTRIBUTED WIND MARKET REPORT: 2021 EDITION
4 Policies, Incentives, and Market Insights
A number of factors affect the U.S. distributed wind market, including the availability of and changes to
federal and state policies and incentives.
4.1 Policies and Incentives
Federal, state, and utility incentives and policies (e.g., rebates, tax credits, grants, net metering, production-
based incentives, and loans) are important to the development of distributed wind and other distributed energy
resources.
From a peak of $100 million worth of incentives dispersed across 22 states in 2012, incentive payments have
been decreasing. Figure 9 shows the value of incentives given to distributed wind projects from 2013 to
2020. 11 The combined value of USDA REAP grants, state rebates, and state production tax credits in 2020 was
$4.8 million across six states (California, Iowa, Kansas, New Mexico, New York, Vermont).
Figure 9. U.S. distributed wind incentive awards, 2013–2020
The incentives included in Figure 9 are state rebates, grants, and production-based incentives; USDA REAP
and High Energy Cost Grants; New Mexico and Iowa state production tax credits; and U.S. Treasury cash
grants (otherwise known as Section 1603 payments). PNNL started tracking the New Mexico and Iowa state
production tax credits in 2014, when the New Mexico credit was first initiated. Figure 9 excludes repaid loans,
the federal investment tax credit (ITC), and federal depreciation. New Mexico and Iowa state production tax
credit values are estimated based on available project energy production reports.
11Distributed wind projects often receive incentive funding at a different time than when they are commissioned. For example, although USDA REAP
grants are recorded for this report in the year they are awarded, they are paid after the project is commissioned. In addition, this report reflects that some
historical California state incentives were corrected because of a past PNNL misunderstanding of when incentives were applied for compared to when they
were paid out.
15DISTRIBUTED WIND MARKET REPORT: 2021 EDITION
Awards from all of these incentive programs have been decreasing over the past years. The decline in state
incentives is explored in Section 4.1.1. USDA REAP wind applications and grants are discussed in Section
4.1.3. Iowa production tax credit payments are decreasing as some projects have completed their 10-year
eligibility period. The last Section 1603 payments were made in 2017 (Treasury 2018). 12
4.1.1 State Policy and Incentive Highlights
State renewable portfolio standard requirements, net-metering policies, interconnection standards and guide-
lines, FITs, utility programs, and the availability of grants, rebates, performance incentives, and state tax
credits can affect the cost effectiveness and deployment of distributed wind in a state.
State incentive programs, such as rebates and production-based incentives, vary widely and fewer states are
providing these incentives. In 2012, 12 state programs reported incentive payments for distributed wind proj-
ects. In contrast, four state programs reported incentive payments for distributed wind projects in 2020, as well
as in both 2019 and 2018. New York, Vermont, Maryland, and the Tennessee Valley Authority are a few
examples of states (and agencies) that have phased out their incentive programs. These examples illustrate
some of the different reasons states have for discontinuing their incentive programs.
4.1.1.1 New York
Documenting the end of New York’s incentive program is of particular interest as it was considered a well-run
program that enabled significant and consistent small wind capacity additions annually for many years. The
program was discontinued because the state has shifted its focus to large-scale solar photovoltaic, large-scale
wind, and offshore wind projects (NYSERDA 2021).
NYSERDA changed its Small Wind Turbine Incentive Program several times over the years. The incentive
program was revamped in 2011, temporarily discontinued at the end of 2015, and reinstated in 2016. In May
2016, NYSERDA announced it would make approximately $6 million in incentives available for small wind
through December 31, 2018. The program was extended through December 2019 and discontinued
permanently as of December 31, 2019 (NYSERDA 2019). Distributed wind projects that completed the
incentive application process in 2019 will be the final recipients of the incentive program.
For several years, NYSERDA offered a per-kWh-generated incentive calculated with a tiered formula based on
the turbine’s projected energy production estimated at the time of incentive application. Before it was
discontinued, the incentive was changed to a per-kW incentive based on the nameplate capacity of the
distributed wind system, with $1,500/kW for the first 100 kW and $500/kW for each kW over the initial
100 kW, up to a maximum of $1,000,000 (NYSERDA 2019). This incentive structure shift, although still
under the Small Wind Turbine Incentive Program title, was implemented to encourage the installation of larger
wind projects, as larger projects were expected to generate more energy per dollar of incentive.
Over the program’s lifetime, it effectively stimulated the state’s distributed wind market by building a strong
framework to balance financing, administrative, and quality hurdles that have historically constrained the
adoption of distributed wind. The program offered dedicated administrative support to help customers navigate
the application process, required wind turbines to be certified and installed by verified installers to be eligible
for incentive funds, and provided nearly $16 million to distributed wind projects totaling over 8 MW from
2009 through 2020. As a result, New York small wind capacity deployment accounted for 25% of the national
documented small wind capacity in 2020, 55% in 2019, and 39% in 2018.
12The federal ITC was temporarily augmented in 2009 to allow for cash payments from the federal government in lieu of the tax credit, otherwise known
as the U.S. Treasury cash grants or Section 1603 payments. To qualify for Section 1603 payments, wind power projects must have applied for a grant
before October 1, 2012, and be placed in service by 2011, or began construction in 2009, 2010, or 2011 and placed in service by December 31, 2016.
Because payments were made after the project was placed in service, not prior to or during construction, payments continued through 2017.
16You can also read