AIRPORT INFRASTRUCTURE - Information on Funding and Financing for Planned Projects - Report to Congressional Requesters
←
→
Page content transcription
If your browser does not render page correctly, please read the page content below
United States Government Accountability Office
                Report to Congressional Requesters

                AIRPORT
February 2020

                INFRASTRUCTURE

                Information on
                Funding and
                Financing for Planned
                Projects

GAO-20-298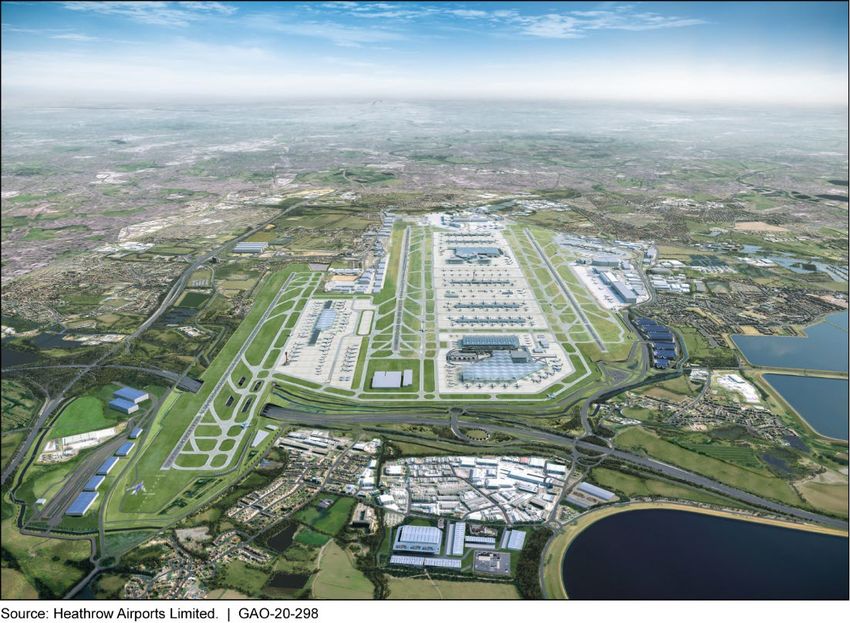
February 2020

                                              AIRPORT INFRASTRUCTURE
                                              Information on Funding and Financing for Planned
                                              Projects
Highlights of GAO-20-298, a report to
congressional requesters

Why GAO Did This Study                        What GAO Found
U.S. airports are important contributors      From fiscal years 2013 through 2017, U.S. airports received an average of over
to the U.S. economy, providing mobility       $14 billion annually for infrastructure projects. The three largest funding sources
for people and goods, both domestically       are below:
and internationally. About 3,300 airports     • Funding from federal Airport Improvement Program (AIP) grants has
in the United States are part of the              remained relatively constant, at an annual average of $3.2 billion. Smaller
national airport system and eligible to           airports (small hub, non-hub, and general aviation) collectively received more
receive federal AIP grants to fund                AIP funding compared to larger airports (large and medium hub).
infrastructure projects. To help fund         • Revenue from federally authorized passenger-facility charges (PFC), a per-
these projects, certain categories of
                                                  passenger fee charged at the ticket’s point of purchase, increased by 9
airports are also authorized by federal
                                                  percent, with an annual average of $3.1 billion. Increases in passengers and
law to collect PFCs, which passengers
pay when buying tickets.                          PFC revenue at larger airports contributed to this increase.
                                              • Airport-generated revenue (e.g., concessions and airline landing fees)
GAO was asked to examine airport-                 increased by 18 percent, with an annual average of $7.7 billion. While both
funding sources and planned                       larger and smaller airports experienced increases in these revenues, the
infrastructure projects. This report              larger airports made up 92 percent ($7.1 billion) of these revenues.
examines, among other issues: (1)             In addition to these sources, some airports obtained financing by issuing bonds,
levels of federal and other funding that      secured by airport revenue or PFCs. According to Federal Aviation
U.S. airports received from fiscal years
                                              Administration (FAA) data, larger airports were able to generate more bond
2013 through 2017 for infrastructure
                                              proceeds than smaller airports in part because larger airports are more likely to
projects, (2) projected costs of planned
infrastructure investments at U.S.            have a greater, more certain revenue stream to repay debt.
airports from fiscal years 2019 through       Airports’ planned infrastructure costs for fiscal years 2019 through 2023 are
2023, and (3) any challenges selected         estimated to average $22 billion annually (in 2017 dollars)—a 19 percent
airports identified in obtaining projects’    increase over prior estimates for fiscal years 2017 through 2021. These costs are
funding and financing.                        expected to increase in part because airports are planning to invest in more
GAO analyzed airport-funding data for         terminal projects. For example, cost estimates for AIP-eligible terminal projects
AIP grants, PFCs, airport-generated           increased about 51 percent when compared to FAA’s prior 5-year estimate. FAA
revenue, and other sources for fiscal         and airport association representatives stated that terminal projects can be more
years 2013–2017—the most recent               expensive than other projects because of the scale of the improvements, which
years for which data were available—          can include renovating terminals to repair aging facilities and accommodate
and FAA’s and Airports Council – North        larger aircraft and growth in passengers.
America’s cost estimates of airports’
planned infrastructure projects for fiscal    Officials from GAO’s 19 selected airports cited several challenges to funding
years 2019–2023. GAO also interviewed         infrastructure projects. For example, officials stated that the funding and revenue
FAA officials; representatives from           they receive from combined sources may not be sufficient to cover the costs of
airline and airport associations, and         planned infrastructure projects. The officials also raised concerns about being
bond-rating agencies; officials from 19       able to finance future airport-infrastructure projects because they have already
selected airports representing airports of    obligated their current and future PFCs to service debt on completed and
different sizes and with the highest          ongoing infrastructure projects. According to FAA data, in fiscal years 2013
planned development costs, among              through 2017, airports paid a total of $12 billion—or 78 percent of total PFC
other things; and representatives from        revenues collected—for debt service. Bond-rating agencies, however, continue to
eight selected airlines, selected based       give airports high or stable ratings, and rating agencies’ representatives stated
on factors such as passenger traffic.         that airports’ access to capital markets continues to remain favorable. Some
                                              airport officials stated that to address funding challenges, they have deferred
                                              some needed infrastructure investments or completed projects in phases, steps
                                              that increased construction times and costs.
View GAO-20-298. For more information,
contact Heather Krause at (202) 512-2834 or
krauseh@gao.gov.
                                              ______________________________________ United States Government Accountability Office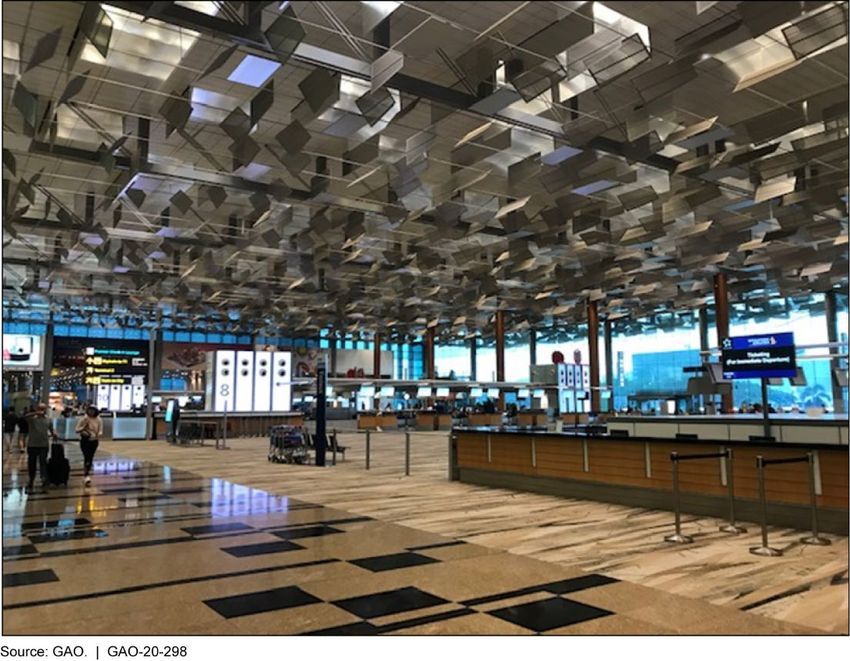
Contents

Letter                                                                                      1
               Background                                                                   6
               Airports Received an Average of about $15 Billion Annually for
                  Infrastructure Development from a Variety of Sources, Including
                  Grants and Revenue                                                       12
               Projected Planned Airport-Infrastructure Costs Have Increased to
                  an Average of $22 Billion Annually and Include More
                  Investments in Terminal Projects                                         21
               Selected Airports Cited Challenges Related to Funding Sources,
                  AIP Eligibility Criteria, and Competing Airport and Airline
                  Priorities                                                               29
               Agency Comments                                                             39

Appendix I     Ownership and Infrastructure Funding and Financing of Foreign
               Airports                                                                    41

Appendix II    Objectives, Scope, and Methodology                                          73

Appendix III   GAO Contact and Staff Acknowledgments                                       81

Tables
               Table 1: Estimated Costs of Eligible Projects for Federal Aviation
                       Administration’s (FAA) Airport Improvement Program by
                       Airports’ Size, Annual Averages for Fiscal Years 2019–
                       2023                                                                24
               Table 2: Changes in Estimated Costs of Eligible Projects for the
                       Federal Aviation Administration’s (FAA) Airport
                       Improvement Program, Fiscal Years 2017–2021 and
                       2019–2023                                                           26
               Table 3: Reported Ownership Structure and Infrastructure-
                       Funding Sources of Selected Foreign Airports as of
                       October 2019                                                        46
               Table 4: Examples of Departing Passenger Charges at Selected
                       Foreign Airports as of October 2019                                 49
               Table 5: Selected Large Hub, Medium Hub, Small Hub, and Non-
                       Hub U.S. Airports Where GAO Conducted Interviews                    78

               Page i                                         GAO-20-298 Airport Infrastructure
Table 6: Selected International Airport Associations, Industry
Stakeholders, and Foreign Airports at which GAO
Conducted Interviews 80
Figures
Figure 1: Commercial Airport Categories for U.S. Airports Based
on 2017 Boardings of U.S. Passengers 6
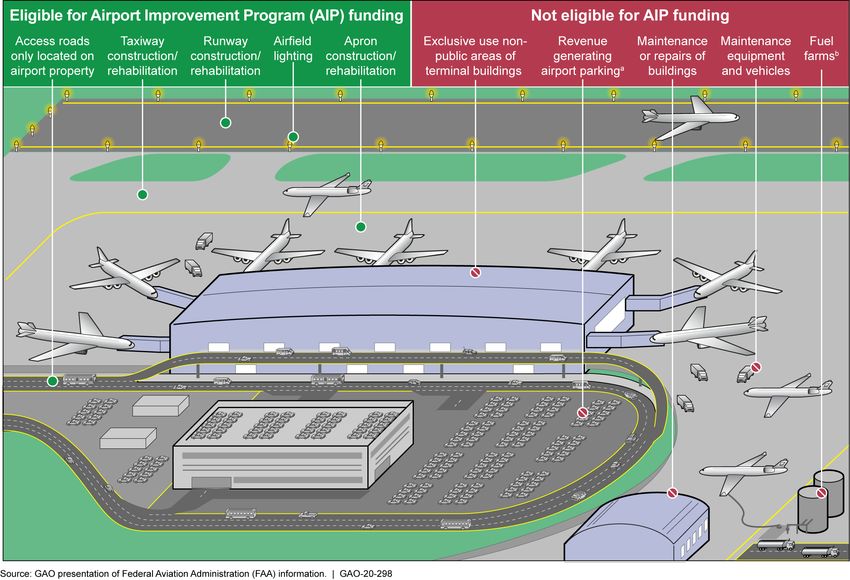
Figure 2: Examples of Projects Eligible and Not Eligible for the
Airport Improvement Program’s (AIP) Funding 9
Figure 3: Examples of Terminal Building Areas Eligible and Not
Eligible for the Airport Improvement Program’s (AIP)
Funding 10
Figure 4: Airport Improvement Program’s (AIP) Grants to Airports
by Size, Fiscal Years 2013–2017 13
Figure 5: U.S. Airport’s Passenger Facility Charge (PFC)
Collections by Airport Size, Fiscal Years 2013–2017 16
Figure 6: Total Aeronautical and Non-Aeronautical Revenue for All
U.S. Airports, Fiscal Years 2013–2017 18
Figure 7: U.S. Airports’ Bond Proceeds for Fiscal Years 2013
through 2017 20
Figure 8: Revenue from Passenger Facility Charges and Offsets
Used for Debt Service by U.S. Airports, Fiscal Years
2013–2017 33
Figure 9: Snohomish County (Paine Field) Airport Terminal 44
Figure 10: Helsinki Airport’s New Departure Gate Area, Opened in
June 2016 55
Figure 11: A Rendering of Helsinki Airport’s Terminal Expansion
Project 56
Figure 12: Terminal 3 at Changi Airport 58
Figure 13: Rendering of the Planned Third Runway at Heathrow
Airport 67
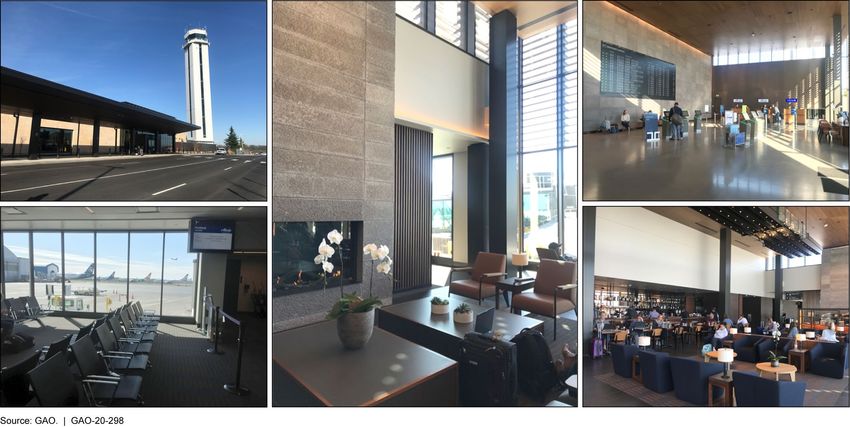
Figure 14: Recently Completed Terminal Expansion Project at
Toronto Pearson International Airport 72
Page ii GAO-20-298 Airport Infrastructure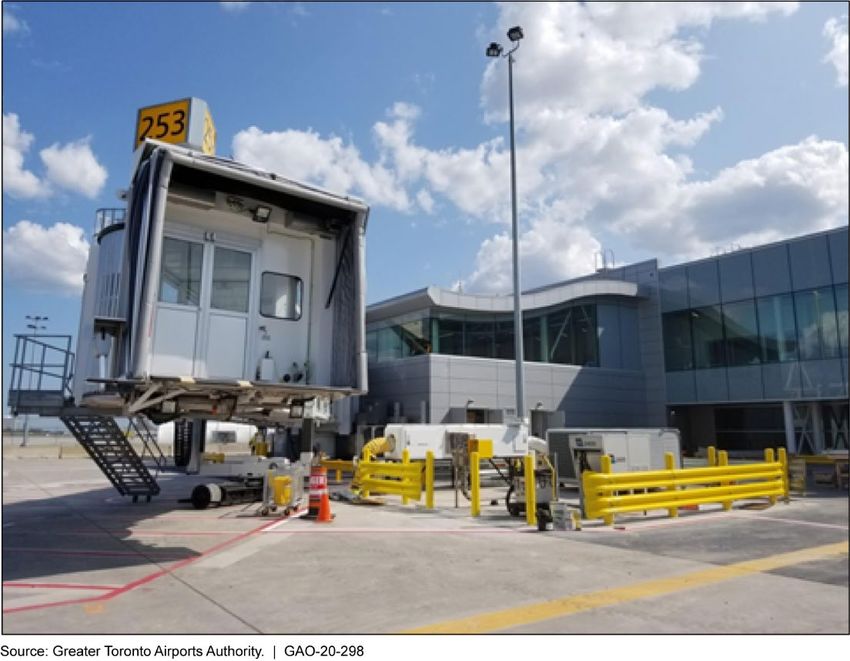
Abbreviations

A4A                        Airlines for America
AATF                       Airport and Airway Trust Fund
ACI-EUROPE                 Airports Council International - EUROPE
ACI-NA                     Airports Council International - North America
ACI-World                  Airports Council International - World
AIP                        Airport Improvement Program
CATS                       Certification Activity Tracking System
EU                         European Union
FAA                        Federal Aviation Administration
IATA                       International Air Transport Association
MII                        majority-in-interest
NAS                        National Airports System (Canada)
NASAO                      National Association of State Aviation Officials
NPIAS                      National Plan of Integrated Airport Systems
PFC                        passenger facility charge
SOAR                       System of Airports Reporting

This is a work of the U.S. government and is not subject to copyright protection in the
United States. The published product may be reproduced and distributed in its entirety
without further permission from GAO. However, because this work may contain
copyrighted images or other material, permission from the copyright holder may be
necessary if you wish to reproduce this material separately.

Page iii                                                  GAO-20-298 Airport Infrastructure
Letter

441 G St. N.W.
Washington, DC 20548

                       February, 13, 2020

                       The Honorable Peter DeFazio
                       Chairman
                       Committee on Transportation and Infrastructure
                       House of Representatives

                       The Honorable Rick Larsen
                       Chairman
                       Subcommittee on Aviation
                       Committee on Transportation and Infrastructure
                       House of Representatives

                       U.S airports are important contributors to our economy and fulfill a variety
                       of vital roles, from supporting scheduled commercial air service for the
                       traveling public, to supporting freight transportation and disaster relief.
                       Since 1998, we have reported on airport funding and financing. 1 Our 2003
                       and 2014 reports highlighted challenges to airport funding and financing
                       during a time when aviation activity was slowing or even declining at
                       many airports. However, in recent years the financial outlook of U.S
                       airports has improved, due in part to increased demand for air travel and
                       the improved economy following the 2007 through 2009 recession. 2
                       According to Federal Aviation Administration (FAA) data, the number of
                       people boarding planes—known as passenger “enplanements”—has
                       increased from 829 million passengers in 2016 to 900 million passengers

                       1Prior GAO reports and testimonies on airport funding and financing include: GAO, Airport
                       Funding: FAA's and Industry's Cost Estimates for Airport Development, GAO-17-504T
                       (Washington D.C: Mar. 23, 2017); Airport Finance: Information on Funding Sources and
                       Planned Capital Development, GAO-15-306 (Washington, D.C.: Apr. 28, 2015); Airport
                       Funding: Aviation Industry Changes Affect Airport Development Costs and Financing,
                       GAO-14-658T (Washington, D.C.: June 18, 2014); Airport Finance: Observations on
                       Planned Airport Development Costs and Funding Levels and the Administration’s
                       Proposed Changes in the Airport Improvement Program, GAO-07-885 (Washington, D.C.:
                       June 29, 2007); Airport Finance: Past Funding Levels May Not Be Sufficient to Cover
                       Airports’ Planned Capital Development, GAO-03-497T (Washington, D.C.: Feb. 25, 2003);
                       and Airport Financing: Funding Sources for Airport Development, GAO/RCED-98-71
                       (Washington, D.C.: Mar. 12, 1998).

                       2Fitch   Ratings, 2019 Outlook: U.S. Transportation Infrastructure (Dec. 5, 2018).

                       Page 1                                                      GAO-20-298 Airport Infrastructure
in 2018 (an increase of 8 percent) and is expected to continue to grow
over the next 20 years. 3

Maintaining and improving infrastructure at U.S. airports is critical to help
ensure safety and security and to meet increasing passenger demand.
Currently, airports in the National Plan of Integrated Airport Systems
(NPIAS) are eligible to receive federal Airport Improvement Program
(AIP) grants to help fund airport infrastructure projects. 4 Commercial
service airports—if they choose and subject to federal approval—are also
authorized to collect a local passenger facility charge (PFC) from each
passenger. 5 PFC revenues can be used for many of the same types of
projects as AIP grants, but can also be used for debt service to finance
infrastructure projects. There are varying perspectives on whether
airports have the funding needed to address planned infrastructure
needs. According to the Airports Council International—North America
(ACI-NA)—an airport industry association—U.S. airports lack the
necessary funding to modernize and expand outdated infrastructure.
However, according to Airlines for America—the U.S. airline trade
association—U.S. airports currently have adequate access to funding
sources for their infrastructure needs.

You asked us to examine airport-funding sources, planned infrastructure
projects, and funding mechanisms in other countries. This report
discusses

•   levels of federal and other funding that U.S. airports received from
    fiscal years 2013 through 2017 for infrastructure investments,
•   projected costs of planned infrastructure investments at U.S. airports
    from fiscal years 2019 through 2023, and
•   any challenges selected airports face in obtaining airport infrastructure
    funding and financing.

3Specifically, the FAA forecasts U.S. airline passenger enplanements will increase from
857 million in 2017 to over 1 billion in 2039.
4The  NPIAS is a 5-year inventory, prepared by FAA, of planned infrastructure projects at
U.S. airports that are significant to the national air transportation system and thus eligible
to receive federal AIP grants. FAA publishes the NPIAS for Congress every two years.
5Commercial   service airports are defined by 49 U.S.C. § 47102 as public airports that the
Secretary of Transportation determines have at least 2,500 passenger boardings
(enplanements) each year and receive scheduled passenger aircraft service.

Page 2                                                      GAO-20-298 Airport Infrastructure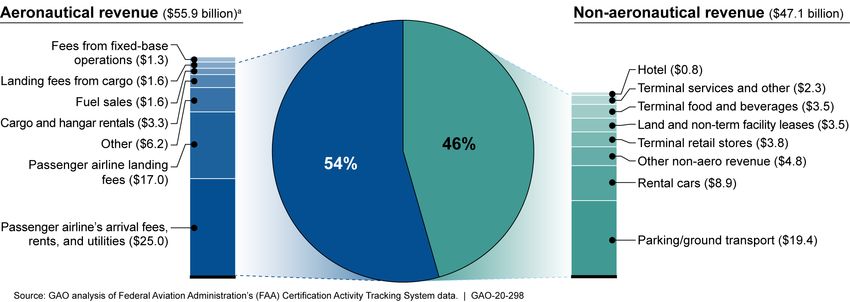
We also examined how selected airports in other countries fund and
finance airport infrastructure investments. This information is presented in
appendix I.

To determine how much federal and other funding airports received from
fiscal years 2013 through 2017 for infrastructure investments, we
obtained and analyzed information on the main sources of airport funding,
which include funding from federal grants and state grants, revenue from
PFCs, airport-generated net income, capital contributions, and amounts
of financing airports received from bond proceeds and other debt
financing. All dollar amounts calculated from multiple years are presented
in adjusted 2017 dollars. For data on airport-generated net income and
capital contributions, we obtained and analyzed airport financial data from
FAA’s Certification Activity Tracking System (CATS) for fiscal years 2013
through 2017. 6 For AIP grants, we analyzed information from FAA’s
System of Airports Reporting (SOAR) database on AIP grants awarded
by FAA from fiscal years 2013 through 2017. For PFCs, we obtained and
analyzed data from the SOAR database on PFC collection amounts at all
airports that collected PFCs from fiscal year 2013 through fiscal year
2017. We assessed the reliability of FAA’s CATS data on airport financial
information and FAA’s SOAR data on AIP grants and PFC collection
amounts by reviewing existing information about the data and the system
that produced them, and consulting with agency officials who are
knowledgeable about the data. We determined that the data were
sufficiently reliable for the purposes of this report. For information on state
grants, we used data from a survey that we conducted in 2014, with the
assistance of the National Association of State Aviation Officials
(NASAO); these data included all U.S. states and the territory of Guam.
Results from this survey were reported in our 2015 report and in
NASAO’s August 2015 report, NASAO State Aviation Funding and
Organizational Data Report. 7 We also spoke with NASAO officials about
more recent trends in state funding.

6FAA   uses CATS to gather and disseminate federally mandated airport financial
information based on annual financial reports filed by commercial airports. We relied on
fiscal year 2013 through 2017 data because it was the most recent 5 year period where
complete data were available.
7See  GAO-15-306. Comprehensive data on how much funding airports received from
states from 2013 through 2017 are not available.

Page 3                                                    GAO-20-298 Airport Infrastructure

To determine projected costs of planned infrastructure investments at
U.S. airports from fiscal years 2019 through 2023, we reviewed data from
FAA’s Report to Congress National Plan of Integrated Airport Systems
(NPIAS) 2019–2023. We also examined ACI-NA’s report on airports’
capital development needs for 2019–2023, which was released in
February 2019. 8 In this report, planned infrastructure investments refers
to development needs that airports have identified for the 2019–2023
period and that are reflected in FAA’s and ACI-NA’s reports. Consistent
with how we present information about the sources of funding that
airports received, projected cost dollar amounts calculated from multiple
years are presented in adjusted 2017 dollars. To identify changes over
time in airport’s project costs of planned infrastructure investments, we
also reviewed FAA’s NPIAS report for fiscal years 2017–2021 and ACI-
NA’s report on airports’ capital development needs for 2017–2021 and
compared the estimates in those reports to the fiscal years 2019–2023
estimates. ACI-NA’s estimates of U.S. airport infrastructure project costs
differ from the FAA’s due to scope, methodology, and other reasons. For
both the FAA’s and ACI-NA’s estimates, we assessed the methodologies
for estimating the costs of airport planned development by reviewing
FAA’s and ACI-NA’s documents and interviewing FAA officials and ACI-
NA representatives. We found the FAA and ACI-NA estimates to be
sufficiently reliable for estimating planned capital development.

To identify any challenges airports face in obtaining infrastructure funding
and financing, we reviewed documents and interviewed officials from
FAA, 19 selected U.S. airports, and airport industry representatives to
obtain information about infrastructure funding sources, planned
infrastructure investments, and challenges to obtaining airport funding
and financing. We selected airports representing different hub sizes,
airports with the highest planned infrastructure costs, and airports with
increasing and decreasing enplanements in calendar years 2013 through
2017. 9 We also interviewed an airline association and eight selected U.S.
airlines to obtain their views on airport infrastructure funding and financing
issues. We selected airlines with the highest passenger traffic, as

8ACI-NA’s report which was issued in February 2019, is titled 2019-2023 Terminally
Challenged: Addressing the Infrastructure Funding Shortfall of America's Airports.
9The term “hub” is defined in federal law to identify commercial service airports as
measured by passenger boardings, and the airports are grouped into four categories (49
U.S.C. § 40102 (29), (31), (34) and (42)). We relied on 2013 through 2017 data because it
was the most recent data available at the time of our analysis.

Page 4                                                  GAO-20-298 Airport Infrastructure

measured by revenue passenger miles; legacy and low cost carriers; and
domestic airlines that provide service outside the United States. 10 The
information gathered from selected airport and airline interviews is not
generalizable to the airport and airline population.

We also examined how foreign airports fund and finance infrastructure
development. Foreign airports’ ownership, regulatory, and funding
structures are different from U.S. airports. As a result, benchmarking of
airline rates and charges, passenger fees, and other sources of
infrastructure funding is not possible due to these differences. To provide
illustrative examples of the range of approaches to funding infrastructure
at foreign airports, we obtained documents from and interviewed
international airport associations, international aviation industry
stakeholders, and representatives from four out of the five foreign airports
that we selected as case studies. These airports included: Toronto
Pearson International Airport (Canada), Frankfurt Airport (Germany),
Heathrow Airport (United Kingdom), Helsinki Airport (Finland), and
Changi Airport (Singapore). Representatives from Frankfurt Airport
provided written responses and documents for our review. We selected
foreign airports that had different airport ownership structures, that had
the highest international passenger traffic, and that U.S. carriers serviced.
The information gathered from these case studies is not generalizable to
all foreign airports. See appendix I for summary information about funding
and financing of airport infrastructure in our case studies of foreign
airports. More detailed information on our scope and methodology is
presented in appendix II.

We conducted this performance audit from September 2018 to February
2020 in accordance with generally accepted government auditing
standards. Those standards require that we plan and perform the audit to
obtain sufficient, appropriate evidence to provide a reasonable basis for
our findings and conclusions based on our audit objectives. We believe
that the evidence obtained provides a reasonable basis for our findings
and conclusions based on our audit objectives.

10Revenue passenger miles are the number of miles paying passengers are transported
and are a measure of passenger traffic.

Page 5                                                GAO-20-298 Airport Infrastructure
Background
U.S. Airport System   The United States has more than 19,000 airports, which vary substantially
                      in size and the type of aviation services they support. Of these, roughly
                      3,300 airports are designated by FAA as part of the national airport
                      system and are therefore eligible for federal assistance for airport capital
                      projects. 11 The national airport system consists of two primary types of
                      airports—”commercial service” airports—which are publicly owned, have
                      scheduled service, and board at least 2,500 or more passengers per
                      year—and “general aviation” airports—which have no scheduled service
                      and board fewer than 2,500 passengers. 12 Federal law divides
                      commercial service airports into various categories of airports, based on
                      the number of passenger boardings, ranging from large hub airports to
                      commercial service non-primary airports (see fig. 1).

                      Figure 1: Commercial Airport Categories for U.S. Airports Based on 2017 Boardings
                      of U.S. Passengers

                      Note: The term “hub” is defined in federal law to identify commercial service airports as measured by
                      passenger boardings, and the airports are grouped into four hub categories. (49 U.S.C. § 40102 (29),
                      (31), (34) and (42)).

                      1149   U.S.C § 47103.
                      1249   U.S.C § 47102(7) and § 47102(8).

                      Page 6                                                          GAO-20-298 Airport Infrastructure
Consistent with our prior work, we have grouped airports into two broader
categories: larger airports, which includes large and medium hubs, and
smaller airports, which includes small hubs, non-hubs (also referred to as
“non-hub primary”), and non-primary commercial service airports as well
as reliever airports, general aviation airports, and new airports. 13 The
majority of passenger traffic is at larger airports, which accounted for 88
percent of all commercial airport enplanements in 2017. From 2013 to
2017, enplanements have increased at airports of all hub sizes.
Specifically, commercial airport enplanements at larger and smaller
airports increased by 16 percent and 15 percent, respectively, during this
time period.
Federal Grants National system airports are eligible to receive federal funding from AIP
grants for infrastructure development. AIP funds are first authorized in
FAA reauthorization acts, and Congress then appropriates funds for AIP
grants from the Airport and Airway Trust Fund, which is supported by a
variety of aviation-related taxes, such as taxes on tickets, cargo, general
aviation gasoline, and jet fuel. 14 While AIP grants are an important source
for airports’ infrastructure funding, the amount of funding authorized for
the AIP grant program has not changed since 2012. 15 In 2018, Congress
passed the FAA Reauthorization Act of 2018, which authorized annual
AIP grant levels at $3.35 billion annually through fiscal year 2023 and
authorized additional amounts for supplemental discretionary funding
each year from 2019 through 2023, starting at $1.02 billion and increasing
each year thereafter. In addition, the Consolidated Appropriations Act of
2018 appropriated $1 billion in supplemental annual funding from the
general fund for the AIP discretionary grant program. Subsequently, in
February 2019, the Consolidated Appropriations Act of 2019 provided
$500 million from the general fund to the AIP discretionary grant program.
The distribution of federal AIP grants is complex. It is based on a
combination of formula funds—also referred to as entitlement funds—that
13Reliever airports are airports designated by the Secretary of Transportation to relieve
congestion at a commercial service airport by providing access to airlines and providing
additional general aviation access to the community. 49 U.S.C. § 47102 (23).
14AIP is funded through the FAA authorization legislation and subsequent appropriations.
15The 2012 FAA Modernization and Reform Act authorized funding for AIP grants through
fiscal year 2015 at an annual level of $3.35 billion. Pub. L. No. 112-95, § 101(a), 126 Stat.
11, 15.
Page 7 GAO-20-298 Airport Infrastructureare available to national system airports, and discretionary funds that FAA awards for selected eligible projects. Entitlement funds are apportioned by formula to airports and may generally be used for any eligible airport improvement or planning project. 16 Discretionary funds are approved by FAA based on FAA selection criteria and a priority system, which FAA uses to rank projects based on the extent to which they reflect FAA’s nationally identified priorities. 17 AIP grants must be used for eligible and justified projects, which are planned and prioritized by airports, included in their capital improvement plans, and reviewed and approved by FAA staff and the Secretary of Transportation. 18 Generally, most types of airfield improvements—such as runways, lighting, navigational aids, and land acquisition—are eligible for AIP funding. AIP-eligible projects for airport areas serving travelers and the general public—called “landside development”—include entrance roadways, pedestrian walkways and movers, and common space within terminal buildings, such as waiting areas. See figures 2 and 3 for more information about the types of projects eligible for AIP funding. For all AIP-funded projects, the airport must provide a share of matching funds. The federal share is from 75 to 95 percent depending on the size of the airport or type of project. 16Entitlement funds are first apportioned by formula to specific airports or types of airports. These funds are divided into four categories: primary airports, cargo service airports, general aviation airports, and Alaska supplemental funds. Each category distributes AIP funds by a different formula. After entitlement funds have been apportioned, the remaining funds are defined as discretionary funds. 49 U.S.C. §47114. 17Discretionary funding includes funding that was not distributed under the apportioned entitlements, as well as the forgone PFC revenues that were deposited into the small airport fund. Allocations of discretionary funds are subject to three set-asides for airport environment programs, military airport program funding, and a special set-aside for certain types of reliever airports. Of the remaining discretionary funds, 75 percent must be used for preserving and enhancing capacity, safety, and security at primary and reliever airports. The remaining 25 percent, known as remaining pure discretionary, may be used for any eligible project at any airport. 49 U.S.C. § 47115-47116. 18Federal law establishes which types of airport development projects are eligible for AIP’s funding. 49 U.S.C. § 47102(3). Page 8 GAO-20-298 Airport Infrastructure
Figure 2: Examples of Projects Eligible and Not Eligible for the Airport Improvement Program’s (AIP) Funding

                                         a
                                          Airport parking is eligible for nonrevenue parking lots at non-hub primary and non-primary airports.
                                         b
                                          Fuel farms may be conditionally eligible at non-primary airports.

                                         Page 9                                                               GAO-20-298 Airport Infrastructure
Figure 3: Examples of Terminal Building Areas Eligible and Not Eligible for the Airport Improvement Program’s (AIP) Funding
a
Revenue-producing areas are ineligible at large, medium, or small hub airports. However, these
projects may be eligible at all other commercial service airports that are public use per 49 USC §
47119(a)(1) and where a sponsor has certified that any needed airport development project affecting
safety, security, or capacity will not be deferred due to the revenue-producing project.
Passenger Charges Revenue from PFCs is another means of support for airport infrastructure
projects. PFCs are federally authorized fees which were established in
1990 to help pay for infrastructure at commercial service airports. 19
Although PFCs are local funds subject to the airport’s control, FAA
oversees the PFC program and approves applications by airports to
collect PFC revenues. PFCs are currently capped at $4.50 per flight
segment with a maximum of two PFCs charged on a one-way trip or four
PFCs on a round trip, for a maximum of $18 total. On behalf of the
airports, airlines collect the PFC at the time of the ticket purchase and
remit the PFC, minus an administrative fee, to the airport. To meet future
1949 U.S.C. § 40117.
Page 10 GAO-20-298 Airport Infrastructureplanned infrastructure costs, airports have sought an increase in the cap
on PFCs. However, airlines oppose a PFC increase because they believe
airports already receive sufficient PFC revenues and that higher ticket
prices could reduce passenger demand and airline revenues. We have
previously reported that increasing the PFC cap would significantly
increase PFC collections available to airports under three scenarios GAO
modeled but could also marginally slow passenger growth and growth in
revenues to the Airport and Airway Trust Fund (AATF). 20
Airports have more flexibility in using PFCs to fund infrastructure projects
as compared to AIP funding. Airport infrastructure projects eligible for
PFC funding must meet one or more of the following:
• preserve or enhance safety, security, or capacity;
• reduce noise or mitigate noise impacts; or
• increase air carrier competition. 21
Airports are able to fund projects with PFC revenues that might not be
eligible for AIP funding, such as passenger terminal projects and
development at gates, airline ticketing areas, and passenger check-in
facilities at hub airports. In addition to being applied to FAA approved
eligible projects, PFCs can be used as a match for AIP grants or to
finance the debt on approved projects.
Airports’ Costs for Planned FAA and ACI-NA each produce reports summarizing 5-year estimates of
Infrastructure Projects U.S. airports’ infrastructure project costs. More specifically, FAA is
required to publish a 5-year estimate of AIP-eligible development every 2
years. FAA provides this information in its NPIAS report. 22 FAA relies on
airports, through their planning processes, to identify individual AIP-
20GAO, Commercial Aviation: Raising Passenger Facility Charges Would Increase Airport
Funding, but Other Effects Less Certain, GAO-15-107 (Washington D.C.: Dec. 11, 2014).
21Specifically, PFC projects must meet one or more of the requirements of 49 U.S.C. §
40117(a)(3) which include: (1) preserve or enhance safety, security, or capacity of the
national air transportation system; (2) reduce noise or mitigate noise impacts resulting
from an airport; or (3) furnish opportunities for enhanced competition between or among
air carriers.
22FAA’s most recent report, which provides estimates of AIP-eligible development for
fiscal years 2019 through 2023, is titled Report to Congress National Plan of Integrated
Airport Systems (NPIAS) 2019-2023. FAA’s cost estimate includes estimates for AIP-
eligible projects as required by statute.
Page 11 GAO-20-298 Airport Infrastructureeligible projects for funding consideration and inclusion in the NPIAS. The
ACI-NA also collects data on all proposed capital development projects at
U.S. airports and every 2 years publishes a report of U.S. airports’ 5-year
infrastructure cost estimates. 23
From fiscal years 2013 through 2017, national system airports received
Airports Received an an annual average of about $15 billion in funding from a variety of
Average of about $15 sources for infrastructure development projects, including: 24
Billion Annually for • federal AIP grants (about $3.2 billion annually); 25
Infrastructure • airport revenue from passenger charges (about $3.1 billion annually),
Development from a and airport-generated revenue (about $7.7 billion annually); and
Variety of Sources, • capital contributions (about $715 million annually).
Including Grants and These figures, however, do not represent the full amount of funding that is
available to airports for infrastructure development. For example, some
Revenue airports also received funding from state grants and bond proceeds
through debt financing to fund airport infrastructure investments. In
addition, the proportion of funding that larger and smaller airports
received from these sources varies.
23As previously discussed, ACI-NA’s most recent report is titled 2019-2023 Terminally
Challenged: Addressing the Infrastructure Funding Shortfall of America's Airports. The
report provides estimates of airport infrastructure needs for fiscal years 2019 through
2023. ACI-NA’s cost estimate includes estimates for AIP-eligible and AIP-ineligible
projects.
24Dollar amounts in this section are presented in adjusted 2017 dollars. All funding figures
provided are annual averages for fiscal years 2013 through 2017. More recent data on
state grant funding were not available, as we will discuss later in the report.
25AIP grant funding reflects grants awarded to airports during each of the fiscal years
shown (fiscal years 2013 through 2017), as subsequently amended through January 29,
2020. FAA officials said that AIP grants issued in any given year may be subsequently
amended using funds available from the current year, or funds recovered from a different
fiscal year. Therefore, the annual AIP grant summary figures reported here will vary from
the annual figures shown in prior GAO reports, including our 2015 report (GAO-15-306).
Page 12 GAO-20-298 Airport InfrastructureFederal AIP and State From fiscal years 2013 through 2017, the total amount of AIP grants that
Grant Funding Has national system airports received has generally remained constant. 26 As
Remained Relatively shown in figure 4 below, the amount of AIP grant funding that airports
received ranged from $3.1 billion to $3.3 billion annually for fiscal years
Constant 2013 through 2017. Overall, airports received an average of $3.2 billion
annually in AIP grants. The total amount of AIP grant funding that FAA
allocates to airports may vary slightly year to year for many reasons. For
example, according to FAA, each year a small amount of AIP funding is
returned from prior-year grants and the FAA is permitted to re-obligate
those funds on either existing or new grants.
Figure 4: Airport Improvement Program’s (AIP) Grants to Airports by Size, Fiscal
Years 2013–2017
Dollar amounts are in adjusted 2017 dollars. AIP grant funding reflects data as of January 29, 2020.
a
b
Larger airports include large and medium hubs. For fiscal years 2013 through 2017, the number of
larger airports that received AIP grants ranged from 55 to 59.
26FAA officials said that in 2013, FAA had a one-time transfer of $253 million from AIP
grants to operations due to sequestration. As a result, the data show that the AIP grant
funding is lower in 2013. Pub. L. No. 113-9, § 2(c), 127 Stat. 443.
Page 13 GAO-20-298 Airport Infrastructurec
Smaller airports include predominantly small hubs, non-hubs, and non-primary commercial service
airports, as well as a few reliever airports, and general aviation airports. For fiscal years 2013 through
2017, the number of smaller airports that received AIP grants ranged from to 1,324 to 1,392.
Collectively, smaller airports received more AIP grant funding compared
to larger airports during this time period. As shown in figure 4, from fiscal
years 2013 through 2017, smaller airports received the largest share of
AIP grant funding, approximately 75 percent, (an annual average of $2.4
billion), compared to 25 percent received by larger airports (an annual
average of $812 million). Larger airports are generally able to rely on
other sources of revenue generated from airport-generated revenue and
PFCs due to higher enplanements compared to smaller airports. In
addition, the amount of AIP grants’ funding that smaller hub airports
received increased by about 10 percent between fiscal years 2013
through 2017, while the amount of AIP’s funding for larger airports
decreased by 3 percent in the same time period. However, smaller
airports receive less funding per AIP grant compared to larger airports.
For example, smaller airports received an average of $897,000 per grant,
while larger airports received an average of $5 million per AIP grant.
Some airports also received state funding, primarily in the form of grants
used as matching funds for federal AIP grants. Data for fiscal years 2013
through 2017 on states’ grant funding are not available. However, in
2015, we conducted a survey of airports, in collaboration with NASAO, for
fiscal years 2009 through 2013, and reported that states provide an
annual average of $477 million to national system airports. 27 According to
NASAO officials we interviewed for our current work, states’ grant-funding
levels have remained unchanged.
Airport Revenue—the From fiscal years 2013 through 2017, airports collected revenue from a
Largest Source of Funding variety of sources, including PFC charges and airport-generated revenue
(both aeronautical and non-aeronautical), which have both increased
for Larger Airports—Has during our 5-year time period. 28 Some airports also received funding from
Gradually Increased capital contributions, but that amount has decreased from fiscal year
27GAO-15-306.
28Aeronautical revenues are derived from the operation and landing of aircraft,
passengers, or freight. Non-aeronautical revenues are derived from other airport sources,
such as terminal concessions and parking fees.
Page 14 GAO-20-298 Airport Infrastructure2013 through 2017. 29 Airport revenue is the largest source of funding for
larger airports. Specifically, larger airports generated an annual average
of $10.4 billion in airport revenue (or 90 percent of all airport revenue)
during our 5-year time period. Smaller airports generated less airport
revenue, with an annual average of $1.2 billion (or 10 percent of all airport
revenue), compared to larger airports. Larger airports’ ability to generate
more airport revenue reflects that PFCs and airport-generated revenue
could be driven by the higher levels of passenger enplanements and
airline activity associated with current economic conditions. 30 According to
FAA officials, while total airport revenue has increased over this time
frame, it does not necessarily mean that airports have more revenue
available for new capital expenditures. For example, airport revenue is
also used to pay for existing debt service and operating costs, which
according to FAA officials, has also increased during this time period.
Passenger Charges Overall, from fiscal years 2013 through 2017, U.S. airports collected an
annual average of $3.1 billion in PFC revenue. 31 As shown in figure 5,
during this period, the annual average for PFC collections for all airports
increased by 9 percent from $3 billion to $3.3 billion. Because PFCs are
generated by the number of enplaned passengers, this increase was
mostly driven by a 16 percent increase in passenger enplanements
during this period for both smaller and larger airports.
29Capital contributions are generally funding provided to airports by the airport's sponsor
(often a state or municipality) or by other sources such as an airline. As referenced later in
this report, capital contributions for airport infrastructure projects make up a small amount
of funding compared to other sources of funding.
30The International Air Transport Association (IATA) has reported that economic gross
domestic product (GDP) growth is a fundamental driver of air travel demand.
31PFC revenue reported here is not comparable to PFC revenue in our 2015 report. We
used a different methodology to calculate PFC revenue from our 2015 report on airport
finance. See GAO-15-306.
Page 15 GAO-20-298 Airport InfrastructureFigure 5: U.S. Airport’s Passenger Facility Charge (PFC) Collections by Airport Size, Fiscal Years 2013–2017 Dollar amounts are in adjusted 2017 dollars. a b Larger airports include large and medium hubs. For fiscal years 2013 through 2017, the number of larger airports reporting annual financial data to FAA ranged from 55 to 60. c Smaller airports include predominantly small hubs, non-hubs, and non-primary commercial service airports, as well as a few reliever airports, and general aviation airports. For fiscal years 2013 through 2017, the number of smaller airports reporting annual financial data to FAA ranged from to 1,323 to 1,392. As shown in figure 5, larger airports collected most (89 percent) of the PFC revenues in fiscal years 2013 through 2017. In addition, although both larger airports and smaller airports experienced an increase in passenger enplanements in fiscal years 2013 through 2017, larger airports experienced a 10 percent increase in PFC revenue while smaller airports experienced an overall decrease in PFC revenue during this period of about 3 percent. According to FAA officials, smaller airports may have experienced an overall decrease in PFC revenues because airports’ PFC collections may cease when they have fully collected the approved amount for a project. According to FAA, this cessation is particularly true for smaller airports that do not have multiple projects for which PFC collections have been approved for a long period of time. In addition, if an Page 16 GAO-20-298 Airport Infrastructure
airport has approved collections but one or more airlines make significant
                            reductions in activity levels, this factor can also slow the rate of
                            collections at airports. Larger airports hold a larger market share of flights,
                            representing 88 percent of enplanements. Ratings agency
                            representatives said that larger airports rely more on PFCs and bonding
                            to fund infrastructure projects.

Airport-Generated Revenue   From fiscal years 2013 through 2017, U.S. airports generated an annual
                            average of $7.7 billion in airport-generated revenue. 32 During this period,
                            airport-generated revenue increased 18 percent, from $7.1 billion to $8.4
                            billion for all airports. 33 Overall, both larger and smaller airports generated
                            more income over this time period, with larger airports generating
                            substantially more revenue compared to smaller airports. Specifically,
                            from fiscal years 2013 through 2017, larger airports generated an annual
                            average of $7.1 billion in revenue, and smaller airports generated an
                            annual average of $567 million in revenue.

                            Airport-generated revenue consists of both “airside” aeronautical
                            revenues derived from the operation and landing of aircraft, passengers,
                            or freight, as well as “landside” non-aeronautical revenues derived from
                            terminal concessions and parking fees. Of the $103 billion in airport-
                            generated revenue over our 5-year time period, 54 percent came from
                            aeronautical revenues and 46 percent came from non-aeronautical
                            revenues (see fig. 6). Commercial service airline rates and charges—
                            which include passenger airline’s landing fees and passenger arrival fees,
                            rents, and utilities—made up 75 percent of the total $55.9 billion in
                            aeronautical revenue. The remainder came from a variety of other fees
                            and taxes paid by airlines, general aviation, the military, and other
                            aeronautical sources. Of the non-aeronautical revenues, parking and
                            ground transportation accounted for the greatest portion (41 percent),
                            followed by rental cars operations revenue (19 percent). Aeronautical

                            32We calculated airport-generated revenue by taking U.S. airports’ total operating revenue
                            plus interest income, subtracted by the subtotal of operating expenses prior to subtracting
                            depreciation. The annual average of $7.7 billion in airport-generated revenue reflects
                            annual averages of $20.6 billion in operating revenues, plus $274 million in interest
                            income, minus $13.2 billion in operating expenses (before subtracting depreciation
                            expense).
                            33We   used a different methodology to calculate airport-generated revenue from our 2015
                            report on airport finance by not subtracting an estimated amount of PFCs used to pay for
                            interest expense from the airport’s total interest expense. See GAO-15-306. As a result,
                            airport-generated revenue reported here is not comparable to airport-generated revenue
                            in our 2015 report.

                            Page 17                                                   GAO-20-298 Airport Infrastructure
revenues increased by 11 percent and non-aeronautical revenues
increased by 16 percent over the time period. 34
Figure 6: Total Aeronautical and Non-Aeronautical Revenue for All U.S. Airports, Fiscal Years 2013–2017
a
Dollar amounts are in adjusted 2017 dollars.
Capital Contributions Capital contributions for airport infrastructure projects make up a small
amount of funding in comparison to other sources, such as airport-
generated revenue and AIP funding. These contributions—made on an
individual project basis—may be provided by an airport’s sponsor (often a
state or municipality) or by other sources such as an airline. According to
FAA data on commercial airports’ annual financial reports for fiscal years
2013 through 2017, commercial airports received an annual average of
$715 million in capital contributions. Of this amount, $471 million, or 66
percent, went to larger airports, and $244 million, or 34 percent, went to
smaller airports. The amount of capital contributions varies by year and
by hub size. According to FAA officials, the sources of capital
contributions funding (i.e., airport sponsor, state, air carriers, or other
airport users) vary depending on the type of project and funds available.
34As we have previously reported, to increase non-aeronautical revenue, airports are
developing or enhancing the number and types of services within airport terminals for
passengers and visitors, such services as upscale shops and personal services; airports
are also developing services for passengers and businesses outside of the terminal areas
but on airport property such as hotels and business centers. See GAO-13-261.
Page 18 GAO-20-298 Airport InfrastructureSome Airports Also Airports can also obtain financing for airport infrastructure projects by
Received Bond Proceeds issuing bonds. Airport bonds entail leveraging future funding to pay for
projects. This financing mechanism enables airport authorities to borrow
through Debt Financing for
money up front to finance infrastructure projects; this money can then be
Airport Infrastructure paid back with interest over a longer time period. U.S. airports may qualify
Investments for tax-exempt bonds to support airport projects for federal tax purposes
because the airports are owned by states, counties, cities, or public
authorities. The tax-exempt status enables airports to issue bonds at
lower interest rates than taxable bonds, thus reducing a project’s
financing costs. FAA officials said that because airports use some PFCs
and airport-generated revenue to pay off debt service, not all revenue
generated from these two sources is available for additional infrastructure
investment.
FAA collects data in its financial reporting database of an airport’s total
indebtedness. Based on our analysis of this data, from fiscal years 2013
through 2017, airports had averaged $84.6 billion in total bond debt per
year. The total indebtedness measure provides an overall aggregate of
the level of long-term bond debt held by airports for the year. FAA’s data
do not differentiate indebtedness for each type of bond, nor do its data
differentiate between existing, new, or refinanced bonds. As a result, we
were not able to analyze how much airports obtained on average for new
projects by issuing bonds from fiscal years 2013 through 2017. In
addition, we were not able to determine whether U.S. airports borrowed
increasing amounts of new bond proceeds from fiscal years 2013 through
2017 to meet infrastructure needs. Moreover, FAA does not collect data
on the time frame that airports anticipate to pay back bonds, as FAA
officials said that airports have the latitude to determine their own debt-
payment schedules.
During fiscal years 2013 through 2017, larger airports received the vast
majority of bond proceeds, representing 95 percent of the total (see fig.
7). This amount includes debt from all long-term bonds. 35 We previously
reported that bond financing has traditionally been an option more
commonly exercised by larger rather than smaller airports because they
are more likely to have a greater and more certain revenue stream to
support debt repayment. 36 We have also reported that when smaller
35Long-term bonds include bonds backed by: general airport revenue bonds, general
aviation bonds, and general obligation bonds; double-barrel PFC bonds, which are backed
by both PFCs and airport revenues; and PFC-backed bonds.
36GAO-15-306.
Page 19 GAO-20-298 Airport Infrastructureairports issue bonds, they make greater use of general obligation bonds that are backed by tax revenues of the airport sponsor, which is often a state or municipal government. FAA officials added that larger airports tend to issue airport revenue bonds, which are backed solely by airport revenue, while some smaller airports may be able to benefit from bond proceeds issued by the broader county or municipal government and backed by that entity's taxing authority. Figure 7: U.S. Airports’ Bond Proceeds for Fiscal Years 2013 through 2017 Dollar amounts are in adjusted 2017 dollars. a b Larger airports include large and medium hubs. For fiscal years 2013 through 2017, the number of larger airports reporting annual financial data to FAA ranged from 55 to 60. c Smaller airports include predominantly small hubs, non-hubs, and non-primary commercial service airports, as well as a few reliever airports, and general aviation airports. For fiscal years 2013 through 2017, the number of smaller airports reporting annual financial data to FAA ranged from to 1,323 to 1,392. Page 20 GAO-20-298 Airport Infrastructure
Projected Planned
Airport-Infrastructure
Costs Have
Increased to an
Average of $22 Billion
Annually and Include
More Investments in
Terminal Projects
We Estimated Average           Based on our analysis, airports’ planned infrastructure costs are projected
Annual Costs of $22            to average $22 billion annually for fiscal years 2019 through 2023. To
                               arrive at this estimate, we combined FAA’s $7 billion estimate of AIP-
Billion for Planned Airport-
                               eligible planned infrastructure costs and ACI-NA’s $15 billion estimate of
Infrastructure Investments     planned infrastructure costs for projects that are not eligible for AIP
for Fiscal Years 2019          grants. 37 Our $22 billion estimate would represent an increase of 19
through 2023                   percent from FAA’s and ACI-NA’s fiscal years 2017 through 2021
                               infrastructure cost estimates. 38 This increase is largely driven by an
                               increase in ACI-NA’s estimate of AIP-ineligible planned projects.
                               Specifically, ACI-NA’s annual average of about $15 billion in planned AIP-
                               ineligible costs reflects an increase of $3.3 billion or 28 percent when
                               compared to the annual average estimate of AIP-ineligible projects from
                               ACI-NA’s fiscal year 2017–2021 estimates. Similarly, FAA’s annual
                               average of $7 billion in planned AIP-eligible costs reflects an increase of
                               $289 million or 4 percent from FAA’s fiscal year 2017–2021 estimates. 39

                               37FAA’s  estimate is in 2017 dollars. ACI-NA’s original estimates are in current year dollars.
                               For our analysis we adjusted ACI-NA’s estimate to 2017 dollars so as to be comparable to
                               FAA’s estimate. To provide a comprehensive estimate of future airport development costs,
                               we combined FAA and ACI-NA data. We used FAA’s estimate for AIP-eligible projects and
                               used ACI-NA’s estimate for AIP-ineligible projects. This is the same approach we used in
                               2003, 2007, and 2015. See GAO-03-497T, GAO-07-885, and GAO-15-306.
                               38To identify changes in FAA and ACI-NA’s recent estimates, we compared FAA’s and
                               ACI-NA’s fiscal years 2019–2023 estimate to FAA’s and ACI-NA’s fiscal years 2017–2021
                               estimates. We combined FAA’s 2017–2021 $6.7 billion estimate of AIP-eligible planned
                               infrastructure costs and ACI-NA’s 2017–2021 $11.9 billion estimate of AIP ineligible
                               projects to arrive at a combined 2017–2021 estimate of $18.6 billion. These estimates are
                               in 2017 dollars.
                               39According to FAA officials, while the NPIAS cost estimates are derived from airports’
                               plans, the estimate for AIP-eligible projects is a projection of airports’ needs, as not all
                               planned projects receive AIP funding.

                               Page 21                                                      GAO-20-298 Airport Infrastructure
A variety of factors may be contributing to the increase in FAA’s and ACI-
NA’s cost estimates, factors that we will discuss later in the report.
Overall, larger airports (large and medium hub) accounted for 75 percent
of the $22 billion annual cost estimate and make up a greater percentage
of the estimated increase in planned development costs when comparing
the fiscal years 2017 through 2021 and fiscal years 2019 through 2023
estimates. For example:
• Among planned AIP-eligible projects, estimated annual planned-
development costs increased from $1.4 to $1.7 billion (an 18 percent
increase) for large hub airports and from $641 to $735 million (a 15
percent increase) for medium hub airports, according to FAA’s cost
estimates. By comparison, estimated planned development costs for
small hub and non-hub airports decreased by 3 and 2 percent
respectively over the same time period.
• Among AIP-ineligible projects, ACI-NA estimates show that annual
planned development costs increased more significantly for medium
hub airports. Specifically, ACI-NA’s report shows that annual planned
development costs for AIP-ineligible projects increased by 22 percent
for large hub airports, 71 percent for medium hub airports, and 29
percent for small hub airports.
ACI-NA representatives stated that the increase in medium hub airport’s
planned development (for both AIP-eligible and AIP–ineligible projects) is
due to the underinvestment at medium hub airports in prior years.
Specifically, ACI-NA representatives stated that in response to the loss of
air service immediately following the 2007–2009 recession, some medium
hub airports scaled back their capital investments. ACI-NA
representatives stated that as passenger traffic has recovered with
economic growth, medium hub airports are now investing in previously
deferred improvements. According to ACI-NA’s report on airports’ capital
development needs for 2019–2023, medium hub airports–such as Austin-
Bergstrom International Airport (Austin airport), Norman Y. Mineta San
Jose International Airport, and Dallas Love Field Airport–are undertaking
major infrastructure improvement programs. According to officials from
Austin airport, the airport recently completed a 10-year plan for its capital
development program, with an estimated cost of $3.5 billion, for a new
terminal, concourse, airfield improvements, runway improvements, and
improved landside access. Austin airport officials stated that the airport is
20 years old and nearing the end of its lifecycle, and airport officials are
trying to manage aggressive growth while rebuilding the airport.
Page 22 GAO-20-298 Airport InfrastructureYou can also read