Autonomous adaptation to climate change by shrimp and catfish farmers in Vietnam's Mekong River delta - CORE
←
→
Page content transcription
If your browser does not render page correctly, please read the page content below
View metadata, citation and similar papers at core.ac.uk                         brought to you by   CORE
                                                                                 provided by Aquatic Commons

    Working Paper: 2012-24

     Autonomous adaptation to climate
     change by shrimp and catfish farmers
     in Vietnam’s Mekong River delta

    Suan Pheng Kam, Marie-Caroline Badjeck, Louise Teh, Lydia Teh, Nhuong Tran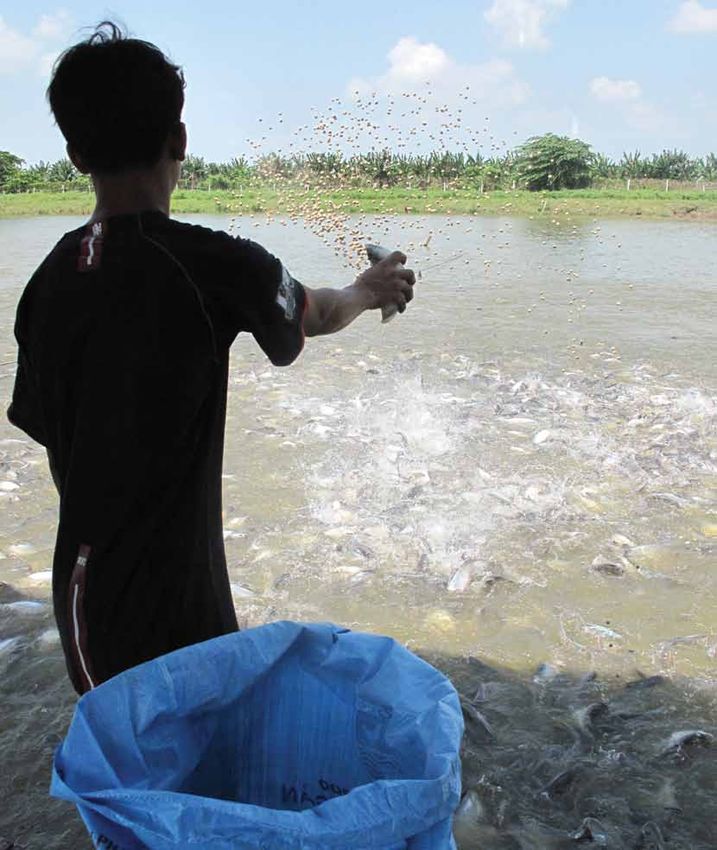
Working Paper: 2012-24

Autonomous adaptation to climate change by shrimp and
catfish farmers in Vietnam’s Mekong River delta

Authors                                                                      Acknowledgments:
Suan Pheng Kam1, Marie-Caroline Badjeck1, Louise Teh2, Lydia                 Le Xuan Sinh of Can Tho University, Vietnam, provided the base
Teh2, Nhuong Tran1                                                           production budgets for the catfish and shrimp grow-out farms
                                                                             and conducted the stakeholder consultations on past and
                                                                             expected changes to the production budgets due to climate
Affiliation                                                                  change and other impacts. Vo Thị Be Nam of the Sub-National
1
    WorldFish                                                                Institute for Agricultural Planning and Projection, Vietnam,
2
    Fisheries Centre, University of British Columbia                         provided the Geographic Information Systems (GIS) maps for the
                                                                             Mekong River delta, including land use and catfish ponds, and
                                                                             assisted in the GIS analysis. Nguyễn Xuân Hiền and Nguyễn Đình
Please cite this report as:                                                  Đạt from the Sub-Institute for Water Resources Planning, Ho Chi
Kam S.P, M-C. Badjeck, L. Teh, L. Teh and N. Tran. 2012. Autonomous          Minh City, provided mapped outputs of sea level rise impacts on
adaptation to climate change by shrimp and catfish farmers in                flooding and salinity intrusion in the Mekong River delta, and Chu
Vietnam’s Mekong River delta.                                                Thai Hoanh of the International Water Management Institute
                                                                             provided valuable insights on the hydrological implications of
                                                                             infrastructure development and climate change impacts in the
Disclaimer                                                                   delta. WorldFish colleague Michael Phillips provided important
The views expressed in this report are those of the authors and              information on the catfish and shrimp production parameters,
do not necessarily reflect the views of their respective institutions.       while Edward Allison, Christophe Bené and Froukje Kruijssen (also
While reasonable efforts have been made to ensure that the                   WorldFish colleagues) provided constructive feedback on the
contents of this publication are factually correct and properly              draft report. Robert Pomeroy (consultant to WorldFish) initiated
referenced, the authors do not warrant that the information in               the cost-benefit approach, while Benoit Laplante (World Bank
this report is free from errors or omissions.                                consultant) provided useful guidance for the economics study.
                                                                             Thân Thị Hien and Nguyen Thu Hue of the Centre for Marinelife
This working paper is derived from research done as a contribution           Conservation and Community Development, Vietnam, worked
to the World Bank case study, ‘Vietnam: Economics of Adaptation              with the Institute of Tropical Biology, Vietnam, to organize the
to Climate Change’ (World Bank 2010). A useful critique of elements          stakeholder workshop in Ho Chi Minh City in March 2010, where
of the aquaculture component (Kam et al. 2010) stimulated this               participants from various government institutions and local
more focused analysis of autonomous adaptation at the farm                   universities contributed valuable information and feedback.
level. The research was partially funded by the CGIAR research
program on Climate Change, Agriculture and Food Security
(CCAFS) and the UK Natural Environment Research Council Quest
thematic programme (QUEST-Fish).

                                                                         2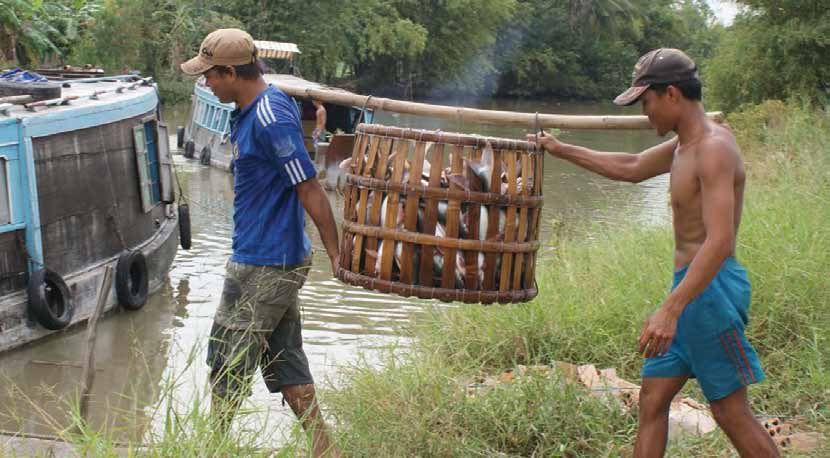
Table of Contents
Executive Summary                                                                                                         4

   1. Introduction                                                                                                        5

   2. Shrimp and catfish farming in the Mekong River delta of Vietnam                                                     6

   3. Assessment methods                                                                                                  7
      3.1 Identifying impacts of climate change                                                                           7
      3.2 Economic analysis of adaptation                                                                                 7

   4. Potential impacts of climate change on aquaculture in the Mekong River delta                                       11

   5. Costs of adaptation to climate change impacts                                                                      13
      5.1 Costs of autonomous adaptation at farm level                                                                   13
      5.2 Potential benefits from planned adaptation measures to prevent flooding and salinity intrusion                 15

   6. Estimated adaptation costs: policy implications in the Mekong River delta                                          17
      6.1 Farm-level autonomous adaptation                                                                               17
      6.2 Implications for planned adaptation                                                                            18

   7. The cost of climate change adaptation at the farm level: exploring approaches and setting research priorities      19
      7.1 Reflections on the assessment methods used                                                                     19
      7.2 Moving the methodological framework forward                                                                    20
      7.3 Knowledge gap and research priorities                                                                          20

References		                                                                                                             21

List of Tables
Table 1. Relative importance of environmental changes across production systems                                          13

Table 2. Base production budget for inland and coastal catfish farms                                                     13

Table 3. Base production budget for improved extensive and semi-intensive/intensive (SII) shrimp farms                   13

Table 4. Industry-level costs of autonomous adaptation for raising pond dikes and pumping water for catfish and
shrimp ponds, 2010–2020                                                                                                  16

Table 5. Economic importance of shrimp and catfish as export commodities for Vietnam                                     16

Table 6. Identified knowledge gaps and research priorities                                                               21

List of Figures
Figure 1. Land use in the Mekong River delta, 2007                                                                        6

Figure 2. Typology of impacts based on adaptation levels                                                                  8

Figure 3. Steps in the farm-level economic analysis of costs and benefits of autonomous adaptation                        8

Figure 4. Increment of maximum salinity intrusion (ppt) during the dry season for 50 cm sea level rise scenario          12

Figure 5. Increment of maximum flood level (m) during the rainy season for 50 cm sea level rise scenario, with
location of catfish farms                                                                                                12

Figure 6. Net farm income for catfish under climate change and no climate change scenarios for the next decade to 2020   14

Figure 7. Net farm income for black tiger shrimp under climate change and no climate change scenarios for the next
decade to 2020                                                                                                           14

Figure 8. Reduction in net farm income from catfish and shrimp farming due to climate change without adaptation          15

Figure 9. Autonomous adaptation cost for upgrading dikes of catfish and shrimp ponds at industry level for the
Mekong River delta, 2010–2020                                                                                            15

Figure 10. Autonomous adaptation costs for water pumping for catfish and shrimp ponds, 2010–2020                         15

                                                                       3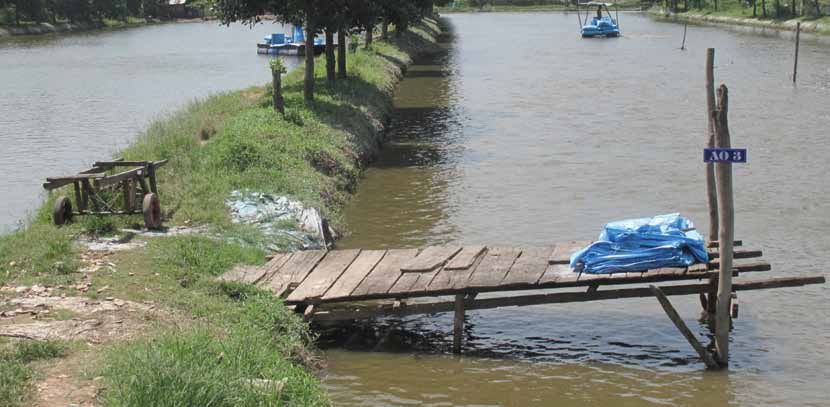
Intensive shrimp pond, Bac Lieu province, Mekong River delta, Vietnam

Executive Summary                                                          delta has increased more than fivefold over the last decade. If the
                                                                           industry is of sufficient economic importance nationally, then
The Mekong River delta of Vietnam supports a thriving                      adaptation plans for climate change in the Mekong River delta
aquaculture industry but is exposed to the impacts of climate              need to take into account the potential impacts on aquaculture
change. In particular, sea level rise and attendant increased              development trajectories in synergy with fisheries, land use and
flooding (both coastal and riverine) and coastal salinity                  aquaculture planning, and coastal protection. It is also important
intrusion threaten the long-term viability of this important               to recognize that adaptation to climate change cannot be divorced
industry. This working paper summarizes an analysis of the                 from the broader processes by which the sector reaches maturity
economics of aquaculture adaptation in the delta, focusing on              after a period of exceptional growth.
the grow-out of two exported aquaculture species—the
freshwater striped catfish and the brackish-water tiger shrimp.            If the industry is to continue to prosper, it will require changes
The analysis was conducted for four pond-based production                  in farming practices, marketing, investment and many
systems: catfish in the inland and coastal provinces and improved          other activities. It is therefore important to consider other
extensive and semi-intensive/intensive shrimp culture.                     investments—besides those related directly to adaptation—that
                                                                           are required to ensure that the aquaculture sector is able to
The approach taken was first to understand the potential impacts           respond to both a changing climate and a changing domestic
of climate change on these systems. Farm-level costs and benefits          economy and global market. While some of the specific costs
were then analyzed under scenarios of climate change with                  of climate change adaptation may be identified for analytical
autonomous adaptation, and with no climate change. The analysis            purposes, the reality will be one of continuous change in response
was done for two time periods, from 2010–2020 (where projections           to a wide variety of economic, physical and climatic factors in
of climate change impacts on input costs and price changes could           which the specific role of adaptations to a changing climate may
be made with relative confidence) and from 2021–2050 (where                be difficult to single out.
projections become more uncertain).
                                                                           Diversification into more ecologically sustainable and diversified
Results and policy implications                                            production systems will hedge the aquaculture industry against
The results suggest that shrimp farmers overall are able to bear           increasing risks to shrimp and catfish farming and the uncertainties
the cost of adaptation over a longer time frame than catfish               brought about by climate change.
farmers. Indeed, catfish farmers already operate at the brink of
economic viability, and climate change decreases even further              Critical issues when estimating costs of adaptation
their expected profitability. This conclusion suggests that major          This study, the first of its kind in the region, raises a number of
re-structuring of the industry is needed to reduce input costs or          methodological issues for more detailed economic assessments
transfer profit margins down the value chain to the producers. The         of climate change impacts and adaptation in the aquaculture
high level of capitalization and integration of the catfish industry       industry. These include the following:
could be an asset when designing adaptation strategies along the               1. Modeling of the impact of climate change on growth,
value chain and implementing adaptation cost-sharing                                 production and yield of cultured species is urgently
mechanisms among different actors in the value chain.                                needed to enable better estimation of projected farm
                                                                                     yields under different climate change scenarios and
The shrimp industry is more mature and less capitalized and so                       management responses.
will remain profitable for longer than catfish under a climate                 2. New thinking and approaches are needed to address the
change scenario. Despite its lower profitability compared with                       constraints of conventional economic analysis tools such
the semi-intensive/intensive system, improved extensive shrimp                       as cost-benefit analysis.
culture is more sustainable, both environmentally and                          3. An interdisciplinary approach, using qualitative and
economically, especially for small-scale farmers.                                    quantitative methods, is needed to better understand
                                                                                     farmer preferences, willingness and ability to adapt to
For both species, autonomous adaptation costs borne by farmers                       climate change.
can be reduced or offset by planned adaptation measures, such                  4. It is pertinent to extend the farm production-level
as construction of coastal and river dikes to control floods and                     analysis further along the value chain for a broader
intrusion of saline waters into the delta, while providing ancillary                 impact and adaptation assessment.
benefits to other economic sectors. On the other hand, complete                5. It is also pertinent to embed assessment of climate change
polderization of the delta would reduce opportunities for expanding                  impacts into a broader economic assessment of how the
brackish-water aquaculture. A more thorough integrated                               aquaculture sector might respond to a changing climate
assessment of the economics of planned adaptation is needed                          and a changing domestic economy and global market.
to examine trade-offs in costs and benefits of adaptation options              6. From a cross-sectoral perspective, it is imperative to
among sectors.                                                                       adopt a holistic land- and water-use planning approach
                                                                                     to explore synergies in adaptation and mitigation
The study raises policy issues that need to be addressed                             strategies between coastal protection, agriculture,
regarding Vietnam’s aquaculture in an increasingly uncertain                         aquaculture and fisheries to derive greater co-benefits
future. The scale of the aquaculture sector in the Mekong River                      from these strategies.

                                                                       4
Catfish ponds, An Giang province, Mekong River delta, Vietnam

1. Introduction                                                             brackish-water tiger shrimp (Penaeus monodon) and the freshwater
                                                                            striped catfish (Pangasianodon hypophthalmus). The second
Aquaculture is one of the fastest-growing animal food-producing             objective is to discuss critical issues when undertaking economic
sectors in the world. In 2008, aquaculture accounted for 46%                analysis of adaptation options in aquaculture and the research
of the global food-fish supply, and per capita supply from                  gaps that need to be filled in order to support follow-up studies
aquaculture increased from 0.7 kg in 1970 to 7.8 kg in 2008, an             on the economic impact of and adaptation to climate change.
average annual growth rate of 6.6% (FAO 2010). In developing
countries, the sector contributes significantly to livelihoods                Box 1. Autonomous and planned adaptation.
and food security, especially in the Asia-Pacific region. In 2006,
developing countries accounted for the majority of aquaculture                Autonomous adaptation does not constitute a conscious
production, with the Asia-Pacific region alone accounting for                 response to climatic stimuli but is triggered by ecological
almost 90% of total aquaculture production (FAO 2009). The                    changes in natural systems and by market or welfare
Asia-Pacific region has been identified as one of the most                    changes in human systems. It is when actors respond
vulnerable to climate change, and the potential impacts of                    ‘spontaneously’ to climate change. In aquatic agricultural
climate change will pose significant challenges to aquaculture                systems, autonomous adaptation can include changes
productivity and dependent livelihoods in the region. Adaptation              in cultivation type and timing or changes in irrigation
is urgently needed to foster the resilience of this dynamic sector.           schemes, for example.

Adaptive strategies can take the form of either processes, actions            Planned (policy-driven) adaptation is the result of a
or outcomes in order to better adjust to, cope with and manage                deliberate policy decision to respond to climate change in
changing conditions (Smit and Wandel 2006). Adaptation                        order to return to, maintain or achieve a desired state and
mechanisms can be differentiated along several dimensions:                    can help reduce or offset the impacts of climate change.
by the purposefulness of adaptation (whether the adaptation                   While actors at the farm level can make informed and
                                                                              deliberate decisions, unless these strategies are the
is planned or unplanned), by the timing of implementation, by
                                                                              outcome of a plan by a public agency or government, these
spatial and temporal scale, by sector of activity, or by which actors
                                                                              decisions are considered autonomous. Examples of planned
are designing and implementing the mechanisms (Adger et al.
                                                                              adaptation would be government investment in research
2007; Smit et al. 1999). However, merely identifying a suite of
                                                                              on salinity-resistant crops, changes in land allocation and
potential adaptation options will not be a sufficient basis for
                                                                              reforestation policies, subsidies at the farm level for dike
decision making. Better estimates of the benefits and costs of
                                                                              construction, or major infrastructure investment such as
adaptation interventions are needed to guide design and
                                                                              in sea defenses.
prioritization at the policy level (Heltberg et al. 2009). This study
focuses on autonomous adaptation at the farm level and draws                                   Source: Adapted from EEA (2007); IPCC (2001).
implications for planned adaptation to address farm-level issues.
We define autonomous adaptation and planned adaptation in                   The working paper begins by characterizing the shrimp- and
Box 1. While households have already responded to localized                 catfish-farming industry in Vietnam in section 2. Section 3
manifestations of climate variability and emerging climate risks,           describes assessment methods and an analysis of the potential
governments can play a role in enhancing the adaptive capacity              impacts of climate change on aquaculture in the Mekong
of farmers.                                                                 River delta. The identification of potential impacts on the four
                                                                            production systems and their implications for farm operations,
The first objective of this paper is to present an economic analysis        identified in section 4, are used to formulate adaptation options.
of the direct costs of implementing a series of adaptation options          In section 5, the estimated costs of autonomous adaptation at
at the farm level for the aquaculture sector in Vietnam. This is the        the farm level are presented. The policy implications of the results
first study that quantitatively explores the costs of adapting              for Vietnam, as well as a discussion of the assessment methods
aquaculture to climate change in the Vietnam Mekong River                   and identification of further research priorities, are discussed in
delta for the two main export-oriented species, namely the                  sections 6 and 7.

                                                                        5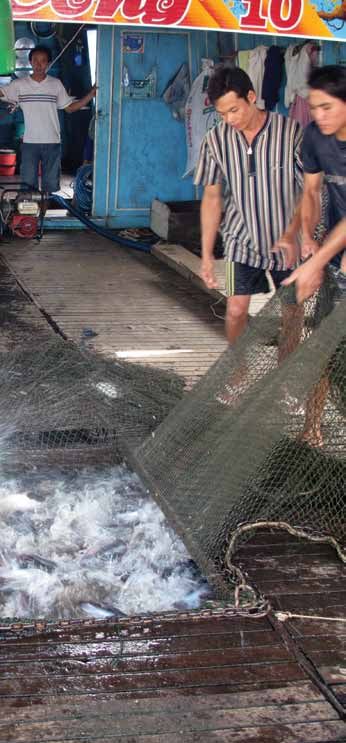
2. Shrimp and catfish farming in the Mekong                                             freshwater regime of the inland provinces (Figure 1). Culture of
   River delta of Vietnam                                                               catfish started with Pangasius bocourti (‘Cá Ba Sa’ in Vietnamese) in
                                                                                        the 1960s using floating cages, but has since been almost
The Mekong River delta of Vietnam supports a thriving                                   completely taken over by culture of the export-oriented striped
aquaculture industry. Its coast and extensive floodplain have                           catfish (‘Cá Tra’) in earthen ponds sited adjacent to rivers to permit
been modified by an intricate system of canals, embankments                             a high level of water exchange. Since 2002, with relaxation of
and water-control structures to provide a mosaic of freshwater,                         land zoning for catfish production, farms have expanded from
brackish-water and marine environments that accommodate                                 the inland provinces towards the coast—as far downstream as
diverse aquaculture systems producing a variety of fish, shrimp                         the water salinity conditions are tolerable to the riverine
and mollusk species. The aquaculture industry in the delta is                           catfish—taking advantage of the stronger tidal movement to
dominated by pond culture of shrimp (mainly the black tiger                             lower water-pumping costs.
shrimp, Penaeus monodon) and the striped catfish (Pangasianodon
hypophthalmus). The delta accounted for about 80% of the                                Extensive shrimp grow-out takes place in large coastal ponds
country’s total shrimp production in 2008 and has also increased                        relying upon tidal water exchange. These farms are stocked from
its share of the country’s cultured fish production from 67% in                         hatcheries and use limited amounts of fertilizer and artificial
2005 to an estimated 76% in 2008, mainly due to the expansion                           feed to promote the natural growth of organisms to feed the
of the catfish industry (GSO 2008). Pond culture of brackish-water                      shrimp; hence the production system is often recognized as the
shrimp accounts for 71% of the total aquaculture area, while                            “improved” extensive type. Semi-intensive or intensive grow-out
freshwater catfish culture dominates production, accounting for                         methods use smaller ponds and higher stocking rates, relying
47% of total aquaculture production in the delta (GSO 2008).                            upon water pumps and aeration to maintain water quality and
                                                                                        making use of a variety of formulated feedstuffs. The black tiger
The spatial distribution of cultured shrimp and fish production                         shrimp is still the dominant species cultured in the delta, although
in the delta reflects the geographical separation between the                           the recent introduction of the Pacific white leg shrimp (Litopenaeus
brackish-water environment of the coastal provinces and the                             vannamei) has seen increased production of this species.

                                                                            Legend
                                                           Shrimp pond                  Mangrove

                                                           Fish pond                    Other forest

                                                           Mangrove + shrimp pond       Human settlement

                                                           Rice-aquaculture             Other use

                                                           Irrigated rice               Salt pan

                                                           Rainfed rice                 Tidal mudflat

                                                           Upland crop                  River

                                                                                        Province boundaries

Figure 1. Land use in the Mekong River delta, 2007.
Source: The Sub-National Institute for Agricultural Planning and Projection (Sub-NIAPP), Vietnam.

                                                                                    6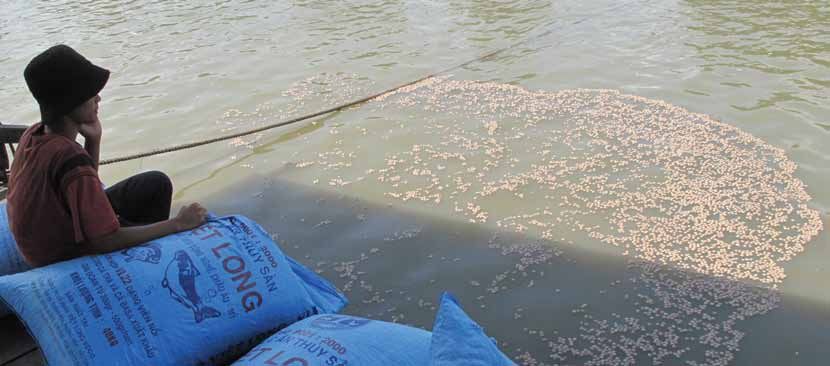
The export-oriented aquaculture industry in the Southeast Asian             physiological, biological and ecological responses of farmed
region, including Vietnam, is highly dynamic, volatile, and subject         species. Exposure related to the main climate and climate-related
to economic boom and bust (Szuster 2003). It is constantly                  drivers triggering these responses, such as weather changes, sea
subjected to global fluctuations in demand (and hence price) and            level rise and storm surges. In this study, estimates of the extent
international pressure on product quality, production standards             of aquaculture area affected by salinity intrusion and tidal and
and food safety regulations. Vietnamese producers, as well as the           riverine flooding are used as specific measures of exposure.
government, are highly market-responsive and adapt quickly to
changing situations. Climate change impacts constitute an                   Increases in salinity intrusion and flooding in the Mekong River
additional driver of change to which they have to adapt. Because            delta have been modeled by the Sub-Institute for Water Resources
most aquaculture systems are situated in riverine and coastal               Planning (SIWRP) using the Vietnam River Systems and Plain
environments, they are highly exposed and vulnerable to the                 (VRSAP) hydraulic and salinity model, which simulates water flow
impacts of climate change—not only the direct climatic                      through the complex network of canals and the salinity control
parameters, such as temperature and rainfall patterns, but                  system (stretches of embankments with water-control sluices to
particularly sea level rise and consequent flooding and coastal             protect areas from seawater intrusion) that already exist in many
salinity intrusion. Any increase in the intensity and frequency of          parts of the delta (SIWRP 2009). We did a Geographic Information
extreme climatic events such as storms may affect aquaculture               Systems (GIS) overlay of the VRSAP results for a 50 cm sea level rise
production by damaging production assets and transportation                 (SLR) scenario (provided by SIWRP) with the 2007 land use
infrastructure required for access to markets. These impacts will           map for the delta (provided by the Sub-National Institute of
have significant economic as well as livelihood and social costs to         Agricultural Planning and Projection) to estimate shrimp and
those dependent on the aquaculture industry.                                catfish areas that will be affected by increments of maximum
                                                                            salinity during the dry season and maximum flooding during the
This study focuses on the shrimp and catfish industries, which              rainy season.
are the dominant sectors in both production volume and value.
For catfish, the analysis focused on the pond culture system, as            3.2 Economic analysis of adaptation
about 95% of the catfish are now cultured in ponds. For shrimp,             Conceptually, the traditional approach to economic analysis of
the focus was on the black tiger shrimp as the dominant species.            adaptation to climate change involves three steps (Boyd and Hunt
Four shrimp-farming systems exist in the Mekong delta (Lam and              2006). The first step is to establish the projected baseline with
An 2008):                                                                   no planned adaptation (1: Future Society, Climate Today). Next,
    • Improved extensive shrimp farming: Stocking with lower                estimates are made of the impact of climate change with no
       density of P. monodon juveniles, typically 1–5 post-larvae           adaptation (2: Future Society, Future Climate). Lastly, an estimation
       (PL) m-2, with resulting yields of 300–500 kg ha-1 crop-1.            is made of the change in climate risks from implementing
       This system is more popular in the coastal provinces.                adaptation policies and measures (3: Adapted Future Society,
    • Semi-intensive shrimp farming: P. monodon seed stocked at             Future Climate). The impact of climate change on a production
       higher density, typically 10–20 PL m-2, with resulting yields        system is estimated as the difference between a world with
       of 1,500–2,000 kg ha-1 crop-1.                                       climate change and no adaptation (2), and the projected baseline
    • Intensive shrimp farming: P. monodon cultured at densities            (1). The effects of adaptation are taken as the difference between
       of 20–40 PL m-2, resulting in yields of 4–9 t ha-1 crop-1. The       a world with climate change and no adaptation (2), and a world
       semi-intensive and intensive systems are concentrated in             with climate change and adaptation (3).
       Soc Trang, Ben Tre and Tra Vinh provinces.
    • Mixed shrimp farming-mangrove forest: Shrimp culture is               This traditional approach has merit, but its practical usefulness
       fully reliant on natural seed and food chains; yields are            has been challenged. First, it is sometimes difficult to distinguish
       typically 200–350 kg ha-1 year-1. This system is                     between impacts of and adaptation to climate change (EEA 2007).
       concentrated in Ca Mau, Ben Tre, Kien Giang and Tra                  For instance, land abandonment due to sea level rise could, and
       Vinh provinces.                                                      often is, regarded as an impact, but it can also be a seen as a
                                                                            response to climate change (EEA 2007). Second, the focus is on
Farming striped catfish in ponds is carried out at intensive scale,         planned adaptation without sufficient consideration of the costs
with stocking densities of 20–40 fingerlings m-2, with resulting            of autonomous adaptation occurring at the farm level. Farmers
yields of 150–400 t ha-1 (Lam and An 2008).                                 will, and do, respond to changes in land and water availability,
                                                                            commodity prices, market incentives and climate variability by
Based on the shrimp and striped catfish industry review above,              using different levels and combinations of inputs, altering culture
four production systems were selected for analysis—two for                  species and production systems, adjusting the height of pond
catfish and two for shrimp:                                                 dikes, and increasing water volumes pumped into ponds. All of
    • Catfish (I) – pond culture of striped catfish in the inland           these constitute autonomous adaptation, where actors respond
       provinces of An Giang, Dong Thap, Can Tho and Vinh Long;             ‘spontaneously’ to climate change (Adger et al. 2007) and incur
    • Catfish (C) – pond culture of striped catfish in the coastal          incremental capital investment at the farm level. Ignoring
       provinces of Soc Trang and Ben Tre;                                  autonomous adaptation can lead to a serious overestimation of
    • Shrimp (Ext) – black tiger shrimp cultured at improved                the impacts of climate change (Tol et al. 1998).
       extensive scale, mainly in Ca Mau and Bac Lieu provinces;
       and                                                                  The ‘dumb farmer’ hypothesis is often used to represent the
    • Shrimp (SII) – black tiger shrimp cultured at semi-intensive/         assumption that an impacted agent does not anticipate or
       intensive scale in most other coastal provinces.                     respond to changed climate conditions but will continue to act as
                                                                            if nothing has changed. In contrast, it has been argued that most
                                                                            farmers are not completely oblivious but actually do adjust their
3. Assessment methods                                                       practices in response to persistent climate changes (the ‘typical
3.1 Identifying impacts of climate change                                   farmer’); some use available information on expected climate
We used a combination of qualitative and quantitative methods               conditions to proactively adapt to climate change (the ‘smart
to assess potential bio-physical impacts of climate change on               farmer’), and still others claim perfect knowledge of future climate
aquaculture. Reviews of the literature and secondary data,                  conditions and face no impediments to the implementation of
combined with consultations with local experts and stakeholders,            adaptation measures (the ‘clairvoyant farmer’) (Fussel and Klein
provided information to determine exposure, sensitivity and                 2002). This typology is represented in Figure 2 against different
potential adaptation options. Sensitivity related mainly to the             interpretations of the term ‘impact’.

                                                                        7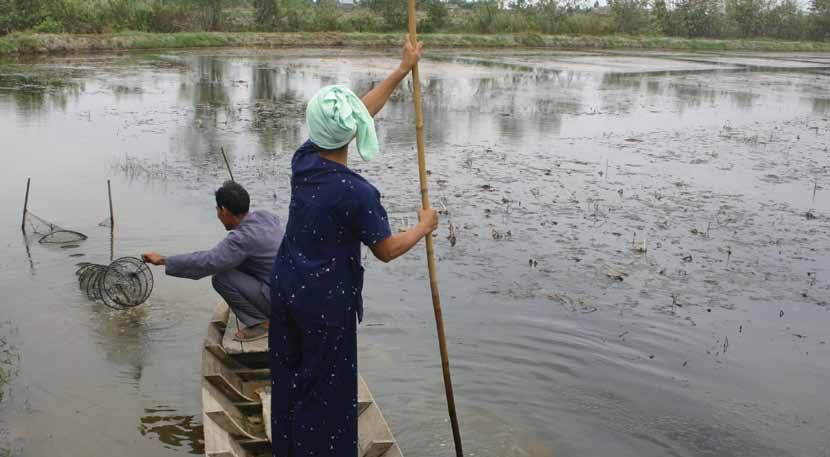
“Dumb farmer”:              Changing climate, no adaptation
                                           x        “Typical farmer”:           Changing climate, autonomous adaptation
                                                    “Smart farmer”:             Changing climate, feasible adaptation
                                                    “Clairvoyant farmer”:       Changing climate, unrealistic adapatation
                                                    “Reference case”:           Unchanged climate

                            high

                                                                                                                Potential impacts
                                                                                                                (assuming no adapatation)

                                                                                               x      x           Expected impacts
                                                                                      x
                   Level of impacts

                                                                                                                  (assum. autonomous adapt.)
                                                                            x
                                                                                                                    Avoidable impacts
                                                                x                                                   (through planned adapt.)
                                                        x                                                           Residual impacts
                                                                                                                    (assuming automous
                                                x                                                                    and planned adapt.)
                                                                                                                      Theoretically
                                                                                                                      avoidable impacts
                                                                                                                      (through perfect adapt.)
                                                                                                                      Unavoidable impacts

                                low
                                      present                                                      future
                                                                       Time
Figure 2. Typology of impacts based on adaptation levels.
Source: Adapted from Fussel and Klein (2002).

3.2.1 Costs and benefits of farm-level autonomous adaptation                                   brackish-water shrimp in the Mekong River delta under climate
In this study, we considered Vietnamese fish farmers as ‘typical                               change with autonomous adaptation (CC) and non-climate
farmers’ and calculated the expected impacts of climate change                                 change (NCC) scenarios for the 2010–2050 period. CBA is a
assuming autonomous adaptation. This means that the cost                                       conventional bottom-up economic approach for estimating
of climate change on aquaculture production at the farm level                                  impact and adaptation costs in climate change research and was
includes the cost of autonomous adaptation. The approach                                       chosen because it can rely on farm budget data. The main steps in
taken in the economic evaluation was first to conduct farm-level                               the economic analysis at farm level are shown in Figure 3.
cost-benefit analysis (CBA) for freshwater catfish and

                                                                           Step 1. Farm-level costs
                                                                    and earnings for 4 production systems
                                                                             (2 catfish, 2 shrimp)

                                                                         Step 2. Expert elicitation:
                                                             change in last 10 years, perceptions for the next
                                                            10 years and attribution to climate change impacts

                                                            Step 3. Direct costs + autonomous adaptation costs,
                                                               and benefits, at farm level for the next 10 years,
                                                                             and beyond to 2050

Figure 3. Steps in the farm-level economic analysis of costs and benefits of autonomous adaptation.

The farm-level analysis assessed the net benefits from shrimp and                              staff (who also operate their own shrimp and catfish farms),
catfish farming grow-out operations. In Step 1, base production                                and local university researchers specializing in aquaculture. The
budgets for catfish and shrimp operations in the Mekong delta                                  respondents were asked for their perceptions of changes over
derived from a previous study (Sinh 2008) were compiled to                                     the last 10 years in farming shrimp and catfish, and the reasons for
estimate the current (2010) costs and benefits to farm operations.                             these changes. The focus was on variable inputs, such as land price,
The data used represent means among farms (131 inland catfish                                  feed use (application rate, price) and seed use (rate, price). The
farms, 60 coastal catfish farms, 50 extensive/improved extensive                               reasons given for the changes were grouped into four categories:
shrimp farms, and 50 intensive/semi-intensive shrimp farms)                                    technical, market, pond environment and climate change,
surveyed in the delta in 2008.                                                                 including climate variability. The respondents were asked to
                                                                                               estimate the relative contributions they attributed to each of these
In Step 2, interviews were conducted with 13 stakeholders                                      four categories. The perceptions of the respondents were also
comprising shrimp and catfish farmers, provincial aquaculture                                  elicited on how the changes in the variable inputs over the

                                                                                           8
Pelleted feed for catfish, An Giang province, Mekong River delta, Vietnam

past 10 years were foreseen to differ in the next 10 years (i.e.,             Fixed costs
2010–2020), both in terms of the magnitude and direction of                   Fixed costs consisted of depreciation of ponds, depreciation of
changes. On this basis, these percentages were applied to current             machinery and land taxes. Note that the production budget
(2010) input costs and prices to derive projected values (in real             provided costs in terms of VND ha-1 crop-1. These figures were
terms) for the next decade to 2020. We assumed costs and prices               multiplied by the mean number of crops year-1 for each type of
changed linearly in between the anchor years of 2010 and 2020.                farming system to provide costs expressed in VND ha-1 year-1. Total
                                                                              fixed costs were adjusted to 2020 levels depending on the expected
In Step 3, cost-benefit analysis was applied to farm-level                    increase—doubling by 2020 for extensive shrimp, coastal catfish
production systems. Benefits from farm operations were                        and inland catfish, and tripling for semi-intensive/intensive
measured by gross income while considering fixed and variable                 shrimp. Costs were linearly extrapolated from 2021 to 2050 based
costs. Under the climate change (CC) scenario, the full value of              on the average of the annual rate of change from 2010 to 2020.
input costs was used. For the no climate change (NCC) scenario,
the percentages of costs due to climate change were omitted. As               Variable costs
there was no information on expected changes beyond 2020, a                   Variable costs consisted of feed, dike upgrading, pond preparation,
linear extrapolation was used for the period 2021 to 2050, based              seed, chemicals and drugs, fuel and electricity, harvest and
on the average annual rates of change from 2010–2020.                         transportation, labour, interest on loans, and miscellaneous items.

The method and assumptions used in estimating the different                   Feed cost
components of benefits and costs in Step 3 are outlined below.                Feed cost (Cfeed ) was calculated as Cfeed = Yi x FCR x Pfeed ,
                                                                              where FCR is the feed conversion ratio (quantity of feed
Gross income                                                                  required per tonne of fish or shrimp yield), and Pfeed is the price
Gross income (GR) was calculated as GR = Yi x Pi ,                            of feed (VND t-1). The 2010 FCRs for shrimp and fish were
                                                                              linearly increased or decreased to the 2020 level. FCR for
where Yi is yield (t ha-1) and Pi is farm-gate price of fish or shrimp;       extensive shrimp was expected to decline by an average of 10%,
i = extensive shrimp, semi-intensive/intensive shrimp, coastal                while for SII shrimp, inland catfish and coastal catfish FCRs were
                                                                              expected to decline by an average of 5% by 2020. We assumed
catfish and inland catfish.                                                   that FCR levels remained constant from 2021 to 2050. All shrimp
                                                                              and catfish feed prices were expected to increase in the range of
Yield: Current yield (2010) was based on information from Sinh                1.5 to 2.5 times by 2020. We assumed a linear increase from 2010
(2008) and stakeholder interviews. Depending on the responses                 to 2020 prices, and applied the same magnitude of increase from
of stakeholders, the 2010 yield was linearly increased or                     2010 to 2020 to projected prices from 2021 to 2050.
decreased to the 2020 level. To extrapolate from 2021 to 2050,
the mean annual change (%) from 2010–2020 was applied from                    Dike upgrading
2021 onwards.                                                                 Two aspects of pond dike upgrading were considered. For ponds
                                                                              in areas not impacted by increased flooding due to sea level rise
Price: The current price of catfish and shrimp was assumed to be              or its associated impact, river flooding in the wet season, the cost
VND 17,000 kg-1 (the prevailing currency exchange rate at the                 of dike upgrading pertains to routine maintenance without need
time of study was VND 19,000 to the USD) and VND 100,300 kg-1,                for raising the pond dike. The cost for routine dike maintenance
respectively. Based on the opinions of stakeholders and                       was provided in terms of area (VND ha-1) from the field interviews
aquaculture experts, who took into consideration the history and              and adjusted after consultation with local researchers. The cost
relative stability of the catfish and shrimp markets, the price of            was expected to increase by 67% for both catfish systems, 17%
catfish was assumed to increase 35% between 2010 and 2020 (3%                 for extensive shrimp and 75% for semi-intensive shrimp over 10
p. a.). Given that catfish is a growing market, it was assumed that           years. Costs between 2010 and 2020 were linearly increased. The
catfish price would double from 2021 to 2050 (2.3% p. a.). Shrimp             average of the annual rates of change in cost from 2010 to 2020
prices were expected to increase by a mean of 15% between 2010                was then used to extrapolate for the period 2021 to 2050.
and 2020 (1.4% p. a.). As shrimp is considered to be a more stable
market than catfish, it was assumed that shrimp price would                   For ponds in areas expected to be impacted by increased flooding,
increase at the same rate of 1.4% per annum from 2021 to 2050.                the per hectare costs of raising the height of pond dikes (Cdike_j)

                                                                          9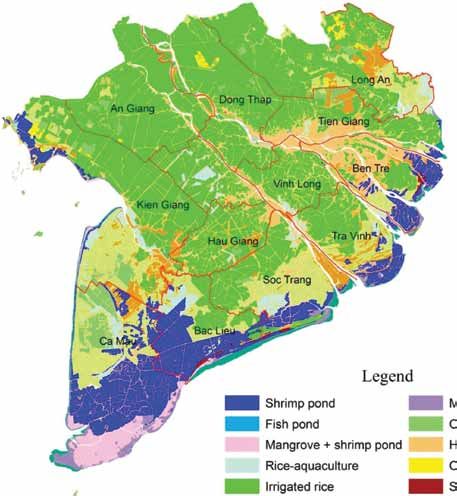
for incremental height increases of j metre (j = 0, 0.5, 1.0, ...) were        2020 and 2050 were linearly increased and so assumed a linear
provided by field interviews and added to the cost for routine                 relationship between yield and the amount of chemicals and
dike maintenance.                                                              drugs required. Chemical and drug costs for shrimp were
                                                                               estimated per unit area (VND ha-1) and were expected to increase
Seed cost                                                                      on average 2.5 times for extensive shrimp and to double for
Seed cost (Cseed) was calculated as Cseed = SD x Pseed ,                       semi-intensive shrimp by 2020. To extrapolate chemical and
                                                                               drug costs from 2021 to 2050, the average of the annual rates of
where SD is the stocking density, given in the number of shrimp
                                                                               change in cost from 2010 to 2020 was applied to each year from
post-larvae ha-1 or number of fish ha-1, and Pseed is the price of seed
                                                                               2021 onwards.
(VND piece-1). Stocking density was expected to decrease for SII
shrimp and inland catfish by 2020, while no change was expected
                                                                               Pond preparation
for coastal catfish and extensive shrimp. A price of VND 663
                                                                               Cost for pond preparation was estimated per area (VND ha-1)
piece-1 was used for catfish (Phuong et al. 2007). By 2020, seed
                                                                               and was expected to increase on average 20% for both catfish
prices were expected to decrease by an average of 25% and 20%
                                                                               systems, 35% for extensive shrimp, and 2.5 times for semi-intensive
for SII and extensive shrimp, respectively, while prices for coastal
                                                                               shrimp. Costs in between 2010 and 2020 were linearly increased.
and inland catfish were expected to increase by an average of
                                                                               The average of the annual rates of change in cost from 2010 to
50% and 10%, respectively. To extrapolate seed cost from 2020 to
                                                                               2020 was then applied to extrapolate for the period 2021 to 2050.
2050, the average annual rates of change in seed cost from 2010
to 2020 were applied to each year from 2021 onwards.
                                                                               Fuel and electricity, labour, harvest and transportation, interest
                                                                               on loans, and miscellaneous items
                                                                               For this group of inputs, the 2010 costs were used for both catfish
                                                                               and shrimp. As with fixed costs, the production budget figures
                                                                               were estimated in terms of VND ha-1 crop-1 and were converted to
                                                                               VND ha-1 year-1. For each input, rates of change from 2010 to 2020
                                                                               are outlined below. To extrapolate from 2021 to 2050, the average
                                                                               of the annual rates of change in cost from 2010 to 2020 was
                                                                               applied to each year from 2021 onwards.

                                                                               Fuel and electricity: Costs were assumed to increase by 10% by
                                                                               2020 for extensive shrimp, and 20% for semi-intensive shrimp and
                                                                               both catfish systems. For coastal catfish, adjustments were made
                                                                               for increases in fuel and electricity costs under the ‘with CC’
                                                                               scenario to account for increased pumping of water into the
                                                                               ponds when increased water salinity at high tide will offset the
                                                                               advantage of using the tidal fluctuation to save on pumping
                                                                               costs. It was assumed that the fuel and electricity cost for the
                                                                               coastal catfish system would increase to 67% of that for the
                                                                               inland catfish system by 2020, and equal that for the inland
                                                                               catfish system by 2050.

                                                                               Labor: This was expected to increase on average 75% by 2020
                                                                               for extensive shrimp and inland catfish, 125% for SII shrimp, and
                                                                               100% for coastal catfish.

                                                                               Harvest and transportation, interest on loans, miscellaneous
                                                                               items: No stakeholder information on expected changes to these
                                                                               costs was available. It was therefore assumed that harvest and
                                                                               transportation and miscellaneous costs from 2010 to 2050 would
                                                                               increase by the annual inflation rate. Data on the annual
                                                                               percentage change in inflation for Vietnam from 2010 to
                                                                               2014 was available from the IMF World Economic Outlook
                                                                               Database.1 The average of the annual rate change from 2010
                                                                               to 2014 (7%) was applied for the period 2015 to 2020. It was
                                                                               assumed that interest on loans would increase by 2.5% from
                                                                               2010 to 2020. This is a conservative estimate given recent rises
    Pumping water from the Mekong River for catfish ponds                      in commercial interest rates.2

                                                                               In calculating the net benefits from shrimp and catfish grow-out
                                                                               operations, all costs and prices were treated in nominal terms. The
                                                                               flow of yearly net benefits was discounted by a real discount rate
Chemicals and drugs
                                                                               (nominal market discount rate minus inflation rate) and summed
Cost of chemicals and drugs (Ccd) for catfish was calculated as
                                                                               up to provide the net present value (NPV) of shrimp and catfish
Ccd = Yi x Pcd ,
                                                                               farming under CC and NCC scenarios. Based on the commercial
where Pcd is the price of chemicals and drugs per tonne of fish                bank prime lending rate for Vietnam of 13% per annum for 20103
(VND t-1). Pcd was expected to increase by an average of 2.25 times            and an inflation rate of 7% per annum,4 an annual real discount
from 2010 to 2020, after which it was assumed to increase by 50%               rate of 6% was used for discounting the flows of future costs and
from 2021 to 2050. The prices in between the anchor years of                   benefits.
1
  Source: http://www.imf.org/external/pubs/ft/weo/2012/01/weodata/index.aspx.
2
  Source: Vietnam Business Forum, www.vibforum.vcci.com.vn.
3
  Source: CIA – The World Factbook: Vietnam. https://www.cia.gov/library/publications/the-world-factbook/geos/vm.html (accessed 10 March 2010).
4
  Source: World Economic Outlook Database Oct 2009 report (downloaded from IMF website 10 March 2010).

                                                                          10
3.2.2 Offsetting autonomous adaptation costs with planned
adaptation measures
While there will be substantial autonomous adaptation at the
farm level, farmers could benefit from planned adaptation
measures such as external support to increase resilience. We
illustrate the consideration of benefits to the aquaculture sector
due to planned adaptation measures by determining the extent
that costs of farmers’ autonomous adaptation could be offset
by specific public adaptation actions. We use the case of public
investment in constructing river dikes to prevent inland river
flooding and sea dikes to prevent tidal intrusion as an example
whereby a planned adaptation measure can offset on-farm costs
of upgrading dikes and increased costs in electricity and fuel in
response to CC-related impacts of increased flooding and salinity
intrusion. We then consider that any public investment aimed at
reducing salinity intrusion and flooding in the Mekong River delta
that matches these costs is likely to benefit the aquaculture sector Sampling catfish from pond, An Giang province
by reducing or offsetting the costs that farmers would have to
bear for autonomous adaptation.
We limited the industry-level analysis to the 2010–2020 period as
increases are projected to be more rapid, reaching 1.4°C, 2.0°C
projected production area estimates were available only until 2020.
and 2.6°C respectively for the three Intergovernmental Panel on
Pond dikes were assumed to be raised in stages as flood waters
Climate Change (IPCC) B1, B2 and A2 Special Report on Emissions
increase in depth as a result of gradual sea level rise. The years in
Scenarios (SRES). The increases in air temperature would be within
which dikes were expected to reach different heights, and hence
the tolerance range of the main cultured species, which is 29.8
additional costs for raising dikes would take effect, were set on
± 1.0°C for shrimp (Duong 2006) and 28–30°C for river catfish
the assumption of a linear increment of flooding depth with
(Hargreaves and Tucker 2003). The main effect of temperature rise
incremental sea level rise over the 2010–2020 period. The
is increased metabolic rate, which may enhance growth rates
industry-level cost incurred by farmers to raise pond dikes in
provided that feeding is correspondingly increased, hence incurring
response to incremental increases in flooding depth was calculated
higher cost but reduced time to grow to the preferred size.
for each year as follows:
∑ ΔAimpact_j x Cdike_j , Higher air and water temperatures may lead to higher organic
decomposition rates, which may lead to fouling of the water,
where ΔAimpact_j is the annual incremental production area particularly in closed-culture systems such as ponds. Decreased
impacted by flooding and Cdike_j is the per-hectare cost of raising dissolved oxygen may require more aeration, particularly in
intensive culture of shrimp, which is more sensitive to reduced
dikes for incremental height increases of j metre (j = 0, 0.5, 1.0, oxygenation than catfish. River catfish can better tolerate poor water
...). The total current production area that would be impacted by quality, including high organic matter or low dissolved oxygen
flooding (Aimpact) and the proportions of pond area subjected to levels. Farmers may increase aeration of pond water, but this
different dike height increases were estimated from GIS overlay would incur additional electricity and fuel costs, especially if water
of shrimp and catfish aquaculture maps with the SIWRP maps exchange is done through pumping. Energy-efficient water
of maximum flooding depth for the 50 cm SLR scenario. We aeration, re-circulation systems, increased use of tidal flow and
estimated the 2020 impacted areas for each production system new pond designs (depth, compaction) are other adaptation
by applying an ‘area ratio’ between the 2020 and 2010 projected options that have synergies with mitigation that farmers could
production areas provided by the Vietnam Ministry of Agriculture undertake. As pond size and volume become smaller during
and Rural Development (MARD 2009) and assumed an annual drought, best management practices that include reduced
linear increment of affected area over this 10-year period. feeding and reducing the number of operational ponds might
be useful adaptation options.
In a similar manner, the industry-level cost incurred by farmers
on additional electricity and fuel use associated with pumping Annual rainfall in the Mekong River delta is projected to increase
freshwater into the ponds in response to incremental increases in by 0.7% to 1.7% by 2050 and by 1.0% to 4.1% by 2100 (MONRE
water salinity was calculated for each year as follows: 2009). The dry seasons, during March–May, are projected to get
Aimpact x Celecfuel , drier. Projected reductions in rainfall during the dry season due to
where Aimpact is the annual incremental production area climate change would be in the range of -7.1% to -9.1% by 2050
impacted by increased salinity and Celecfuel is the per-hectare and -9.3% to -22.2% by 2100. The wet seasons are projected to get
additional electricity and fuel cost for water pumping. The wetter, with rainfall in June–August increasing 0.1% to 2.1% by
per-hectare costs for electricity and fuel were based on local 2050 and 0.2% to 5.0% by 2100. Disease outbreaks in catfish
knowledge, while GIS overlay of shrimp and catfish aquaculture typically occur at the start of the rainy season and the end of
maps with the SIWRP maps of maximum water salinity for the the flood season (Poulsen et al. 2008) and could increase under
50 cm SLR scenario provided estimates of pond areas affected by a scenario of ‘wetter wet seasons,’ leading to an increased use of
increments in salinity due to sea level rise. antibiotics.
In general, the effects of projected changes in localized rainfall
4. Potential impacts of climate change on on water availability for aquaculture ponds are not likely to be as
significant as those of changes in sea level and upstream
aquaculture in the Mekong River delta hydropower development in the Mekong Basin. Aquaculture
According to the climate change scenarios officially released by ponds are dependent on freshwater supply from rivers and canals,
the Government of Vietnam for the seven ecological regions of rather than directly from rainfall. Projections of climate-related
the country (MONRE 2009), the southern region where the changes in mean annual flow in the Mekong River range from 5%
Mekong River delta is situated will experience temperature (Hoanh et al. 2003) to 20% (Eastham et al. 2008). In comparison,
increases of 0.4°C to 1.0°C from 2020–2050, beyond which 27 planned large hydropower projects in the Mekong are
11projected to increase dry season flows by 10–50% and decrease have been coping with these seasonal floods by raising the height
wet season flows by 6–16% (Hang and Lennaerts 2008). of pond dikes. The extensive areas of flooding in the coastal
provinces are expected to affect large areas of shrimp ponds,
Changes to the hydrological cycle accompanying global warming even though the water depths from increased flooding are
(both over the land and the sea) are expected to be the most generally lower than in the inland provinces.
significant aspect of climate change to affect the fisheries and
aquaculture sector. These include not only changes to air (and The increased water salinity, plus higher evaporation rates from
sea) temperatures and precipitation patterns, but also changes to ponds due to elevated air temperature, would also increase
sea levels and to monsoon and coastal extreme events, including pumping of freshwater into the ponds, hence incurring additional
frequency and magnitude of these climatic events. electricity and fuel costs in operating the aquaculture farms.
Figure 4 shows where increments in maximum water salinity
under the 50 cm sea level rise scenario are projected to occur
during the dry season, assuming no additions to current hydraulic
structures (SIWRP 2009). This will affect an estimated 224,600 ha
(or 55%) of the shrimp-farming area in the delta. Almost 80% of
this area experiences salinity increments of 2 ppt or less in the dry
season. Short-term increases in salinity would not directly affect
shrimp survival rates if kept within the range of 10–35 ppt, but the
tolerance range may be further limited by disease.5 For most of
the other parts of the delta that are already protected from salinity
intrusion by existing water control infrastructure, increments
in maximum salinity are relatively smaller, not exceeding 1 ppt.
Where catfish rearing has expanded towards the coast, in Vinh
Long and Ben Tre provinces, ponds may be exposed to slightly
higher salinity levels.
Catfish ponds, An Giang
Catfish ponds, Dong Thap
Catfish ponds, Can Tho
Increment of flood depth (m) with 50 cm SLRA summary of the relative importance of environmental the identification of the major farm operation costs related to
changes brought about by climate change impacts for the four adaptation responses that farmers would undertake.
aquaculture production systems being studied (Table 1) guided
Table 1. Relative importance of environmental changes across production systems.
Temperature rise Drier dry season Wetter wet Sea level rise: flooding Sea level rise
season salinity intrusion
High: due to tidal
Medium: may add
Low: catfish ponds Low: water supply Medium: increased ingress up the
Catfish – “coastal” to the impact of river
are deep, and there is through pumping water level due to SLR rivers in the dry
flooding
is considerable water from river; catfish season
mixing because of farms are located
continuous water very near to rivers High: will add to the Low: out of
High: due to deeper
Catfish – inland pumping and major canals impact of deep-river reach of salinity
river flooding
flooding intrusion
High: ponds are High: for areas not
relatively shallower, protected by sea dikes
Shrimp – improved
with large surface area High: increased and considering large
extensive
and limited circulation competition for Medium: pond size and longer
(aerators not used) perimeter High: particularly
freshwater supply additional water
in areas not
Medium to high: to counteract supply for ponds, but
protected from
depending on amount salinization of pond increase in wet season
salinity intrusion
Shrimp – semi- of organic debris and water due to salinity rainfall is minimal Medium: for areas not
intensive/intensive leftover feed that are intrusion protected by sea dikes
subject to
decomposition
5. Costs of adaptation to climate change impacts Table 3. Base production budget for improved extensive and
semi-intensive/intensive (SII) shrimp farms.
5.1 Costs of autonomous adaptation at farm level
Base production budgets from Sinh (2008) used for cost-benefit Input Inland Extensive
analysis of striped catfish and shrimp culture are presented in (VND million ha-1 crop-1) (N=50) (N=50)
Tables 2 and 3. Feed constitutes the largest cost in aquaculture
production, accounting for 82% and 84% of the variable costs for
inland and coastal catfish farms (Table 2) and 53% and 66% of Gross Income 431.1 65.9
variable costs for semi-intensive/intensive and improved extensive
shrimp farms (Table 3), respectively. Seed and bio-chemicals Total Costs 193.3 28.8
account for the next largest costs for both catfish and shrimp
production, with bio-chemicals taking up a high 11% of the Total Fixed Costs 13.53 2.94
variable costs in the semi-intensive/intensive shrimp system. - Depreciation of ponds 7.58 1.79
- Depreciation of machinery 4.6 0.85
Table 2. Base production budget for inland and coastal catfish farms. - Land taxes 1.35 0.30
Input Inland Coastal Total Variable Costs 179.77 25.86
(VND million ha-1 crop-1) (N=131) (N=62) - Pond preparation 8.09 2.2
- Seed 9.35 3.13
- Feed 119 13.7
Gross Income 4868.9 3738.1 - Chemical and drugs 21 1.88
- Dike upgrading 3.05 0.31
Total Costs 4616.8 3644.7 - Fuel and electricity 8.63 1.37
- Harvest and transportation 1.61 0.10
Total Fixed Costs 20.9 28.3 - Labour 6.11 1.45
- Depreciation of ponds 11.6 17.15 - Interest on loans 1.41 1.14
- Depreciation of machinery 7.17 8.15 - Miscellaneous 1.43 0.58
- Land taxes 2.13 3.0
Net Income 237.8 37.1
Total Variable Costs 4596.1 3616.4
- Pond preparation 23.6 27.2 Source: Sinh (2008).
- Seed 329.1 263.7
- Feed 3772.5 3051.2 On current trends, catfish farming faces an uncertain future if
- Chemical and drugs 205.4 152.4 gross revenues are not able to keep pace with the expected
- Dike upgrading 11 4.6 increase in input costs even in the absence of climate change
- Fuel and electricity 48.7 7.7 impacts. Only the most efficient and adaptable farmers will
- Harvest and transportation 28.8 25.4 survive such a squeeze on farming margins, which are currently in
- Labour 39.2 44.7 the range of 3% to 5%. The additional costs of adapting to climate
- Interest on loans 127.4 33.9 change will intensify this squeeze, hastening the onset of net
- Miscellaneous 10.4 5.6 losses. As suggested in Figure 6 for the 2010–2020 period, coastal
catfish farms are barely meeting their costs, with net income
Net Income 252.1 93.4 becoming negative within five years under the climate change
(CC) scenario. For the 2010–2020 period, the NPV is 104% higher
Source: Sinh (2008). under the NCC scenario. This means that for a coastal catfish
13farmer, responding to climate change results in a discounted improved extensive shrimp farming for 2010–2020 is positive
net income that is VND 4.7 billion ha-1 lower over the 2010–2020 under CC for 2010–2020. This means that responding to climate
period. Overall, the CBA shows that many coastal catfish farmers change leads to a discounted net income that is VND 51.6 million
may soon find it unprofitable to remain in the sector, and only ha-1 lower from 2010–2020.
those who can find innovative ways to substantially reduce their
input costs will be able to survive in the long term. For semi-intensive and intensive shrimp farming under the CC
scenario, net income remains positive but at a declining rate.
For inland catfish farms, NPV for the 2010–2020 period is positive Under the NCC scenario, net income does not decline as fast. NPV
under the NCC scenario, while under CC, NPV is negative. The under both CC and NCC scenarios is positive for the 2010–2020
difference between the CC and NCC scenarios is larger for coastal period, with NCC NPV being 22% higher than CC NPV for the
catfish, with NCC NPV being around 100% higher than CC NPV 2010–2020 period. This amounts to discounted net income that
for the 2010–2020 period. Under the CC scenario, inland catfish is VND 403.7 million ha-1 lower over the 2010–2020 period due to
operations will become unprofitable within six years (by 2015), responding to climate change.
and continue on a declining trend to 2020. Despite a positive NPV,
net benefits under the NCC scenario remain positive only until Semi-intensive/intensive shrimp
2018, and then progressively decline. The optimistic NPV may be 600
million VND ha-1
due to high discounting, which puts more weight on positive net
benefits in the near future. 500
400
Inland catfish
5,000
million VND ha-1
300
4,000
3,000 200
2,000
100
1,000
0 0
2010
2011
2012
2013
2014
2015
2016
2017
2018
2019
2020
-1,000
-2,000
-3,000 with climate change without climate change
-4,000
-5,000 Improved extensive shrimp
-6,000 35
million VND ha-1
2010
2011
2012
2013
2014
2015
2016
2017
2018
2019
2020
30
25
with climate change without climate change
20
Coastal catfish 15
2,000
million VND ha-1
10
1,000
5
0
0
2010
2011
2012
2013
2014
2015
2016
2017
2018
2019
2020
-1,000
-2,000
with climate change without climate change
-3,000 Figure 7. Net farm income for black tiger shrimp under climate change
and no climate change scenarios for the next decade to 2020.
-4,000
The results depicted in Figures 6 and 7 provide a baseline for
-5,000 assessing (a) the net impact of climate change on future
profitability, and (b) the viability of various options for autonomous
2010
2011
2012
2013
2014
2015
2016
2017
2018
2019
2020
and planned adaptation to offset the impact of climate change.
The baselines for the next decade to 2020 reflect general
with climate change without climate change perceptions and assumptions about changes to the catfish and
shrimp sectors in the near future based on trends over the past
Figure 6. Net farm income for catfish under climate change and no
climate change scenarios for the next decade to 2020. decade.
Current trends for shrimp production are not as unfavourable For the period after 2020, the baseline relies upon simple
as those for catfish farming, with margins of 123% and 129% extrapolation of long-term trends; hence, further reductions in
for semi-intensive/intensive and improved extensive farms, net income due to climate change impacts are likely to happen,
respectively. The impacts of climate change would lead to a as indicated in Figure 8 comparing 2020 and 2050 net incomes for
further reduction of profitability. As suggested in Figure 7 for catfish and shrimp aquaculture. In reality, demand for seafood,
the 2010–2020 period, net income for improved extensive shrimp input prices and other costs of production are very uncertain.
is positive, but progressively declines under the CC scenario. Thus, the only relevance of the baseline is to provide a starting
Similarly, net income under NCC would also decline but at a point for the analysis of climate change and implications for
slower rate than under CC for the 2010–2020 period. NPV for adaptation and response.
14You can also read