COOK ISLANDS CLIMATE RISK COUNTRY PROFILE - World Bank Climate Change Knowledge ...
←
→
Page content transcription
If your browser does not render page correctly, please read the page content below
CLIMATE RISK COUNTRY PROFILE

     COOK ISLANDS
COPYRIGHT
© 2021 by the World Bank Group
1818 H Street NW, Washington, DC 20433
Telephone: 202-473-1000; Internet: www.worldbank.org

© 2021 Asian Development Bank
6 ADB Avenue, Mandaluyong City, 1550 Metro Manila, Philippines
Tel +63 2 8632 4444; Fax +63 2 8636 2444
www.adb.org

This work is a product of the staff of the World Bank Group (WBG) and the Asian Development Bank (ADB) and with external
contributions. The opinions, findings, interpretations, and conclusions expressed in this work are those of the authors’ and do not
necessarily reflect the views or the official policy or position of the WBG, its Board of Executive Directors, or the governments
it represents or of ADB, its Board of Governors, or the governments they represent.

The WBG and ADB do not guarantee the accuracy of the data included in this work and do not make any warranty, express or
implied, nor assume any liability or responsibility for any consequence of their use. This publication follows the WBG’s practice in
references to member designations, borders, and maps. The boundaries, colors, denominations, and other information shown on
any map in this work, or the use of the term “country” do not imply any judgment on the part of the WBG or ADB, their respective
Boards, or the governments they represent, concerning the legal status of any territory or geographic area or the endorsement
or acceptance of such boundaries.

The mention of any specific companies or products of manufacturers does not imply that they are endorsed or recommended
by either the WBG or ADB in preference to others of a similar nature that are not mentioned.

RIGHTS AND PERMISSIONS
The material in this work is subject to copyright. Because the WB and ADB encourage dissemination of their knowledge, this
work may be reproduced, in whole or in part, for noncommercial purposes as long as full attribution to this work is given. This
work is licensed under the Creative Commons Attribution-NonCommercial 3.0 IGO License. To view a copy of this license, visit
http://creativecommons.org/licenses/by-nc/3.0/igo/ or send a letter to Creative Commons, PO Box 1866, Mountain View,
CA 94042, USA.

This CC license does not apply to WBG or non-ADB copyright materials in this publication. If the material is attributed to another
source, please contact the copyright owner or publisher of that source for permission to reproduce it. WBG or ADB cannot be
held liable for any claims that arise as a result of your use of the material.

Please cite the work as follows: Climate Risk Country Profile: Cook Islands (2021): The World Bank Group and the Asian
Development Bank.

Any queries on rights and licenses, including subsidiary rights, should be addressed to World Bank Publications, The World Bank
Group, 1818 H Street NW, Washington, DC 20433, USA; fax: 202-522-2625; e-mail: pubrights@worldbank.org.

Cover Photos: © Tim Parkinson, “Sunset at Rarotonga, Cook Islands” November 13, 2006 via Flickr, Creative Commons CC
BY-NC-ND 2.0. © Ron Caswell, “Mataora Wreck, Rarotonga” February 7, 2011 via Flickr, Creative Commons CC BY-NCND 2.0.

Graphic Design: Circle Graphics, Reisterstown, MD.

CLIMATE RISK COUNTRY PROFILE: COOK ISLANDS                                                                                        ii
ACKNOWLEDGEMENTS
This profile is part of a series of Climate Risk Country Profiles that are jointly developed by the World Bank Group (WBG)
and the Asian Development Bank (ADB). These profiles synthesize the most relevant data and information on climate change,
disaster risk reduction, and adaptation actions and policies at the country level. The profile is designed as a quick reference
source for development practitioners to better integrate climate resilience in development planning and policy making. This effort
is co-led by Veronique Morin (Senior Climate Change Specialist, WBG), Ana E. Bucher (Senior Climate Change Specialist, WBG)
and Arghya Sinha Roy (Senior Climate Change Specialist, ADB).

This profile was written by Alex Chapman (Consultant, ADB), William Davies (Consultant, ADB), Ciaran Downey (Consultant),
and Emmet Kiberd (Consultant). Technical review of the profiles was undertaken by Robert L. Wilby (Loughborough University).
Additional support was provided by MacKenzie Dove (Senior Climate Change Consultant, WBG), Jason Johnston (Operations
Analyst, WBG), Yunziyi Lang (Climate Change Analyst, WBG), Adele Casorla-Castillo (Consultant, ADB), and Charles Rodgers
(Consultant, ADB). This profile also benefitted from inputs of WBG and ADB regional staff and country teams.

Climate and climate-related information is largely drawn from the Climate Change Knowledge Portal (CCKP), a WBG online
platform with available global climate data and analysis based on the current Intergovernmental Panel on Climate Change
(IPCC) reports and datasets. The team is grateful for all comments and suggestions received from the sector, regional, and
country development specialists, as well as climate research scientists and institutions for their advice and guidance on use of
climate related datasets.

CLIMATE RISK COUNTRY PROFILE: COOK ISLANDS                                                                                     iii
CONTENTS

FOREWORD  .  .  .  .  .  .  .  .  .  .  .  .  .  .  .  .  .  .  .  .  .  .  .  .  .  .  .  .  .  .  .  .  .  .  .  . 1

KEY MESSAGES .   .   .   .   .   .   .   .   .   .   .   .   .   .   .   .   .   .   .   .   .   .   .   .   .   .   .   .   .   .   .   .   .   .  2

COUNTRY OVERVIEW .   .   .   .   .   .   .   .   .   .   .   .   .   .   .   .   .   .   .   .   .   .   .   .   .   .   .   .   .   .   .  2

CLIMATOLOGY  .   .   .   .   .   .   .   .   .   .   .   .   .   .   .   .   .   .   .   .   .   .   .   .   .   .   .   .   .   .   .   .   .   .   5
   Climate Baseline .  .  .  .  .  .  .  .  .  .  .  .  .  .  .  .  .  .  .  .  .  .  .  .  .  .  .  .  .  .  .  .  .  .  .  .  .  .  .  .           5
      Overview  .  .  .  .  .  .  .  .  .  .  .  .  .  .  .  .  .  .  .  .  .  .  .  .  .  .  .  .  .  .  .  .  .  .  .  .  .  .  .  .  .  .         5
      Key Trends .  .  .  .  .  .  .  .  .  .  .  .  .  .  .  .  .  .  .  .  .  .  .  .  .  .  .  .  .  .  .  .  .  .  .  .  .  .  .  .  .           5
   Climate Future .  .  .  .  .  .  .  .  .  .  .  .  .  .  .  .  .  .  .  .  .  .  .  .  .  .  .  .  .  .  .  .  .  .  .  .  .  .  .  .  .          6
      Model Ensemble .  .  .  .  .  .  .  .  .  .  .  .  .  .  .  .  .  .  .  .  .  .  .  .  .  .  .  .  .  .  .  .  .  .  .  .  .  .  .             6
      RCPs .  .  .  .  .  .  .  .  .  .  .  .  .  .  .  .  .  .  .  .  .  .  .  .  .  .  .  .  .  .  .  .  .  .  .  .  .  .  .  .  .  .  .  .        7

CLIMATE RELATED NATURAL HAZARDS .   .   .   .   .   .   .   .   .   .   .   .   .   .   .   .   .   .   .   .   .   . 11
       Heatwaves .  .  .  .  .  .  .  .  .  .  .  .  .  .  .  .  .  .  .  .  .  .  .  .  .  .  .  .  .  .  .  .  .  .  .  .  .  .  .  .  . 11
       Drought  .  .  .  .  .  .  .  .  .  .  .  .  .  .  .  .  .  .  .  .  .  .  .  .  .  .  .  .  .  .  .  .  .  .  .  .  .  .  .  .  .  . 11
       Flood, Cyclones, and Storm Surge .  .  .  .  .  .  .  .  .  .  .  .  .  .  .  .  .  .  .  .  .  .  .  .  .  .  .  .  .  .  . 12

CLIMATE CHANGE IMPACTS .   .   .   .   .   .   .   .   .   .   .   .   .   .   .   .   .   .   .   .   .   .   .   .   .   .   .   . 13
   Natural Resources  .  .  .  .  .  .  .  .  .  .  .  .  .  .  .  .  .  .  .  .  .  .  .  .  .  .  .  .  .  .  .  .  .  .  .  .  .  .  .            13
     Water .  .  .  .  .  .  .  .  .  .  .  .  .  .  .  .  .  .  .  .  .  .  .  .  .  .  .  .  .  .  .  .  .  .  .  .  .  .  .  .  .  .  .           13
     The Coastal Zone  .  .  .  .  .  .  .  .  .  .  .  .  .  .  .  .  .  .  .  .  .  .  .  .  .  .  .  .  .  .  .  .  .  .  .  .  .  .              14
     Coral Reefs and Fisheries .  .  .  .  .  .  .  .  .  .  .  .  .  .  .  .  .  .  .  .  .  .  .  .  .  .  .  .  .  .  .  .  .  .  .               16
     Island Ecology .  .  .  .  .  .  .  .  .  .  .  .  .  .  .  .  .  .  .  .  .  .  .  .  .  .  .  .  .  .  .  .  .  .  .  .  .  .  .  .           17
   Economic Sectors  .  .  .  .  .  .  .  .  .  .  .  .  .  .  .  .  .  .  .  .  .  .  .  .  .  .  .  .  .  .  .  .  .  .  .  .  .  .  .             18
     Agriculture and Food .  .  .  .  .  .  .  .  .  .  .  .  .  .  .  .  .  .  .  .  .  .  .  .  .  .  .  .  .  .  .  .  .  .  .  .  .              18
     Tourism . . . . . . . . . . . . . . . . . . . . . . . . . . . . . . . . . . . . . . . . . .                                                     19
   Communities  .  .  .  .  .  .  .  .  .  .  .  .  .  .  .  .  .  .  .  .  .  .  .  .  .  .  .  .  .  .  .  .  .  .  .  .  .  .  .  .  .            19
     Poverty, Inequality and Vulnerability to Climate-Related Disaster  .  .  .  .  .  .  .  .  .  .  .  .  .  .  .  .                               19
     Human Health .  .  .  .  .  .  .  .  .  .  .  .  .  .  .  .  .  .  .  .  .  .  .  .  .  .  .  .  .  .  .  .  .  .  .  .  .  .  .  .             21

POLICIES AND PROGRAMS  .   .   .   .   .   .   .   .   .   .   .   .   .   .   .   .   .   .   .   .   .   .   .   .   .   .   .   . 23
       National Adaptation Policies and Strategies .  .  .  .  .  .  .  .  .  .  .  .  .  .  .  .  .  .  .  .  .  .  .  .  .  . 23
       Climate Change Priorities of ADB .  .  .  .  .  .  .  .  .  .  .  .  .  .  .  .  .  .  .  .  .  .  .  .  .  .  .  .  .  .  . 23

CLIMATE RISK COUNTRY PROFILE: COOK ISLANDS                                                                                                           iv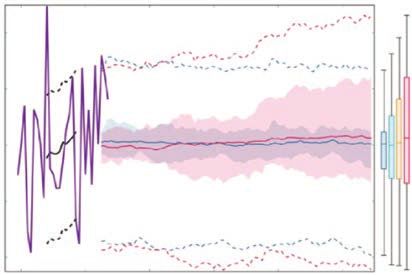
FOREWORD

Climate change is a major risk to good development outcomes, and the World Bank Group is committed to playing an important
role in helping countries integrate climate action into their core development agendas. The World Bank Group (WBG) and the
Asian Development Bank (ADB) are committed to supporting client countries to invest in and build a low-carbon, climate-
resilient future, helping them to be better prepared to adapt to current and future climate impacts.

Both institutions are investing in incorporating and systematically managing climate risks in development operations through
their individual corporate commitments.

For the World Bank Group: a key aspect of the World Bank Group’s Action Plan on Adaptation and Resilience (2019) is to help
countries shift from addressing adaptation as an incremental cost and isolated investment to systematically incorporating climate
risks and opportunities at every phase of policy planning, investment design, implementation and evaluation of development
outcomes. For all International Development Association and International Bank for Reconstruction and Development operations,
climate and disaster risk screening is one of the mandatory corporate climate commitments. This is supported by the World
Bank Group’s Climate and Disaster Risk Screening Tool which enables all Bank staff to assess short- and long-term climate
and disaster risks in operations and national or sectoral planning processes. This screening tool draws up-to-date and relevant
information from the World Bank’s Climate Change Knowledge Portal, a comprehensive online ‘one-stop shop’ for global,
regional, and country data related to climate change and development.

For the Asian Development Bank (ADB): its Strategy 2030 identified “tackling climate change, building climate and disaster
resilience, and enhancing environmental sustainability” as one of its seven operational priorities. Its Climate Change Operational
Framework 2017–2030 identified mainstreaming climate considerations into corporate strategies and policies, sector and
thematic operational plans, country programming, and project design, implementation, monitoring, and evaluation of climate
change considerations as the foremost institutional measure to deliver its commitments under Strategy 2030. ADB’s climate
risk management framework requires all projects to undergo climate risk screening at the concept stage and full climate risk
and adaptation assessments for projects with medium to high risk.

Recognizing the value of consistent, easy-to-use technical resources for our common client countries as well as to support
respective internal climate risk assessment and adaptation planning processes, the World Bank Group’s Climate Change Group
and ADB’s Sustainable Development and Climate Change Department have worked together to develop this content. Standardizing
and pooling expertise facilitates each institution in conducting initial assessments of climate risks and opportunities across sectors
within a country, within institutional portfolios across regions, and acts as a global resource for development practitioners.

For common client countries, these profiles are intended to serve as public goods to facilitate upstream country diagnostics,
policy dialogue, and strategic planning by providing comprehensive overviews of trends and projected changes in key climate
parameters, sector-specific implications, relevant policies and programs, adaptation priorities and opportunities for further actions.

We hope that this combined effort from our institutions will spur deepening of long-term risk management in our client countries
and support further cooperation at the operational level.

Bernice Van Bronkhorst                            Preety Bhandari
Global Director                                   Chief of Climate Change and Disaster Risk Management Thematic Group
Climate Change Group                              concurrently Director Climate Change and Disaster Risk Management Division
The World Bank Group                              Sustainable Development and Climate Change Department
                                                  Asian Development Bank

CLIMATE RISK COUNTRY PROFILE: COOK ISLANDS                                                                                          1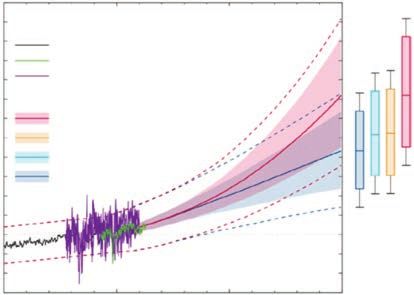
KEY MESSAGES

•     The Cook Islands are experiencing increasing temperatures, with warming trends expected to continue throughout
      the 21st century. Projected rates of warming are clouded by current models’ inability to simulate very localized
      changes, but warming is expected to be in the range of 0.6°C–2.7°C depending on the 21st century rate of
      global emissions.
•     Natural interannual and interdecadal variability ensures short- and medium-term rainfall changes are difficult
      to detect and project into the future for small islands. Further research is urgently required to develop models
      better suited to modelling the future climate of Pacific islands.
•     The sea-level near the Cook Islands is projected to increase throughout the 21st century, with models showing
      a very high confidence in this trend. While most of the Cook Islands have higher elevation than their Pacific
      neighbors, this still exposes coastal communities to a greater storm-surge threat.
•     The country’s tourism economy is particularly vulnerable, with tourism infrastructure in the coastal zone exposed
      to hazards and potential declines in biodiversity, particularly corals, potentially impacting attractiveness to
      foreign visitors.
•     A realignment of the nation’s fisheries sector is likely, but with careful and sustainable management the future
      production outlook is not necessarily negative.
•     Potential intensification of the most extreme tropical cyclone events threatens significant damage and loss to
      Cook Islanders; however, the science underpinning our understanding of future Pacific circulation patterns is
      weak, and likely trends are not well understood.

COUNTRY OVERVIEW

T
       he Cook Islands are located south of the equator and consists of 15 islands spread across nearly 2 million square
       kilometers (km2) of the South Pacific Ocean.1,2 Its islands are among the world’s most remote places. In 2016,
       the nation had a population of around 17,000 people, the majority of whom live on the main island of Rarotonga.
The Cook Islands are in free association with New Zealand which allows for the sharing of some administrative and
governance functions. As such, Cook Islanders hold New Zealand citizenship enabling them to migrate more freely
than many of their Pacific neighbors. There are more than 50,000 Cook Islanders residing in New Zealand and a
further 15,000 in Australia (altogether the Diaspora makes up nearly four times the resident population).3 Migration,
mainly to New Zealand, can be a challenging dynamic for the economic development of the Cook Islands.

1
    World Bank (2015). Country Note: The Cook Islands, Disaster Risk Financing and Insurance. URL: http://documents1.worldbank.org/
    curated/en/405171468244771591/pdf/949800WP0Box380ry0Note0Cook0Islands.pdf
2
    The Cook Islands is not a member of the World Bank Group (WBG). It has been a developing member country of the Asian
    Development Bank (ADB) since 1976.
3
    ADB (2012). Economic Recovery Support Program Subprogram 2 (RRP COO 42503-023): Macroeconomic assessment.
    URL: https://www.adb.org/sites/default/files/linked-documents/42503-023-coo-oth.pdf

CLIMATE RISK COUNTRY PROFILE: COOK ISLANDS                                                                                       2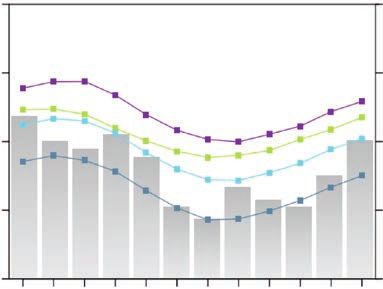
The Cook Islands are known for their extraordinary natural beauty, which attracts significant tourism. Tourism
accounted for an estimated 70% of GDP in 2018. The success of the industry has led to the Cook Islands’
economy to be one of the strongest in the South Pacific, with a GDP per capita of around $16,700 in 2016.
Performance on poverty reduction and other social metrics is believed to have been strong, although national data is
often lacking (Table 1). Nevertheless, the nation faces very significant challenges, particularly in relation to natural
hazards and economic vulnerability.

The Cook Islands are located in an area that is highly exposed to tropical cyclones with damaging winds, storm
surge, and floods.4 To put this in perspective, between 1969/70 and 2010/11 an average of “18 cyclones per
decade developed within or crossed the Cook Islands Exclusive Economic Zone (EEZ)”.5 The cumulative average
annual losses to natural hazards has been estimated at around £5 million, or approximately 2% of GDP.6 Within
this context, the Cook Islands takes climate change extremely seriously. Cook Islands published its Third National
Communication to the UNFCCC in 2019,7 submitted its Nationally Determined Contribution in 2015, and ratified
the Paris Climate Agreement in 2016.

Green, Inclusive and Resilient Recovery
The coronavirus disease (COVID-19) pandemic has led to unprecedented adverse social and economic impacts.
Further, the pandemic has demonstrated the compounding impacts of adding yet another shock on top of
the multiple challenges that vulnerable populations already face in day-to-day life, with the potential to create
devastating health, social, economic and environmental crises that can leave a deep, long-lasting mark. However,
as governments take urgent action and lay the foundations for their financial, economic, and social recovery, they
have a unique opportunity to create economies that are more sustainable, inclusive and resilient. Short and long-
term recovery efforts should prioritize investments that boost jobs and economic activity; have positive impacts on
human, social and natural capital; protect biodiversity and ecosystems services; boost resilience; and advance the
decarbonization of economies.

4
    ADB (2016). Proposed Policy Based Loan Cook Islands: Disaster Resilience Program, Project Number: 50212-001. URL: https://
    www.adb.org/projects/50212-001/main
5
    Pacific Catastrophe Risk Assessment and Financing Initiative (2011). Country Risk Profile: Cook Islands. URL: https://www.
    preventionweb.net/files/27076_cookislandspicrafi.pdf
6
    Veve, E., and Olsson, S.B. (2018). Contingent Disaster Financing Drives Disaster Preparedness in the Cook Islands. Financial
    Protection Forum. URL: https://www.financialprotectionforum.org/blog/contingent-disaster-financing-drives-disaster-preparedness-
    in-the-cook-islands [accessed: 29/11/2019]
7
    Office of the Prime Minister, Government of the Cook Islands (2019). Cook Islands Third National Communication under the UNFCCC.
    URL: https://unfccc.int/sites/default/files/resource/TNC%20FINAL.%20online.pdf

CLIMATE RISK COUNTRY PROFILE: COOK ISLANDS                                                                                        3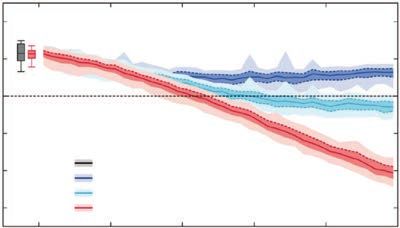
This document aims to succinctly summarize the climate risks faced by the Cook Islands. This includes rapid onset
and long- term changes in key climate parameters, as well as impacts of these changes on communities, livelihoods
and economies, many of which are already underway. This is a high-level synthesis of existing research and analyses,
focusing on the geographic domain of the Cook Islands, therefore potentially excluding some international
influences and localized impacts. The core climate projections presented are sourced from the Pacific-Australia
Climate Change Science and Adaptation Planning Program,8,9 as well as the World Bank Group’s Climate Change
Knowledge Portal (CCKP), incorporating climate projections from the Coupled Model Inter-comparison Project
Phase 5 (CMIP5). This document is primarily meant for WBG and ADB staff to inform their climate actions. The
document also aims and to direct the reader to many useful sources of secondary data and research.

TABLE 1.  Key indicators

     Indicator                                                              Value                                  Source
     Population Undernourished10                                            N/A                                    FAO, 2020
     National Poverty Rate   11                                             N/A                                    ADB, 2020a
     Share of Wealth Held by Bottom 20%        12                           N/A                                    World Bank, 2019
     Net Annual Migration Rate    13                                        N/A                                    UNDESA, 2019
     Infant Mortality Rate (Between Age 0 and 1)               14           N/A                                    UNDESA, 2019
     Average Annual Change in Urban Population15                            0.37% (2015–20)                        UNDESA, 2019
     Dependents per 100 Independent Adults               16                 N/A                                    UNDESA, 2019
     Urban Population as % of Total Population            17                75.5% (2020)                           CIA, 2020
     External Debt Ratio to GNI    18                                       12.3% (2019)                           ADB, 2020b
     Government Expenditure Ratio to GDP            19                      26.1% (2019)                           ADB, 2020b

8
      Australian Bureau of Meteorology and CSIRO (2014). Climate Variability, Extremes and Change in the Western Tropical Pacific:
      New Science and Updated Country Reports. Pacific-Australia Climate Change Science and Adaptation Planning Program Technical
      Report, Australian Bureau of Meteorology and CSIRO, Melbourne, Australia. URL: https://www.pacificclimatechangescience.org/
      wp-content/uploads/2014/07/PACCSAP_CountryReports2014_WEB_140710.pdf
9
      The NextGen projections for the Pacific region under CMIP5 are expected to be available from July 2021. These will provide an
      update on the PACCSAP 2014 projections referenced in this profile. The process for providing the new NextGen CMIP6 projections
      for the Pacific is still in the planning phase.
10
      FAO, IFAD, UNICEF, WFP, WHO (2020). The state of food security and nutrition in the world. Building Resilience for peace and food
      security. FAO. Rome. URL: http://www.fao.org/documents/card/en/c/ca9692en/
11
      ADB (2020a). Basic Statistics 2020. URL: https://www.adb.org/publications/basic-statistics-2020 [accessed 04/03/2021]
12
      World Bank (2019). Income share held by lowest 20%. URL: https://data.worldbank.org/indicator/SI.DST.FRST.20 [accessed 15/02/2021]
13
      UNDESA (2019). World Population Prospects 2019. URL: https://population.un.org/wpp/Download/Standard/Population/
      [accessed 15/02/2021]
14
      UNDESA (2019). World Population Prospects 2019. URL: https://population.un.org/wpp/Download/Standard/Population/
      [accessed 15/02/2021]
15
      UNDESA (2019). World Urbanization Prospects 2019. URL: https://population.un.org/wup/Download/ [accessed 15/02/2021]
16
      UNDESA (2019). World Population Prospects 2019. URL: https://population.un.org/wpp/Download/Standard/Population/
      [accessed 15/02/2021]
17
      CIA (2020). The World Factbook. Central Intelligence Agency. Washington DC. URL: https://www.cia.gov/the-world-factbook/
18
      ADB (2020b). Key Indicators for Asia and the Pacific 2020, 51st Edition. Asian Development Bank. Manila. URL: https://www.adb.org/
      sites/default/files/publication/632971/ki2020.pdf
19
      ADB (2020b). Key Indicators for Asia and the Pacific 2020, 51st Edition. Asian Development Bank. Manila. URL: https://www.adb.org/
      sites/default/files/publication/632971/ki2020.pdf

CLIMATE RISK COUNTRY PROFILE: COOK ISLANDS                                                                                            4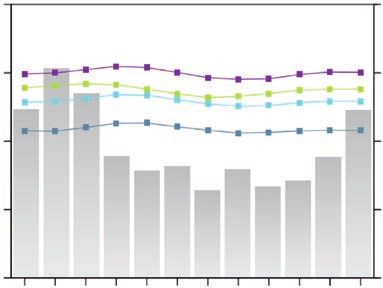
CLIMATOLOGY
Climate Baseline
Overview
As is common in the Pacific, the Cook Islands experience a generally stable temperature regime fluctuating
between an average of 26°C and 28°C all year round in the north, and between 23°C and 26°C in the south at
Rarotonga. Maximum temperatures reach around 30°C and minimum temperatures around 20°C (Figure 1). The
Cook Islands experience significant average annual rainfall, usually peaking between December and March and
typically in the range of 1,200–2,000 millimeters (mm) per year. Climate in the Cook Islands is heavily influenced
by the El Niño-Southern Oscillation (ENSO) climate dynamic and by the position of the South Pacific Convergence
Zone (SPCZ) which brings with it thunderstorm activity.
Annual Cycle
FIGURE 1. Seasonal temperature and rainfall at Penrhyn (in the north) and Rarotonga (in the south).20
35 400 35 400
Penrhyn, Cook Islands, 158.05°W, 9.03°S Rarotonga, Cook Islands, 159.80°W, 21.20°S
30 300 30 300
Monthly Rainfall (mm)
Monthly Rainfall (mm)
Temperature (°C)
Temperature (°C)
25 200 25 200
20 100 20 100
15 0 15 0
Jan Apr Jul Oct Jan Apr Jul Oct
Maximum temperature Average temperature Minimum temperature Sea surface temperature
Key Trends
Temperature
Temperatures have been rising in the Cook Islands. A lack of high quality and consistent data challenge our
understanding of the precise extent of warming, but the data shown in Figure 2 as well as that reported by the
Berkeley Earth dataset21 suggest that temperature increases of at least 0.4°C have taken place since 1990.
Warming over 1934–2011 is seen most strongly in the rise of minimum temperatures (at almost 0.2°C per decade)
and weakest in maximum temperatures (around 0.1°C per decade).
20
Australian Bureau of Meteorology (2015). Current and future climate of the Cook Islands. Pacific-Australia Climate Change Science
and Adaptation Planning Program. URL: https://www.pacificclimatechange.net/document/current-and-future-climate-cook-islands-0
21
Carbon Brief (2018). Mapped: How every part of the world has warmed – and could continue to warm. [26 September 2018].
URL: https://www.carbonbrief.org/mapped-how-every-part-of-the-world-has-warmed-and-could-continue-to-warm
[accessed 25/10/2019]
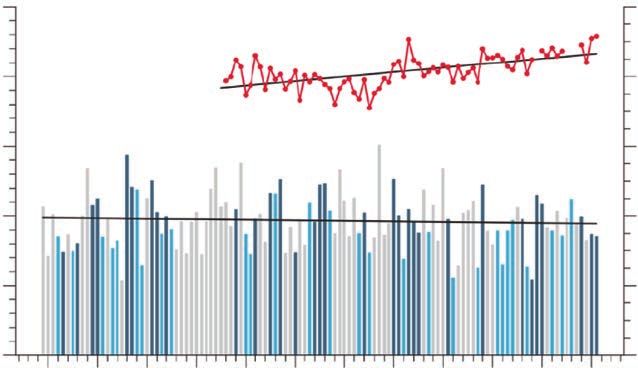
CLIMATE RISK COUNTRY PROFILE: COOK ISLANDS 5FIGURE 2. Observed time series of annual average values of mean air
temperature (red dots and line) and total rainfall (bars) Rarotonga in Southern
Cook Islands. Light blue, dark blue and grey bars denote El Niño, La Niña and
neutral years respectively. Solid black trend lines indicate a least squares fit.8
5000 El Nino 26.0
La Nina
4000 24.0
Temperature (°C)
Rainfall (mm)
3000 22.0
2000 20.0
1000 18.0
0 16.0
1900 1910 1920 1930 1940 1950 1960 1970 1980 1990 2000 2010
Precipitation
No changes in annual average rainfall over the Cook Islands which are attributable to human driven climate
change have yet to be identified. Rainfall shows significant interannual variability, this is influenced in particular by
the ENSO phenomenon. Average annual rainfall on the main island of Rarotonga is typically significantly below
average in El Niño years. Conversely, in the north, El Niño years are associated with increased rainfall. El Niño
years are also associated with more frequent tropical cyclones.
Climate Future
Model Ensemble
Due to differences in the way global circulation models (GCMs) represent the key physical processes and
interactions within the climate system, projections of future climate conditions can vary widely between
different GCMs. This is particularly the case for rainfall related variables and at sub-national scales. Exploring
the spread of climate model outputs can assist in understanding uncertainties associated with climate models.
The range of projections from 16 GCMs on the indicators of average temperature anomaly and annual precipitation
anomaly for the Cook Islands under RCP8.5 is shown in Figure 3.
CLIMATE RISK COUNTRY PROFILE: COOK ISLANDS 6FIGURE 3. ‘Projected average temperature 5
Average temperature anomaly (°C)
4.5 ipsl_cm5a_mr
change’ and ‘projected annual rainfall change’ 4
in the Cook Islands. Outputs of 16 models 3.5
3
within the ensemble simulating RCP8.5 2.5
over the period 2080–2099. Models shown 2 miroc_esm
represent the subset of models within the 1.5
Median,
1 10th and 90th
ensemble which provide projections across 0.5 Percentiles
all RCPs and therefore are most robust for 0
–30% –20% –10% 0% 10% 20% 30% 40%
comparison. Two models are labelled. Average annual precipitation anomaly (%)
The majority of the models from which outputs are presented in this report are from the CMIP5 round of
standardization and quality assurance. Unfortunately, models of this generation operate at large spatial scales
and are not well equipped to simulate the future climate of small islands. Typically, the changes projected will
relate more to the expected changes over nearby ocean than the island itself. Caution should therefore
be applied in interpreting results. This highlights a major area for future development, a research opportunity, and
an urgent need from the perspective of policy makers planning for climate change.
RCPs
The Representative Concentration Pathways (RCPs) A Precautionary Approach
represent four plausible futures, based on the rate of
emissions reduction achieved at the global level. Four Studies published since the last iteration of
RCPs (i.e. RCP2.6, RCP4.5, RCP6.0, and RCP8.5) the IPCC’s report (AR5), such as Gasser
were selected and defined by their total radiative et al. (2018), have presented evidence which
forcing (cumulative measure of GHG emissions suggests a greater probability that earth will
from all sources) pathway and level by 2100. In experience medium and high-end warming
this analysis, RCP2.6 and RCP8.5, the extremes scenarios than previously estimated.22 Climate
of low and high emissions pathways, are the primary change projections associated with the highest
focus; RCP2.6 represents a very strong mitigation emissions pathway (RCP8.5) are presented
scenario, whereas RCP8.5 assumes business- here to facilitate decision making which is
as-usual scenario. For reference, Table 2 provides robust to these risks.
information on all four RCPs over two-time horizons. In
subsequent analysis RCPs 2.6 and 8.5, the extremes
of low and high emissions pathways, are the primary focus. RCP2.6 would require rapid and systemic global action,
achieving emissions reduction throughout the 21st century enough to reach net zero global emissions by around 2080.
RCP8.5 assumes annual global emissions will continue to increase throughout the 21st century. Climate changes
under each emissions pathway are presented against a reference period of 1986–2005 for all indicators. For more
information, please refer to the RCP Database.
22
Gasser, T., Kechiar, M., Ciais, P., Burke, E. J., Kleinen, T., Zhu, D., . . . Obersteiner, M. (2018). Path-dependent reductions in CO2
emission budgets caused by permafrost carbon release. Nature Geoscience, 11, 830–835. URL: https://www.nature.com/articles/
s41561-018-0227-0?WT.feed_name=subjects_climate-sciences
CLIMATE RISK COUNTRY PROFILE: COOK ISLANDS 7TABLE 2. An overview of temperature change projections (°C) in the Northern Cook Islands (top)
and Southern Cook Islands (bottom) under four emissions pathways. Projected changes over the
1986–2005 baseline are given for 20-year periods centered on 2050 and 2090 with the 5th and
95th percentiles provided in brackets.
Mean Surface Air Temp Max Temp Min Temp
(Annual) (1-in-20 Year Event) (1-in-20 Year Event)
Scenario 2050 2090 2050 2090 2050 2090
RCP2.6 0.7 (0.5, 1.2) 0.8 (0.5, 1.2) 0.8 (0.1, 1.2) 0.8 (0.2, 1.1) 0.7 (0, 1.1) 0.8 (0.2, 1.1)
RCP4.5 1 (0.6, 1.3) 1.3 (0.9, 2.1) 0.9 (0.4, 1.2) 1.3 (0.6, 1.9) 0.9 (0.5, 1.3) 1.3 (0.6, 2)
RCP6.0 0.9 (0.6, 1.4) 1.6 (1, 2.4) NA NA NA NA
RCP8.5 1.3 (0.9, 1.8) 2.7 (2, 3.8) 1.4 (0.5, 2.1) 2.8 (1.3, 4.2) 1.4 (0.9, 2) 2.8 (1.9, 4)
Mean Surface Air Temp Max Temp Min Temp
(Annual) (1-in-20 Year Event) (1-in-20 Year Event)
Scenario 2050 2090 2050 2090 2050 2090
RCP2.6 0.6 (0.5, 1) 0.6 (0.5, 1.1) 0.5 (0, 0.9) 0.6 (0.1, 1.1) 0.6 (-0.1, 1) 0.6 (-0.1, 1)
RCP4.5 0.9 (0.6, 1.5) 1.2 (0.7, 2.1) 0.8 (0.3, 1.2) 1.2 (0.7, 1.8) 0.8 (0.4, 1.4) 1.1 (0.6, 1.8)
RCP6.0 0.8 (0.5, 1.4) 1.5 (1.1, 2.4) NA NA NA NA
RCP8.5 1.2 (0.8, 2) 2.5 (1.7, 4.2) 1.3 (0.9, 1.8) 2.7 (1.6, 3.9) 1.3 (0.6, 1.9) 2.8 (2, 4.5)
Temperature
Projections of future temperature change are presented in three primary formats. Figures 3 and 4 display only
the average temperature projections. While similar, these three indicators can provide slightly different information.
Monthly and annual average temperatures are most commonly used for general estimation of climate change, but
the daily maximum and minimum can explain more about how daily life might change in a region, affecting key
variables such as the viability of ecosystems, health impacts, productivity of labor, and the yield of crops, which are
often disproportionately influenced by temperature extremes.
Across the Pacific, temperatures are projected to increase between 1.4°C and 3.1°C. As shown in Figure 4,
local temperature increases are expected across the Cook Islands, with warming varying widely across emissions
pathways, especially after the 2030s. For instance, as indicated in Table 2, relative to the 1986–2005 baseline,
a warming of 0.6°C–0.8°C for RCP2.6, meaning temperatures sustaining at approximately their level in 2018.
Warming of 2.7°C–2.8°C (median ensemble estimate) is projected for the Cook Islands by the 2090s under
the highest emissions pathway (RCP8.5). The significant difference in these estimates shows the impact global
emission reduction efforts could have on future changes.
Future temperature rises in the Cook Islands are likely to be below the global average – the mean annual surface
air temperature under the highest emissions pathway is projected to reach up to 2.8°C by the 2090s, compared to
around 3.7°C globally. This difference may reflect the moderating effect of large amounts of nearby ocean cover,
but considering that ocean cover can also distort model simulations, and the current iteration of global models
does not have the spatial accuracy to reliably capture climate processes over Small Island States, these projections
should be approached with caution.
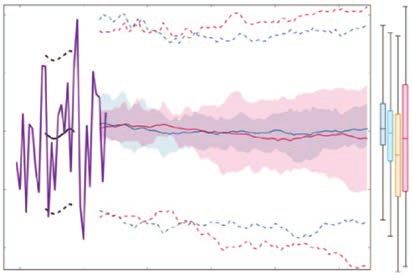
CLIMATE RISK COUNTRY PROFILE: COOK ISLANDS 8FIGURE 4. Historical and simulated surface air temperature time series for the region surrounding
the Northern Cook Islands (left) and the Southern Cook Islands (right). The graph shows the anomaly
(from the base period 1986–2005) in surface air temperature from observations (the GISS dataset,
in purple), and for the CMIP5 models under the very high (RCP8.5, in red) and very low (RCP2.6, in blue)
emissions scenarios. The solid red and blue lines show the smoothed (20-year running average)
multi-model mean anomaly in surface air temperature, while shading represents the spread of
model values (5th–95th percentile). The dashed lines show the 5th–95th percentile of the observed
interannual variability for the observed period (in black) and added to the projections as a visual
guide (in red and blue). This indicates that future surface air temperature could be above or below
the projected long-term averages due to interannual variability. The ranges of projections for a
20-year period centered on 2090 are shown by the bars on the right for RCP8.5, 6.0, 4.5 and 2.6.23,8
5 5
4 4
Temperature anomaly relative to
Temperature anomaly relative to
3 3
1986–2005 (Celsius)
1986–2005 (Celsius)
2 2
1 1
0 0
–1 –1
–2 –2
1960 1980 2000 2020 2040 2060 2080 1960 1980 2000 2020 2040 2060 2080
Year Year
smoothed GISS GISS RCP8.5 RCP6.0 RCP4.5 RCP2.6
Precipitation
There is very high uncertainty around future changes in average annual precipitation since none of the model
ensemble predictions are statistically significant and the estimated ranges are large. As shown in Figures 3 and 5
projections range from −30% to 30% changes in average annual rainfall. Challenges to the certainty of the model
average rainfall change are affected by the complexity of simulating tropical rainfall, as well as uncertainty in ENSO
changes, which especially influences year-to-year rainfall variability within the region.
23
Australian Bureau of Meteorology and CSIRO (2014). Climate Variability, Extremes and Change in the Western Tropical Pacific:
New Science and Updated Country Reports. Pacific-Australia Climate Change Science and Adaptation Planning Program Technical
Report, Australian Bureau of Meteorology and CSIRO, Melbourne, Australia. URL: https://www.pacificclimatechangescience.org/
wp-content/uploads/2014/07/PACCSAP_CountryReports2014_WEB_140710.pdf
CLIMATE RISK COUNTRY PROFILE: COOK ISLANDS 9In terms of extreme rainfall events, a warmer atmosphere is likely to lead to an increase in their frequency and
intensity. Cook Islands’ Second National Communication to the UNFCCC shares projections which suggest intense
single-day rainfall events could increase in frequency and intensity. For example, a 300 mm daily rainfall event,
which currently only occurs once every 38 years on Rarotonga, could increase in probability such that it occurs once
every 11 years by the end of the century.7 However, the precise magnitude of such changes in extreme rainfall is
not as certain due to deficiencies in the CMIP5 generation of GCMs.24,8
FIGURE 5. Historical and simulated annual average rainfall time series for the region surrounding
the Northern Cook Islands (left) and the Southern Cook Islands (right). The graph shows the
anomaly (from the base period 1986–2005) in rainfall from observations (the GPCP dataset,
in purple), and for the CMIP5 models under the very high (RCP8.5, in red) and very low
(RCP2.6, in blue) emissions scenarios. The solid red and blue lines show the smoothed
(20-year running average) multi-model mean anomaly in rainfall, while shading represents the
spread of model values (5–95th percentile). The dashed lines show the 5–95th percentile of the
observed interannual variability for the observed period (in black) and added to the projections
as a visual guide (in red and blue). This indicates that future rainfall could be above or below the
projected long-term averages due to interannual variability. The ranges of projections for a
20-year period centered on 2090 are shown by the bars on the right for RCP8.5, 6.0, 4.5 and 2.6.25
40
40
Precipitation anomaly relative to
Precipitation anomaly relative to
20
20
1986–2005 (%)
1986–2005 (%)
0
0
–20
–20
–40 –40
1980 2000 2020 2040 2060 2080 1980 2000 2020 2040 2060 2080
Year Year
smoothed GPCP GPCP RCP8.5 RCP6.0 RCP4.5 RCP2.6
24
Australian Bureau of Meteorology and CSIRO (2014). Climate Variability, Extremes and Change in the Western Tropical Pacific:
New Science and Updated Country Reports. Pacific-Australia Climate Change Science and Adaptation Planning Program Technical
Report, Australian Bureau of Meteorology and CSIRO, Melbourne, Australia. URL: https://www.pacificclimatechangescience.org/
wp-content/uploads/2014/07/PACCSAP_CountryReports2014_WEB_140710.pdf
25
Australian Bureau of Meteorology and CSIRO (2014). Climate Variability, Extremes and Change in the Western Tropical Pacific:
New Science and Updated Country Reports. Pacific-Australia Climate Change Science and Adaptation Planning Program Technical
Report, Australian Bureau of Meteorology and CSIRO, Melbourne, Australia. URL: https://www.pacificclimatechangescience.org/
wp-content/uploads/2014/07/PACCSAP_CountryReports2014_WEB_140710.pdf
CLIMATE RISK COUNTRY PROFILE: COOK ISLANDS 10CLIMATE RELATED NATURAL HAZARDS
Heatwaves
Cook Islands regularly experiences high maximum temperatures, with maximums averaging 29°C–30°C. Projected
climate changes are expected to push temperatures above 30°C on a regular basis. The historic temperature
regime in the Cook Islands was very stable; further research is required to better understand the implications of
climate change, and its interaction with the ENSO phenomenon, for its future regime and potential heatwaves.
An additional factor for consideration is the potential for marine heatwaves. Research has shown that “from 1925 to
2016, global average marine heatwave frequency and duration increased by 34% and 17%, respectively, resulting
in a 54% increase in annual marine heatwave days globally”.26 While such research has not specifically identified the
Cook Islands under threat, the consequences of these trend may be serious for marine ecosystems in the region,
which are adapted to survive under very stable temperature regimes, as well as the livelihoods dependent on them.
Drought
Drought can be expressed in many ways, from looking at simple precipitation deficits to complex estimates of
remaining soil moisture. Research done for the report on “Climate Variability, Extremes and Change in the Western
Tropical Pacific 2014”, defines projected changes in the frequency and duration of mild, moderate, severe and
extreme meteorological droughts using the Standardized Precipitation Index (SPI). This index is based solely
on rainfall (i.e. periods of low rainfall are classified as drought), and does not take into account factors such as
evapotranspiration or soil moisture content. It is noted that the SPI is commonly used in many regions including the
Pacific due to the relative simplicity with which it is calculated, as well as its relevance across temporal and spatial
scales. For the Cook Islands, it is likely that the percentage of time spent in drought may decrease, and this is
generally shown across emissions scenarios (Figure 6).8 The exception is for droughts classed as ‘extreme’ around
which there is great uncertainty and potential for both increases and decreases in frequency and duration based on
current modelling. However, it should be noted that complex processes relating to rainfall projections, including the
limited consensus of future ENSO influence for the region, hinder the confidence of these projections of drought
frequency and duration, as well as magnitude of change.8
26
Oliver, E. C., Donat, M. G., Burrows, M. T., Moore, P. J., Smale, D. A., Alexander, L. V., . . . & Holbrook, N. J. (2018). Longer and more
frequent marine heatwaves over the past century. Nature communications, 9(1), 1324.
CLIMATE RISK COUNTRY PROFILE: COOK ISLANDS 11FIGURE 6. Box-plots showing percent of time in moderate, severe or extreme drought (left hand side),
and average drought duration and frequency for the different categories of drought (mild, moderate,
severe and extreme) for the Southern Cook Islands. These are shown for 20-year periods centered
on 1995, 2030, 2050, 2070 and 2090 for the RCP8.5 (very high emissions) scenario. The thick dark
lines show the median of all models, the box shows the interquartile (25–75%) range, the dashed
lines show 1.5 times the interquartile range and circles show outlier results.8
mild moderate severe extreme
60
80
50
Duration
60 40
30
50
20
10
Percentage
40
5
30
4
Frequency
20 3
2
10
1
0 0
1995 2030 2050 2070 2090 1995 2030 2050 2070 2090 1995 2030 2050 2070 2090 1995 2030 2050 2070 2090 1995 2030 2050 2070 2090
Flood, Cyclones, and Storm Surge
The Cook Islands have very high exposure and vulnerability to the impact of flood, tropical cyclones, and storm surge
which can strike in combination or isolation. Cyclones bring coastal and flash flooding even when only passing in the
vicinity of the island. According to its Second National Communication to the UNFCCC around 1–6 cyclones pass
the vicinity of the Cook Islands every year, windspeeds of over 119 kilometers per hour (km/h) make landfall around
once every five years.7 For example, in 2010 Cyclone Pat hit Aitutaki damaging 75% of homes on the island (pop. 2,000)
resulting in the migration of some households and a year-long reconstruction process.7
The climate model ensemble projection is for a reduction in the frequency of cyclone genesis in the vicinity of
the Cook Islands, this decline varies between 5%–50%.27,8 Climate change is expected to interact with cyclone
hazard in complex ways which are currently poorly understood. Known risks include the action of sea-level rise to
enhance the damage caused by cyclone-induced storm surges, and the possibility of increased wind speed and
precipitation intensity. Modelling of climate change impacts on cyclone intensity and frequency conducted across
the globe points to a general trend of reduced cyclone frequency but increased intensity and frequency of the
27
Australian Bureau of Meteorology and CSIRO (2014). Climate Variability, Extremes and Change in the Western Tropical Pacific:
New Science and Updated Country Reports. Pacific-Australia Climate Change Science and Adaptation Planning Program Technical
Report, Australian Bureau of Meteorology and CSIRO, Melbourne, Australia. URL: https://www.pacificclimatechangescience.org/
wp-content/uploads/2014/07/PACCSAP_CountryReports2014_WEB_140710.pdf
CLIMATE RISK COUNTRY PROFILE: COOK ISLANDS 12most extreme events.28,29 Trends emerging from the scientific literature in regard to tropical cyclone genesis and
tracks in the Pacific point towards a climate change-driven westward shift in the genesis location of cyclones.30
Evaluation of the climate change implications for severe wind hazard have thus far produced inconclusive results.31
Other characteristics, such as maximum wave height, have been shown to be strongly linked to El Niño-Southern
Oscillation, and as such will depend upon the poorly understood relationship between climate change and
ENSO.32 One study has suggested that under future climates, cyclone generation will become more frequent
during El Niño events, but less frequent during La Niña events.33 Further research is required to better understand
potential changes in cyclone seasonality and routes, and the potential for cyclone hazards to be experienced in
unprecedented locations.
CLIMATE CHANGE IMPACTS
Natural Resources
Water
The Cook Islands utilize a diverse range of water sources, including local streams, rainwater capture, and groundwater
extraction. In some areas, communities are entirely dependent on rainwater. Extremes of both rainfall and
drought can present challenges to the Islands’ water supplies. Heavy rainfall can cause surface flooding which pulls
contaminants and sediment into the supply and gastric illnesses are known to increase in frequency.7 Droughts
can also lead to contamination of supplies, and present particular challenges when tourist numbers and hence
demand is high. Uncertainty in future rainfall projections presents challenges to decision makers. While the models’
best estimate is of an increase in the availability of freshwater, there is potential that this increase will manifest in
sporadic extreme rainfall events, and droughts will still be a problem. In this case disaster risk reduction remains
of high importance.
28
Walsh, K., McBride, J., Klotzbach, P., Balachandran, S., Camargo, S., Holland, G., Knutson, T., Kossin, J., Lee, T., Sobel, A., Sugi, M.
(2015). Tropical cyclones and climate change. WIREs Climate Change: 7: 65–89. DOI: https://doi.org/10.1002/wcc.371
29
Widlansky, M. J., Annamalai, H., Gingerich, S. B., Storlazzi, C. D., Marra, J. J., Hodges, K. I., . . . Kitoh, A. (2019). Tropical Cyclone
Projections: Changing Climate Threats for Pacific Island Defense Installations. Weather, Climate, and Society, 11(1), 3–15.
DOI: https://doi.org/10.1175/WCAS-D-17-0112.1
30
Wu, L., Wang, C., & Wang, B. (2015). Westward shift of western North Pacific tropical cyclogenesis. Geophysical Research Letters,
42(5), 1537–1542. DOI: https://doi.org/10.1002/2015GL063450
31
Siquera, A., Arthur, A., Woolf, M. (2014). Evaluation of severe wind hazard from tropical cyclones – current and future climate
simulations. Pacific-Australia Climate Change Science and Adaptation Planning Program. URL: http://datadiscoverystudio.org/
geoportal/rest/metadata/item/6cfcbc32c20448579f55edcd2a8383d1/html
32
Stephens, S. A., & Ramsay, D. L. (2014). Extreme cyclone wave climate in the Southwest Pacific Ocean: Influence of the El Niño
Southern Oscillation and projected climate change. Global and Planetary Change, 123, 13–26. https://doi.org/https://doi.org/
10.1016/j.gloplacha.2014.10.002
33
Chand, S. S., Tory, K. J., Ye, H., & Walsh, K. J. E. (2016). Projected increase in El Niño-driven tropical cyclone frequency in the Pacific.
Nature Climate Change, 7, 123. DOI: https://doi.org/10.1038/nclimate3181
CLIMATE RISK COUNTRY PROFILE: COOK ISLANDS 13On the Cook Islands’ atoll islands, such as Aitutaki, there is concern for the impact of sea-level rise on groundwater
supplies. Freshwater lenses are under threat from saline intrusion. Water resources in these areas can be exposed
to dual impacts. Alongside saline intrusion driven by rapid-onset high sea-levels, cyclones and the high wind speeds
they create, also threaten damage to rainwater capture systems. Freshwater quality can take a long time to recover
after disaster events.34 In addition to the introduction of high-cost hard infrastructure to protect residents, the Cook
Islands is taking forward nature-based approaches to flood mitigation such as coral restoration and tree planting
as part of its adaptation efforts.7
The Coastal Zone
Sea-level rise threatens significant physical changes to coastal zones around the world. Global mean sea-level
rise was estimated in the range of 0.44 meters (m)–0.74 m by the end of the 21st century by the IPCC’s Fifth
Assessment Report,35 however, some studies published more recently have highlighted the potential for greater
rises (Table 3). Sea-levels in the Cook Islands have already risen over 10 centimeters (cm) since 1950 and
are projected to rise at approximately the global average rate, with significant variation according to the future
TABLE 3. Estimates of global mean sea-level rise by rate and total rise compared to 1986–2005
including likely range shown in brackets, data from Chapter 13 of the IPCC’s Fifth Assessment
Report with upper-end estimates based on higher levels of Antarctic ice-sheet loss from Le Bars
et al. (2017).36
Rate of Global Mean Sea-Level Global Mean Sea-Level Rise in
Scenario Rise in 2100 2100 Compared to 1986–2005
RCP2.6 4.4 mm/yr (2.0–6.8) 0.44 m (0.28–0.61)
RCP4.5 6.1 mm/yr (3.5–8.8) 0.53 m (0.36–0.71)
RCP6.0 7.4 mm/yr (4.7–10.3) 0.55 m (0.38–0.73)
RCP8.5 11.2 mm/yr (7.5–15.7) 0.74 m (0.52–0.98)
Estimate inclusive of high-end Antarctic ice-sheet loss 1.84 m (0.98–2.47)
34
Terry, J. P., & Falkland, A. C. (2010). Responses of atoll freshwater lenses to storm-surge overwash in the Northern Cook Islands.
Hydrogeology Journal, 18(3), 749–759. URL: https://scholarbank.nus.edu.sg/handle/10635/49772
35
Church, J. a., Clark, P. U., Cazenave, A., Gregory, J. M., Jevrejeva, S., Levermann, A., . . . Unnikrishnan, A. S. (2013). Sea level change.
In Climate Change 2013: The Physical Science Basis. Contribution of Working Group I to the Fifth Assessment Report of the
Intergovernmental Panel on Climate Change (pp. 1137–1216). Cambridge, United Kingdom and New York, NY, USA: Cambridge
University Press. URL: https://www.ipcc.ch/site/assets/uploads/2018/02/WG1AR5_Chapter13_FINAL.pdf
36
Le Bars, D., Drijhout, S., de Vries, H. (2017). A high-end sea level rise probabilistic projection including rapid Antarctic ice sheet mass
loss. Environmental Research Letters: 12:4. URL: https://iopscience.iop.org/article/10.1088/1748-9326/aa6512
CLIMATE RISK COUNTRY PROFILE: COOK ISLANDS 14emissions pathway (Figure 7). Localized sea-level
rise can in fact be an extremely complex phenomenon FIGURE 7. The observed tide-gauge records
to measure and model, notably due to the influence of relative sea-level (since the late 1970s)
of large-scale climate phenomena such as ENSO. are indicated in purple, and the satellite
record (since 1993) in green. The gridded
Sea-level rise is not just a threat due to long-term (reconstructed) sea level data at the Cook
encroachment on coastal areas, but also due to the Islands (since 1950) is shown in black. Multi-
projected increase in the frequency of extreme sea- model mean projections from 1995–2100
level events.37 The return period of exceptionally high are given for the RCP8.5 (red solid line) and
sea-levels, driven by climate circulations, is expected RCP2.6 emissions scenarios (blue solid line),
to reduce and low-lying Pacific island nations are with the 5–95% uncertainty range shown by
particularly at risk.38 Studies have shown that the the red and blue shaded regions. The ranges
extent of wave-driven flooding is impacted by coral of projections for four emission scenarios
reef height and health, highlighting the importance of (RCPs 2.6, 4.5, 6.0, 8.5) by 2100 are also
coral conservation.39 Coastal erosion and inundation of shown by the bars on the right. The dashed
low-lying areas is a concern, particularly as the majority lines are an estimate of interannual variability
of development, and critical tourism infrastructure in sea level (5–95% uncertainty range about
is located in the coastal zone. Coastal erosion is the projections) and indicate that individual
already believed to be accelerating on Rarotonga due monthly averages of sea level can be above or
particularly to the declining health of the local corals, below longer-term averages.40
and human impacts on the coastal zone. The Cook (a)
120
Islands’ Third National Communication highlights 110 Cook Islands
the potential for the frequency of extreme sea-levels 100
Sea level relative to 1986-2005 (cm)
Reconstruction
90 Satellite altimeter
to double by the end of the 21st century.7 Adaptive 80 Tide gauges (3)
measures such as the construction of sea-walls have 70 Projections
60 RCP8.5
already been rolled-out in some areas, but these 50 RCP6.0
40 RCP4.5
come with their own impacts, including accelerating RCP2.6
30
nearby erosion rates.7 20
10
0
–10
–20
–30
1950 2000 2050 2100
Year
37
Widlansky, M. J., Timmermann, A., & Cai, W. (2015). Future extreme sea level seesaws in the tropical Pacific. Science Advances, 1(8).
DOI: https://doi.org/10.1126/sciadv.1500560
38
Vitousek, S., Barnard, P. L., Fletcher, C. H., Frazer, N., Erikson, L., & Storlazzi, C. D. (2017). Doubling of coastal flooding frequency
within decades due to sea-level rise. Scientific Reports, 7(1), 1399. DOI: https://doi.org/10.1038/s41598-017-01362-7
39
Beetham, E., Kench, P. S., & Popinet, S. (2017). Future Reef Growth Can Mitigate Physical Impacts of Sea-Level Rise on Atoll Islands.
Earth’s Future, 5(10), 1002–1014. URL: https://doi.org/10.1002/2017EF000589
40
Australian Bureau of Meteorology and CSIRO (2014). Climate Variability, Extremes and Change in the Western Tropical Pacific:
New Science and Updated Country Reports. Pacific-Australia Climate Change Science and Adaptation Planning Program Technical
Report, Australian Bureau of Meteorology and CSIRO, Melbourne, Australia. URL: https://www.pacificclimatechangescience.org/
wp-content/uploads/2014/07/PACCSAP_CountryReports2014_WEB_140710.pdf
CLIMATE RISK COUNTRY PROFILE: COOK ISLANDS 15Coral Reefs and Fisheries
FIGURE 8. Projected changes in aragonite
Calcium carbonite is used for the external skeletons
saturation state in the Northern (top)
of multiple marine organisms – for instance, plankton,
and Southern (bottom) Cook Islands from
coral reefs, and shell-fish. Increases in atmospheric
CMIP5 models under RCP2.6, 4.5 and 8.5.
carbon dioxide are understood to lead to reduced
Shown are the median values (solid lines),
levels of calcium carbonite saturation on the ocean’s
the interquartile range (dashed lines), and
service via an increase in ocean acidification and by
5% and 95% percentiles (light shading). The
decreasing carbonite ion concentrations. As a result,
horizontal line represents the threshold at
there are serious concerns that if carbonite minerals,
which transition to marginal conditions for
such as aragonite, become under saturated, it could
coral reef health typically occurs.8
undermine current ocean ecosystems.41 As shown in
Figure 8, only under the lowest emissions scenario 4.5
(RCP2.6) do aragonite saturation levels remain above 4
the threshold for healthy coral ecosystems. Under
Arag Sat. State
3.5
higher emissions scenarios conditions transition to Horizon
3
unsuitable for healthy coral by the 2050s. Such
Observations
potential changes may not factor in other reef 2.5
RCP2.6
RCP4.5
stressors, including other pressures of human 2 RCP8.5
exploitation, and impacts of ocean acidification, 2000 2020 2040 2060 2080 2100
Year
which are all also likely to affect the entire marine
ecosystem and impact the key ecosystem services
provided by reefs.
The fishing sector is a key component of the economy. Consumption is estimated at around 51 kilograms (kg) per
capita per year, and higher in land-poor areas, highlighting its critical importance providing dietary protein.42 While
the local fisheries are valued at around 2–3% of GDP, their importance for subsistence is high and perhaps
understated by this figure. In addition, foreign fishing vessels generally pay license fees which constituted around
11% of government income in 2014.43
41
Orr, J. C., Fabry, V. J., Aumont, O., Bopp, L., Doney, S. C., Feely, R. A., . . . & Key, R. M. (2005). Anthropogenic ocean acidification over
the twenty-first century and its impact on calcifying organisms. Nature, 437(7059), 681.
42
FAO (2018). Role of fish in food security in selected Pacific Island Countries. Food and Agriculture Organization of the united
Nations, policy brief No. 2 May 2018. URL: http://www.fao.org/publications/card/en/c/I9956EN/
43
Gillett, R. (2016). Fisheries in the economies of Pacific Island countries and territories. Chapter 32: Government Revenues from
Fisheries. Pacific Community/FFA/Australian Aid. URL: https://www.adb.org/sites/default/files/publication/27511/pacific-fisheries.pdf
CLIMATE RISK COUNTRY PROFILE: COOK ISLANDS 16Climate change and human resource exploitation represent a dual threat to fisheries. Species living in and around
coral reefs, either permanently or in their juvenile period, and particularly larger species, face an extinction threat.44
As a result of changes in temperature, dissolved oxygen, and acidity, the maximum catch potential of currently
resident species has been forecast to decline significantly in the Cook Islands, potentially by over 50%.45 However,
there is some evidence that the deep sea fisheries within Cook Islands’ exclusive economic zone may experience
some benefits. The migration range of tuna, for example, is expected to shift eastward across the Pacific pushing
tuna towards the Cook Islands.46 Given the potential disturbance to the Pacific fisheries there have been strong
calls for support to communities to identify suitable responses and financing mechanisms, and to adapt to the
changing marine environment.47
Island Ecology
The unique biodiversity of the Cook Islands is already under significant pressure resulting from human introduction
of non-native species, notably the Black Rat.48 Sea-level rise not only threatens humans residing on Pacific
islands, but also their unique ecosystem functions and ecology. Indeed, island biodiversity faces a variety of human
pressures.49 Research has shown that inundation of low-lying islands has the potential to remove important refuges
for migrating sea birds.50 In the case of the Cook Islands endemic bird species such as the Rarotonga starling are
already threatened. As climate changes so the suitable range for species to inhabit shifts, typically either upslope or
away from the equator. In the Island environment the capacity for species to shift is extremely limited and as such
loss and extinction are becoming increasingly likely. Major concerns have been raised for the terrestrial ecology of
low-lying Pacific islands, for example endemic lizards, which may become trapped in a shrinking habitat.51 Research
has also highlighted the risks to biodiversity in the Pacific through study of tree richness in New Caledonia, where
the range sizes of 87%–96% of species was projected to decline, typically by 52%–84%.52
44
Mellin, C., Mouillot, D., Kulbicki, M., McClanahan, T. R., Vigliola, L., Bradshaw, C. J. A., . . . Caley, M. J. (2016). Humans and seasonal
climate variability threaten large-bodied coral reef fish with small ranges. Nature Communications, 7(1), 10491. DOI: https://doi.org/
10.1038/ncomms10491
45
Asch, R. G., Cheung, W. W. L., & Reygondeau, G. (2018). Future marine ecosystem drivers, biodiversity, and fisheries maximum
catch potential in Pacific island countries and territories under climate change. Marine Policy, 88, 285–294. URL: https://
www.sciencedirect.com/science/article/abs/pii/S0308597X17301409?via%3Dihub
46
Bell, J., Taylor, M., Amos, M., and Andrew, N. (2016). Climate change and Pacific Island food systems. CCAFS and CTA. Copenhagen,
Denmark and Wageningen, the Netherlands. URL: https://ccafs.cgiar.org/resources/publications/climate-change-and-pacific-
island-food-systems
47
Hanich, Q., Wabnitz, C. C. C., Ota, Y., Amos, M., Donato-Hunt, C., & Hunt, A. (2018). Small-scale fisheries under climate change in
the Pacific islands region. Marine Policy, 88, 279–284. URL: https://ro.uow.edu.au/lhapapers/3351/
48
Easby, C., and Compton, S. (2013). Spatial Distribution and Abundance of the Rarotonga Starling in the Cook Islands (Pacific
Islands). In Biodiversity and Societies in the Pacific Islands eds. Larrue, S., and Dahl, A. Presses Universitaires de Provence.
URL: https://www.researchgate.net/profile/Stephen_Compton/publication/259921133_Spatial_Distribution_and_Abundance_
of_the_Rarotonga_Starling_in_the_CookIslands_Pacific_Islands/links/00b7d52e8a6fe47330000000/Spatial-Distribution-and-
Abundance-of-the-Rarotonga-Starling-in-the-CookIslands-Pacific-Islands.pdf
49
Jupiter, S., Mangubhai, S., & Kingsford, R. T. (2014). Conservation of Biodiversity in the Pacific Islands of Oceania: Challenges and
Opportunities. Pacific Conservation Biology, 20(2), 206–220. URL: https://citeseerx.ist.psu.edu/viewdoc/download?doi=
10.1.1.908.8776&rep=rep1&type=pdf
50
Reynolds, M. H., Courtot, K. N., Berkowitz, P., Storlazzi, C. D., Moore, J., & Flint, E. (2015). Will the Effects of Sea-Level Rise Create
Ecological Traps for Pacific Island Seabirds? PLOS ONE, 10(9), 1–23. DOI: https://doi.org/10.1371/journal.pone.0136773
51
Taylor, S., & Kumar, L. (2016). Global Climate Change Impacts on Pacific Islands Terrestrial Biodiversity: A Review. Tropical
Conservation Science, 9(1), 203–223. URL: https://doi.org/10.1177/194008291600900111
52
Pouteau, R., & Birnbaum, P. (2016). Island biodiversity hotspots are getting hotter: vulnerability of tree species to climate change in
New Caledonia. Biological Conservation, 201, 111–119. URL: https://agris.fao.org/agris-search/search.do?recordID=FR2017101025
CLIMATE RISK COUNTRY PROFILE: COOK ISLANDS 17You can also read