A glimpse into the future of exposure and vulnerabilities in cities? Modelling of residential location choice of urban population with random ...
←
→
Page content transcription
If your browser does not render page correctly, please read the page content below
Nat. Hazards Earth Syst. Sci., 21, 203–217, 2021
https://doi.org/10.5194/nhess-21-203-2021
© Author(s) 2021. This work is distributed under
the Creative Commons Attribution 4.0 License.

A glimpse into the future of exposure and vulnerabilities
in cities? Modelling of residential location choice
of urban population with random forest
Sebastian Scheuer1 , Dagmar Haase1,3 , Annegret Haase2 , Manuel Wolff1 , and Thilo Wellmann1,3
1 LandscapeEcology Lab, Geography Department, Humboldt-Universität zu Berlin, 10099 Berlin, Germany
2 Department of Urban and Environmental Sociology, Helmholtz Centre for Environmental Research – UFZ,
04318 Leipzig, Germany
3 Department of Computational Landscape Ecology, Helmholtz Centre for Environmental Research – UFZ,

04318 Leipzig, Germany

Correspondence: Sebastian Scheuer (sebastian.scheuer@geo.hu-berlin.de)

Received: 26 June 2020 – Discussion started: 10 July 2020
Revised: 21 October 2020 – Accepted: 11 November 2020 – Published: 21 January 2021

Abstract. The most common approach to assessing natural            1   Introduction
hazard risk is investigating the willingness to pay in the pres-
ence or absence of such risk. In this work, we propose a new,      In the human-environmental system, disaster risk arises from
machine-learning-based, indirect approach to the problem,          the interactions of different system components (Zscheis-
i.e. through residential-choice modelling. Especially in urban     chler et al., 2018). The Hyogo Framework for Action 2005–
environments, exposure and vulnerability are highly dynamic        2015 maintains that disaster risk stems from the interaction
risk components, both being shaped by a complex and con-           of a hazard with exposed physical, socioeconomic and en-
tinuous reorganization and redistribution of assets within the     vironmental vulnerabilities (UNISDR, 2007), consequently
urban space, including the (re-)location of urban dwellers. By     referring to the potential fatalities and losses in livelihoods,
modelling residential-choice behaviour in the city of Leipzig,     health, assets, and services. Urban processes such as not only
Germany, we seek to examine how exposure and vulnerabil-           the expansion into potentially hazardous areas but also gen-
ities are shaped by the residential-location-choice process.       trification or densification shape exposure and vulnerabilities
The proposed approach reveals hot spots and cold spots of          of services and assets within urban areas in a highly dynamic
residential choice for distinct socioeconomic groups exhibit-      manner and are thus at the basis of urban disaster risk. Hence,
ing heterogeneous preferences. We discuss the relationship         incorporating these urban processes more specifically into
between observed patterns and disaster risk through the lens       disaster risk assessment promises potential for more holistic
of exposure and vulnerability, as well as links to urban plan-     perspectives.
ning, and explore how the proposed methodology may con-               Disaster risk R is conceived as a function of the in-
tribute to predicting future trends in exposure, vulnerability,    teracting, interdependent risk component hazard H , expo-
and risk through this analytical focus. Avenues for future re-     sure E, and vulnerability V , expressed as R = H × E × V
search include the operational strengthening of these link-        (Brauch, 2011; UNISDR, 2015; Zscheischler et al., 2018).
ages for more effective disaster risk management.                  Here, hazard refers to potentially damaging physical events
                                                                   or latent conditions representing future threats of natural,
                                                                   human-natural (environmental), or human origin (UNISDR,
                                                                   2007). Exposure denotes the physical aspects of disaster risk
                                                                   (UNISDR, 2004), referring to the socioeconomic and demo-
                                                                   graphic spatiotemporal fabric, i.e. assets such as population
                                                                   or the built environment that are potentially affected by a

Published by Copernicus Publications on behalf of the European Geosciences Union.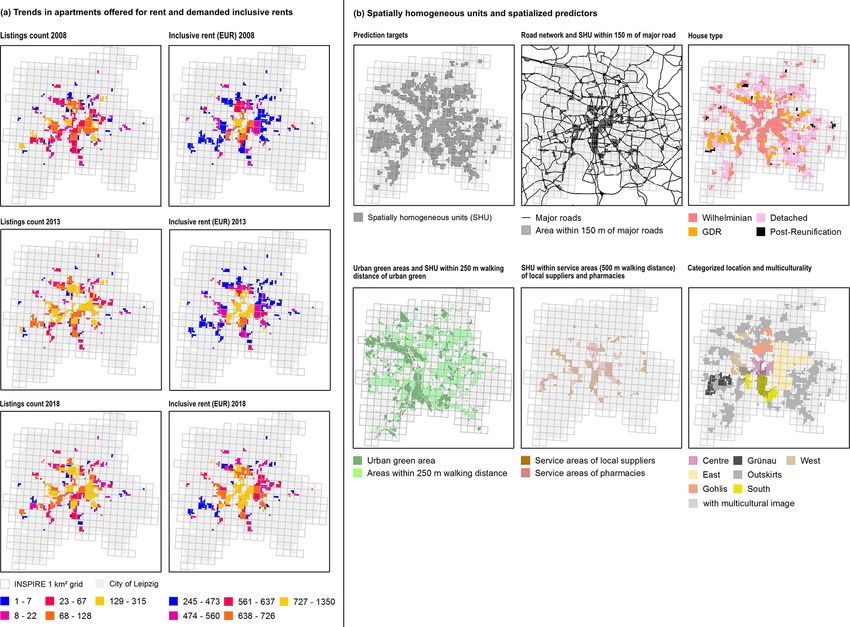
204                    S. Scheuer et al.: Modelling of residential location choice of urban population with random forest

hazardous event (Brauch, 2011; Dilley et al., 2005; Villa-         increasing polarization, and growing inequalities (Braubach
grán de León, 2006). Vulnerability embraces the predispo-          and Fairburn, 2010; Broitman and Koomen, 2015; Mustafa
sition or propensity to be adversely affected, i.e. those physi-   et al., 2018; Pelling, 2011; Smith, 2002). In this context, ur-
cal, socioeconomic, and environmental conditions leading to        ban disaster risk is also driven by demographic changes and
(an increase in) the susceptibility of elements or fragility of    shifts (ageing) as well as by the impacts of conditions of
elements exposed to hazards (Carreño et al., 2017; UNISDR,         the natural and built environment on human wellbeing and
2007). Disaster risk is consequently driven by the specifics of    human health (Giles-Corti et al., 2016; Hunter et al., 2019;
hazardous conditions, i.e. hazard extent, severity, and return     Sarkar and Webster, 2017).
period (Fuchs et al., 2013), as well as by (changes in) expo-         The aforementioned processes bring about the substantial
sure and the degree of vulnerability (Cardona et al., 2012).       reorganization of urban structures and functions and the re-
In the case of extreme events, disaster risk is mostly condi-      distribution of activities and assets in cities (Harvey, 2009).
tioned by exposure (UNISDR, 2015). H , E, and V are dy-            This also effects changes in individual self-selections, pref-
namic over time and across spatial scales and are thus non-        erences, and attitudes, e.g. regarding the choice of residen-
stationary (Fuchs et al., 2013). This gives rise to considerable   tial location and household mobility (Aslam et al., 2019).
uncertainty in the assessment of future risks (Cardona et al.,     It has been estimated that, overall, in North America, Aus-
2012; Sarhadi et al., 2016; Westra et al., 2010; Zscheischler      tralia, and New Zealand, the share of households moving
et al., 2018), thus calling for a more holistic, combined as-      annually is about 15 % to 20 % and in Europe is 5 % to
sessment of all relevant risk drivers (Fuchs et al., 2013; Win-    10 % (Knox and Pinch, 2010). Household mobility is typ-
semius et al., 2016).                                              ically characterized as a two-step process, i.e. the decision
   Whilst climatic drivers, encompassing both natural vari-        to seek a new residence and its actual selection (Kim et al.,
ability and anthropogenic climate change, affect the magni-        2005; Knox and Pinch, 2010). A comprehensive body of
tude and (joint) probability of (compound) hazardous events        literature on residential choice adopts stated-preference ap-
(Carrão et al., 2018; Sarhadi et al., 2016, 2018; Zscheis-         proaches and discrete-choice modelling to study this deci-
chler et al., 2018), non-climatic drivers including socioeco-      sion process and the corresponding determinants of resi-
nomic and demographic development with resulting land-             dential location choice. This includes case studies, e.g. for
use changes shape exposure as well as vulnerability (Elmer         Burkina Faso (Traoré, 2019), China (Wu, 2004), Colombia
et al., 2012; Fuchs et al., 2013). Particularly high levels of     (Stokenberga, 2019), Germany (Heldt et al., 2016), Israel
or increases in exposure and vulnerability are found in the        (Frenkel et al., 2013), the Netherlands (Ettema and Nieuwen-
global urban land (Pelling, 2011; Scheuer et al., 2017). Ur-       huis, 2017), Pakistan (Aslam et al., 2019), or the UK (Kim
ban areas as complex, highly dynamic, and integrated sys-          et al., 2005; Walker et al., 2002). McFadden (1978) describes
tems are particularly prone to hazards, which pose threats         the choice of housing location as a rational, complex decision
to physical assets as well as economic, social, and politi-        based on multiple dwelling characteristics such as the num-
cal activities; disadvantaged populations and the urban poor;      ber of rooms or types of appliances, as well as location or
critical infrastructures; livelihoods; and households (Pelling,    neighbourhood attributes such as proximity to green spaces
2011; Scheuer et al., 2017). This is due to various interlink-     and the accessibility to places of work, commerce, educa-
ing economic, social, and spatial processes, e.g. the accumu-      tion, and transportation. It is consequently recognized that
lation of capital, the increasing interconnectedness of places,    residential location choice and hence residential mobility and
and increasing individualization as well as urban growth and       migration are driving (intra-urban) spatial (re)structuring and
expansion (Cardona et al., 2012; Castells, 2002; Scheuer           thus exposure and vulnerabilities (Hunter, 2005; Kim et al.,
et al., 2017; UNISDR, 2015). For instance, from a global           2005; Wu, 2004).
perspective, almost 90 % of the anticipated urban growth              Yin (2010) additionally highlights the role of land-use
is expected in regions with limited economic development           policies and population densities in the residential-location-
and thus comparatively high vulnerability including e.g. the       choice process and the urban–rural gradient patterns emerg-
small- to medium-sized cities of Africa and Asia (Scheuer          ing from this process. A substantial body of research studies
et al., 2016; Seto et al., 2013; UNDESA, 2019).                    this nexus of household perceptions on environmental ameni-
   As recognized for instance by Castells (2002), Smith            ties and disamenities – i.e. risks – and their role in residential
(2002), or Harvey (2009), these global phenomena are linked        location choice (Braubach and Fairburn, 2010; Ewing et al.,
down to the local level through their repercussions on the ur-     2005; Hunter, 2005) (Zhang, 2010, for a comprehensive list
ban form. Consequently, also from this local perspective, ex-      of references). For example, in the case of less developed
posure is governed firstly by urban population growth and the      countries, in-migration and residential location choice within
expansion of urban land. However, exposure is also shaped          hazard-prone areas is often the result of the lack of coordina-
by multiple processes such as neighbourhood redevelop-             tion of urban development; informality of large parts of the
ments and urban and economic restructuring, gentrification,        residential sector; lack of institutional capacities; failed risk
infill, densification, or decay as well as (intra-urban) mobil-    governance; lack of financial capacities; housing-market dis-
ity and (rural–urban) migration, social–spatial segregation,       crimination; and lack of knowledge, awareness and risk per-

Nat. Hazards Earth Syst. Sci., 21, 203–217, 2021                                    https://doi.org/10.5194/nhess-21-203-2021
S. Scheuer et al.: Modelling of residential location choice of urban population with random forest 205
ception of disadvantaged populations (Hunter, 2005; Zhang, ing these predictions to elicit spatial patterns of residential
2010). However, in the case of the more developed countries, choice and their change over time. In so doing, this case study
it is also highlighted that risks and potential losses are of- seeks to address the following research questions:
ten accepted due to locational benefits (Hunter, 2005; Zhang,
2010) or outweighed by environmental amenities such as 1. Does residential-choice modelling allow us to identify
riparian areas, lake shores, or scenic views (Benson et al., spatial patterns of exposure, e.g. hot spots of (vulnera-
2000; Yin, 2010). ble) socioeconomic groups? How are these spatial pat-
Most approaches that investigate the nexus between res- terns of exposure and thus vulnerabilities shaped by the
idential housing choice and hazard risk assume an indirect heterogeneity of preferences as a function of the socioe-
approach, i.e. the hedonic price model and associated regres- conomic status of urban dwellers?
sion methods (Zhang, 2010). Hereby, physical housing at-
2. Can residential-choice modelling contribute to the es-
tributes and locational and neighbourhood characteristics as
timation of changes in exposure and vulnerabilities by
well as environmental attributes – such as the level of expo-
detecting trends in the spatial distribution of vulnerable
sure, risk, or expected losses – are considered in the deriva-
groups?
tion of a willingness to pay (Xiao, 2017). Whilst following
Zhang (2010) some empirical findings suggest that residents’
In so doing, this case study aims to bring disaster risk assess-
willingness to pay is indeed lower in hazard-prone areas; it
ment forward by making manifold and complex urban dy-
is also remarked that this evidence base is not at all clear-cut.
namics that shape the spatial distribution of urban dwellers
Direct approaches, e.g. using household surveys, thus aim to
and that consequently drive urban exposure and vulnerabili-
directly identify the respondents’ main motivations and de-
ties more accessible in the assessment process.
cision factors for a specific location choice and the role that
hazard exposure and risk play in them (Zhang, 2010).
This paper seeks to bring together the study of residen- 2 Materials and methods
tial housing choice and the school of natural hazard risk as-
sessment by an indirect, machine-learning-based approach. Predictors for residential choice include spatial as well as
Unlike the aforementioned approaches, it is not the focus of non-spatial housing attributes, namely inclusive rent, loca-
this case study to estimate the willingness to pay in the pres- tion, number of rooms, total size, furnishing features, and
ence or absence of natural hazard risk. It is also not aiming house type – i.e. the structure type of the apartment building
to elicit risk awareness e.g. of households on the move. In- – and neighbourhood amenities such as the presence of ma-
stead, it is proposed to explore the means and insights that jor roads, urban green areas, or local suppliers. Additionally,
residential-location-choice modelling offers for the identifi- various household attributes including income, employment
cation of spatial hot spots of exposure and/or vulnerabilities status, qualification, and age are used for this prediction. The
and – by extension – how identifying current shifts in these spatialization of the random forest model by Scheuer et al.
patterns may hint at future trends in exposure and vulnerabil- (2020) necessitates that the real-estate data provided by Boel-
ity, which we consider fundamental information for disaster mann et al. (2019) are re-coded, e.g. regarding categorial pre-
risk assessment. The study presented in this paper builds on dictor variables, and geolocated. Hence, the methodology ap-
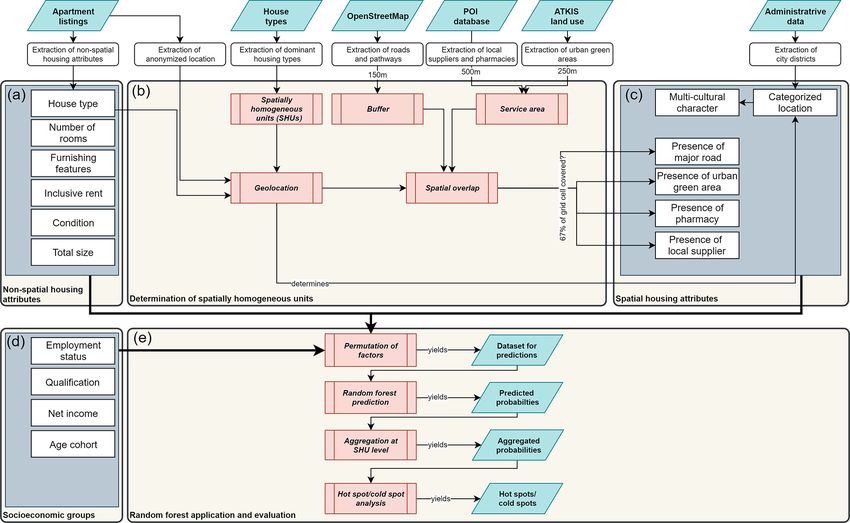
a case study by Scheuer et al. (2020) that – akin to a stated- plied in this case study embraces the following steps (Fig. 1):
preference approach – modelled residential-choice behaviour (i) extraction of non-spatial housing attributes, i.e. the char-
towards hypothetical apartment listings in the city of Leipzig, acteristics of each actual apartment, from the scientific-use
Germany. To do so, Scheuer et al. (2020) use a random forest file provided by Boelmann et al. (2019; see Table 1); (ii) de-
model (Breiman, 2001) that models residential choice as the termination of spatially homogeneous units for the geoloca-
likelihood of a positive or negative decision outcome includ- tion of prediction targets; (iii) determination of spatial hous-
ing considering the heterogeneity of preferences, i.e. the vari- ing attributes based on ancillary data (Table 1); (iv) formula-
ation in housing preferences across individuals and socioeco- tion of a set of socioeconomic profiles to account for hetero-
nomic groups (Hoshino, 2011). Random forests allow the use geneity of preferences (Table 2); and (v) application of the
of large sets of mixed data and have proved to be robust and pre-trained random forest model to predict the likelihoods of
efficient classification models that often outperform individ- positive residential-choice outcomes. To evaluate changes in
ual decision trees or regression models (Antipov and Pokry- residential choice over time, this case study considers three
shevskaya, 2012; see Tyralis et al., 2019, and Hastie et al., reference years: 2008/09, 2013/14, and 2018/19. In the fol-
2009, for more comprehensive reviews of random forests and lowing, each methodological step is described in more detail.
other machine-learning algorithms). This case study goes be- First, the non-spatial housing attributes house type, num-
yond the previous work by making predictions of residential ber of rooms, furnishing features, inclusive rent (rent includ-
choice for actual real-estate data in the form of apartments ing heating costs), condition, and total size (Table 1) were
advertised for rent on a common internet platform called Im- determined from the apartment advertisements listed in the
mobilienScout24 (Boelmann et al., 2019), and by spatializ- scientific-use file (Fig. 1a). As shown in Table 1, all housing
https://doi.org/10.5194/nhess-21-203-2021 Nat. Hazards Earth Syst. Sci., 21, 203–217, 2021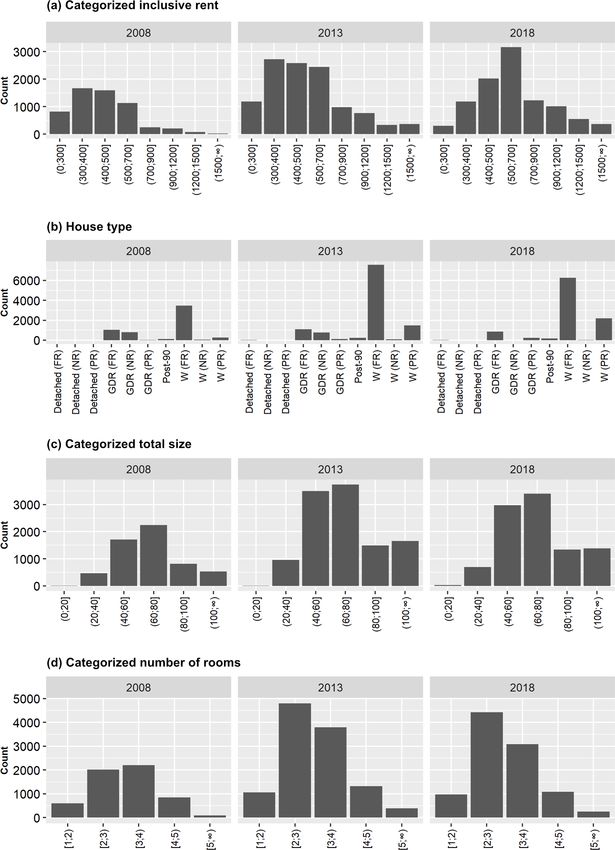
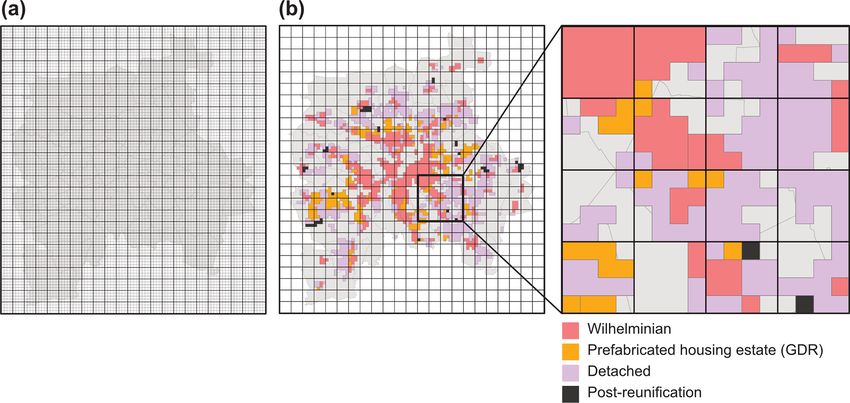
206                      S. Scheuer et al.: Modelling of residential location choice of urban population with random forest

Figure 1. Data (pre-)processing for the prediction of residential-choice behaviour. (a) Non-spatial housing attributes are elicited directly
from the apartment advertisements (Boelmann et al., 2019; see Table 1). (b) Identification of spatially homogeneous units and estimation of
neighbourhood amenities per spatially homogeneous unit based on the spatial overlap of buffer and service areas of major roads, urban green
areas, pharmacies, and local suppliers. Geolocation of advertised apartments within these spatially homogeneous units; (c) determination of
spatial housing attributes as a function of the properties of the corresponding spatially homogeneous unit; (d) based on a set of formulated
socioeconomic profiles, household attributes are created. (e) Permutation of predictor factors and subsequent application and evaluation of
the random forest model.

attributes except furnishing features have a one-to-one cardi-          a predominant (unique) house type, and (iii) the presence or
nality; i.e. each advertised apartment has exactly one inclu-           absence of each individual spatial housing attribute. Areas
sive rent, a specific number of rooms, etc. A given apartment           of residential land use were determined from official topo-
may however have multiple furnishing features, such as a fit-           graphic land-use data ATKIS (BKG, 2018). The predominant
ted kitchen, courtyard or garden, and so forth. This consti-            house type for each grid cell was subsequently derived by in-
tutes a one-to-many relationship.                                       tersecting the 250 m×250 m grid with a dataset by Haase and
   Second, prediction targets, i.e. the individual advertised           Nuissl (2007) that describes the urban structure of the city of
apartments, need to be geolocated. The geolocation of each              Leipzig by a combination of land-use and (residential) house
apartment typically corresponds to its address. However, in             types, e.g. “single and semi-detached houses” or “prefabri-
the provided scientific-use file, due to privacy protection, the        cated housing estates”. House types were consequently as-
actual address is anonymized and coded to a 1 km2 grid cell             signed to each grid cell of the 250 m×250 m grid through the
location in the European standard ETRS89-LAEA. Such a                   intersection. Then, the grid cells with common types of hous-
coarse spatial resolution obviously has limits, particularly in         ing within each original 1 km2 grid cell were merged, and
complex urban environments. To overcome this limitation,                in so doing, the SHUs were identified (Fig. 2). As shown in
we suggest increasing the spatial resolution through a map-             Fig. 2, it needs to be noted that as the final delineation of each
ping of apartment locations to so-called spatially homoge-              SHU depends on the predominant house type, the size of the
neous units (SHUs). SHUs were identified on the basis of                resulting SHU must not correspond to a single 250 m×250 m
a grid with a spatial resolution of 250 m × 250 m instead of            grid cell but may comprise more than one sub-cell.
1000 m × 1000 m; i.e. each grid cell of the original 1 km2                 In a next step, each SHU was assigned spatial housing at-
grid was divided into 16 sub-cells. An SHU is character-                tributes, i.e. the presence or absence of major roads as well as
ized by the following properties: (i) residential land use, (ii)        of the neighbourhood amenities of green urban areas, phar-

Nat. Hazards Earth Syst. Sci., 21, 203–217, 2021                                          https://doi.org/10.5194/nhess-21-203-2021
S. Scheuer et al.: Modelling of residential location choice of urban population with random forest                                    207

Figure 2. Delineation of spatially homogeneous units (SHUs) based on house types. (a) Study area overlaid with the 1 km2 INSPIRE grid
used in the scientific-use file (Boelmann et al., 2019) for geolocating advertised apartments (bold lines) and the 250 m × 250 m grid used
as basis for the delineation of SHU (thin lines); (b) SHU obtained by dissolving the intersection of the 250 m × 250 m grid and the urban
structure and land-use dataset by Haase and Nuissl (2007). As the detail shows, the final size of each SHU may vary considerably, depending
on the homogeneity or heterogeneity of urban structure and corresponding predominant house types within each ETRS89-LAEA 1 km2 grid
cell. GDR refers to the German Democratic Republic.

macies, and local suppliers. It follows that similarly to fur-             Third, as a function of this geolocation, spatial housing at-
nishing features, neighbourhood amenities constitute an at-             tributes for each apartment listing were determined by the
tribute with a one-to-many cardinality, where the presence of           properties of the corresponding SHU. Moreover, the catego-
a given amenity was affirmed if at least 67 % of an SHU was             rized location as well as multiculturality was determined (see
within one of the following (see Fig. 1b and Table 1):                  Fig. 1c and Table 1).
                                                                           Fourth, to account for heterogeneity of preferences and in
  – A 150 m buffer area to major roads. This distance                   this way for different degrees of vulnerability (Table 2), pre-
    threshold is in line with the literature that suggests that         dictions are carried out for a set of socioeconomic groups
    air pollutant concentrations are highest within this dis-           that are characterized by employment status, qualification,
    tance to major roads (Balmes et al., 2009) and is fur-              net income, and age (Fig. 1d). In so doing, the shaping of ex-
    ther supported by studies stating increased health risks –          posure and vulnerabilities – and subsequently disaster risk –
    e.g. regarding obstetrical complications (Yorifuji et al.,          through residential choice can be illuminated as a function
    2015), decreased lung function in adults (Balmes et al.,            of these household characteristics. The attributes for each
    2009), or neurological disease incidence (Chen et al.,              socioeconomic group were chosen from the factor distribu-
    2017) – within up to 200 m of major roads.                          tions, i.e. mode, of the sampled dataset used by Scheuer et al.
                                                                        (2020) for random forest training. The hazard-specific de-
  – The service area of urban green areas. This is defined
                                                                        gree of vulnerability, as exemplarily postulated in Table 2,
    by a walking distance of 250 m, a threshold in line with
                                                                        is a compound based on the age and income characteristics
    recommendations that urban green areas should be ac-
                                                                        of each socioeconomic group. Regarding flood hazards, the
    cessible within no more than a 300 m linear (buffer) dis-
                                                                        estimated degree of vulnerability follows empirical findings
    tance or an approximately 5 min walk (WHO Regional
                                                                        by Steinführer and Kuhlicke (2007), whereas for heat stress,
    Office for Europe, 2016)/
                                                                        vulnerability is based on Heaton et al. (2014). In both cases,
  – The service areas of local suppliers or pharmacies. This            older persons feature generally higher degrees of vulnerabil-
    is defined by a walking distance of 500 m or an approx-             ity. Likewise, more deprived or disadvantaged groups feature
    imately 10 min walk (Hoshino, 2011; BBSR, 2015).                    higher vulnerabilities compared to less disadvantaged ones.
                                                                           Fifth, applying the pre-trained random forest model
The advertised apartments were then geolocated to a given               (Fig. 1e) that is implemented in the R package ran-
SHU within their coded 1 km2 grid cell by the matching of               domForestSRC (Ishwaran et al., 2008), the predicted
house types.                                                            probability p for a positive residential choice is then
                                                                        a function of factor combinations: p = f (house type,

https://doi.org/10.5194/nhess-21-203-2021                                         Nat. Hazards Earth Syst. Sci., 21, 203–217, 2021
208 S. Scheuer et al.: Modelling of residential location choice of urban population with random forest
Table 1. Types, variables, description, cardinality, and source of data.
Variable Description Comment Cardinality∗ Source
Size Classified size The total size (area in m2 ) of the apart- 1:1 Boelmann et al. (2019)
ment.
Non-spatial housing predictors
Rooms Classified number of The total number of rooms of each 1:1
rooms apartment.
Rent Classified inclusive rent The inclusive rent is the exclusive rent 1:1
including heating costs in EUR.
Furnishing Availability of a courtyard Furnishing characteristics of the apart- 1:n
features or garden, fitted ment.
kitchen, or insulation
Condition Classified condition of the Indicates if apartment is fully reno- 1:1
apartment vated (first occupancy (after reconstruc-
tion), like new, reconstructed, modern-
ized, completely renovated), partly ren-
ovated (well-kept), or not renovated
(needs renovation, by arrangement, di-
lapidated)
House type Building structure type Re-classified to factors Wilhelminian, 1:1 Haase and Nuissl
detached, GDR, and post-reunification (2007)
as required by the random forest model.
Categorized Classified city district Assignment of class as a direct function 1:1 Stadt Leipzig, Amt für
location of the geolocation Statistik und Wahlen
(2017)
Spatial housing predictors
Neighbour- Major road (roads equiv- 150 m buffer of major road OpenStreetMap,
hood alent to types motorway, BKG (2018)
1:n
amenities primary road, secondary
road, tertiary road, trunk
(including corresponding
links))
Urban green area (recre- 250 m walking distance service area
ational and sport areas,
shrubs, forests)
Local suppliers 500 m walking distance service area Self-compiled database
Pharmacies
Multiculturality Multicultural image as a function of cat- Own classification
egorized location
∗ A one-to-one cardinality is indicated by 1 : 1; a one-to-many cardinality is indicated by 1 : n.
rooms, size, rent, features, location, amenities, each apartment, the factor values of all predictors with a
employment, qualification, income, age). For this ran- one-to-many cardinality – i.e. furnishing features m and
dom forest model, the rate of success, i.e. the share of all neighbourhood amenities a – were permuted to obtain all
correct predictions including both negative and positive a · m factor combinations. E.g. a given apartment features
outcomes, is shown to be approximately 78 %; however, both a garden and a fitted kitchen, so m = 2. If this apart-
precision – i.e. the share of correct positive choices – is ment is then located near both an urban green area and
lower at approximately 26 %. This is however comparable to local suppliers, also a = 2, and predictions thus need to be
other prediction models, such as binary logistic regression carried out for all four possible combinations of factors, with
(Scheuer et al., 2020). It is also important to note that the the values of all remaining predictors being held constant.
random forest model allows for only a single factor value The predicted likelihoods of residential choice for all factor
per predictor variable. To overcome this limitation, for combinations were subsequently averaged per apartment and
Nat. Hazards Earth Syst. Sci., 21, 203–217, 2021 https://doi.org/10.5194/nhess-21-203-2021S. Scheuer et al.: Modelling of residential location choice of urban population with random forest 209
Figure 3. Characterization of the apartments offered for rent regarding predictors (a) categorized inclusive rent (rent including heating costs),
(b) house type, (c) categorized total size, and (d) categorized number of rooms. For house type, GDR is equal to prefabricated housing estates,
post-90 to buildings constructed post-reunification, and W to Wilhelminian-style buildings. For each house type, the condition is indicated
in brackets: FR = fully renovated; PR = partly renovated; NR = not renovated. Note that condition is not differentiated for post-reunification
buildings due to the random forest training data.
then aggregated at the level of SHUs for further analysis, 3 Results
including hot-spot and cold-spot analysis using local G*
statistics (Ord and Getis, 1995) as implemented in the R Figure 3 summarizes the non-spatial housing attributes of the
package spdep (Bivand and Wong, 2018). advertised apartments. A total of N = 25 579 apartment list-
ings were considered in this analysis; for the period 2008/09,
n2008 = 5468; for 2013/14, n2013 = 10 803; and for 2018/19,
n2018 = 9308 (Fig. 4). In this context, it is important to note
that this does not necessarily correspond to the number of
https://doi.org/10.5194/nhess-21-203-2021 Nat. Hazards Earth Syst. Sci., 21, 203–217, 2021210 S. Scheuer et al.: Modelling of residential location choice of urban population with random forest
.
Figure 4. Trends in the number of apartments offered for rent and demanded inclusive rent (EUR) averaged per SHU, per time step (a);
identified SHU as prediction targets and modelled spatial housing attributes (b).
apartments available for rent. Instead, a single apartment ties, including the categorized location and multiculturality
could be advertised multiple times, e.g. in the case of short as well as proximity to or the presence of the neighbourhood
rental periods. The listings were geolocated to 132 different amenities of major roads, urban green areas, local suppliers,
SHUs, out of a total of 455 SHUs identified across the whole and pharmacies, are visualized in Fig. 4.
city of Leipzig. Only 7 % of all SHUs feature a multicultural image. Most
As shown in Fig. 3, listings include mostly apartments SHUs are attributed to being dominated by single or semi-
with a size of between 40 and 80 m2 and with two to four detached housing (41.3 %), followed by multi-storey tene-
rooms. The highest share is of the Wilhelminian house type ment blocks and Wilhelminian house types (33.4 %), prefab-
– i.e. multi-storey tenement blocks – followed by buildings ricated GDR housing estates (20.4 %), and post-reunification
constructed in the GDR, i.e. prefabricated housing estates, residential parks (4.9 %). This contrasts with the house types
and residential parks constructed post-reunification in the offered, which were majorly Wilhelminian style, whilst there
1990s. In 2008 and 2013, a considerable number of apart- are only few offers of single or semi-detached housing; this
ments in GDR-type housing were offered in a rather bad con- could also explain the high number of SHUs in which no
dition, i.e. not renovated or requiring renovation. This num- advertisements were geolocated. The median relative SHU
ber declined substantially in the following period until 2018. area covered by the buffer area to major roads is equal to
The majority of Wilhelminian housing is offered in good 60.8 % (mean 56.3 %); about 42.4 % of all SHUs are con-
condition (fully renovated), although a considerable amount sidered to be within 150 m of major roads. The median cov-
is also categorized as only partially renovated. This is due to erage of SHUs by the service areas of urban green spaces
the rental object being categorized as only well-kept. Spatial is equal to 75.3 % (mean 67.1 %); more than half of the de-
housing attributes in the form of the derived SHU proper- rived SHUs (about 60.9 %) are located within 250 m walking
Nat. Hazards Earth Syst. Sci., 21, 203–217, 2021 https://doi.org/10.5194/nhess-21-203-2021S. Scheuer et al.: Modelling of residential location choice of urban population with random forest 211
Table 2. Set of household predictors in the form of socioeconomic profiles to represent societal groups differentially vulnerable and/or at
risk.
Profile name Socioeconomic characteristics Degree of vulnerability
Employment Qualification Categorized net Categorized Flooding Heat stress
status income (EUR) age
Young adults In education In education < 600 20–30 Comparatively Comparatively
in education lower lower
Academic Full-time University > 3100 30–40 Comparatively Comparatively
professionals employment degree lower lower
Middle-aged Part-time Skilled 1100–1600 40–50 Comparatively Comparatively
workers employment worker lower higher
Precarious Unemployed Without < 600 30–40 Comparatively Comparatively
unemployed professional higher higher
persons qualification
Pensioners Retired Skilled 600–1100 60–70 Comparatively Comparatively
worker higher higher
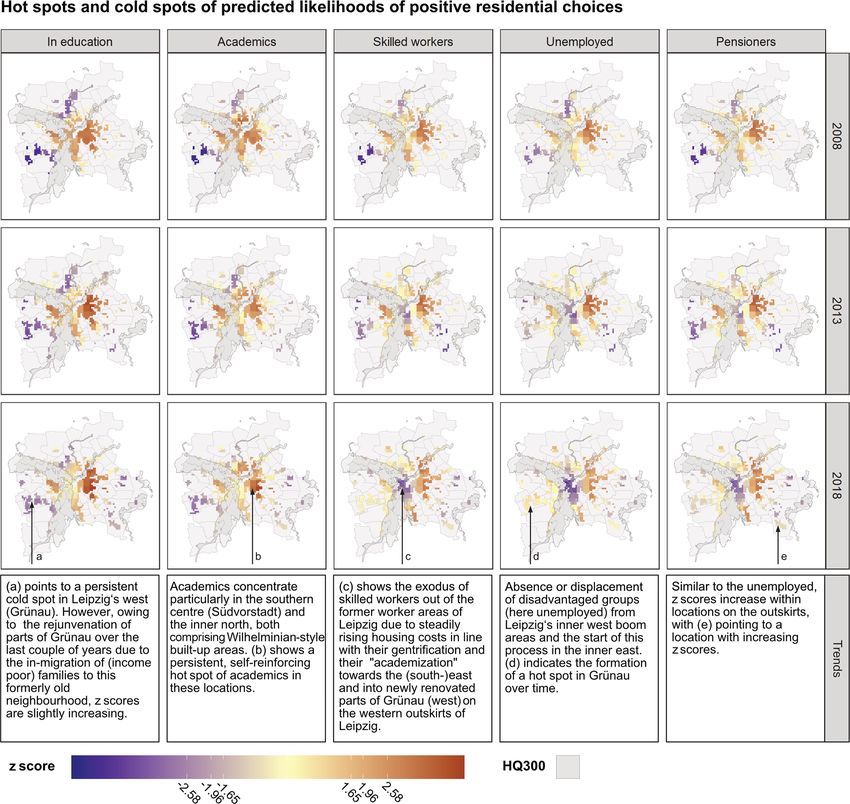
distance of urban green areas. The median areas covered by In 2008, the spatial distribution of hot spots and cold
the service areas of local suppliers and pharmacies are 3.6 % spots between the different socioeconomic groups appears
(mean 23.8 %) and 4.2 % (mean 27.3 %), respectively, so that to be rather similar. In all cases, the western outskirts of the
only 14.9 % of all SHUs are located within 500 m walking city comprising the district of Grünau, a prefabricated hous-
distance of local suppliers; for pharmacies, this share is equal ing estate district with a rather negative image (Grossmann
to 18 %. Looking at Fig. 4, it becomes apparent that the cov- et al., 2015), is mostly avoided by all groups. Similarly, loca-
erage of SHUs by local suppliers and pharmacies is concen- tions on the northern outskirts feature relatively low z scores
trated in the city centre. across all socioeconomic profiles. However, in the period
The demanded inclusive rent, averaged across the whole until 2018, these patterns change considerably, thereby be-
city, was equal to EUR 477 in 2008, was equal to EUR 524 in coming less similar overall, with many of the changes be-
2013, and increased further to EUR 642 in 2018. As shown ing explained by “extreme” locations, such as the very city
in Fig. 4, inclusive rents increase particularly in the central centre or the outskirts. The centre loses attractiveness, as in-
parts of the city and to a lesser extent in the eastern parts dicated by decreasing z scores. This is particularly true for
of Leipzig. However, it is here where a comparatively high middle-aged skilled workers; precarious, unemployed per-
number of apartments are also offered for rent. On the out- sons; and pensioners, i.e. for the socioeconomic groups con-
skirts, particularly in the western parts of the city, inclusive sidered most vulnerable due to comparatively lower incomes;
rents remain lower but so does the number of apartments part-time, precarious, or lack of employment; and/or age. A
listed for rent. contrary trend of increasing z scores suggests an increasing
The predicted likelihoods for positive residential choices, attractiveness of the corresponding locations. For these vul-
averaged at the level of SHUs per socioeconomic group as nerable socioeconomic groups, such a trend can be identified
described in Table 2, were subsequently summarized into hot for previous cold spots such as Grünau in the west or loca-
spots and cold spots using local G* statistics (Ord and Getis, tions in the north of the city.
1995). Figure 5 shows the associated z scores for the three In contrast to the more vulnerable socioeconomic groups,
considered time steps. Here, high z scores (z > 1.65) indi- the spatial patterns of z scores indicating hot spots and cold
cate likely hot spots, i.e. a clustering of comparatively high spots of full-time employed academics and young adults in
likelihoods of positive residential choices for a specific so- education appear to shift less over time. For these groups,
cioeconomic group at a given location. Hot spots are there- the loss of attractiveness of the city centre is much less pro-
fore considered to feature a comparatively high chance that a nounced. It can be noted instead that certain hot spots, e.g.
socioeconomic group moves into (or resides at) the location in the eastern parts of the city, seem to reinforce themselves.
in question. Conversely, low z scores (z < −1.65) indicate For these groups, it also appears to be the case that certain
likely cold spots, i.e. a grouping of comparatively low like- locations, e.g. Grünau in the western part of the city, remain
lihoods of positive residential choices. Consequently, cold rather unattractive, as indicated by continuously low z scores
spots are considered to feature lower chances of a given so- over time (Fig. 5).
cioeconomic group moving in.
https://doi.org/10.5194/nhess-21-203-2021 Nat. Hazards Earth Syst. Sci., 21, 203–217, 2021212 S. Scheuer et al.: Modelling of residential location choice of urban population with random forest
Figure 5. Map of local G* z scores indicating likely hot spots and cold spots of the predicted likelihoods of positive residential choices per
socioeconomic group for the time steps 2008, 2013, and 2018. Arrows indicate exemplary locations of persisting cold spots (a), reinforcing
hot spots (b), hot spots turning into cold spots (c), and cold spots turning into hot spots for unemployed (d) or elderly persons (e). The map
furthermore shows the area potentially affected by a 1-in-300-year flood event (HQ300).
4 Discussion of the population is likely. Consequently, the spatial pattern
of hot spots is seen to directly reveal the shaping of ex-
This case study demonstrates that residential-choice be- posure and vulnerabilities towards specific hazards through
haviour can inform disaster risk assessment through several residential-choice processes. The impact on disaster risk be-
means. First, it has been shown that the proposed methodol- comes specifically obvious when the elicited hot-spot or
ogy allows for identifying hot spots and cold spots of resi- cold-spot pattern is overlaid with hazard-prone areas to ac-
dential choice for distinct socioeconomic groups, i.e. groups count for the hazard dimension of disaster risk. By so doing,
of population with heterogeneous preferences. The hot spots areas of importance for disaster risk assessment can imme-
of residential choice are especially considered to highlight diately be revealed. For example, Fig. 5 includes the area
where a progressive concentration of the respective group potentially affected by a 1-in-300-year flood event, denoted
Nat. Hazards Earth Syst. Sci., 21, 203–217, 2021 https://doi.org/10.5194/nhess-21-203-2021S. Scheuer et al.: Modelling of residential location choice of urban population with random forest 213 as HQ300. By comparing this area with the pattern of hot different scientific disciplines. In so doing, novel insights spots, it appears that especially academics and young adults may be obtained allowing for a more holistic and integra- in education may be particularly exposed to flooding, a trend tive perspective on disaster risk, and a better understanding possibly explained by previous studies indicating that envi- of the importance of urban processes in the driving and shap- ronmental amenities outweigh possible risks (Benson et al., ing of exposure, vulnerabilities, and risks may be achieved 2000; Yin, 2010). Contrary to that, exposure and thus vulner- (Carreño et al., 2017). In the context of the presented case abilities to heat stress may be more dominated by the spatial study, these processes include (eco-)gentrification, segrega- patterns of the hot spots of the elderly and deprived socioe- tion, polarization, and ageing, each influencing the forma- conomic groups (Heaton et al., 2014). tion of both hot spots and cold spots. In the case of compar- Second, it has been shown that the proposed methodology atively privileged socioeconomic groups such as academics, allows for detecting changing patterns of residential-choice hot spots may indicate an increasing (self-reinforcing) con- behaviour over time, e.g. cold spots becoming more attrac- centration of potentially exposed (material, economic) assets tive, as well as hot spots “cooling”, i.e. losing attractiveness. at risk. For socioeconomically disadvantaged or more vulner- Particularly the former are considered to be of relevance in able groups of people such as the unemployed or the elderly, disaster risk assessment, as such “warming” cold spots could hot spots may however put emphasis on locations of increas- be highlighting spatial shifts in exposure and vulnerabilities, ing socioeconomic vulnerabilities. In contrast, cold spots re- thereby possibly forming future hot spots of disaster risk. It veal evasive behaviour of specific socioeconomic groups, e.g. is consequently such areas that could become a priority for due to increasing rents. This becomes apparent in the wider intervention, and by bringing such potential hot spots to the city centre, which appears to be increasingly avoided over attention of decision-makers, timely and proactive instead of time by pensioners and the unemployed, who in turn shift, rather reactive adaptation measures might be taken. In the at least partially, towards the prefabricated GDR real-estate case of heat stress, for instance, greening measures could be complexes such as Grünau (Fig. 5). These findings are in implemented for heat adaptation in evolving hot spots with line with previous case studies for Leipzig, e.g. on the cen- low green-space accessibility and thus lack of cooling poten- trally located Lene-Voigt-Park, where greening led to inner- tial (Andersson et al., 2020; Haase et al., 2019). Similarly, city urban renewal resulting in an influx of higher-income in the case of flooding, the implementation of both structural families, rising rents, and a subsequent exodus of less privi- and non-structural (behavioural) flood protection measures leged groups (Ali et al., 2020; Haase et al., 2017), or on the may be facilitated. Such mitigation and adaptive action ad- risk of the accumulation of a socially weak and ageing popu- dress vulnerabilities and exposures (Cardona et al., 2012), lation in the large prefabricated GDR housing estates (Brade thereby promising large potential for a reduction in damage et al., 2009). Hereby, the importance of selected predictors in and disaster risk (Winsemius et al., 2016). the shaping of patterns of vulnerability and exposure is em- Moreover, spatially co-located hot spots of residential phasized once more; for example, rent was identified to be choice for different disadvantaged socioeconomic groups amongst the three most important predictors of residential- may be highlighting strong competition between these de- choice behaviour by Scheuer et al. (2020). Furthermore, it mand groups and may furthermore be indicative of conflicts becomes clear that the presented approach is a means for in urban planning, e.g. due to diverging interests and needs detecting and communicating social phenomena associated of the said demand groups for the development of residential with complex urban processes. areas vs. the implementation of greening as a risk adapta- Whilst we believe that disaster risk assessment is brought tion measure or for the improvement of environmental jus- forward by the proposed approach through informing the di- tice. It is consequently through such “feedbacks” that links mensions of exposure and vulnerability by incorporating het- between (the prediction of) residential-choice behaviour, dis- erogeneous preferences of distinct sociodemographic and so- aster risk assessment, and urban planning become apparent, cioeconomic groups, several shortcomings of the presented and the role of urban planning in managing disaster risks, approach need to be identified. These include the overall data climate change adaptation, and human health and wellbeing availability and completeness of data, e.g. regarding neigh- is emphasized clearly. In this context, the proposed method bourhood amenities such as local suppliers or pharmacies. In could point to relevant process chains between urban drivers, this context, due to re-using a pre-trained machine-learning housing-market dynamics, and disaster risk management, algorithm, the choice of predictors and corresponding cat- thereby inviting research and action to address developmen- egorial values was also limited. Shortcomings further in- tal shortcomings or planning weaknesses. clude the spatial resolution of the SHUs for the geolocation Third, by providing disaster risk assessment with a of apartment listings, which is obviously dependent on the spatially explicit model of residential choice, the spatial way data were provided in the scientific-use file but which is outcomes of a multitude of urban processes influencing clearly too coarse to depict spatial manifestations of “hyper- residential-choice behaviour become incorporated into the local” urban processes such as redevelopments, retrofitting, disaster risk assessment process. Thereby, additional bodies or urban infill (Xu et al., 2020) in high detail, i.e. at site of knowledge are tapped into, and bridges are built between level. The SHUs’ coarse spatial resolution thus compounds https://doi.org/10.5194/nhess-21-203-2021 Nat. Hazards Earth Syst. Sci., 21, 203–217, 2021
214                    S. Scheuer et al.: Modelling of residential location choice of urban population with random forest

the quality of predictions of residential choice through the       bilities, and disaster risk is brought forward. An interesting
limited spatial representation of housing attributes, which        avenue for future research includes the revision of predictors
had to be approximated at the level of SHUs. For example,          alongside the perpetuation of the methodology to allow for
in the case of house type, a dominant house type had to be         online training. Thereby, additional components of vulnera-
elicited, thereby possibly neglecting other house types within     bility, exposure, and disaster risk such as coping, prepared-
a given grid cell.                                                 ness, or adaptation could be incorporated more specifically.
   In contrast to other case studies, transferability is limited   In so doing, linkages between the disaster risk community
due to the reliance on case-study-specific data and due to the     and environmental justice, e.g. in the form of green-space
specific local patterns and trends at play. However, the over-     accessibility, would be explored further and operationalized
all analytical lens of detecting patterns of residential choice    in more detail.
based on tacit knowledge, i.e. unconscious knowledge tied to
personal experiences (Raymond et al., 2010) embedded into
a broader setting of urban development, is a unique approach       Data availability. The     scientific-use file with apart-
which will be of increasing relevance for cities facing sim-       ments listed for rent (Boelmann et al., 2019) can be ob-
ilar trends of built-up and climate changes (Scheuer et al.,       tained by delivery as indicated in the referenced DOI
2017). In this regard, revealing spatially explicit trends and     https://doi.org/10.7807/immo:red:wm:suf:v1.
shifts in heterogeneous groups of population and thereby en-
abling more precise ex ante analysis, the proposed method-
                                                                   Author contributions. SS, DH, AH, MW, and TW were responsi-
ology could be particularly useful for urban-planning author-
                                                                   ble for conceptualization of the case study. Development and im-
ities of cities in less developed countries, where census data
                                                                   plementation of the methodology, formal analysis, and visualization
are less reliably available, thus calling for alternative data     were by SS. Data acquisition was by MW and SS. The original draft
sources (Contreras et al., 2020).                                  was written by SS with contributions from all co-authors. Funding
   It furthermore must be noted that the presented case study      acquisition was by DH.
does not consider preferences or spatial attributes evolv-
ing over time, a limitation deriving from a lack of training
data before 2018. Consequently, the residential-choice pre-        Competing interests. The authors declare that they have no conflict
dictions for the time steps 2008 and 2013 assume invariant         of interest.
(homogeneous) preferences, as well as a constant importance
of predictors. This shortcoming may however be alleviated
by adapting the proposed methodology to enable continuous          Special issue statement. This article is part of the special issue
and incremental training – e.g. with online random forests         “Groundbreaking technologies, big data, and innovation for disas-
(Saffari et al., 2009) or Mondrian forests (Lakshminarayanan       ter risk modelling and reduction”. It is not associated with a confer-
et al., 2014), each allowing for so-called online training – as    ence.
part of long-term panel studies. Other machine-learning al-
gorithms that are capable of handling mixed data such as neu-
                                                                   Acknowledgements. Dagmar Haase and Manuel Wolff were sup-
ral networks may also be investigated (Hastie et al., 2009).
                                                                   ported as part of the project ENABLE, funded through the 2015–
Such longer-term studies could facilitate disaster risk assess-
                                                                   2016 BiodivERsA COFUND call for research proposals, with the
ment by further strengthening the linkages between urban           national funders the Swedish Research Council for Environment,
planning and disaster risk management.                             Agricultural Sciences, and Spatial Planning; Swedish Environmen-
                                                                   tal Protection Agency; German Aerospace Center; National Science
                                                                   Centre (Poland); Research Council of Norway; and Spanish Min-
5   Conclusions                                                    istry of Economy, Industry and Competitiveness. In addition, Dag-
                                                                   mar Haase and Sebastian Scheuer benefited from the GreenCity-
This paper proposes a methodology for the spatially explicit       LabHue Project (FKZ 01LE1910A) and Dagmar Haase, Sebastian
prediction of residential-choice behaviour in the form of hot      Scheuer, and Manuel Wolff from the CLEARING HOUSE (Collab-
spots and cold spots for distinct socioeconomic groups, a pro-     orative Learning in Research, Information-sharing and Governance
                                                                   on How Urban tree-based solutions support Sino-European urban
cess seen to (co-)govern spatial patterns of exposure and vul-
                                                                   futures) Horizon 2020 project (no. 821242). Sebastian Scheuer was
nerabilities and subsequently disaster risk. Through the lens      additionally supported by the 2018 Summer Academy on World
of predicting residential choice, the proposed methodology         Risk and Adaptation Futures: Urbanization, hosted by the Institute
enables disaster risk assessment and management to improve         for Environment and Human Security (UNU-EHS) of the United
(ex ante) analysis of the highly dynamic spatial shifts and re-    Nations University and the Munich Re Foundation (MRF). Thilo
sulting distribution of the urban population and to tap into       Wellmann receives a scholarship from the Deutsche Bundesstiftung
additional bodies of knowledge, e.g. through making hetero-        Umwelt (DBU; German Federal Environmental Foundation). We
geneous preferences of different socioeconomic groups ac-          acknowledge support by the German Research Foundation (DFG)
cessible. In so doing, the assessment of exposure, vulnera-

Nat. Hazards Earth Syst. Sci., 21, 203–217, 2021                                     https://doi.org/10.5194/nhess-21-203-2021
S. Scheuer et al.: Modelling of residential location choice of urban population with random forest 215
and the Open Access Publication Fund of Humboldt-Universität zu tral and Eastern Europe: A lull before the storm?, Cities, 26, 233–
Berlin. 244, 2009.
Braubach, M. and Fairburn, J.: Social inequities in environmental
risks associated with housing and residential location – a review
Financial support. This research has been supported by the Bun- of evidence, Eur. J. Publ. Heal., 20, 36–42, 2010.
desministerium für Bildung und Forschung (grant no. 01LE1910A) Brauch, H. G.: Concepts of Security Threats, Challenges, Vul-
and Horizon 2020 (grant no. 821242). nerabilities and Risks, in: Coping with Global Environmental
Change, Disasters and Security. Threats, Challenges, Vulnerabil-
ities and Risks, edited by: Brauch, H. G., Spring, U., Mesjasz, C.,
Review statement. This paper was edited by Mario Lloyd Vir- Grin, J., Kameri-Mbote, P., Chourou, B., Dunay, P., and Birk-
gilio Martina and reviewed by Philippe Ker Rault and Georgia Pa- mann, J., Springer, Berlin, Heidelberg, Germany, 61–106, 2011.
pacharalampous. Breiman, L.: Random Forests, Mach. Learn., 45, 5–32, 2001.
Broitman, D. and Koomen, E.: Residential density change: Densifi-
cation and urban expansion, Comput. Environ. Urban, 54, 32–46,
2015.
References Cardona, O., van Aalst, M., Birkmann, J., Fordham, M., McGre-
gor, G., Perez, R., Pulwarty, R., Schipper, E., and Sinh, B.:
Ali, L., Haase, A., and Heiland, S.: Gentrification through Determinants of risk: exposure and vulnerability, in: Managing
Green Regeneration? Analyzing the Interaction between the Risks of Extreme Events and Disasters to Advance Climate
Inner-City Green Space Development and Neighborhood Change Adaptation. A Special Report of Working Groups I and
Change in the Context of Regrowth: The Case of Lene- II of the Intergovernmental Panel on Climate Change (IPCC),
Voigt-Park in Leipzig, Eastern Germany, Land, 9, 24, edited by: Field, C., Barros, V., Stocker, T., Qin, D., Dokken, D.,
https://doi.org/10.3390/land9010024, 2020. Ebi, K., Mastrandrea, M., Mach, K., Plattner, G.-K., Allen, S.,
Andersson, E., Haase, D., Scheuer, S., and Wellmann, T.: Neigh- Tignor, M., and Midgley, P., Cambridge University Press, Cam-
bourhood character affects the spatial extent and magnitude of bridge, UK, 65–108, 2012.
the functional footprint of urban green infrastructure, Land- Carrão, H., Naumann, G., and Barbosa, P.: Global projections of
scape Ecol., 35, 1605–1618, https://doi.org/10.1007/s10980- drought hazard in a warming climate: a prime for disaster risk
020-01039-z, 2020. management, Clim. Dynam., 50, 2137–2155, 2018.
Antipov, E. A. and Pokryshevskaya, E. B.: Mass appraisal of resi- Carreño, M. L., Cardona, O., Barbat, A. H., Suarez, D. C., del Pi-
dential apartments: An application of Random forest for valua- lar Perez, M., and Narvaez, L.: Holistic Disaster Risk Evaluation
tion and a CART-based approach for model diagnostics, Expert for the Urban Risk Management Plan of Manizales, Colombia,
Syst. Appl., 39, 1772–1778, 2012. Int. J. Disast. Risk Sc., 8, 258–269, 2017.
Aslam, A., Masoumi, H., Naeem, N., and Ahmad, M.: Residential Castells, M.: Local and Global: Cities in the network society, Tijd-
location choices and the role of mobility, socioeconomics, and schr. Econ. Soc. Ge., 93, 548–558, 2002.
land use in Hafizabad, Pakistan, Urbani Izziv, 30, 115–128, 2019. Chen, H., Kwong, J. C., Copes, R., Tu, K., Villeneuve, P. J.,
Balmes, J. R., Earnest, G., Katz, P. P., Yelin, E. H., Eisner, M. D., and van Donkelaar, A.: Living near major roads and the inci-
Chen, H., Trupin, L., Lurmann, F., and Blanc, P. D.: Exposure to dence of dementia, Parkinson’s disease, and multiple sclerosis: a
traffic: Lung function and health status in adults with asthma, J. population-based cohort study, Lancet, 389, 718–726, 2017.
Allergy Clin. Immun., 123, 626–631, 2009. Contreras, D., Chamorro, A., and Wilkinson, S.: Review arti-
BBSR – Bundesinstitut für Bau-, Stadt- und Raumforschung im cle: The spatial dimension in the assessment of urban socio-
Bundesamt für Bauwesen und Raumordnung: Indikatoren zur economic vulnerability related to geohazards, Nat. Hazards
Nahversorgung. Erreichbarkeit von Gütern und Dienstleistun- Earth Syst. Sci., 20, 1663–1687, https://doi.org/10.5194/nhess-
gen des erweiterten täglichen Bedarfs, BBSR-Analysen KOM- 20-1663-2020, 2020.
PAKT 10/2015, Bonn, Germany, 2015. Dilley, M., Chen, R. S., Deichmann, U., Lerner-Lam, A. L., and
Benson, E., Hansen, J., and Schwartz Jr., A.: Water views and resi- Arnold, M. (Eds.): Natural Disaster Hotspots: A Global Risk
dential property values, Appraisal J., 68, 260–271, 2000. Analysis, The World Bank, Washington, D.C., USA, 2005.
Bivand, R. and Wong, D. W. S.: Comparing implementations of Elmer, F., Hoymann, J., Düthmann, D., Vorogushyn, S., and
global and local indicators of spatial association, Test, 27, 716– Kreibich, H.: Drivers of flood risk change in residen-
748, 2018. tial areas, Nat. Hazards Earth Syst. Sci., 12, 1641–1657,
BKG – Bundesamt für Kartographie und Geodäsie: Amtliches https://doi.org/10.5194/nhess-12-1641-2012, 2012.
Topographisch-Kartographisches Informationssystem (Authori- Ettema, D. and Nieuwenhuis, R.: Residential self-selection and
tative Topographic Cartographic Information System) ATKIS, travel behaviour: What are the effects of attitudes, reasons for lo-
dataset for Saxony, 2018. cation choice and the built environment?, J. Transp. Geogr., 59,
Boelmann, B., Budde, R., Klick, L., Schaffner, S., and 146–155, 2017.
RWI, et al.: RWI-GEORED: RWI Real Estate Data Ewing, B., Kruse, J., and Wang, Y.: Local housing price index anal-
(Scientific Use File) – apartments for rent. Version: 1, ysis in wind-disaster-prone areas, Nat. Hazards, 40, 463–483,
RWI – Leibniz Institute for Economic Research Dataset, 2005.
https://doi.org/10.7807/immo:red:wm:suf:v1, 2019.
Brade, I., Herfert, G., and Wiest, K.: Recent trends and future
prospects of socio-spatial differentiation in urban regions of Cen-
https://doi.org/10.5194/nhess-21-203-2021 Nat. Hazards Earth Syst. Sci., 21, 203–217, 2021You can also read