Place Identity: Urban Water and the Anthropocene - Institution
←
→
Page content transcription
If your browser does not render page correctly, please read the page content below
Place Identity: Urban Water and the Anthropocene

Institution:    School of Cities
                University of Toronto

Submitted by:   Daniel Tse, P.Eng.
                Master of Engineering (M.EngCEM) Candidate
                daniel.tse@mail.utoronto.ca, daniel.j.tse@gmail.com

Date:           October 2020
Daniel Tse Place Identity: Urban Water and the Anthropocene
PREFACE
As a civil engineer by background and training, the journey back into academia has been
invigorating. After 5 years of land development consulting, graduate school has given me countless
learning outcomes and emergent lines of inquiry. This project seeks to integrate some of this new
knowledge and critical thinking. I hope this work demonstrates one pathway to re-engage (civil) engineers
in city building and re-imagine the purview of engineering practice.
Having lived in Calgary for more than 20 years, this city shaped me into who I am today. For that, I
am grateful to learn more about my home city and add richness to its urban identity. As ideas about
resilience continue to permeate the public consciousness—especially given COVID-19’s impacts on cities—
I hope this work sparks creativity and new conversations about what a resilient and equitable post-
pandemic future might look like.
ACKNOWLEDGEMENTS
I am deeply grateful for this enrichment experience as a Graduate Fellow with the School of Cities
to develop and pursue a project that I am proud of. My success is owed to the kind guidance and support
of many. I wish to extend my gratitude to Marieme Lo, Katherine Danks, Matti Siemiatycki, Rebecca
McMillan, and many others at the School of Cities. Their care, effort, and guidance have been invaluable.
I also need to recognize my home department, Civil and Mineral Engineering, for their part in my academic
journey. The professors and my colleagues there have inspired and shaped the theoretical foundations
and lines of inquiry that make a project like this possible. Finally, a big thanks to Jack, Goji, Daniela, Kamel,
Joe, Sofia, Christine, and Alex for their encouragement, patience, and humour.
EXECUTIVE SUMMARY
This project is about urban identity, water in cities and resilience. It is the end deliverable for my
fellowship with the School of Cities. I explore the connections among place identity (how infrastructure
enables meaning-making in cities), the Anthropocene (the emergence of hybrid built-natural
infrastructure), and urban water (simply water in cities) to explore the severe flooding in Calgary, Alberta.
As a case study of the June 2013 floods, I review the region’s urban profile, salient watercourses, flooding
history, a timeline of events, the response and impacts, flood mitigations, and narratives about the river,
floodplain and resilience. While I offer that the different types of resilience—persistence, adaptation, and
transformation—belong to different points along a response-recovery curve, resilience in practice
suggests that persistence is common and transformation is rare. Employing four different spatial scales to
represent the neighbourhood, community, regional, and metropolitan levels, I analyze four data sets to
produce a spatial analysis of flooding impacts and a narrative analysis of Calgary’s socio-hydrological fabric.
I suggest that uncritical trade-offs and power-blindness are key challenges and offer a politics of resilience
as an antidote. This work reveals three main takeaways. First, the production of resilience across the urban
landscape should account for who, what, when, where, and why. Second, resilience should be reflected in
policy and strategic documents across the municipal scale and integrate into the broader vertical and
lateral governance frameworks. Third, resilience should be critically questioned and not assumed to be a
positive outcome. It should reflect a city’s tolerance for disruption and worldview about change.
iDaniel Tse Place Identity: Urban Water and the Anthropocene
TABLE OF CONTENTS
Preface............................................................................................................................................................ i
Acknowledgements ........................................................................................................................................ i
Executive Summary ........................................................................................................................................ i
Table of Contents ...........................................................................................................................................ii
List of Figures................................................................................................................................................. iii
List of Tables .................................................................................................................................................. iii
List of Abbreviations ...................................................................................................................................... iii
1. Introduction ........................................................................................................................................ 1
2. Background ......................................................................................................................................... 1
2.1 Place Identity ............................................................................................................................ 1
2.2 Anthropocene ........................................................................................................................... 1
2.3 Resilience .................................................................................................................................. 2
3. Methods .............................................................................................................................................. 2
3.1 Data ........................................................................................................................................... 2
3.2 Spatial Analysis ......................................................................................................................... 3
3.3 Narrative Analysis ..................................................................................................................... 3
4. Case Study: 2013 Calgary Flood .......................................................................................................... 4
4.1 Urban Profile ............................................................................................................................. 4
4.2 Bow and Elbow Rivers............................................................................................................... 4
4.3 Brief History of Flooding ........................................................................................................... 5
4.4 Timeline of Events..................................................................................................................... 6
4.5 Response and Impacts .............................................................................................................. 8
4.6 Flood Mitigations ...................................................................................................................... 9
4.7 River, Floodplain and Resilience Narratives ........................................................................... 11
5. Discussion.......................................................................................................................................... 12
5.1 Spatial and Narrative Analysis ................................................................................................ 12
5.2 Politics of Resilience................................................................................................................ 13
5.3 Takeaways............................................................................................................................... 15
6. Closure .............................................................................................................................................. 15
References ................................................................................................................................................... 16
Appendix A: Open Data ............................................................................................................................... 28
Appendix B: Bow and Elbow Rivers ............................................................................................................. 29
Appendix C: 2013 Calgary Flood.................................................................................................................. 32
Appendix D: Flood Mitigations and Resilience ............................................................................................ 33
Appendix E: Analysis.................................................................................................................................... 35
Appendix F: Drawings .................................................................................................................................. 45
iiDaniel Tse Place Identity: Urban Water and the Anthropocene
LIST OF FIGURES
Figure 1: Methods ......................................................................................................................................... 2
Figure 2: Calgary Census Metropolitan Area................................................................................................. 5
Figure 3: City of Calgary’s Watercourses....................................................................................................... 6
Figure 4: 2013 Calgary Floods, Timeline of Events (CBC News, 2013b; AWPS, 2013; The Canadian Press,
2013; Calgary Stampede, 2013; CBC News, 2013a, 2013d; Calgary Herald, 2013b; Cryderman and Tait,
2013; Gilligan, 2013b; Government of Canada, 2013; Huffington Post Alberta, 2014; CPL, 2014a) ............ 7
Figure 5: Evacuated Neighborhoods in Calgary (AWPS, 2013; Elliott, 2013; City of Calgary, 2016a) ........... 9
LIST OF TABLES
Table 1: Spatial Scales ................................................................................................................................... 3
Table 2: Socioeconomic Variables ................................................................................................................. 3
Table 3: Critical Aggregate Dissemination Areas......................................................................................... 13
Table 4: Socioeconomic Profile for Calgary, Bowness, Downtown, and Glenmore Reservoir Area ........... 13
Table 5: The Politics of Resilience ............................................................................................................... 14
Table 6: Open Data – City of Calgary, Flooding Data .................................................................................. 28
Table 7: Open Data – Statistics Canada, Census Profile, 2016 Census........................................................ 28
Table 8: Open Data – Statistics Canada, Cartographic Boundary Files ....................................................... 28
Table 9: Development in the Bow and Elbow River Watersheds (City of Calgary, 2017e, pp. 24, 26, 28) . 29
Table 10: River and Floodplain Narrative Summary.................................................................................... 29
Table 11: River and Floodplain Narrative Analysis ...................................................................................... 31
Table 12: Annual Return Periods – Flow Rates (City of Calgary, 2020e) ..................................................... 32
Table 13: Flow Rates from the 2013 Calgary Flood (CPL, 2014a; City of Calgary, 2020e) .......................... 32
Table 14: Summary of Flood Mitigations .................................................................................................... 33
Table 15: Flood Resilience Narrative Summary........................................................................................... 33
Table 16: Flood Resilience Narrative Analysis ............................................................................................. 34
Table 17: Analysis and Interpretation – Drawing B1 ................................................................................... 36
Table 18: Analysis and Interpretation – Drawing B2 ................................................................................... 37
Table 19: Analysis and Interpretation – Drawing B3 ................................................................................... 38
Table 20: Analysis and Interpretation – Drawing C1 ................................................................................... 39
Table 21: Analysis and Interpretation – Drawing C2 ................................................................................... 40
Table 22: Analysis and Interpretation – Drawing C3 ................................................................................... 41
Table 23: Analysis and Interpretation – Drawing D1................................................................................... 42
Table 24: Analysis and Interpretation – Drawing D2................................................................................... 43
Table 25: Analysis and Interpretation – Drawing D3................................................................................... 44
LIST OF ABBREVIATIONS
ADA Aggregate dissemination area
CMA Census metropolitan area
CSD Census subdivision
FED Federal electoral district
GOA Government of Alberta
iiiDaniel Tse Place Identity: Urban Water and the Anthropocene
1. INTRODUCTION
Cities and urban regions are a continuous dialogue about the built form, environment, and human
agency. These dialogues mediate spatial outcomes, experiences of place, and capabilities to respond to
shocks and stresses. This report and project is the culmination of my Graduate Fellowship with the School
of Cities at the University of Toronto. Drawing on resilience literature, I explore the interlinkages between
how cities manage water and establish a sense of place in a world that has become a design space (Allenby
and Chester, 2018). To that end, I look to the City of Calgary (“the City” or “Calgary”) as a case study.
Specifically, I consider the ongoing post-disaster response to the severe flooding of June 2013 and
investigate narratives about the rivers, floodplain and resilience.
As a desktop study, this project attempts to reconcile academic discourse with real-world outcomes
and seeks to instantiate a politics of resilience (Meerow and Newell, 2019). By fusing human equity
considerations to the practice of urban resilience, this work adds nuance and a critical lens to the critique
that resilience is power-blind (Davoudi, 2012). The structure is five-fold. Section 2 contains critical terms
and concepts. Section 3 describes the methods while Section 4 summarizes the 2013 Calgary Floods as a
case study. Section 5 is a discussion and Section 6 is a closure.
2. BACKGROUND
This section develops three key terms—place identity, the Anthropocene, and resilience—as a
foundation for the remainder of the report. Urban water is understood simply as water within the city.
2.1 Place Identity
Infrastructure is the basic constitution and foundation of society (Star, 1999; Graham and Marvin,
2001; Kaika, 2005; Mcfarlane and Rutherford, 2008; Ferguson and Harman, 2015; Gao et al., 2015; Howe
et al., 2016; Cao et al., 2017; Dalgaard et al., 2018; Nunzio, 2018; Shepard, 2019). As a continuous dialogue
among the built form, the environment, human systems and people (Hay, 2016a; The Co-Cities Protocol,
no date), infrastructure enables meaning-making across space and time. This is the entry point for the
concept of place identity: the transformation of space into place through meaning-making. From place
making to place capital to place character, the discourse on place reflects two different scales: the
individual (Cuba and Hummon, 1993; Lewicka, 2008; Knez et al., 2018) and the collective or urban (PPS,
2007; Green, 2010; Kent, 2011, 2015; Manenti, 2011). Putting things together, this means that
infrastructure supports distinctive and unique narratives at the urban scale. This is how place identity is
interpreted in the project. Section 4.7 identifies some of the narratives for Calgary’s rivers and floodplain.
2.2 Anthropocene
The Anthropocene describes global, planetary change that is driven by human agency. Originating
in earth systems science (Steffen et al., 2011, 2015; Gaffney and Steffen, 2017) and migrating into
geography (Ziegler, 2019; Ziegler and Kaplan, 2019), it has now permeating engineering literature as well
(Allenby and Chester, 2018; Chester, Markolf and Allenby, 2019). Broadly, the literature is about the
feedback loop between human impacts on the environment and global environmental change. For this
project, the Anthropocene signifies how infrastructure is being reconceptualized (Allenby and Chester,
2018). Not only does it blur the distinction between the built and natural environment, it suggests that
natural capital assets (Helm, 2019)—such as rivers, floodplains, and watersheds—are in fact infrastructure.
Section 4.6 explores flood mitigation that seeks to manage the watershed as infrastructure.
1Daniel Tse Place Identity: Urban Water and the Anthropocene
2.3 Resilience
The academic literature suggests (at least) two ways for understanding resilience. The first is a
hierarchy structure where persistence, adaptation and transformation are successive levels of resilience
(Holling, 1973; Gunderson and Holling, 2002; Folke, 2006; Folke et al., 2010; Davoudi, 2012, 2018; Allen et
al., 2014; Meerow, Newell and Stults, 2016; Meerow and Newell, 2019). The second is sequential and
time-based. Here, operational resilience (Hay, 2016a) follows the incident sequence model (Hay, 2016b)
where persistence, adaptation, and transformation exist at different points along a response-recovery
curve. Towards a politics of resilience, this paper adopts the framework by Meerow and Newell (2019) by
asking who, what, when, where, and why urban resilience (re-)produces the place identity narratives of
Calgary’s river and floodplain. Section 4.7 identifies some of the narratives about resilience.
3. METHODS
This project adopts a two-track approach. The first track is about understanding the flooding
impacts. This includes describing the spatial extents of the proposed flood mitigations and characterizing
the socioeconomic profile of those who directly benefit. The second track is about understanding the
socio-hydrological fabric by analyzing the place identity narratives about the rivers, floodplain and
resilience. Both tracks are summarized in Figure 1. Section 3.1 reviews the data in this project while
Sections 3.2 and 3.3 summarize the spatial and narrative analysis.
Figure 1: Methods
3.1 Data
As a desktop study, this project relies on two main types of secondary data. First is the quantitative
data. This is spatial or numeric data from the City of Calgary’s Open Data Portal and Statistics Canada. This
data describes the spatial extents of flooding and characterizes the socioeconomic fabric of the City and
the census metropolitan area (CMA). Second is the qualitative data. This is semantic data drawn from City
of Calgary documents, Government of Alberta (GOA) publications, consultant reports, news, studies and
any other pertinent and credible literature.
The two data types are resolved into four data sets. The first set is flooding data from the City of
Calgary (City of Calgary, 2016c, 2018c, 2018a, 2018b, 2018e). The second set is Statistics Canada Data
(Statistics Canada, 2017a, 2017y, 2017x, 2017r, 2017s, 2017j, 2017v, 2017k, 2017t, 2017l, 2017n, 2017c,
2017d, 2017e, 2017f, 2017g, 2017h, 2017o, 2017b) that describes the socioeconomic profile at multiple
scales (Statistics Canada, 2017i, 2017u, 2017q, 2017p, 2017w) (also see Table 1). The third and fourth sets
are semantic data about Calgary’s rivers, floodplain and resilience. See Appendix A for further details.
2Daniel Tse Place Identity: Urban Water and the Anthropocene
3.2 Spatial Analysis
The spatial analysis reconciles the quantitative data from the City of Calgary and Statistics Canada
using QGIS v3.8.3-Zanzibar (QGIS.org, 2019) and has three main components. First, the 1:200-year flood
event (representative of desired level of flood mitigation – see Section 4.6), is mapped across the
socioeconomic profile for the four spatial scales shown in Table 1.
Table 1: Spatial Scales
Scale Abbreviation Description
Aggregate dissemination area ADA Representative of the ‘neighborhood’ scale
Federal electoral district FED Representative of the ‘community’ scale
Census subdivision CSD Representative of the ‘regional’ scale
Census metropolitan area CMA Representative of the ‘metropolitan’ scale
Second, the three pairs of socioeconomic variables in Table 2 are used to characterize the
socioeconomic profile. Each pair consists of a baseline variable and a vulnerability variable. The financial
capacity variables consist of average income and the low-income index. These approximate the access to
resources for responding to a disaster such as flooding. In other words, higher average income suggests
that residents are better equipped to cope and bounce back. Conversely, high values for the low-income
index means a high fraction of residents who experience financial vulnerability, suggesting less capacity
for absorbing disruption. The physical ability variables consist of average age and the children & elderly
index. These approximate how easy it would be for emergency egress and evacuation. The logic is that the
youngest and oldest need additional support to evacuate and assumes that ages 16 through 64 are able-
bodied. The social character variables consist of population density and the visible minority index.
Population density approximates the typology of the built form. Higher densities correlate with interstitial
(high-rise) communities that pose unique emergency preparedness considerations. The visible minority
index approximates social diversity.
Table 2: Socioeconomic Variables
Baseline Variable Vulnerability Variable
Financial capacity Average income Low-income index
Physical ability Average age Children & elderly index
Social character Population density Visible minority index
Third, a visual inspection of flooding extents identifies the beneficiaries of flood mitigation at each
scale. Then, the socioeconomic profiles at those scales can be further investigated to better understand
who benefits. Appendix F contains a combined drawing set produced as a record of the spatial analysis.
3.3 Narrative Analysis
Narrative analysis is one method for drawing out the common reference that informs stories and
society (Garcia Rodriguez, 2016). This paper and project, however, adopt a simplified version of narrative
analysis. Here, the goal is simply to collect and coalesce sentiments and statements about Calgary’s rivers,
floodplain and resilience to counterpose real-world outcomes in flood mitigation. A comparison can then
be used to inform a politics of resilience to verify if the prevailing narratives align with decision-making
and policy.
3Daniel Tse Place Identity: Urban Water and the Anthropocene
4. CASE STUDY: 2013 CALGARY FLOOD
This project adopts the 2013 Floods in Calgary as a case study to understand how urban water
relates to a sense of place and informs a politics of resilience (Meerow and Newell, 2019). Sections 4.1,
4.2, and 4.3 introduce the region’s urban profile, the main watercourses, and flooding history as
background information while Sections 4.4, 4.5, and 4.6 describe the timeline of events, response to and
impacts of flooding, and flood mitigations. Section 4.7 summarizes narratives about the rivers, floodplain,
and resilience.
4.1 Urban Profile
The City of Calgary is the major urban hub in Southern Alberta, founded at the confluence of the
Bow and Elbow Rivers in 1875 (City of Calgary, no date). According to the 2016 Census Profile, Calgary had
a population of 1,239,220 and a land mass of 825.56 km2 for a population density of 1501.1 p/km2
(Statistics Canada, 2017m). It forms the urban heart of the broader CMA, which also includes: Tsuu T’ina
First Nation; MD of Rocky View County; Village of Beiseker; Town of Cochrane, Town of Crossfield, and
Town of Irricana; City of Airdrie, and City of Chestermere. All nine CSDs in the CMA are shown in Figure 2
(page 5) (also see Drawing A3 in Appendix F).
4.2 Bow and Elbow Rivers
The City’s hydrological landscape contains eight salient water features. One is an irrigation canal
(Western Headworks Canal), one is a reservoir (Glenmore Reservoir), and four are creeks (Nose Creek,
West Nose Creek, Fish Creek, and Pine Creek). The two remaining, the Bow and Elbow Rivers, are the focus
of this case study. Broadly, each belongs to its own distinct watershed (City of Calgary, 2017e, p. 23).
Drawing A4 from Appendix F, which is reproduced as Figure 3 (page 6), illustrates these water features.
The dark blue represents the normal water level and the light blue is the 1:200-year flood event, which
coincides with the level of protection that the City of Calgary is pursuing (see Section 4.6 for more).
There is substantial development in both the Bow and Elbow River floodplains (see Table 9 in
Appendix B). Within the respective floodplains, 52% and 56% have remained as parks and open space,
which notably includes Prince’s Island Park, Saint Patrick’s Island, Stanley Park, and Lindsay Park (City of
Calgary, 2017e, pp. 24, 26, 28). Urban development occupies about 15% and 38% in the Bow and Elbow
River Floodplains, respectively (City of Calgary, 2017e, pp. 24, 26, 28). Included are the residential
neighbourhoods of Bowness, Hillhurst, Sunnyside, Eau Claire, East Village, Inglewood, Elbow Park,
Roxboro, Erlton, and Mission. Commercial districts include Downtown, Deerfoot Meadows, and the
Calgary Stampede grounds. Major infrastructure works such as Calgary’s three wastewater treatment
plants, the Glenmore Reservoir (which is also a water treatment plant), railways, railyards, and highways
are also located in the floodplain.
4Daniel Tse Place Identity: Urban Water and the Anthropocene
Figure 2: Calgary Census Metropolitan Area
4.3 Brief History of Flooding
Founded at the confluence of the Bow and Elbow Rivers, Calgary is prone to and has an extensive
history of flooding. In addition to the June 2013 flood, other major floods were recorded in 1879, 1883,
1884, 1897,1902, 1915, 1923, 1929, and 1932, 1950 (CBC News, 2013c; CPL, 2014c). 2005 was a significant
year for rainfall (CPL, 2014b), where both the Bow and Elbow Rivers had flow rates multiple times higher
than normal: 300 m3/s and 700 m3/s, respectively (City of Calgary, 2020d). The flooding in 2005 impacted
over 2000 Calgarians and 40,000 homes sustained water damage (CBC News, 2006; City of Calgary, 2020d).
There was extensive damage to Fish Creek Park and infrastructure including roads, pathways, bridges,
parks and open space, worth about $75 million in damages altogether (CPL, 2014b; City of Calgary, 2020d).
Private residents and businesses further claimed more than $14 million in flood compensation (CBC News,
2006). One significant outcome of the 2005 floods was the formation of an Emergency Operations Centre
that convened city administration and external agencies to better respond to natural disasters (CPL,
2014b). Unfortunately, the 2013 floods were worse.
5Daniel Tse Place Identity: Urban Water and the Anthropocene
Figure 3: City of Calgary’s Watercourses
4.4 Timeline of Events
The “most destructive flood” (CPL, 2014a) in Alberta history took place in June 2013. The flood’s
severity was due to multiple conditions upstream of Calgary that coincided (CBC News, 2013d). Heavy rain
melted snow that was on top of already-saturated or still-frozen ground (meaning the ground was not
porous to absorb the water); runoff quickly concentrated on the steep and rocky mountain terrain to flow
towards the City (AESRD, 2013; CBC News, 2013d; City of Calgary, 2020i). This was a 1:100-year flood event
(City of Calgary, 2020e), with peak flowrates on the Bow River (2400 m3/s) and Elbow River (1240 m3/s) at
eight and twelve times their normal rates (CPL, 2014a) (see Appendix C for more about flow rates).
Flooding and evacuations were widespread, with significant damage to Downtown, parks and open space,
6Daniel Tse Place Identity: Urban Water and the Anthropocene
and other infrastructure. Figure 4 (page 7) summarizes a timeline of flooding for the City of Calgary from
19 June 2013 when the initial rains fell in Southern Alberta to 28 November 2013 when the Calgary Zoo
was reopened. Note that this timeline has been truncated for this project; impacts and repairs continued
for years after and mitigation efforts are ongoing today.
Figure 4: 2013 Calgary Floods, Timeline of Events (CBC News, 2013b; AWPS, 2013; The Canadian Press, 2013; Calgary Stampede,
2013; CBC News, 2013a, 2013d; Calgary Herald, 2013b; Cryderman and Tait, 2013; Gilligan, 2013b; Government of Canada,
2013; Huffington Post Alberta, 2014; CPL, 2014a)
7Daniel Tse Place Identity: Urban Water and the Anthropocene
4.5 Response and Impacts
The response efforts were robust. Calgary’s 311 service1 received over 100,000 calls during the crisis
(CPL, 2014a). The City’s Mayor, Naheed Nenshi, used Twitter to keep citizens informed and updated
throughout the disaster (CPL, 2014a). Eight emergency response centres were set up (CPL, 2014a).
Downtown offices were closed on Friday 21 June 2013 and all schools were closed on Monday 24 June
2013 (CBC News, 2013b, 2013a). The Canadian Armed Forces provided 1300 troops, 8 helicopters, 1
military airplane, trucks and other vehicles to support the disaster and recovery response (Government of
Canada, 2013). Overall, at least 75,000 people were evacuated, impacting about 35,000 homes and
businesses (CBC News, 2013a; Page, 2018).
Temporary flood barriers were constructed at critical locations and the water level at the Glenmore
Reservoir was strategically lowered so it had greater storage capacity (while still maintaining the capability
to treat drinking water) (City of Calgary, 2020i, 2020d). This mitigated flooding impacts along the Elbow
River downstream of the reservoir. Calgary Transit suspended routes into Downtown, since all routes into
the core were flooded, making downtown “inaccessible for days” (CPL, 2014a; City of Calgary, 2020d). The
GOA would later revise the floodplain maps as well (CPL, 2014a). Overland and groundwater flooding and
storm and sanitary sewer backups created significant damage to Downtown, neighborhoods, and other
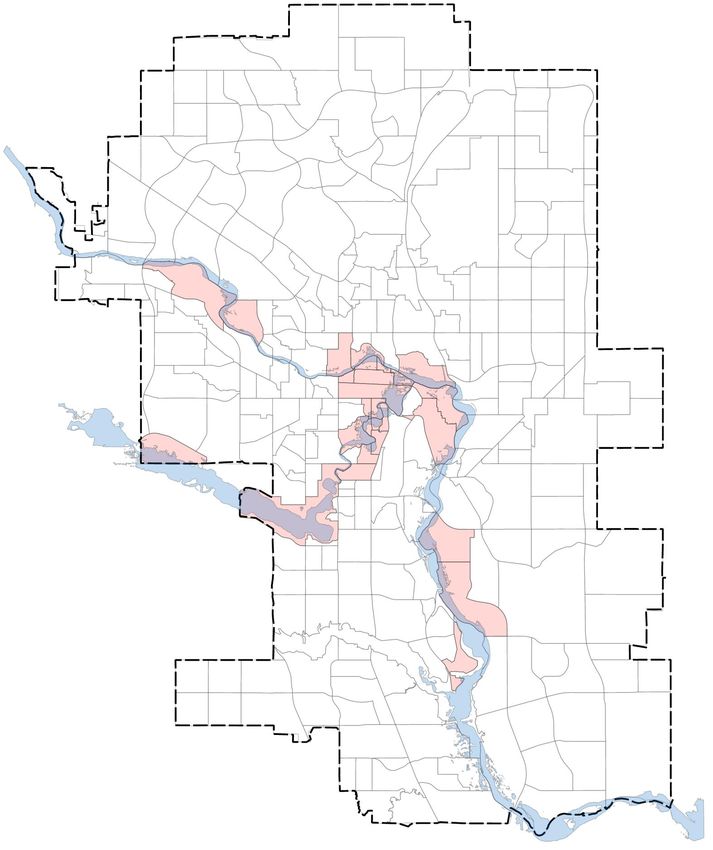
areas. At the peak of flooding, 32 communities were flooded. Figure 5 (page 9) illustrates the evacuated
communities in pink with the flood extents from 22 June 2013 (approximately a 1:100-year flood event).
The Downtown was submerged and without power for several days, as the flooding damaged a
power substation (Cryderman and Tait, 2013; CPL, 2014a; City of Calgary, 2020i). The Scotiabank
Saddledome2 sustained water damage up to the tenth row of seats, destroying the stage and dressing
rooms (CBC News, 2013b). Debris accumulated on the Calgary Stampede grounds and water damaged
buildings, electrical and mechanical systems, and other utilities (Calgary Stampede, 2013). There was
extensive damage to parks, open space and the Calgary Zoo (Calgary Herald, 2013a; Gilligan, 2013a; Young,
2013; Page, 2018).
Roads and other transport infrastructure were washed out and damaged. For example, the C-Train3
rail tracks around Erlton Station were lifted by the flood waters and unusable (Martin, 2013). Repairs were
expedited and transit operations restored in time for the Calgary Stampede (which opened on Thursday 4
July 2020 for “sneak-a-peak”) (Calgary Stampede, 2013). About 40 km of City pathways, many along the
river valleys, were washed out or destroyed completely (Page, 2018).
Overall, this was among the costliest disasters in Canadian history with insurable damages estimated
at $1.7 billion (CPL, 2014a). Damages to City infrastructure and property are estimated at over $400 million
(Page, 2018; City of Calgary, 2020d). Damages to City parks (including Prince’s Island Park and Bowness
Park) are estimated at $55 million (Page, 2018). The emergency response and recovery efforts cost about
$55 million and $323 million, respectively (City of Calgary, 2020d).
1
The phone line for city information and non-emergency support
2
Calgary’s multi-purpose indoor sports arena and concert venue
3
Calgary’s light rail transit system
8Daniel Tse Place Identity: Urban Water and the Anthropocene
Figure 5: Evacuated Neighborhoods in Calgary (AWPS, 2013; Elliott, 2013; City of Calgary, 2016a)
4.6 Flood Mitigations
Given the historic flood levels and widespread impacts and damage, recovery and protection
commitments by decision-makers to were prompt (Calgary Herald, 2013b, 2014; Government of Canada,
2013). While the June 2013 floods are characterized as a 1:100-year flood event (see Appendix C for more
about flow rates), the City of Calgary’s Flood Mitigation Measures Assessment championed flood
9Daniel Tse Place Identity: Urban Water and the Anthropocene
mitigations for the 1:200-year flood event (City of Calgary, 2016b, p. 5). These mitigations, a shared
responsibility among citizens and the three levels of government (municipal, provincial, and federal),
would span three scales: property, community and watershed (City of Calgary, 2016b). The mitigations
could be non-structural (ie. policy at the property-scale) or structural (ie. built infrastructure at the
community- and watershed-scale).
For the property-scale, mitigations address building codes, bylaws, land use regulations, flood
mapping, flood awareness education and other policy changes (City of Calgary, 2016b, p. 9; Lo, 2020).
Substantive changes include restricting greenfield development and sensitive uses within the floodplain,
strategic acquisition of properties or buildings, early warning and forecast systems, emergency
preparedness protocols, and creating interactive and educational flood risk and awareness maps (City of
Calgary, 2016b; Bowen, 2017, p. 9; City of Calgary, 2018f, p. 11, 2019, p. 11, 2020d, 2020q, p. 11).
For the community-scale, flood mitigation is made up of barriers, in-stream works, and other utility
enhancements along both rivers (City of Calgary, 2016b). For the Bow River, flood barriers were identified
for six areas, including Downtown, Sunnyside-Hillhurst, Bowness, Heritage Drive, Inglewood and the
Bonnybrook Wastewater Treatment Plant (City of Calgary, 2016b, p. 8, 2020l). Four of these six are
underway (City of Calgary, 2020f, 2020n, 2020b, 2020a). For in-stream works, a bank stabilization program
has been completed and two gravel bar dredging projects are forthcoming (City of Calgary, 2016b, 2020c,
2020m). Finally, a suite of storm and sanitary sewer improvements are being pursued (City of Calgary,
2020c). This includes pump stations and lift stations, separating drainage infrastructure, outfall
improvements, and utility relocations (City of Calgary, 2020j, 2020o, 2020r, 2020a, 2020k).
For the Elbow River, the main community-scale mitigation is an upgrade to the dam gates at the
Glenmore Reservoir (City of Calgary, 2020l). After a comprehensive review of other mitigation approaches,
the City committed $82 million in 2014 (CBC News, 2014; WaterSMART and Alberta Innovates, 2014).
Construction commenced in the spring of 2017 (Perri, 2017; City of Calgary, 2018d) and the upgrade was
completed in May 2020 (Dippel, 2020). A pedestrian and cyclist pathway on top of the dam was opened
to the public in September 2020 (Kaufmann, 2020). The reservoir’s storage capacity has now doubled (City
of Calgary, 2018d; Lo, 2020, p. 1) and absorbs up to 20% of the 2013 flood risk (Lo, 2020, p. 3). For in-
stream works, two gravel bar projects are anticipated (City of Calgary, 2020c).
While the watershed-scale mitigations are the most impactful, they are also the most costly and
complex. These mitigations are large-scale; they alter the behaviour of the watershed upstream of the City
and take the form of reservoirs. For the Bow River, an interim solution is operational while a permanent
mitigation is pursued. During the 2013 floods, the Ghost Reservoir (upstream of Calgary) was used to retain
water and lessen the flood impacts downstream. Following several reports and recommendations (AMEC,
2014; Expert Management Panel on River Flood Mitigation, 2014), modified operations on the Ghost
Reservoir have continued following successful pilot projects (TransAlta, 2014, 2016). A five-year
agreement between TransAlta (the power company that operates the Ghost Reservoir) and the GOA was
arranged in 2016 with intentions to extend beyond 2021 (TransAlta, 2016; City of Calgary, 2020l). A
permanent reservoir for the Bow River, which requires both provincial and federal involvement, is still in
the early stages and a location has not been determined (City of Calgary, 2016b; Government of Alberta,
2020a). Currently, the GOA is completing the conceptual assessment for three options (Government of
Alberta, 2017a, 2018a, 2020a; Wood, 2020).
10Daniel Tse Place Identity: Urban Water and the Anthropocene
The watershed-scale mitigations for the Elbow River contrast the restrained progress on the Bow
River. A 2013 report by engineering services consultant Stantec Consulting Ltd. identified three options:
the Springbank Reservoir, McLean Creek, and Elbow-to-Bow Diversion (Stantec Consulting Ltd., 2013).
After multiple studies and reports (AMEC, 2014, 2015; Expert Management Panel on River Flood
Mitigation, 2014; WaterSMART and Alberta Innovates, 2014; Deltares, 2015; IBI Group, 2015c, 2015b,
2015a), the GOA announced in December 2016 to proceed with the Springbank Reservoir, which is located
about 18 km upstream of the City (Government of Alberta, 2015, 2016; City of Calgary, 2020l). After
completing further studies, updates, open houses, and other environmental compliance (Government of
Alberta, 2017c, 2017b; IBI Group, 2017; Government of Alberta, 2018b; Stantec Consulting Ltd., 2018;
Government of Alberta, 2019b), the Springbank Reservoir is ready for construction pending regulatory
approvals as of Spring 2020 (Government of Alberta, 2020b). A summary of flood mitigations is given in
Table 14 in Appendix D.
4.7 River, Floodplain and Resilience Narratives
Broadly speaking Calgarians hold the rivers and floodplain in high regard. Socially, they offer green
and blue spaces for leisure and recreation. This includes parks and other open spaces for picnics, walking
and cycling; clean water for boating, floating, rafting, canoeing, and fly fishing; and a healthy river
ecosystem that connects Calgarians to urban wildlife. The leisure and recreation activities translate into
economic benefits, especially given the Bow River’s world-class, international reputation for fly fishing and
water sports (Government of Alberta, 2019a, p. 4). Both the social and economic dimensions are
supported by Calgary’s strict adherence the environment, wastewater treatment, and maintenance of
ecosystem health.
Given the closeness of social, economic, and environmental narratives, it is no surprise that
Calgarians take pride in the rivers and floodplain. They coincide with meaning-making, as “83% of
Calgarians say that river areas are important to them personally” (Ipsos Public Affairs, 2016; City of Calgary,
2017e, p. 1). This is the most significant narrative. It demonstrates how Calgarians derive value from the
rivers and floodplain. Notably, the underlying assumption is that all Calgarians have equal and abundant
benefit and access that supports a “first-class lifestyle” (Calgary River Valleys, 2012; City of Calgary, 2017e).
This importance is further reflected in decision-making. There is long-term planning for the rivers
and floodplain. Further, the rivers and floodplain are critical to the sustainability goals of Calgary’s
Municipal Development Plan (City of Calgary, 2009). In addition to the recreational functions stated above,
the rivers and floodplain are valued for development. Particularly, the City’s origins at the confluence of
the Bow and Elbow Rivers is being re-imagined by the Rivers District Revitalization of East Village and
Victoria Park East (City of Calgary, 2007, 2017b; CMLC, 2019; City of Calgary, 2020p; Stephen, 2020). To
protect against flooding, the City and developers adopt the view that watershed infrastructure can be
managed and transformed for human consumption, that the floodplain is hybrid built-natural
infrastructure. See Table 10 and Table 11 in Appendix B for more details about these narratives.
Resilience has become much more important to city building efforts since 2013. Resilience against
urban flooding has became “a top priority” (City of Calgary, 2020h, p. 3). Among the three types of
resilience, the City’s approach reflects persistence and adaptation. Persistence is foremost, as resilience is
defined as “the capacity to endure and recover from disruptive events” (City of Calgary, 2017e, p. 5).
Adaptation is secondary and specific to urban flooding: “there will always be a need to prepare, respond
and adapt to floods” (City of Calgary, 2020l). Persistence and adaptation are reflected in narratives about
11Daniel Tse Place Identity: Urban Water and the Anthropocene
development within the floodplain. The City notes that the costs to relocate all development out of the
floodplain is “extraordinarily high (over $2 Billion)” (City of Calgary, 2017c, p. 12), suggesting persistence.
However, they further pursue strategic buyouts of properties to “reduce future flood damages” (City of
Calgary, 2017c, p. 12), suggesting adaptation. These narratives contrast the ones about new development
in the floodplain, which suggest resilience as transformation of the watershed as hybrid built-natural
infrastructure.
In combination, the views about resilience and infrastructure exemplify inconsistencies about the
role of people in building resilience. On the one hand, resilience is framed as an activity and process for a
more equitable society. City documents (City of Calgary, 2016b, 2017d) suggest that all Calgarians have a
stake and role in building resilience. On the other hand, the knowledge capital and resilience capability is
rarefied. The City looks to industry and subject matter experts for advice and subsequently brokers the
agenda about flood resilience, engaging with those it deems necessary (City of Calgary, 2017d, pp. 2, 10).
In other words, citizens and the broader public experience the first-hand impacts of flooding yet should
necessarily lean on expert advice and City leadership in times of crisis by design. This suggests that the
share of public ownership about resilience is actually much smaller in practice. See Table 15 and Table 16
in Appendix D for more details about these narratives.
5. DISCUSSION
One critique of urban resilience is that it is power-blind (Davoudi, 2012). In other words, it is
employed as a normative instrument for reaching improved (more resilient) urban outcomes with little
consideration for human equity. The following discussion demonstrates that resilience is not neutral, that
it is unequally spatialized across urban landscapes. Section 5.1 is a synthesis of the spatial and narrative
analysis that supports a politics of resilience described in Section 5.2. Finally, takeaways are given in
Section 5.3.
5.1 Spatial and Narrative Analysis
The spatial analysis reconciles the spatial benefits of flood mitigation with the socioeconomic profile
at four different scales (Table 1). Appendix F contains a combined drawing set produced as a record of this
analysis for the six variables described in Table 2. When comparing across scales, conclusions are weak
and necessarily generalized since the CMA and CSD scales are so large they obscure local character and
context. What does come through, however, is that the City of Calgary is either representative of the
metropolitan region (age characteristics) or exhibits qualities typical of urban centres (richer, denser, more
socially diverse). Thus, targeted flood mitigations for the City benefits the region overall, broadly speaking.
A more nuanced understanding of resilience is revealed by comparing the baseline and vulnerability
variables at the ADA scale for the areas most impacted. A visual and semantic assessment of the drawing
set (Appendix F) and flood mitigations (Section 4.6) leads to the critical ADAs listed in Table 3. Table 4
summarizes their socioeconomic profile. In terms of financial capacity, the critical ADAs have at least the
average income of Calgarians, but are more (Bowness, Downtown) or less (Glenmore Reservoir area)
income vulnerable than the City overall. This is analogous for physical ability. The critical ADAs are at least
as old as the average Calgarian but are more (Bowness, Glenmore Reservoir area) or less (Downtown) age
vulnerable. For social character, all critical ADAs are as dense as the Calgary average but less socially
diverse. This demonstrates that the socioeconomic profile is spatially uneven. For example, higher average
income suggests “less” need for resilience, but older average age and higher density suggest the opposite.
12Daniel Tse Place Identity: Urban Water and the Anthropocene
When vulnerability is considered, there is further fragmentation. For example, the Glenmore Reservoir
area has the least income vulnerability, most age vulnerability, and least social diversity. The resilience
trade-offs quickly become wicked. See Appendix E for more details about the spatial analysis and
interpretation of drawings.
Table 3: Critical Aggregate Dissemination Areas
ADA Number
Bowness 050, 052, 061
Downtown 095, 095, 098, 102, 104, 106, 107, 109
Glenmore Reservoir area 118, 125, 128
Table 4: Socioeconomic Profile for Calgary, Bowness, Downtown, and Glenmore Reservoir Area
Average Income Average Age Population Social
Income ($) Vulnerability Age (Years) Vulnerability Density (p/km2) Diversity
Calgary
44,000 0.4 37.6 0.64 1501.1 0.4
Average
Bowness 44,500 0.64 43.1 0.72 1804.2 0.19
Downtown 48,500 0.65 38.8 0.39 6962.5 0.36
Glenmore
51,000 0.32 46.2 0.88 1682.1 0.17
Reservoir area
Broadly, the narrative analysis suggests three main themes. First, the rivers and floodplains are
natural capital assets for all Calgarians to utilize and enjoy. Second, resilience is important to Calgary’s
overall city building efforts and is practiced as persistence or adaptation. Third, resilience is rarefied for
decision-makers and subject matter experts at the expense of the everyday person. Combining the spatial
and narrative analysis supports the critique that the production of flood resilience is unequal and power-
blind. Indeed, fulfilling all the 1:200-year flood event mitigations would protect the City and wider region,
but the benefits diverge and fragment across the urban landscape by socioeconomic profile.
Based on the three pairs of variables adopted in this project (Table 2), the production of urban
resilience is then an exercise in trade-offs. Should resilience be prioritized for Downtown since it has high
income vulnerability and high social diversity? Or should resilience be prioritized for the Glenmore
Reservoir area, which has high age vulnerability? Beyond these trade-offs, the upgraded dam gates have
immediate value for the Glenmore Reservoir area. But both watershed-scale mitigations for the Bow and
Elbow Rivers are still underway, which means Bowness and Downtown remain vulnerable. Indeed, it is
rational to link resilience to the level and extent of flooding (ie. based on topology and storm event). This
approach to resilience remains power-blind, however, as it broadly overlooks the local need and human
equity considerations associated with the socioeconomic profile of flood impacted areas.
5.2 Politics of Resilience
To inform a politics of resilience about flood mitigation, this section builds upon the uncritical trade-
offs and power-blindness highlighted above. Specifically, it emulates the approach by Meerow and Newell
(2019) by asking who, what, when, where, and why. Asking these questions can support and clarify the
intentions behind pursuing different types of resilience (persistence, adaptation, or transformation).
Further, these questions are a mirror and litmus test for validating if policy and decision-making aligns with
the prevailing narratives about the rivers, floodplain, and resilience in the first place. Insight to these
questions are given in Table 5.
13Daniel Tse Place Identity: Urban Water and the Anthropocene
Table 5: The Politics of Resilience
Who Who determines what is desirable? All levels of government and industry decide the
outcomes of resilience. Citizens engagement, while a consideration in the resilience
building process, does not drive the production of urban resilience.
Whose resilience is prioritized? People and development (whether existing or proposed)
within the floodplain benefit from improved resilience up to the 1:200-year flood event.
The spatialization of resilience is driven by topology rather than socioeconomic profile,
local need and human equity.
Who is included (and excluded)? Decision-making power resides with government and
industry. Citizens play a passive role in deciding the outcomes of resilience.
What What are we being resilient to? Water damage in terms of river and stormwater flooding
and disruption to the daily lives of people and businesses within the floodplain.
What is included in the urban system? The rivers, floodplain and watersheds within and
upstream of the City in addition to the urban built environment within City limits .
Is the focus on generic or specific resilience? The focus is specific to flood mitigation.
When Does the resilience respond to shocks or stresses? The resilience responds to shocks on
the watershed infrastructure and urban built environment.
Is the focus on long or short-term resilience? The focus is on resilience up to the 1:200-
year flood event, which has a 0.5% chance of occurring in a given year.
Is the focus on resilience for present or future generations? The investment in resilience
benefits both present and future generations up to the 1:200-year flood event. However,
the major capital expenditures may become a liability for future generations, eroding the
future resilience.
Where What are the spatial boundaries? Mitigations occur in 3 scales: property, community, and
watershed. Ultimately, the City seeks to manage the watershed as infrastructure. This
extends Calgary’s flood resilience boundaries beyond it’s political borders, as the
Springbank Reservoir, Ghost Reservoir and future Bow River Reservoir all belong to
municipalities outside of the City of Calgary.
Is the resilience of some areas prioritized over others? Resilience is prioritized based on
flooding extents of the 1:200-year flood event. This is driven necessarily by topology and
does not reflect socioeconomic need of people or development living or operating in the
floodplain. Flood mitigation infrastructure within the City is underway or complete. The
net effect is prioritized resilience along the Elbow River.
Does building resilience in some areas affect resilience elsewhere? The specific focus on
flood resilience diverts resources from other areas of the City that remain underinvested.
Why What is the goal and underlying motivation for building urban resilience? The underlying
motivation is to persist in the floodplain (and adapt as possible). The rivers and floodplain
as natural capital assets that Calgarians enjoy as recreation (fishing, boating, parks and
open space) or development (Rivers District) are protected.
14Daniel Tse Place Identity: Urban Water and the Anthropocene
5.3 Takeaways
To move towards a world that is more resilient and equitable, three key takeaways are clear. First,
resilience in practice should think critically about who, what, when, where, and why. These questions can
guide dialogues on how resilience is spatialized and bring more voices and stakeholders into the fold of
decision-making. By raising these questions, it may be possible to rectify the citizen engagement process
by making wicked trade-offs more legible. This is one pathway to inoculate the power-blindness critique
and co-create urban resilience.
Second, resilience is necessarily spatial so policy should be nested. Rather than standalone reports
and strategies solely focused on resilience, policy should permeate the breadth and depth of strategic
municipal documents. They should also extend vertically across levels of government and laterally across
jurisdictions. This is one way to address the slow progress towards the new reservoirs for the Bow and
Elbow Rivers.
Finally, pause and reflection should be accorded to whether the pursuit of resilience is a net positive
or net negative. This is about questioning resilience as a normative instrument. I would argue that a
reasonable urban practitioner would reasonably foresee future consequences and damage to people and
development within the floodplain from urban flooding. In this case study, the City of Calgary estimated
that it would cost about $2 billion to relocate development (City of Calgary, 2017c, p. 12). The pursuit of
other mitigation options suggests that the disruption to the socioeconomic fabric is unpalatable. However,
if insurable costs for the 2013 flood alone amounted to $1.7 billion (CPL, 2014a), one instance of a flood
similar to the one in 2013 (prior to the completion of the two remaining reservoirs) would have more than
justified this relocation cost. In other words, should resilience be about persisting in the floodplain,
adapting to the floodplain, or transforming (away from) the floodplain? The answers to these questions
ultimately reflect a city’s tolerance for disruption and worldview about change.
6. CLOSURE
The narratives we tell about the places and cities we live in are linked to their resilience. In this
project, I adopted the 2013 floods in the City of Calgary as a case study to understand the connections
among place identity, the Anthropocene, and urban water. By combining a spatial analysis of flooding
impacts with a narrative analysis to understand Calgary’s socio-hydrological fabric at four different scales
(neighbourhood, community, regional, and metropolitan), I demonstrate the trade-offs and power-
blindness in the practice of resilience. An antidote to these challenges is to instantiate a politics of
resilience (Meerow and Newell, 2019). In turn, three takeaways become legible. First, resilience should
think critically about who, what, when, where, and why. Second, resilience as a policy should be spatialized
and nested laterally and vertically among governance scales. Third, resilience as a normative instrument
should be afforded pause to question if it aligns with a city’s tolerance for disruption and worldview about
change.
15Daniel Tse Place Identity: Urban Water and the Anthropocene
REFERENCES
AESRD (2013) Precipitation Map, June 19-22, 2013, Alberta Environment and Sustainable Resource
Development. Available at:
http://environment.alberta.ca/forecasting/data/precipmaps/event_Jun19_22.PDF (Accessed: 12
October 2020).
Allen, C. R. et al. (2014) ‘Panarchy: Theory and Application’, Ecosystems, 17(4), pp. 578–589. doi:
10.1007/s10021-013-9744-2.
Allenby, B. and Chester, M. (2018) ‘Reconceptualizing Infrastructure in the Anthropocene’, Issues in
Science and Technology, 34(3), pp. 58–64.
AMEC (2014) Southern Alberta Flood Recovery Task Force Flood Mitigation Measures for the Bow River,
Elbow River and Oldman River Basins Volume 1 – Summary Recommendations Report. Available at:
https://open.alberta.ca/publications/con0015233.
AMEC (2015) Environmental Overview of the Conceptual Elbow River Dam at McLean Creek. Available at:
https://open.alberta.ca/publications/cw2174.
AWPS (2013) A timeline of events and warnings leading up to the flood, Alberta WaterPortal Society.
Available at: https://albertawater.com/southern-alberta-flood-2013/timeline-of-events (Accessed: 4
October 2020).
Bowen, C. (2017) UCS2017-0266 Cover Report: Flood Mitigation Measures Assessment Report and 2016
Flood Resiliency Update, Standing Policy Committee on Utilities and Corporate Services. Calgary.
Calgary Herald (2013a) Flood at the Zoo: The inside story, 22 November, Calgary Herald. Available at:
https://calgaryherald.com/news/local-news/flood-at-the-calgary-zoo-the-inside-story (Accessed: 14
September 2020).
Calgary Herald (2013b) Timeline: How the great flood of 2013 evolved, 24 June. Available at:
https://calgaryherald.com/news/local-news/timeline-how-the-great-flood-of-2013-evolved (Accessed:
13 September 2020).
Calgary Herald (2014) Redford pledges $1 billion in flood relief; rebuild could last a decade (video), 20
June, Calgary Herald. Available at: https://calgaryherald.com/news/redford-pledges-1-billion-in-flood-
relief-rebuild-could-last-a-decade-video (Accessed: 4 October 2020).
Calgary River Valleys (2012) Get to Know the Bow River. Available at: http://calgaryrivervalleys.org/wp-
content/uploads/2014/12/Get-to-Know-the-Bow-River-second-edition-2014.pdf (Accessed: 24
September 2020).
Calgary Stampede (2013) 2013 Flood Timeline. Available at:
https://corporate.calgarystampede.com/about/2013-flood-timeline (Accessed: 18 September 2020).
Cao, Z. et al. (2017) ‘Elaborating the History of Our Cementing Societies: An in-Use Stock Perspective’,
Environmental Science and Technology, 51(19), pp. 11468–11475. doi: 10.1021/acs.est.7b03077.
CBC News (2006) 2005 flood damage results in record payout, 1 June. Available at:
https://www.cbc.ca/news/canada/calgary/2005-flood-damage-results-in-record-payout-1.590506
(Accessed: 1 October 2020).
CBC News (2013a) Alberta flooding claims at least 3 lives, 21 June. Available at:
16You can also read