UGANDA CLIMATE RISK COUNTRY PROFILE
←
→
Page content transcription
If your browser does not render page correctly, please read the page content below
CLIMATE RISK COUNTRY PROFILE

         UGANDA
COPYRIGHT
© 2021 by the World Bank Group
1818 H Street NW, Washington, DC 20433
Telephone: 202-473-1000; Internet: www.worldbank.org

This work is a product of the staff of the World Bank Group (WBG) and with external contributions. The opinions, findings,
interpretations, and conclusions expressed in this work are those of the authors and do not necessarily reflect the views or the
official policy or position of the WBG, its Board of Executive Directors, or the governments it represents.

The WBG does not guarantee the accuracy of the data included in this work and do not make any warranty, express or implied,
nor assume any liability or responsibility for any consequence of their use. This publication follows the WBG’s practice in
references to member designations, borders, and maps. The boundaries, colors, denominations, and other information shown
on any map in this work, or the use of the term “country” do not imply any judgment on the part of the WBG, its Boards, or the
governments it represents, concerning the legal status of any territory or geographic area or the endorsement or acceptance
of such boundaries.

The mention of any specific companies or products of manufacturers does not imply that they are endorsed or recommended
by the WBG in preference to others of a similar nature that are not mentioned.

RIGHTS AND PERMISSIONS
The material in this work is subject to copyright. Because the WBG encourages dissemination of its knowledge, this work may
be reproduced, in whole or in part, for noncommercial purposes as long as full attribution to this work is given.

Please cite the work as follows: Climate Risk Profile: Uganda (2021): The World Bank Group.

Any queries on rights and licenses, including subsidiary rights, should be addressed to World Bank Publications, The World Bank
Group, 1818 H Street NW, Washington, DC 20433, USA; fax: 202-522-2625; e-mail: pubrights@worldbank.org.

Cover Photos © Arne Hoel/World Bank, “Fishing boats in Entebbe” March 7, 2003 via Flickr, Creative Commons CC BY-NC-
ND 2.0. © Arne Hoel/World Bank, “Bicyclist in Kampala” March 11, 2003 via Flickr, Creative Commons CC BY-NC-ND 2.0.

Graphic Design: Circle Graphics, Reisterstown, MD.

CLIMATE RISK COUNTRY PROFILE: UGANDA                                                                                          ii
ACKNOWLEDGEMENTS
This profile is part of a series of Climate Risk Country Profiles developed by the World Bank Group (WBG). The country profile
synthesizes most relevant data and information on climate change, disaster risk reduction, and adaptation actions and policies
at the country level. The country profile series are designed as a quick reference source for development practitioners to better
integrate climate resilience in development planning and policy making. This effort is managed and led by Veronique Morin
(Senior Climate Change Specialist, WBG) and Ana E. Bucher (Senior Climate Change Specialist, WBG).

This profile was written by MacKenzie Dove (Senior Climate Change Consultant, WBG). Additional support was provided by
Yunziyi Lang (Climate Change Analyst, WBG), Kanta K. Rigaud (Lead Environmental Specialist, WBG), Uganda’s Climate
Change Department under the Ministry of Water and Environment (CCD-MWE) and Uganda’s Office of the Prime Minister’s
Department for Disaster Preparedness and Management (OPM).

Climate and climate-related information is largely drawn from the Climate Change Knowledge Portal (CCKP), a WBG online
platform with available global climate data and analysis based on the latest Intergovernmental Panel on Climate Change (IPCC)
reports and datasets. The team is grateful for all comments and suggestions received from the sector, regional, and country
development specialists, as well as climate research scientists and institutions for their advice and guidance on use of climate
related datasets.

CLIMATE RISK COUNTRY PROFILE: UGANDA                                                                                          iii
CONTENTS

FOREWORD  .  .  .  .  .  .  .  .  .  .  .  .  .  .  .  .  .  .  .  .  .  .  .  .  .  .  .  .  .  .  .  .  .  .  .  . 1

COUNTRY OVERVIEW .   .   .   .   .   .   .   .   .   .   .   .   .   .   .   .   .   .   .   .   .   .   .   .   .   .   .   .   .   .   .  2

CLIMATOLOGY  .   .   .   .   .   .   .   .   .   .   .   .   .   .   .   .   .   .   .   .   .   .   .   .   .   .   .   .   .   .   .   .   .   .   3
   Climate Baseline .  .  .  .  .  .  .  .  .  .  .  .  .  .  .  .  .  .  .  .  .  .  .  .  .  .  .  .  .  .  .  .  .  .  .  .  .  .  .  .           3
      Overview  .  .  .  .  .  .  .  .  .  .  .  .  .  .  .  .  .  .  .  .  .  .  .  .  .  .  .  .  .  .  .  .  .  .  .  .  .  .  .  .  .  .         3
      Key Trends .  .  .  .  .  .  .  .  .  .  .  .  .  .  .  .  .  .  .  .  .  .  .  .  .  .  .  .  .  .  .  .  .  .  .  .  .  .  .  .  .           5
   Climate Future .  .  .  .  .  .  .  .  .  .  .  .  .  .  .  .  .  .  .  .  .  .  .  .  .  .  .  .  .  .  .  .  .  .  .  .  .  .  .  .  .          6
      Overview  .  .  .  .  .  .  .  .  .  .  .  .  .  .  .  .  .  .  .  .  .  .  .  .  .  .  .  .  .  .  .  .  .  .  .  .  .  .  .  .  .  .         6
      Key Trends .  .  .  .  .  .  .  .  .  .  .  .  .  .  .  .  .  .  .  .  .  .  .  .  .  .  .  .  .  .  .  .  .  .  .  .  .  .  .  .  .           8

CLIMATE RELATED NATURAL HAZARDS .   .   .   .   .   .   .   .   .   .   .   .   .   .   .   .   .   .   .   .   .   .  9
   Overview .  .  .  .  .  .  .  .  .  .  .  .  .  .  .  .  .  .  .  .  .  .  .  .  .  .  .  .  .  .  .  .  .  .  .  .  .  .  .  .  .  .  . 9
   Key Trends .  .  .  .  .  .  .  .  .  .  .  .  .  .  .  .  .  .  .  .  .  .  .  .  .  .  .  .  .  .  .  .  .  .  .  .  .  .  .  .  .  . 11
   Implications for DRM .  .  .  .  .  .  .  .  .  .  .  .  .  .  .  .  .  .  .  .  .  .  .  .  .  .  .  .  .  .  .  .  .  .  .  .  .  . 13

CLIMATE CHANGE IMPACTS TO KEY SECTORS .   .   .   .   .   .   .   .   .   .   .   .   .   .   .   .   .   .   . 13
   Gender .  .  .  .  .  .  .  .  .  .  .  .  .  .  .  .  .  .  .  .  .  .  .  .  .  .  .  .  .  .  .  .  .  .  .  .  .  .  .  .  .  .  .  . 14
   Agriculture  .  .  .  .  .  .  .  .  .  .  .  .  .  .  .  .  .  .  .  .  .  .  .  .  .  .  .  .  .  .  .  .  .  .  .  .  .  .  .  .  .  . 14
   Water  .  .  .  .  .  .  .  .  .  .  .  .  .  .  .  .  .  .  .  .  .  .  .  .  .  .  .  .  .  .  .  .  .  .  .  .  .  .  .  .  .  .  .  . 18
   Energy  .  .  .  .  .  .  .  .  .  .  .  .  .  .  .  .  .  .  .  .  .  .  .  .  .  .  .  .  .  .  .  .  .  .  .  .  .  .  .  .  .  .  .  . 20
   Health .  .  .  .  .  .  .  .  .  .  .  .  .  .  .  .  .  .  .  .  .  .  .  .  .  .  .  .  .  .  .  .  .  .  .  .  .  .  .  .  .  .  .  . 22
   Fisheries .  .  .  .  .  .  .  .  .  .  .  .  .  .  .  .  .  .  .  .  .  .  .  .  .  .  .  .  .  .  .  .  .  .  .  .  .  .  .  .  .  .  . 24
   Transportation  .  .  .  .  .  .  .  .  .  .  .  .  .  .  .  .  .  .  .  .  .  .  .  .  .  .  .  .  .  .  .  .  .  .  .  .  .  .  .  . 26
   Biodiversity  .  .  .  .  .  .  .  .  .  .  .  .  .  .  .  .  .  .  .  .  .  .  .  .  .  .  .  .  .  .  .  .  .  .  .  .  .  .  .  .  .  . 27

ADAPTATION .   .   .   .   .   .   .   .   .   .   .   .   .   .   .   .   .   .   .   .   .   .   .   .   .   .   .   .   .   .   .   .   .   .   . 28
   Institutional Framework for Adaptation .  .  .  .  .  .  .  .  .  .  .  .  .  .  .  .  .  .  .  .  .  .  .  .  .  .  .  .  .                      28
   Policy Framework for Adaptation  .  .  .  .  .  .  .  .  .  .  .  .  .  .  .  .  .  .  .  .  .  .  .  .  .  .  .  .  .  .  .  .                   28
   Recommendations .  .  .  .  .  .  .  .  .  .  .  .  .  .  .  .  .  .  .  .  .  .  .  .  .  .  .  .  .  .  .  .  .  .  .  .  .  .                  29
      Research Gaps .  .  .  .  .  .  .  .  .  .  .  .  .  .  .  .  .  .  .  .  .  .  .  .  .  .  .  .  .  .  .  .  .  .  .  .  .  .  .              29
      Data and Information Gaps .  .  .  .  .  .  .  .  .  .  .  .  .  .  .  .  .  .  .  .  .  .  .  .  .  .  .  .  .  .  .  .  .                    30
      Institutional Gaps  .  .  .  .  .  .  .  .  .  .  .  .  .  .  .  .  .  .  .  .  .  .  .  .  .  .  .  .  .  .  .  .  .  .  .  .  .              30

CLIMATE RISK COUNTRY PROFILE: UGANDA                                                                                                                 iv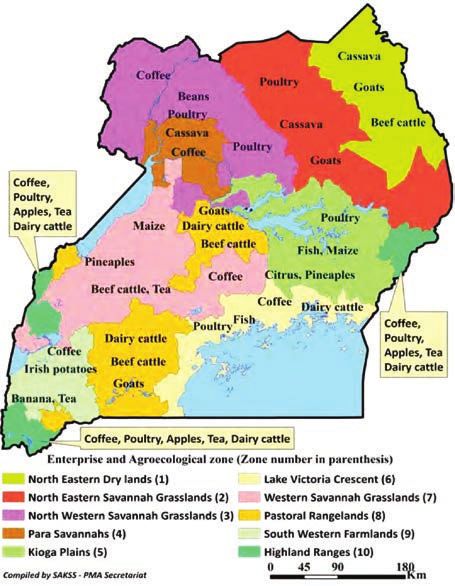
FOREWORD

Climate change is a major risk to good development outcomes, and the World Bank Group is committed to playing
an important role in helping countries integrate climate action into their core development agendas. The World
Bank Group is committed to supporting client countries to invest in and build a low-carbon, climate-resilient future,
helping them to be better prepared to adapt to current and future climate impacts.

The World Bank Group is investing in incorporating and systematically managing climate risks in development
operations through its individual corporate commitments.

A key aspect of the World Bank Group’s Action Plan on Adaptation and Resilience (2019) is to help countries
shift from addressing adaptation as an incremental cost and isolated investment to systematically incorporating
climate risks and opportunities at every phase of policy planning, investment design, implementation and evaluation
of development outcomes. For all IDA and IBRD operations, climate and disaster risk screening is one of the
mandatory corporate climate commitments. This is supported by the Bank Group’s Climate and Disaster Risk
Screening Tool which enables all Bank staff to assess short- and long-term climate and disaster risks in operations
and national or sectoral planning processes. This screening tool draws up-to-date and relevant information from
the World Bank’s Climate Change Knowledge Portal, a comprehensive online ‘one-stop shop’ for global, regional,
and country data related to climate change and development.

Recognizing the value of consistent, easy-to-use technical resources for client countries as well as to support
respective internal climate risk assessment and adaptation planning processes, the World Bank Group’s Climate
Change Group has developed this content. Standardizing and pooling expertise facilitates the World Bank Group in
conducting initial assessments of climate risks and opportunities across sectors within a country, within institutional
portfolios across regions, and acts as a global resource for development practitioners.

For developing countries, the climate risk profiles are intended to serve as public goods to facilitate upstream
country diagnostics, policy dialogue, and strategic planning by providing comprehensive overviews of trends
and projected changes in key climate parameters, sector-specific implications, relevant policies and programs,
adaptation priorities and opportunities for further actions.

It is my hope that these efforts will spur deepening of long-term risk management in developing countries and our
engagement in supporting climate change adaptation planning at operational levels.

Bernice Van Bronkhorst
Global Director
Climate Change Group (CCG)
The World Bank Group (WBG)

CLIMATE RISK COUNTRY PROFILE: UGANDA                                                                                 1
COUNTRY OVERVIEW
U
ganda is a land-locked country located in East Africa and lies in both the northern and southern hemispheres,
with approximate latitudes of 2°S to 5°N and approximate longitudes of 29.5° to 36.0°. The country is
approximately 241,500 km2 and is bordered by Kenya to the east, South Sudan to the North, Tanzania
and Rwanda to the south, and the Democratic Republic of the Congo to the West. 17% of the country is covered
by water and swamp land. The central part of Uganda is a plateau, surrounded by four main mountain ranges:
Rwenzori, Elgon, Mufumbira, and Moroto; the tallest
point is the peak of Mt. Rwenzori at 5,110 m.1 Uganda
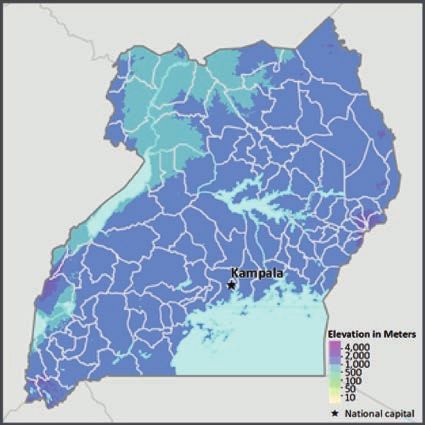
has substantial natural resources, including relatively FIGURE 1. Elevation of Uganda4
fertile soils; a high degree of biodiversity; rich vegetation;
abundant water resources; small deposits of copper, gold,
other minerals, and oil. However, the country also faces
several developmental constraints such as high population
growth (the second highest in the world),2 post-conflict
conditions in the North, soil erosion and degradation,
and impacts of malaria and HIV/AIDS; added stressors
from climate change are expected to exacerbate these
challenges.3 Figure 1 shows the elevation for Uganda.
A low-income country, Uganda has a population over 44.3
million (2019), with an annual population growth rate of
3.6% (2019).5 Uganda’s population is projected to reach
63.8 million by 2030 and 105.7 million by 2050.6 The
country has a Gross Domestic Product (GDP) of $35.1
billion (2019), growing at an average annual rate of
4.5% over the past five years. The national poverty rate
increased to 20% in 2017, however, the poorest region: the Northern region, decreased its poverty rate from 44%
(2013) to 33% (2017).7 According to 2019 data, the country’s GDP is primarily comprised of the agriculture
sector, which contributed 23.1% to GDP, the industry sector (including mining, construction, electricity, water and
gas), which contributed 26.3% of GDP, the export of goods and services which contributed17.2% to the country’s
economy;8 tourism which contributed 6.6% to GDP in 2016.9
1
Ministry of Water and Environment (2014). Uganda Second National Communication to the United Nations Framework Convention
on Climate Change. URL: https://unfccc.int/resource/docs/natc/uganc2.pdf
2
World Bank Open Data (2021). World Development Indicators. Uganda. URL: http://databank.worldbank.org/data/reports.
aspx?source=2&country
3
USAID (2012). Uganda – Climate Vulnerability Profile. URL: https://www.climatelinks.org/sites/default/files/asset/document/
uganda_climate_vulnerability_profile_jan2013.pdf
4
World Bank (2019). Internal Climate Migration Profile – Uganda.
5
World Bank Open Data (2021). World Development Indicators. Uganda URL: http://databank.worldbank.org/data/reports.
aspx?source=2&country
6
World Bank Data Bank (2021). Health Nutrition and Population Statistics: Population estimates and projections – Uganda. URL: https://
databank.worldbank.org/data/reports.aspx?source=health-nutrition-and-population-statistics:-population-estimates-and-projections
7
The World Bank (2020). Uganda Overview. URL: http://www.worldbank.org/en/country/uganda/overview
8
World Bank Open Data (2021). World Development Indicators. Uganda URL: http://databank.worldbank.org/data/reports.
aspx?source=2&country
9
World Travel & Tourism Council (2017). Travel and Tourism Economic Impact 2017-Uganda. URL: https://www.wttc.org/-/media/
files/reports/economic-impact-research/countries-2017/uganda2017.pdf
CLIMATE RISK COUNTRY PROFILE: UGANDA 2
Uganda submitted its Nationally-Determined Contributions to the UNFCCC in 2016, in support of the country’s efforts
to realize its development goals as laid out in its Poverty Reduction Strategy Paper (2010) and its National Climate
Change Policy (2015). Uganda was one of the first countries to mainstream the Sustainable Development Goals into
its development plan and developed the Uganda Green Growth Development Strategy in order to operationalize green
growth planning into the country’s development plans.10 Uganda is particularly focused on protecting its economy
and the livelihoods of its population, which is highly dependent upon natural resources and as such the government is
working to reduce vulnerability.11 Priorities are focused on increased adaptation for key sectors of agriculture, water,
energy and health, and specifically to increase sustainable agricultural and livestock production, improve forestry
management, improve infrastructure, and continue to strengthen its disaster risk management activities.12

Green, Inclusive and Resilient Recovery
The coronavirus disease (COVID-19) pandemic has led to unprecedented adverse social and economic impacts.
Further, the pandemic has demonstrated the compounding impacts of adding yet another shock on top of the multiple
challenges that vulnerable populations already face in day-to-day life, with the potential to create devastating health,
social, economic and environmental crises that can leave a deep, long-lasting mark. However, as governments take
urgent action and lay the foundations for their financial, economic, and social recovery, they have a unique opportunity
to create economies that are more sustainable, inclusive and resilient. Short and long-term recovery efforts should
prioritize investments that boost jobs and economic activity; have positive impacts on human, social and natural capital;
protect biodiversity and ecosystems services; boost resilience; and advance the decarbonization of economies.

CLIMATOLOGY

Climate Baseline
Overview
Uganda’s climate is largely tropical with two rainy seasons per year, March to May and September to December. The
northern region, which forms one quarter of the country lies outside the tropical belt, and hence experiences only
one rainy season, March to October. The rest of Uganda lies within a relatively humid equatorial climate zone, and
the topography, prevailing winds, and lakes and rivers cause large differences in rainfall patterns across the country.13
It’s location in the tropics and across the equator results in the country’s weather and seasons being determined by
the large-scale Indian Monsoon, Congo air mass, Indian Ocean Dipole (IOD) and the Inter Tropical Convergence Zone

10
     Uganda National Planning Authority (2018). The Uganda Green Growth Development Strategy, 2017/18–2030/31. URL: https://
     www.undp.org/content/dam/LECB/docs/pubs-reports/undp-ndc-sp-uganda-ggds-green-growth-dev-strategy-20171204.pdf
11
     Ministry of Water and Environment (2016). Uganda’s Nationally Determined Contribution (NDC). URL: https://www4.unfccc.int/
     sites/ndcstaging/PublishedDocuments/Uganda%20First/INDC%20Uganda%20final%20%2014%20October%20%202015.pdf
12
     Uganda National Planning Authority (2018). The Uganda Green Growth Development Strategy, 2017/18–2030/31. URL: https://
     www.undp.org/content/dam/LECB/docs/pubs-reports/undp-ndc-sp-uganda-ggds-green-growth-dev-strategy-20171204.pdf
13
     USAID (2013). Uganda Climate Change Vulnerability Assessment Report. URL: https://www.climatelinks.org/sites/default/files/
     asset/document/ARCC-Uganda%2520VA-Report.pdf

CLIMATE RISK COUNTRY PROFILE: UGANDA                                                                                               3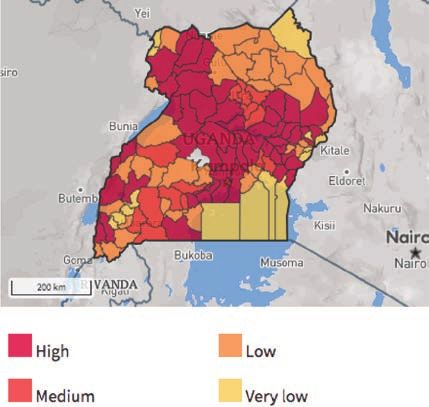
(ITCZ) systems. Uganda also experiences the El Nino Southern Oscillation (ENSO) phenomena, which are principal
 driving forces of intra-annual to inter annual rainfall variability. Specifically, the most pronounced impacts for Uganda
 are during the rainy season, September to December, where the El Nino is often equated to floods rather than La Nina
 that is often equated to droughts.14 Southern Uganda can receive between 600 to 2,200 mm of rainfall annually, while
 the northern part of the country receives between 400 and 1,600 mm per year. Precipitation patterns in Uganda
 indicate varied rainfall distribution with areas like Karamoja receiving the lowest amounts of rainfall of approximately
 400 mm and areas around Lake Victoria and Elgon receiving the highest amounts of rainfall, up to 2,200 mm.

 Overall, Uganda experiences moderate temperatures throughout the year. However, the country’s diverse
 topography results in wide-ranging temperature, from 0°C in the ice-capped Rwenzori Mountain Range and
 Mt Elgon, to 30°C in the north-eastern areas of Gulu, Kitgum and Moroto. The Rwenzori Mountain Range
 has permanent ice caps, however due to rising temperatures, the area typically covered by ice reduced by 49%
 between 1987 to 2003 and is projected to disappear by the 2040s.15 This has implications for the area’s water
 resources, livelihood activities and is likely to change its epidemiological profile.

 Analysis of data from the World Bank Group’s Climate Change Knowledge Portal for the historical period 1901–2019
 (Table 1) shows mean annual mean temperature for Uganda to be 22.8°C, with monthly temperatures ranging
 between 21.7°C (July) and 23.9°C (February). During this period, total annual average precipitation is 1,197 mm, and
 mean monthly precipitation of the country varies from 39.6 mm in January to 152.7 mm in April. Figure 2 shows
 Uganda’s most recent climatology, from 1991–2020 and Figure 3 presents the observed spatial distribution of average
 annual precipitation and temperature.

 FIGURE 2.  Average monthly temperature and rainfall for Uganda for 1991–202016
                    25                                                                              180
Temperature (°C)

                    24                                                                              120
                                                                                                          Rainfall (mm)

                    23                                                                              60

                    22                                                                              0
                          Jan   Feb   Mar   Apr    May   Jun   Jul   Aug   Sep   Oct   Nov    Dec

                                                  Rainfall       Temperature

 14
                   Ministry of Water and Environment (2014). Uganda Second National Communication to the United Nations Framework Convention
                   on Climate Change. URL: https://unfccc.int/resource/docs/natc/uganc2.pdf
 15
                   Ministry of Water and Environment (2014). Uganda Second National Communication to the United Nations Framework Convention
                   on Climate Change. URL: https://unfccc.int/resource/docs/natc/uganc2.pdf
 16
                   WBG Climate Change Knowledge Portal (CCKP, 2021).Uganda URL: https://climateknowledgeportal.worldbank.org/country/
                   uganda/climate-data-historical

 CLIMATE RISK COUNTRY PROFILE: UGANDA                                                                                                      4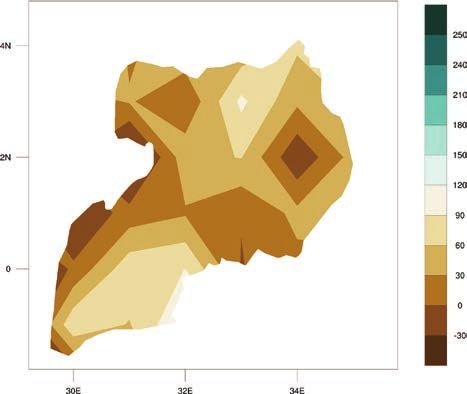
TABLE 1.  Data snapshot: Summary statistics

 Climate Variables                                                                                1901–2020
 Mean Annual Temperature (°C)                                                                         22.4°C
 Mean Annual Precipitation (mm)                                                                   1,200.1 mm
 Mean Maximum Annual Temperature (°C)                                                                 28.7°C
 Mean Minimum Annual Temperature (°C)                                                                 16.2°C

FIGURE 3.  Map of average annual temperature (left); annual precipitation (right) of Uganda,
1991–202017

Key Trends
Temperature
Average temperatures in Uganda have increased by 1.3°C since the 1960s. Notably, minimum temperatures
have increased 0.5–1.2°C for this period with maximum temperatures increasing by 0.6–0.9°C.18 Increased
average temperatures have been observed at 0.28°C per decade since 1960. Daily temperature observations
since 1960 show significantly increasing trends in the frequency of the number of hot days, and much larger
increased trends in the frequency of hot nights.19 Hot days and nights are defined as the number of days/nights
in which the temperature exceeded on 10% of days/nights in the current climate of the region and season.
Hot days in Uganda have increased by 74 days (an additional 20% of days) between 1960 and 2003. The most
significant increase has been observed in June, July, August in which hot days increased by an average of 8.6 days
per month. The average number of hot nights also increased by 136 nights since 1960 (an additional 37% of nights)

17
     WBG Climate Change Knowledge Portal (CCKP, 2021). Uganda. URL: https://climateknowledgeportal.worldbank.org/country/
     uganda
18
     USAID (2012). Uganda Climate Vulnerability Profile. URL: https://www.climatelinks.org/sites/default/files/asset/document/uganda_
     climate_vulnerability_profile_jan2013.pdf
19
     Ministry of Water and Environment (2015). Uganda National Climate Change Policy. URL: https://www.mwe.go.ug/sites/default/
     files/library/National%20Climate%20Change%20Policy%20April%202015%20final.pdf

CLIMATE RISK COUNTRY PROFILE: UGANDA                                                                                               5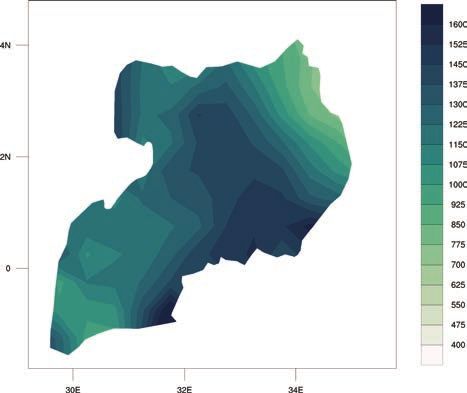
between 1960 and 2003. The most significant increases have also been observed in June, July, August in
which hot nights increased by 14 days per month. The number of cold days have decreased, by 20 days since
1960, with the rate of decrease most rapid in the September, October, November season.20 Cold days and nights
are defined as the number of days/nights in which the temperature below 10% of days/nights in the current
climate of the region and season.

Precipitation
Precipitation for the country is highly variable, but overall, Uganda has experienced a statistically significant
reduction in annual as well as seasonal rainfall. Seasonal rainfall for March, April, May has been most affected,
with decreases of 6.0 mm per month, per decade.21 Decline in rainfall has been observed in some Northern districts:
Gulu, Kitgum, and Kotido. While trends in extreme rainfall conditions are more difficult to define due to the lack
of data and seasonal variability, droughts have increased in Uganda over the past 60 years. Specifically, over the
past 20 years, western, northern and north-eastern regions have experienced more frequent and longer-lasting
drought conditions. In the highly arid, north-eastern district of Karamoja, seven droughts occurred between
1991–2000, with additional droughts occurring in 2001, 2002, 2005, 2008 and 2011.22 The percentage of
rainfall occurring from heavy precipitation events is anticipated to increase, which would also escalate the risk
of disasters such as floods and landslides.23

Climate Future
Overview
The main data source for the World Bank Group’s Climate Change Knowledge Portal (CCKP) is the CMIP5
(Coupled Inter-comparison Project No.5) data ensemble, which builds the database for the global climate change
projections presented in the Fifth Assessment Report (AR5) of the Intergovernmental Panel on Climate Change
(IPCC). Four Representative Concentration Pathways (i.e. RCP2.6, RCP4.5, RCP6.0, and RCP8.5) were selected
and defined by their total radiative forcing (cumulative measure of GHG emissions from all sources) pathway and level
by 2100. The RCP2.6 for example represents a very strong mitigation scenario, whereas the RCP8.5 assumes business-
as-usual scenario. For more information, please refer to the RCP Database. For simplification, these scenarios are
referred to as a low (RCP2.6); a medium (RCP4.5) and a high (RCP8.5) emission scenario in this profile.
Table 2 provides CMIP5 projections for essential climate variables under high emission scenario (RCP8.5) over
4 different time horizons. Figure 4 presents the multi-model (CMIP5) ensemble of 32 Global Circulation Models
(GCMs) showing the projected changes in annual precipitation and temperature for the periods 2040–2059 and
2080–2099.

20
     McSweeney, C., New, N. and Lizcane, G. (2010). Uganda, UNDP Climate Change Country Profiles. URL: https://www.geog.ox.ac.uk/
     research/climate/projects/undp-cp/UNDP_reports/Uganda/Uganda.hires.report.pdf
21
     McSweeney, C., New, N. and Lizcane, G. (2010). Uganda, UNDP Climate Change Country Profiles. URL: https://www.geog.ox.ac.uk/
     research/climate/projects/undp-cp/UNDP_reports/Uganda/Uganda.hires.report.pdf
22
     Future Climate for Africa (2016). Africa’s Climate- Helping Decision-Makers Make Sense of Climate Information. Uganda Country
     Fact Sheet. URL: http://2016report.futureclimateafrica.org/wp-content/uploads/2016/10/CDKNJ4897_FCFA_Print_WEB_15.pdf
23
     USAID (2012). Uganda Climate Vulnerability Profile. URL: https://www.climatelinks.org/sites/default/files/asset/document/
     uganda_climate_vulnerability_profile_jan2013.pdf

CLIMATE RISK COUNTRY PROFILE: UGANDA                                                                                                 6
TABLE 2. Data snapshot: CMIP5 ensemble projection
CMIP5 Ensemble Projection 2020–2039 2040–2059 2060–2079 2080–2099
Annual Temperature +0.6 to +1.5 +1.2 to +2.5 +1.9 to +3.9 +2.6 to +5.2
Anomaly (°C) (+1.0°C) (+1.8°C) (+2.8°C) (+3.7°C)
Annual Precipitation –23.5 to +25.9 –25.9 to +32.5 –26.5 to +45.1 –26.0 to +63.1
Anomaly (mm) (+1.4 mm) (+2.9 mm) (+7.37 mm) (+13.6 mm)
Note: The table shows CMIP5 ensemble projection under RCP8.5. Bold value is the range (10th-90th Percentile) and values in parentheses
show the median (or 50th Percentile).
FIGURE 4. CMIP5 ensemble projected change (32 GCMs) in annual temperature (top) and
precipitation (bottom) by 2040–2059 (left) and by 2080–2099 (right), relative to 1986–2005
baseline under RCP8.524
24
WBG Climate Change Knowledge Portal (CCKP, 2021). Uganda Projected Future Climate. URL: https://climateknowledgeportal.
worldbank.org/country/uganda/climate-data-projections
CLIMATE RISK COUNTRY PROFILE: UGANDA 7Key Trends
Temperature
Increased temperatures are expected for East Africa and specifically for Uganda. Under a high-emission scenario,
monthly temperature change is expected to increase by 1.8°C for the 2050s and by 3.7°C by the 2090s.
Increased temperatures will also impact increased aridity and the length and severity of the dry season (December
to March). Projected rates of warming are greatest in Uganda’s coolest season: June to September, with
temperatures expected to increase by 1.5 to 5.4°C by the end of the century. Hot days are expected to occur
on 15–43% of days by the 2050s and by 18–73% of days by end of century. Nights that are considered
‘hot’ (>26°C) are expected to increase more quickly than hot days.25 Temperature rise is projected to increase
across all emission scenarios throughout the end of the century. As seen in Figure 5, under a high-emission scenario,
average temperatures will increase rapidly by mid-century. Across the seasonal cycle (Figure 6), temperature
increases will be felt from September to January. These high heat days will result in significant implications for
human and animal health, agriculture, ecosystems as well as energy generation.
FIGURE 5. Historical and projected average FIGURE 6. Projected change in Summer Days
temperature for Uganda from 1986 to 209926 (Tmax> 25°C)27
29 4.0
28 3.5
3.0
27
2.5
26
degC
2.0
days
25
1.5
24 1.0
23 0.5
22 0
1980 2000 2020 2040 2060 2080 2100 –0.5
Year Jan Feb Mar Apr May Jun Jul Aug Sep Oct Nov Dec
Historical RCP 2.6 RCP 4.5 RCP 6.0 RCP 8.5
Precipitation
Under a high-emission scenario, monthly annual precipitation is expected to increase in some areas of the country,
with deceases in others, notably the northern and north-eastern areas. Rainfall is predicted to increase significantly
and consistently for the western shores of Lake Victoria and the central western region; the Mount Elgon region;
and the region extending from Mount Rwenzori to the southern parts of Lake Kioga. The greatest change in
the intensity and frequency of extreme rainfall events is likely to take place between the current and the mid-
century period in this region, which is likely to impact major agriculture and livestock zones and transportation
25
McSweeney, C., New, N. and Lizcane, G. (2010). Uganda, UNDP Climate Change Country Profiles. URL: https://www.geog.ox.ac.uk/
research/climate/projects/undp-cp/UNDP_reports/Uganda/Uganda.hires.report.pdf
26
WBG Climate Change Knowledge Portal (CCKP, 2021). Interactive Climate Indicator Dashboard - Agriculture. Uganda. URL https://
climatedata.worldbank.org/CRMePortal/web/agriculture/crops-and-land-management?country=UGA&period=2080-2099
27
WBG Climate Change Knowledge Portal (CCKP, 2021). Interactive Climate Indicator Dashboard - Agriculture. Uganda. URL: https://
climatedata.worldbank.org/CRMePortal/web/agriculture/crops-and-land-management?country=UGA&period=2080-2099
CLIMATE RISK COUNTRY PROFILE: UGANDA 8routes. Overall, there is a likely increase for the
number of consecutive wet days (daily accumulation FIGURE 7. Annual average precipitation in
of rainfall 1mm per day) throughout the year. Uganda for 1986 to 209929
Additionally, the number of days with precipitation 2400
greater than 20mm will increase in each of the two 2200
2000
rainy seasons in Uganda. Figure 7, shows the change
1800
in the projected annual average precipitation for
mm
1600
Uganda.28 For the annual national-scale aggregate, 1400
average precipitation is likely to increase slightly by 1200
the of the century under a high emissions scenario 1000
800
of RCP8.5, with much of the increase expected for 1980 2000 2020 2040 2060 2080 2100
Year
certain areas and occurring through an increase in Historical RCP 2.6 RCP 4.5 RCP 6.0 RCP 8.5
intense precipitation events.
CLIMATE RELATED NATURAL HAZARDS
Overview
Uganda is at risk to natural disasters. The country experiences extreme weather events which lead to mudslides,
landslides and flooding, particularly for the country’s mountain regions and related districts such as Mbale in the
Mt Elgon region.30 Extreme events leading to disasters such as floods, droughts, and landslides have increased
over the last 30 years. Flooding has become more frequent, largely due to more intense rainfall.31 Over the
past two decades, an average of 200,000 Ugandans are affected each year by disasters. Increased intensity of
heavy rainfall has led to greater impact of floods and are causing more damage due to expanded infrastructure,
human settlement and general development of the country.32
Uganda’s vulnerability is exacerbated due to its high level of poverty and its high dependence on ‘climate sensitive’
sectors: agriculture, water, fisheries, tourism, and forestry. The country is at high-risk to natural disasters such
as flooding, drought, and landslides, however, its topographic diversity and highly marginalized segments of the
28
WBG Climate Change Knowledge Portal (CCKP, 2021). Uganda Water Dashboard. Data Description. URL: https://climateknowledge
portal.worldbank.org/country/uganda/climate-sector-water
29
WBG Climate Change Knowledge Portal (CCKP, 2021). Climate Data-Projections. Uganda. URL: https://climateknowledgeportal.
worldbank.org/country/uganda/climate-sector-water
30
Ministry of Agriculture, Animal Industry and Fisheries (2018). Guidelines for Mainstreaming Climate Change Adaptation and
Mitigation in Agricultural Sector Policies and Plans. URL: https://www.agriculture.go.ug/wp-content/uploads/2019/09/Guidelines-
for-Mainstreaming-Climate-Change-Adaptation-and-Mitigation-in-the-Agricultural-Sector-Policies-Plans-1.pdf
31
Ministry of Water and Environment (2014). Guidelines for the Integration of Climate Change in Sector Plans and Budgets. URL: http://
ccd.go.ug/wp-content/uploads/2018/04/National-Climate-Change-Mainstreaming-Guidelines-.pdf
32
Department of Disaster Preparedness and Management (2011). The National Policy for Disaster Preparedness and Management.
URL: https://reliefweb.int/sites/reliefweb.int/files/resources/1.%20National%20Policy%20for%20Disaster%20Preparedness%20
%26%20Management.pdf
CLIMATE RISK COUNTRY PROFILE: UGANDA 9population, make it additionally vulnerable. Additional, non-climate stressors such as inadequate infrastructure
to handle the increasing population are also impacting the vulnerability to natural disaster sensitivity and climate
change vulnerability. With an urbanization rate of 5.4%, increasing amounts of the population are living in urban
areas, putting pressure on existing infrastructure as well as scarce available land; a diminishing natural resource.
As of 2017, 9.9 million people lived in urban areas of Uganda. This is projected to increase to 19.9 million by
2030 and 31.5 million by 2040,33 causing increased pressure on urban infrastructure with increased likelihood
of vulnerability for poorer and less-resilient communities.34 Economic efforts and the development of industry
has put additional pressure on the exploitation of forests, lake-fisheries, inner-city development, and agriculture
lands, which has contributed to deforestation, overfishing, degradation of agriculture areas and forest environments,
as well as the pollution and unsustainable use of water resources.35
Poverty, land degradation, rapid and unplanned urbanization since the 1960s, and weak enforcement of building
codes and zoning regulations, and a lack of coordinated disaster response strategies present additional challenges to
the country’s adaption and resilience efforts. The country’s debt limits available resources and thus ability to recover
from disasters or provide necessary social protection.36 Environmental degradation, underdeveloped irrigation
systems, and near-absence of disaster preparedness at the community level are contributing factors to increasing
drought risk in Uganda.37
Data from the Emergency Event Database: EM-Dat database, presented in Table 3, shows the country has endured
various natural hazards, including floods, landslides, epidemic diseases, and storms.
TABLE 3. Natural disasters in Uganda, 1900–202038
Natural Hazard Events Total Total Damage
1900–2020 Subtype Count Deaths Total Affected (‘000 USD)
Drought Drought 9 194 4,975,000 1,800
Earthquake Ground Movement 5 115 58,100 71,500
Bacterial Disease 28 3,204 237,665 0
Epidemic
Viral Disease 10 466 108,036 0
Flash Flood 4 76 8,614 0
Flood
Riverine Flood 15 267 1,051,945 6,871
Storm Convective Storm 1 23 47 0
Landslide 8 540 151,546 0
Landslide
Mudslide 1 51 0 0
33
World Bank DataBank (2021). Health Nutrition and Population Statistics: Population estimates and projections – Uganda. URL: https://
databank.worldbank.org/data/reports.aspx?source=health-nutrition-and-population-statistics:-population-estimates-and-projections
34
World Bank (2015). Press Release. Managing Rapid Urbanization Can help Uganda Achieve sustainable and Inclusive Growth.
March 3, 2015. URL: http://www.worldbank.org/en/news/press-release/2015/03/03/managing-rapid-urbanization-can-help-
uganda-achieve-sustainable-and-inclusive-growth
35
Department of Disaster Preparedness and Management (2011). The National Policy for Disaster Preparedness and Management.
URL: http://www.lse.ac.uk/GranthamInstitute/wp-content/uploads/laws/1732.pdf
36
Department of Disaster Preparedness and Management (2011). The National Policy for Disaster Preparedness and Management.
URL: http://www.lse.ac.uk/GranthamInstitute/wp-content/uploads/laws/1732.pdf
37
Office of the Prime Minister of Uganda (2016). District Hazard, Risk and Vulnerability Profiles. URL: http://www.necoc-opm.go.ug/hazard.html
38
EM-DAT: The Emergency Events Database - Universite catholique de Louvain (UCL) - CRED, D. Guha-Sapir, Brussels, Belgium.
http://emdat.be/emdat_db/
CLIMATE RISK COUNTRY PROFILE: UGANDA 10Key Trends
Flooding, particularly in low-lying areas of the country, presents the largest risk. Each year, floods impact nearly
50,000 people and costs over $62 million.39 Uganda experiences both flash floods and slow-onset floods, which
are common in urban areas, low-lying areas, areas along river banks and swamplands. Areas most prone to floods
are the capital city, Kampala, as well as the northern and eastern areas of the country.40 Heavy rainfall in arid
areas has led to flash flooding causing infrastructure damage. Areas such as Gulu District, face large challenges
in the rainy seasons as large areas of the district become impassable, often resulting in food shortages and
inaccessibility to health facilities and schools due to the destruction of roads and bridges from flooding.41
Droughts affected close to 2.4 million people between 2004 and 2013, and drought conditions in 2010 and 2011
caused an estimated loss and damage value of $1.2 billion, equivalent to 7.5% of Uganda’s 2010 gross domestic
product.42 Increasing heat conditions for the country are further exacerbating this problem. Severe drought in Uganda
can result in human and livestock deaths and impacted areas are also experiencing reduced water tables, diminished
water levels in major lakes as well as crop failures. Rapid population growth is also putting additional strain on depleted
water resources. The most drought-prone areas in Uganda are the districts in the ‘Cattle Corridor’. Extreme drought
has been most prevalent in the Karamoja regions, which has resulted in frequent agricultural losses and significant
food insecurity concerns.43 Increasing heat risks are expected to occur in areas with decreased water availability, with
the likelihood to increase impacts of drought. Figure 8 presents the risk of river flood and urban flood risk for Uganda.
FIGURE 8. Uganda river flood risk (left)44 and urban flood risk (right)45
39
The World Bank (2020). GFDRR – Uganda Country Profile. URL: https://www.gfdrr.org/en/uganda
40
Department of Disaster Preparedness and Management (2011). The National Policy for Disaster Preparedness and Management.
URL: http://www.lse.ac.uk/GranthamInstitute/wp-content/uploads/laws/1732.pdf
41
Ministry of Water and Environment (2014). Guidelines for the Integration of Climate Change in Sector Plans and Budgets. URL: http://
ccd.go.ug/wp-content/uploads/2018/04/National-Climate-Change-Mainstreaming-Guidelines-.pdf
42
The World Bank (2020). GFDRR – Uganda Country Profile. URL: https://www.gfdrr.org/en/uganda
43
Department of Disaster Preparedness and Management (2011). The National Policy for Disaster Preparedness and Management.
URL: http://www.lse.ac.uk/GranthamInstitute/wp-content/uploads/laws/1732.pdf
44
ThinkHazard! (2020). Uganda River Flood. URL: http://thinkhazard.org/en/report/253-uganda/FL
45
ThinkHazard! (2020). Uganda Urban Flood. URL: http://thinkhazard.org/en/report/253-uganda/UF
CLIMATE RISK COUNTRY PROFILE: UGANDA 11Climate change is expected to increase the risk and intensity of flooding as well as increase likelihood for water
scarcity for certain areas of the country. Increased intense rainfall events, with the possibility of higher rainfall for
some areas will lead to the heightened risk of flooding, loss of life, and damage to property and infrastructure. Intense
rainfall and flooding may also result in soil erosion and water logging of crops, decreasing yields and increasing food
insecurity. Additionally, the likelihood of increased aridity and drought stress is expected to lead to water scarcity in
some areas, resulting in increased demand for water, raising and the potential for conflict and biodiversity loss. Higher
temperatures with increased aridity may also lead to livestock stress and reduced crop yields.46
This is likely to result in further, significant economic losses, damage to agricultural lands and infrastructure as
well as human casualties. Furthermore, land degradation and soil erosion, exacerbated by recurrent flood and
drought, adversely impact agricultural production, further affecting the livelihoods of the rural poor. In addition, the
relative lack of risk-informed territorial planning and a weak enforcement of building codes has resulted in unsafe
construction in many high-risk areas, particularly on slopes and degraded land, increasing risk of landslides.
Small rural farmers, are more sensitive to impacts of disasters (floods, dry periods, landslides) because they have
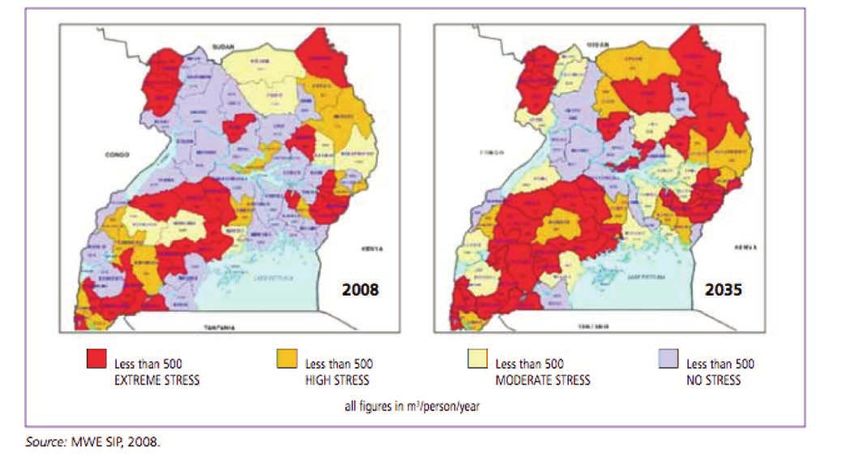
limited resources with which to influence and increase adaptive capacity.47 Figure 9 shows the distribution of water
stress in Uganda for 2008 and the projected areas of water stress in the country for 2035.
FIGURE 9. Distribution of water stress in Uganda for 2008 and projected for 203548
46
Future Climate for Africa (2016). Africa’s Climate- Helping Decision-Makers Make Sense of Climate Information. Uganda Country
Fact Sheet. URL: http://2016report.futureclimateafrica.org/wp-content/uploads/2016/10/CDKNJ4897_FCFA_Print_WEB_15.pdf
47
Department of Disaster Preparedness and Management (2011). The National Policy for Disaster Preparedness and Management.
URL: http://www.lse.ac.uk/GranthamInstitute/wp-content/uploads/laws/1732.pdf
48
Department of Disaster Preparedness and Management (2012). The 2010–2011 Integrated Rainfall Variability Impacts, Needs Assessment
and Drought Risk Management Strategy. Page 59. URL: http://gfdrr.org/sites/gfdrr/files/UGANDA_PDNA_Report_2012.pdf
CLIMATE RISK COUNTRY PROFILE: UGANDA 12Implications for DRM
The Ugandan Government has taken significant steps to advance its Disaster Risk Management (DRM) and
climate resilience. Uganda’s economic development framework and its 2010 Poverty Reduction Strategy Paper
identified disaster management as one of the enabling sectors to achieve sustainable development. The Ministry
of Disaster Preparedness and Refugees, part of the Office of the Prime Minister, facilitates collaboration among
ministries, local governments, and communities for disaster preparedness and management.49 The country’s Disaster
Management Policy was adopted in 2011 and outlines DRM priorities, which include strengthening institutions
and financing for climate change adaptation; developing multi-sectoral adaptation plans; implementing programs to
reduce the socio-economic impact of climate change and natural disasters; and increasing community-level
resilience to climate change.50
The strategic DRM support provided to provinces and municipalities is enabling leaders to establish their own
Disaster Prevention, Mitigation, and Response Committees and to develop and implement their own emergency
and DRM plans. Capacity building support for disaster preparedness and management and post-disaster recovery
is also being provided by bi-lateral partners. The integration of DRM criteria into building codes, regulations,
and zoning laws is also underway to increase the resilience of education and health infrastructure.51
CLIMATE CHANGE IMPACTS TO KEY SECTORS
Climate change is projected to increase temperatures and impact water availability across Uganda, with some
areas expected to experience flooding due to increased intensity of rainfall (central and southern regions), as well
as the continued aridity and increased frequency of droughts for others (north, northeastern, west and southwestern
regions). Key sectors such as, agriculture, health, water resources, wetlands, and forests are vulnerable to these
climate change impacts in Uganda.52 Temperature rise as well as the increase in the frequency and intensity of extreme
droughts and floods are likely to reduce crop yields and cause a loss in livestock, which will have important
implications for food security. Additionally, water resources are also likely to be increasingly strained in Uganda’s
climate future. While it is projected that precipitation will increase in some parts of East Africa, warmer temperatures
will accelerate the rate of evapotranspiration, thus reducing the benefits of increased rainfall. With more frequent
49
The World Bank (2020). GFDRR – Uganda Country Profile. URL: https://www.gfdrr.org/en/uganda
50
Department of Disaster Preparedness and Management (2011). The National Policy for Disaster Preparedness and Management.
URL: http://www.lse.ac.uk/GranthamInstitute/wp-content/uploads/laws/1732.pdf
51
Ministry of Water and Environment (2014). Uganda Second National Communication to the United Nations Framework Convention
on Climate Change. URL: https://unfccc.int/resource/docs/natc/uganc2.pdf
52
Ministry of Water and Environment (2014). Uganda Second National Communication to the United Nations Framework Convention
on Climate Change. URL: https://unfccc.int/resource/docs/natc/uganc2.pdf
CLIMATE RISK COUNTRY PROFILE: UGANDA 13and severe droughts, the region will likely experience negative impacts on water supply, biodiversity, and hydropower
generation. A potential simultaneous increase in floods poses a serious water pollution threat, affecting health of
wetland and forest ecosystems, which provide critical ecosystem services for communities in Uganda.53
Heavy rains, flooding, and soil erosion puts both urban and rural infrastructure at risk, particularly for poor and
vulnerable groups. Flooding along Lake Victoria is likely to damage property and agricultural areas from flooding,
landslides and soil erosion. Furthermore, increased occurrences of drought conditions and reduced rainfall across
much of the country will impact agriculture, livestock and human health. This will specifically be impactful for the
northern and central zones and traditional ‘cattle corridor’ already at risk from increasing aridity. Environmental
degradation, impacted water resources, and loss of biodiversity and ecosystem services constitute serious obstacles
to the country’s continued development and poverty reduction efforts, increasing vulnerability to risks and hazards,
increasing the importance for sustainable adaptation and resilience measures.54
Gender
An increasing body of research has shown that climate-related disasters have impacted human populations in
many areas including agricultural production, food security, water management and public health. The level of
impacts and coping strategies of populations depends heavily on their socio-economic status, socio-cultural
norms, access to resources, poverty as well as gender. Research has also provided more evidence that the
effects are not gender neutral, as women and children are among the highest risk groups. Key factors that
account for the differences between women’s and men’s vulnerability to climate change risks include: gender-
based differences in time use; access to assets and credit, treatment by formal institutions, which can constrain
women’s opportunities, limited access to policy discussions and decision making, and a lack of sex-disaggregated
data for policy change.55
Agriculture
Overview
Uganda depends significantly on rain-fed agriculture and the agricultural sector plays a critical role in Uganda’s
food security and economic prosperity. The agricultural sector employs 70% (2014) of the working population
and contributes over 1/4 of GDP.56 Climate change could see a reduction in the national production of food crops
such as cassava, maize, millet and groundnuts by the 2050s. Overall losses of food crops by the 2050s could reach
up to US$1.5 billion. Fishing is a key livelihood source for up to 1.2 million people, and employs about 8% of the
53
USAID (2012). Uganda Climate Vulnerability Profile. URL: https://www.climatelinks.org/sites/default/files/asset/document/uganda_
climate_vulnerability_profile_jan2013.pdf
54
Uganda National Planning Authority (2018): The Uganda Green Growth Development Strategy, 2017/18–2030/31. URL: https://
www.undp.org/content/dam/LECB/docs/pubs-reports/undp-ndc-sp-uganda-ggds-green-growth-dev-strategy-20171204.pdf
55
World Bank Group (2016). Gender Equality, Poverty Reduction, and Inclusive Growth. URL: http://documents1.worldbank.org/
curated/en/820851467992505410/pdf/102114-REVISED-PUBLIC-WBG-Gender-Strategy.pdf
56
Ministry of Agriculture, Animal Industry and Fisheries (2015). Uganda Climate Smart Agriculture Country Program 2015–2025.
URL: https://canafrica.com/wp-content/uploads/2015/08/3-UGANDA-CLIMATE-SMART-AGRICULTURE-PROGRAMME.Final_.pdf
CLIMATE RISK COUNTRY PROFILE: UGANDA 14total labor force. Climate change trends in Uganda
such as reduced water availability and watershed FIGURE 10. Uganda’s agro-ecological azones58
re-charge is likely to stress fisheries, resulting in
disrupted livelihoods and significant economic
losses.57 Figure 10 shows the country’s agro-
ecological zones, which experience varying degrees
of vulnerability to climate-related hazards, mainly
drought, floods, storms, and pests and diseases.
Climate Change Impacts
Rising temperatures and shifting rainfall patterns
may increase soil erosion and increase growing
difficulties for many crops as well as shorten
growing seasons. These scenarios are also likely
to alter the occurrence and distribution of pests.
Rising temperatures are expected to increase
suitable conditions for crop diseases and pest
infestations such as blast and bacterial leaf blight in
rice, aflatoxin in maize, fungal and viral diseases in
banana and beans, and coffee rust in coffee trees.59
Erratic rainfall may increase post-harvest storage
risks as well as impact crops needing to be dried in
the sun (maize, beans, coffee, rice).60 Districts such
a Biukwe, Gulu and Mbale are particularly at risk due to high levels of consumption and cash crops grown in
these districts, coupled with specific climate outlooks of increased temperature and variable rainfall. Increased
dry periods and continued soil degradation, associated with unsustainable agricultural practices, contributes to
a reduction in reservoirs and undermines food security. Major export crops like coffee and tea could also see
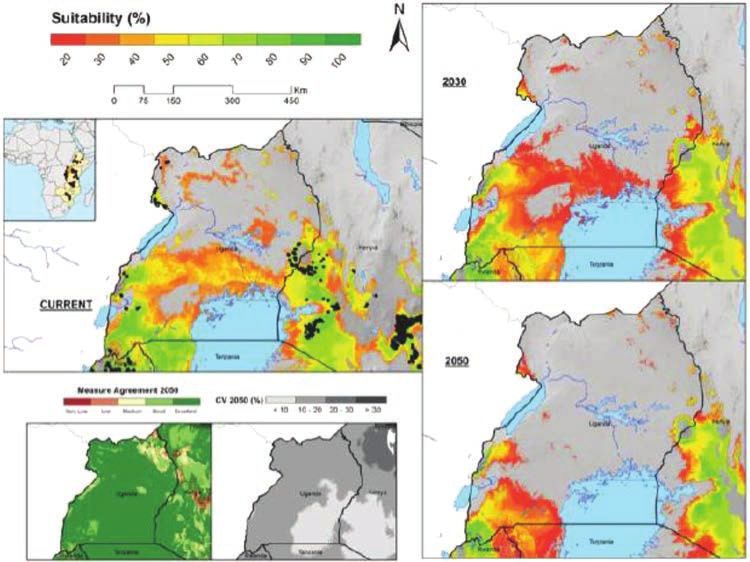
a reduction in yields leading to combined economic losses of about US$1.4 billion in mid-century. Figure 11
shows the predicted suitability for Arabica coffee production in Uganda through mid-century. Climate-induced
losses are expected to range from 10–50% yield losses, with the potential to reduce foreign exchange earnings
by $15–$80 million per year.61
57
Future Climate for Africa (2016). Africa’s Climate-Helping Decision-Makers Make Sense of Climate Information. Uganda Country
Fact Sheet. URL: http://2016report.futureclimateafrica.org/wp-content/uploads/2016/10/CDKNJ4897_FCFA_Print_WEB_15.pdf
58
Ministry of Agriculture, Animal Industry and Fisheries (2018). National Adaptation Plan for the Agricultural Sector. Page 18.
URL: https://www.agriculture.go.ug/wp-content/uploads/2019/09/National-Adaptation-Plan-for-the-Agriculture-Sector.pdf
59
Ministry of Water and Environment (2015). Economic Assessment of the Impacts of Climate Change in Uganda – National Level
Assessment: Agricultural Sector Report. URL: https://cdkn.org/wp-content/uploads/2015/12/Uganda_Agricultural_Sector.pdf
60
Ministry of Water and Environment (2015). Uganda National Climate Change Policy. URL: https://www.mwe.go.ug/sites/default/
files/library/National%20Climate%20Change%20Policy%20April%202015%20final.pdf
61
Ministry of Water and Environment (2015). Economic Assessment of the Impacts of Climate Change in Uganda – National Level
Assessment: Agricultural Sector Report. URL: https://cdkn.org/wp-content/uploads/2015/12/Uganda_Agricultural_Sector.pdf
CLIMATE RISK COUNTRY PROFILE: UGANDA 15FIGURE 11. Predicted suitability for Arabica coffee production in coffee-producing zones in
Uganda for current, 2030, and 205062
The agriculture sector relies heavily on ground and surface water supply, which are sensitive to localized land use
and likely to experience decreasing recharge and quality due to reduced precipitation in some areas, and increased
evaporation. An expected trend of reduction in rainfall in the peak of the rainy season can have consequences for
agriculture and water quality, especially in more arid areas. Increased temperatures and the threat of waterlogging
of fields may also result in an increased presence of pests and diseases harmful to yield production and quality.
Changes in seasonality of precipitation will lead to further soil erosion and loss of soil fertility. Increased drought,
as expected in the northwestern agricultural areas, is likely to reduce crop yields.63
The direct impacts of climate change on livestock can also be related to heat. Under present climate conditions,
heat stress makes it difficult for animals to keep up with heat dissipation, rendering them vulnerable to heat
stress during, at least, part of the year. Heat stress has a variety of detrimental effects on livestock, but can
include reductions on milk production and reproduction, particularly for dairy cows. Extreme events, such as
heat waves, may particularly affect beef and dairy cattle, as well as crop yields and crop production quality.
62
Ministry of Water and Environment (2015). Economic Assessment of the Impacts of Climate Change in Uganda – National Level
Assessment: Agricultural Sector Report. Page 20. URL: https://cdkn.org/wp-content/uploads/2015/12/Uganda_Agricultural_Sector.pdf
63
USAID (2012). Uganda Climate Vulnerability Profile. URL: https://www.climatelinks.org/sites/default/files/asset/document/uganda_
climate_vulnerability_profile_jan2013.pdf
CLIMATE RISK COUNTRY PROFILE: UGANDA 16The projected increased heat will increase stress
on crops and is also likely to alter the length of FIGURE 12. Average daily max temperature
the growing seasons. Decreased water availability for Uganda65
is likely to reduce yields and the reduction in soil 7
moisture may alter suitable areas for agriculture 6
or the production of specific crops. Increased heat
5
and water scarcity conditions are likely to increase
degreesC
4
evapotranspiration, expected to contribute to crop
failure and overall yield reductions.64 Figure 12 3
shows the average daily max-temperature across 2
the seasonal cycle. These higher temperatures have
1
Jan Feb Mar Apr May Jun Jul Aug Sep Oct Nov Dec
implications for impacts to soil moisture and crop
growth and will increase throughout the year.
Adaptation Options
Both the sensitivity of the agricultural sector to the climate and the high reliance of this sector on rain-fed
agriculture and irrigation have important implications for Uganda. Improvements should be made concerning
water capture and storage as well as investments in more efficient irrigation structures throughout the country,
particularly in more arid agricultural areas. The introduction and adoption of drought-prone and flood-prone crop
varieties may increase short to medium-term resilience.66 The adoption of sustainable rangeland and pasture
management including no-burn agricultural practices for both small and large producers can improve ecosystems
and sustainable forest management. Additionally, semi-stabled cattle systems will help to contribute to resilience
of the country’s upland agricultural areas.67
Diversification of income away from reliance on farming operations can also be an effective strategy for making
farmers more resilient to climate change risks and more food secure for the future. Financing options for farmers
should also be more accessible, including the development of insurance schemes for farmers to protect against
climate change. The promotion of climate resilient cropping systems and improved integrated fisheries resource
management can strengthen the resilience of key livelihood sectors.68 Improvements should be made to the
weather monitoring network and associated weather information systems, including the publication and distribution
of agriculture-specific weather forecasts on a frequent basis (e.g. short-term and seasonal forecasts, monitoring
of heavy rainfall, etc.).69
64
Ministry of Agriculture, Animal Industry and Fisheries (2015). Uganda Climate Smart Agriculture Country Program 2015–2025.
URL: https://canafrica.com/wp-content/uploads/2015/08/3-UGANDA-CLIMATE-SMART-AGRICULTURE-PROGRAMME.Final_.pdf
65
WBG Climate Change Knowledge Portal (CCKP, 2021). Uganda Agriculture. Dashboard URL: https://climatedata.worldbank.org/
CRMePortal/web/agriculture/crops-and-land-management?country=UGA&period=2080-2099
66
Ministry of Water and Environment (2015). Uganda National Climate Change Policy. URL: https://www.mwe.go.ug/sites/default/
files/library/National%20Climate%20Change%20Policy%20April%202015%20final.pdf
67
Ministry of Agriculture, Animal Industry and Fisheries (2015). Uganda Climate Smart Agriculture Country Program 2015–2025.
URL: https://canafrica.com/wp-content/uploads/2015/08/3-UGANDA-CLIMATE-SMART-AGRICULTURE-PROGRAMME.Final_.pdf
68
Ministry of Agriculture, Animal Industry and Fisheries (2018). National Adaptation Plan for the Agricultural Sector. URL: https://
www.agriculture.go.ug/wp-content/uploads/2019/09/National-Adaptation-Plan-for-the-Agriculture-Sector.pdf
69
Ministry of Water and Environment (2014). Uganda Second National Communication to the United Nations Framework Convention
on Climate Change. URL: https://unfccc.int/resource/docs/natc/uganc2.pdf
CLIMATE RISK COUNTRY PROFILE: UGANDA 17You can also read