Hydrogeological Studies Integrating the Climate, Freshwater Cycle, and Catchment Geography for the Benefit of Urban Resilience and Sustainability ...
←
→
Page content transcription
If your browser does not render page correctly, please read the page content below
water
Article
Hydrogeological Studies Integrating the Climate,
Freshwater Cycle, and Catchment Geography for the
Benefit of Urban Resilience and Sustainability
Susie Mielby *        and Hans Jørgen Henriksen
 Geological Survey of Denmark and Greenland (GEUS), 8000 Aarhus C, Denmark; hjh@geus.dk
 * Correspondence: smi@geus.dk; Tel.: +45-2055-5310

 Received: 10 September 2020; Accepted: 19 November 2020; Published: 26 November 2020

 Abstract: Today, there is an increasing need to understand how to link the management of the surface
 and subsurface to avoid disasters in many urban areas and/or reduce the likelihood of future risks.
 There is a need for thorough investigation of subsurface processes. This investigation should entail an
 analysis of water security, flood risks, and drought hazards in urban areas that may affect long-term
 sustainability and the ability to recover from disturbance, e.g., a capacity for resilience. In this context,
 as part of this analysis, potential biophysical and hydro-meteorological hazards need to be studied
 and subdivided according to geological, hydrogeological, man-made, and climatic origin, and by
 their characteristic temporal scales and site specific characteristics. The introduction of adaptive
 design and resilience in urban and suburban planning and management requires a shift towards more
 organic, adaptive, and flexible design and management strategies. This leads to the use of a complex
 cross-disciplinary methodology. We consider data collation, modelling, and monitoring designed
 to fit typical urban situations and complexity. Furthermore, implementation of strategic planning,
 decision-making to manage the consequences of future infrastructure and constructions are considered.
 The case studies presented are experiences from different hydrogeological studies performed in
 Odense, Denmark. Rising population and densification is affecting Odense, and there is risk of
 raised seawater level, groundwater, and surface-water flooding. The anthropogenic modification
 of subsurface structures and increased climate changes enhance the risk of hazards and the risk of
 coinciding impacts.

 Keywords: urban; resilience; sustainability; hazards; subsurface; water cycle; land-use; infrastructure;
 planning; catchment; hydrogeology

1. Introduction
     Under ‘natural’ conditions, the hydrological water cycle is in a state of balance. In numerous
ways, however, basins are being artificially modified by land use changes and urban development.
These modifications affect natural processes and can result in increased flood or drought risk, due
to reduced storage and faster runoff, as well as numerous other impacts reducing the value of the
ecosystem services that healthy aquifers and river basins can provide [1] (p. 31).
     Cities and their residents can be particularly vulnerable to the negative impacts of man-made
river basin processes and future changes resulting from climate change.

1.1. Urban Needs
    Cities need to improve their understanding of how river basin management and nature-based
measures can be hydrogeologically, ecologically, and socially constructed to create benefits in urban areas.
There may also be competition in use of subsurface areas and water resources. These challenges are of

Water 2020, 12, 3324; doi:10.3390/w12123324                                       www.mdpi.com/journal/water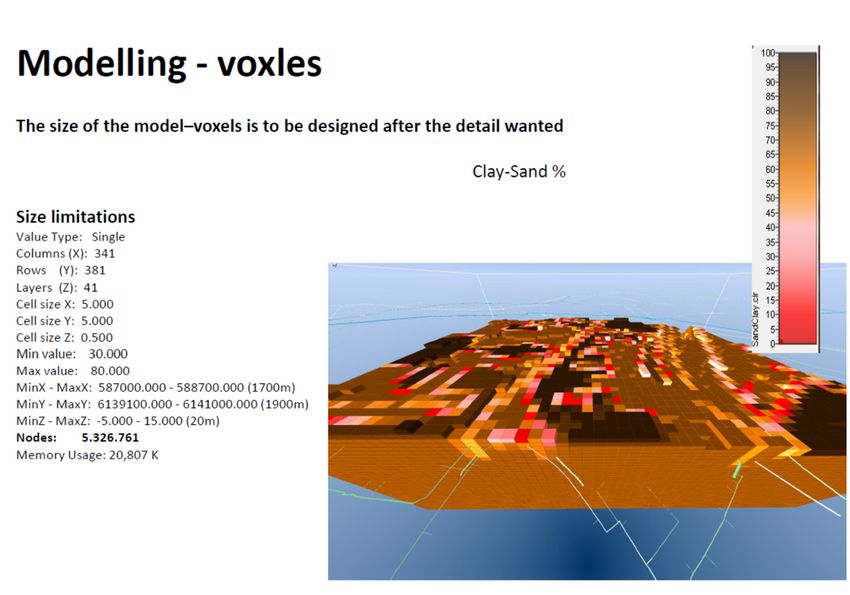
Water 2020, 12, 3324                                                                                   2 of 24

increasing importance in light of the abovementioned issues of global population growth, increased
urbanization, and potential climate change impacts [1] (p. 31), and planning and management must
focus on the consequences in order better to protect current and future interests [2].

1.2. State of Focus on Implementation
      The International Water Associations (IWA) initiative on river-basin connected cities has primarily
been focused on surface activities and runoff. However, IWA notes that catchments are predominantly
defined by surface topography and that groundwater systems are defined by geological basin geometry
and climate. Consequently, the involvement of the groundwater, with its 3D complexity, is seen as
a possibility for improving the planning of water resilience and sustainability [1] (p. 39). As the
subsurface is an important constituent of the physical environment of cities, better urban subsurface
knowledge and communication of this knowledge to decision-makers have been the focus for the
COST Action TU1206 Sub-Urban [3,4]. This COST Action TU1206 Sub-Urban, comprised a study
of 26 cities (with participating geoscientists in 31 countries), to identify common knowledge and
communication gaps between subsurface experts, urban planners, and decision-makers [5]. They
stated that “the only possible way to bridge this gap is to provide the right type of subsurface
information in the right format and at the right time and to ensure that decision makers and urban
planners are able to understand and use this information to make decisions”. The need is to better
understand where in the planning hierarchy and processes different types of information are needed [6].
Other recent projects (NORDRESS [7,8]) have focused on societal security in relation to personal,
community, infrastructural, and institutional resilience—with resilience being defined as “an integrated,
learning-based approach to management of human-ecological interactions, with explicit implications
for planning interventions and resulting design forms” [9]. This means that urban designs and
interventions must be adaptive and resilient to a change that cannot be predicted with certainty or
controlled completely. Resilience therefore, is a broader concept than simply managing infrastructure
failure and damage levels (for example due to flooding) guided by a single discipline or expertise.
Instead, meaningful community engagement in the planning and adaptive design process is necessary.
Key issues include the ability to learn and to make collective decisions, and the ability for different actors
to influence risk management. No single country, region or city has achieved complete competency on
all four points [8].
      For interacting systems like urban landscapes and groundwater the long-term sustainability,
and health of landscape and their underlying groundwater has three major dimensions—environmental,
economic, and social. Social-ecological research argues that these dimensions should not be addressed
by ‘silo’ approaches. Instead, emphasis must be on system level characteristics such as resilience or
adaptive capacity of human–technology–environment systems [10], where management and adaptation
are adaptive, resilient, and reflective, honoring the catchment and subsurface that sustain the city [11].

1.3. Strategy for the Work Achieving Resilience and Sustainability
     The implementation of Sustainable Development Goals (SDGs) implicitly calls for a system of
models and plans, which target research toward something more durable (long lasting and longsighted),
more diverse (with different properties and scales), and more robust (with the ability to deliver replicable
solutions and assessments). SGD 6, among others, deals with access to clean water, prevention of
pollution, integrated water resource management, and protection and reestablishment of ecosystems.
SDG 11 deals with inclusive and sustainable cities, protection of culture and nature, reducing impacts of
disasters, and increased access to green areas. SDG 13 deals with resilience against climate related risks
and hazards, sharing of knowledge. SDG 17 deals with partnering for shared knowledge, development,
technology, and monitoring.
     We argue for the importance of providing and enhancing specific knowledge about all conceived
needs and potential hazards of the water cycle from an early stage in order to avoid later surprises.
It has been the tradition for many years to elaborate new models in order to solve emerging problems,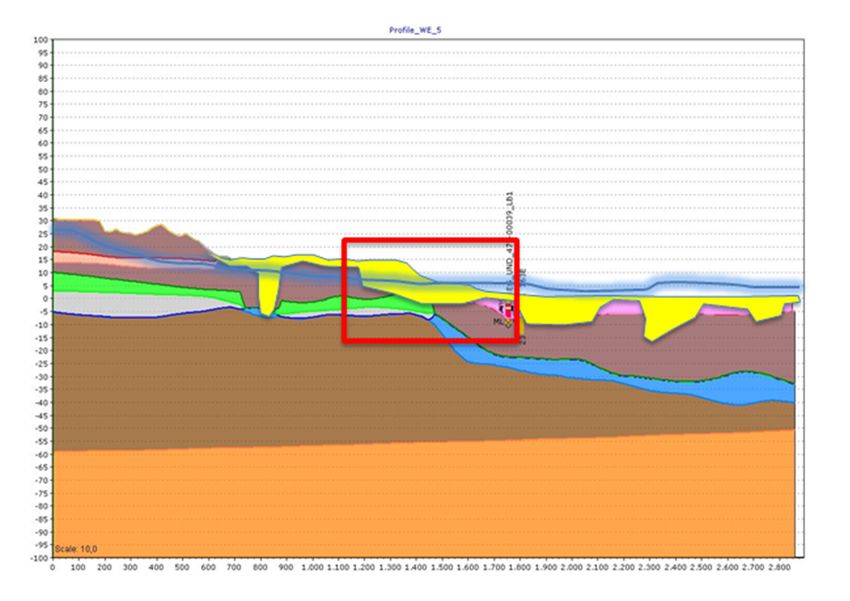
which implies that the bases for planning and management rely on different data and thus are often
not comparable. Therefore, a more systematic mapping and modelling of the landscape and urban
subsurface must be based on the characteristics in the geographical area; the climate and predicted
changes
 Water 2020,in
             12,that
                 3324 area, the degree of subsurface stability (abstraction and infiltration), land 3use,              of 24
drainage, etc. But, the mapping and modelling must also consider the broader aspects of resilience
connected to human-technology-environment systems [10–14].
 which implies that the bases for planning and management rely on different data and thus are often
 notAim
1.4.   comparable.
           of the PaperTherefore, a more systematic mapping and modelling of the landscape and urban
 subsurface must be based on the characteristics in the geographical area; the climate and predicted
       In this paper, we first focus on a study of geological and hydrological processes and man-made
 changes in that area, the degree of subsurface stability (abstraction and infiltration), land use, drainage,
impacts including the relevant parts of integrated planning (such as construction, economy, green
 etc. But, the mapping and modelling must also consider the broader aspects of resilience connected to
areas, occupation, infrastructure, water environment, etc.) [2]. Then, we consider the use of technical
 human-technology-environment systems [10–14].
solutions for enhanced and cohesive decision and planning support. We mainly build our
understanding        on years of studies and experience. This is gained from existing hydrogeological
 1.4. Aim of the Paper
models and monitoring projects in the Danish municipality of Odense, along with the selected
        In this paper,
‘sustainability’         we first
                     indicator    focus
                                (e.g.,     on a study
                                       depth            of geological
                                                 to shallow             and hydrological
                                                               groundwater                   processes
                                                                               table), elaboration    ofand   man-made
                                                                                                         a monitoring
 impacts    including   the relevant   parts  of  integrated  planning   (such as construction,
strategy, and the consequences tolerated for individual indicators inspired by the Monitor–Data–  economy,   green  areas,
 occupation,     infrastructure,  water    environment,   etc.) [2]. Then,  we consider
Indicator–Assess–Knowledge chain (MDIAK) (see Figure 1, modified after The European       the use of technical  solutions
 for enhanced and
Environmental          cohesive
                     Agency      decision
                              (EEA),         and
                                         [15]).    planning support.
                                                 Furthermore,          We mainly
                                                                 we build    on thebuild   our understanding
                                                                                     understanding               on years
                                                                                                        of the person–
 of studies   and  experience.   This  is  gained   from existing  hydrogeological   models
community–infrastructure–institutional societal resilience framework developed in NORDRESS     and  monitoring    projects
                                                                                                                     [7,8]
 in  the  Danish    municipality   of  Odense,      along with   the selected
in order to minimize risks from hazards and integrate scientific knowledge.    ‘sustainability’  indicator   (e.g., depth
 to shallow
       Odensegroundwater
                 City is used astable),
                                  example.elaboration
                                                OdenseofCity
                                                           a monitoring    strategy,
                                                               has a risk of impactsandfromtheman-made
                                                                                               consequences     tolerated
                                                                                                           activity and,
 for  individual    indicators  inspired    by  the  Monitor–Data–Indicator–Assess–Knowledge
due to its position near the bottom of Odense River catchment and the coast, it is at risk of           chain   (MDIAK)
 (see Figure 1,flooding,
groundwater         modifiedsurface-water
                               after The European        Environmental
                                                  flooding,                 Agency (EEA),
                                                             and raised sea-level.             [15]). Furthermore,
                                                                                      This implies,    associated with  we
 build   on  the  understanding     of  the  person–community–infrastructure–institutional
climate change modifications, that there is an increased possibility of areas with various coinciding societal resilience
 framework developed in NORDRESS [7,8] in order to minimize risks from hazards and integrate
hazards.
 scientific knowledge.

     Figure
      Figure1.1.The
                 TheMonitoring–Data–Indicator–Assess–Knowledge
                     Monitoring–Data–Indicator–Assess–Knowledge(MDIAK)(MDIAK)reporting
                                                                               reportingchain
                                                                                         chainleading
                                                                                               leadingtoto
     knowledge,
      knowledge,understanding,
                   understanding,and
                                  andaction
                                      action(on
                                             (onthe
                                                 theright-hand
                                                     right-handside
                                                                sidethe
                                                                     thesame
                                                                         samechain
                                                                              chaincan
                                                                                    canbe
                                                                                        beused
                                                                                           usedtotodesign
                                                                                                    design
     assessments,
      assessments,communicate
                    communicateresults
                                resultsand
                                        andsupport
                                            supportthe
                                                     themonitoring).
                                                         monitoring).

      Odense City is used as example. Odense City has a risk of impacts from man-made activity and,
 due to its position near the bottom of Odense River catchment and the coast, it is at risk of groundwater
 flooding, surface-water flooding, and raised sea-level. This implies, associated with climate change
 modifications, that there is an increased possibility of areas with various coinciding hazards.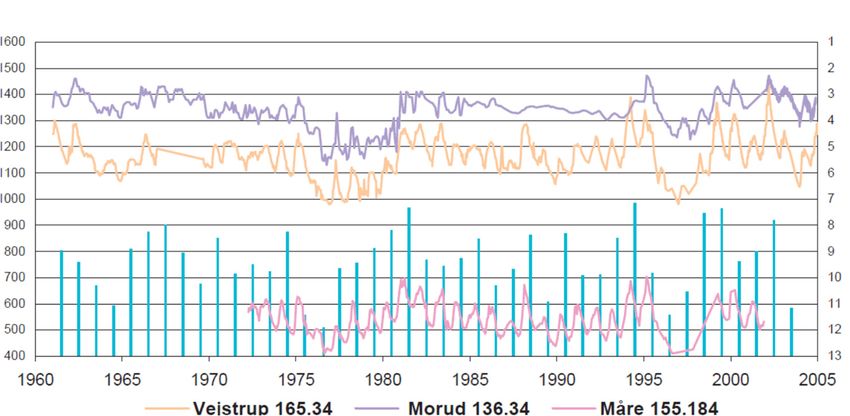
Water 2020, 12, 3324                                                                                         4 of 24

2. Analysis of Natural and Man-Made Processes in Regard to Urban Studies
     To be able to perform knowledge-based decisions in urban planning, all important natural and
anthropogenic processes must be taken into account. These processes have to be characterized and
analyzed if their impacts are costly or represent a threat to health, cultural heritage, or ecosystems.
     Key elements that have to be considered include climate, the water cycle, and natural and
man-induced hazards. Table 1 compares the size and extension of natural and man-made hazards in
the urban landscape. In addition, common relationships between the climate and man-made impacts
have to be studied. The use of data, modelling, and monitoring have to be considered for improved
planning and management.

      Table 1. Estimated spatial extension of urban processes related to climatic, geological, and man-made
      hazards (capital bold letters indicate the main spatial regime). Modified after The PanGeoProject [16].

                                                   Local Unit      City        City                 Hydrological
     Hazard Driver            Processes                                                 Metropole
                                                 (Construction)   Quarter   Landscape                  Basin
                        Climate Change
                        Cloudbursts
 Meteorologically
                        Droughts                                                x           x            X
 Induced event
                        Sea level Rise
                        /Storm Surges
                        Earthquakes
 Geologically Induced   Tectonic Movements
 Deep Ground            Salt Tectonics                                          x          X             x
 Movement               Volcanic
                        Inflation/Deflation
                        Land Slide
                        Soil Creep
 Geologically Induced   Ground Dissolution
                                                                    X           x
 Ground Instability     Collapsible Ground
                        Running
                        Sand/Liquefaction
 Geologically Induced   Shrink-Swell Clays
                                                       X            X
 Ground Movement        Compressible Ground
                        Shallow Compaction
                        Peat Oxidation
                        Groundwater
                        Abstraction
 Man-made               Mining
                                                       X            X           x
 Ground Instability     Underground
                        Construction
                        Artificial Ground
                        Oil and Gas Production
                        Surface Excavation

2.1. Natural Hydrological Processes Impacting Urban Freshwater Cycle
     The hydrological cycle is based on an equilibrium state between precipitation, evaporation, surface
runoff, infiltration, and groundwater flow. Any modification in the hydrological catchment results
in changes towards a new state of equilibrium. Precipitation, wind, and temperature are important
meteorological drivers of the hydrological cycle that have to be considered. In Denmark, increasing
precipitation has been observed within the last century and further climate changes are predicted in
years to come that will increase water levels, facilitate cloudbursts with floods, and produce dryer
summers with droughts. Moreover, a rise in sea level is expected.
     Increased precipitation intensity can nearly instantaneous induce streamflow alterations but
no corresponding impact on groundwater is detected. Whereas, long-lasting meteorological events,
such as droughts or wet seasons, can be associated by similar changes in groundwater levels identified
by the regional monitoring and need to be taken into account in urban planning.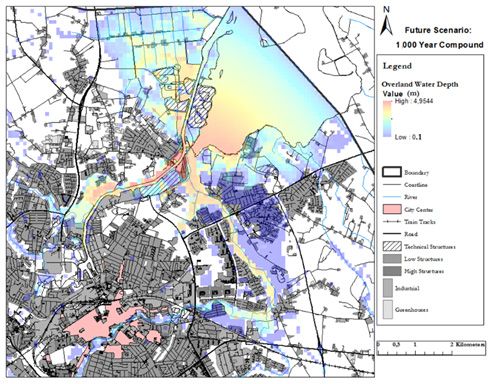
Water 2020, 12, 3324                                                                                       5 of 24

2.2. Geological Processes in Urban Areas
      The landscape form and ground permeability of near-surface layers largely control runoff and
infiltration. A terrain characterized by steep slopes combined with high clay content in the upper
soil layers usually results in a large amount of surface runoff. On the contrary, infiltration into the
ground increases, if the land-slope is gentle and near-surface layers have a higher permeability. Thus,
geological mapping provides important knowledge for the characterization of an area (See Tables 1
and 2).

      Table 2. Natural hydrological processes in the freshwater cycle affecting urban planning (capital bold
      letters indicate impact magnitude).

                                         Groundwater
             Hydrological Processes                          River Basin      Groundwater System
                                         Re-/Discharge
                    Meteorology
                                                                  X                      x
                 (net precipitation)
                   Surface runoff               X                 X
               Soil and Unsaturated
                                                X                                        X
                 zone percolation
                       Stream flow                                X                      x
                Groundwater flow                x                 X                      X

     Urban geology drastically influences city development, as well as its freshwater cycle [4] (pp. 39–41).
Within the urban subsurface, the occurrence of even smaller thicknesses of organic deposits or
sensitive clays can cause geotechnical problems for the foundations of buildings and cultural heritage.
Such problems increase with changes in the groundwater level, as can be seen in e.g., Denmark and
The Netherlands. Another example, relating to some of the Mediterranean countries, is tectonic and
volcanic activity released forces resulting in uplift, changing flow directions in streams and aquifers.

2.3. Anthropogenic Deposits Resulting from Urban Evolution
      Urban anthropogenic deposits are a consequence of urban growth, land-use changes,
and technological development. These deposits consist of buildings, bricks, pipes, tunnels and
fills and they reflect anthropogenic history. These deposits need to be judiciously studied as they
impact traditional hydrogeological modelling. To understand and interpret urban geology, it is
necessary to include a mapping procedure for the anthropogenic elements, and the developments over
time [17] have to be taken into consideration. For example, the vast majority of Danish cities have
developed in the past 200 years (see Table 3). Consequently, the city center will have a sequence of
subsurface layering affected by all historical activities, while only recent ones will occur in the youngest
parts of the city.
      Man-made activities are able to affect groundwater levels, superficial groundwater runoff,
and surface runoff. In Table 4, examples of man-made urban impacts affecting the hydrological
cycle within the last 200 years are summarized and classified. In addition to the originally targeted
purpose of constructions, unwanted and often unforeseen impacts can also occur (e.g., blocking and
intersection of aquifer flow [18,19]). Lowering of the groundwater tables can result, simultaneously
with declining groundwater quality due to infiltration from contaminated sources—for example,
in Odense [20,21] and Copenhagen [20–23] pollution from surface water and saltwater intrusion, have
occurred, and pyrite-oxidation with increased sulphate concentrations in groundwater related to
the unsustainable drawdown of groundwater levels near wellfields [22,23]. Furthermore, lowering
of the water table in several cities has resulted in a compaction of the subsurface, inducing a land
subsidence as a result (e.g., in Shanghai [24]). Stopping or reducing groundwater abstraction can result
in groundwater level and quality changes, as has been seen in Odense [20,25].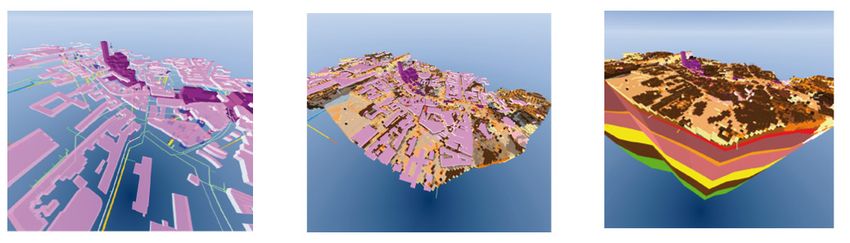
Water 2020, 12, 3324                                                                                           6 of 24

       Table 3. Activities in Danish urban areas; historical evolution within the last 200 years (Compilation of
       the evolution of urban areas based on Cartographic maps from Odense).

         Man-Made Action                                                               Main Activity Years
         Densification of the cities.                                                          –Now
         Anthropogenic deposition (especially during the first 100 years), along
                                                                                            1840–1940
         with urbanization.
         Increasing pollution related to the industrialization process.                     1840–1980
         Moving of rural population into the cities                                         1840–Now
         Piping of natural streams and draining wetlands.                                   1870–1980
         Increasing fortified areas and infrastructural constructions.                      1900–Now
         Increasing groundwater abstraction of groundwater for households and
                                                                                            1940–1970
         industry, until groundwater pollution from industries and human
                                                                                            1970–Now
         activities reduced groundwater abstraction.
         Subsurface construction with the technological development.                        1940–Now
         Introduction of Danish Planning Act, intended to subdivide cities into
                                                                                            1970–Now
         separate areas for trade, industry, and dwellings.
         Initiating extensive cleaning of industrial sites and landfills.                   1982–Now

       Table 4. Examples of man-made urban impacts affecting the hydrological cycle within the last 200
       years (Table based on authors experience from Odense and other places).

    Man-Made Activity                                         Urban Impacts
    Increased pavement extension, especially within the       Modifying infiltration and evaporation, as well as
    past 200 years.                                           increasing surface runoff.
    Establishing large construction works (buildings,         Inducing modification of surface runoff and of
    pipelines, tunnels, roads, etc.)                          groundwater flow levels.
    Groundwater abstraction                                   Affecting both groundwater flow and level.
    Draining of wetlands                                      Increasing surface runoff.
    Land surface draining                                     Lowering of groundwater level.
    Laying water pipes and sinks in trenches filled with      Local change of upper groundwater flow direction
    sand and gravel.                                          and velocity (convergence with ‘channels’ and sinks).
    Sustainable Drainage Systems (SuDS) established to
                                                              Local increase of ground water level.
    reduce excess rainwater.

    The land surface near shallow groundwater stratum can also be affected by regulation of ditches
and watercourses, which affect surface runoff. Abstraction in the upper end of the catchment can affect
runoff in the summer seasons, which will be of special importance for the ecosystems.

2.4. Climatic Impacts on the Hydrogeological Catchment Related to Anthropogenic Activity
      When considering the effect of man-made activities in a catchment, it is also necessary to include
the impact of expected climate change. Climate changes can result in a change of sea level due to
melting polar ice, and modifications of the precipitation and evapotranspiration regimes in terms of
quantity and distribution. Identification of potential impacts on existing buildings, cultural heritage
areas and ecosystems is the main focus of climatic-change studies It is important to provide a common
understanding of the likelihood of impacts from other man-made processes. Mitigation and adaptation
will typically require a coherent sequence of assessments in order to clarify:

•      Where in the catchment climate change will have an (unacceptable) effect on surface runoff and
       groundwater levels?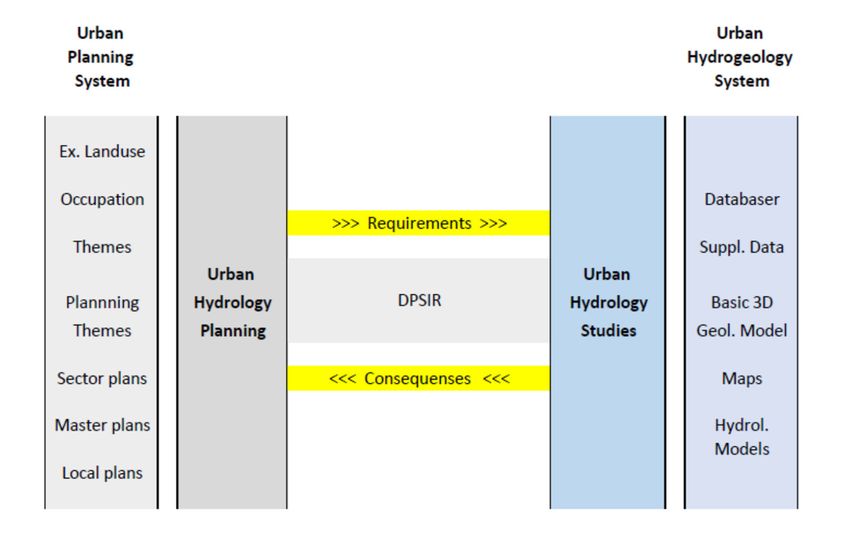
Water 2020, 12, 3324                                                                                7 of 24

•     Where is it technically possible to reduce and delay these unacceptable impacts?
•     Where in the catchment should potential adaptation and mitigation solutions have an acceptable
      influence on groundwater levels and surface runoff?

     In Denmark, implementation of SuDS (Sustainable Drainage Systems) is commonly used to
separate rainwater from grey water. The challenge of using SuDS in these areas is to infiltrate
excess water into the subsurface. If infiltration is possible, it must be checked that raising
groundwater levels in the infiltration area and surrounding land are acceptable. An example is
Vinkælderrenden/Skibhuskvarteret in Odense; after a detailed mapping and hydrological modelling,
it was realized that the groundwater level elevated unacceptably in the neighboring areas. Therefore,
an alternative solution had to be found.

2.5. Influences of Human Settlements
     For millennia, our ancestors have accessed water bodies for drinking water, fishing, and easy
transport. Many cities were, therefore, founded near rivers and near the coastline, and thus at
the bottom of hydrological catchments. Activities in the entire upstream catchment thus require
consideration, with its boundary often situated at considerable distance from the city and its peri-urban
areas—because man-made activities at the top end of the catchment can have downstream impacts.
The management of rural areas situated upstream of cities is usually done with a different perspective
with agriculture being the main focus. In general terms, the draining of agricultural land, watercourse
straightening, and crop cutting, together with increasing paved areas, all tend to increase surface runoff
and flood risk in downstream urban areas. Extreme flooding events are expected to increase with
predicted climate change with more warm and wet winters, and more intense cloudburst events in
the summer. A further complication arises, when catchment areas cross authority boundaries and the
management of these upstream areas is the responsibility of another authority. Thus, the management
structure and relative position of a city and its boundaries are of importance for determining resilience
and sustainability.

2.6. Essential Added Knowledge for City Management and Planning
     Traditionally, urban planning and management have been based on thematic maps containing
information about constructions, infrastructure, occupation, and land-use. Since urban areas also have
a buried infrastructure (cultural and archaeological sites, subsurface constructions etc.), such topics as
aquatic ecosystems, aquifer vulnerability, thermal and mineral resources, ground stability, and waste
disposal all require hydrogeological consideration for hazard identification and risk management.
For hydrogeological planning and management purposes, there is a need for a regularly repeated
process (for each planning period) that also includes relevant urban issues, rather than site-specific
projects covering only one specific problem. There is a need for stepwise knowledge building—starting
with: existing maps and data sets, new data capture and data collation, and basic hydrogeological
model building, assessments, and use of knowledge in planning (Figure 2). This requires building
relevant and conceptualized information—for example, temporal and geographical scale, history,
demography, infrastructure, land-use, and hydrogeology—to be represented in three dimensions and
visualized with integrated GIS at a higher level than previously.
     The process contributes to a large amount of data and flexible use of selected information is
needed in order to avoid starting over again whenever new situations arise. Thus, there is a need
to determine which information should be made digitally available, and how this can be performed
by which digital processes. The evaluation of existing, digitally-available hydrogeological data and
models from previous studies, and the evaluation of supplementary data, are important parts of the
analytical process and working methods for determining increased resilience and sustainability.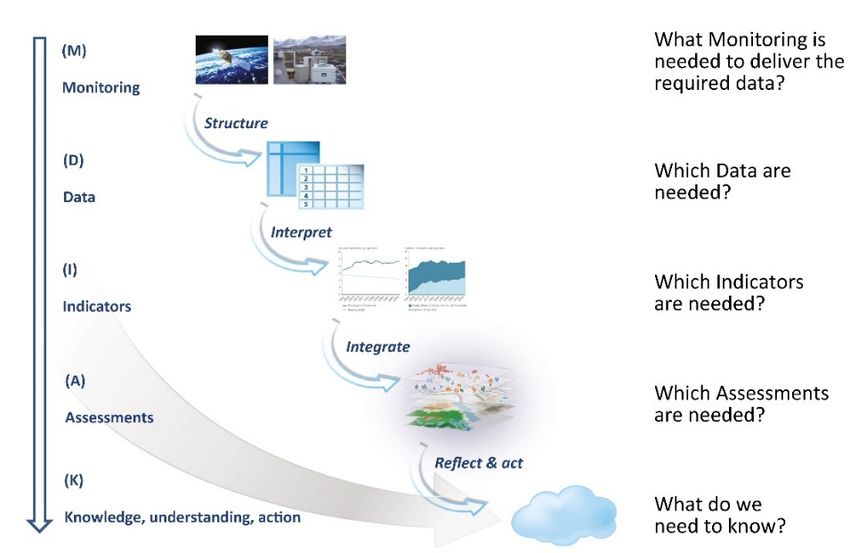
hydrogeological model building, assessments, and use of knowledge in planning (Figure 2). This
requires building relevant and conceptualized information—for example, temporal and geographical
scale, history, demography, infrastructure, land-use, and hydrogeology—to be represented in three
dimensions
 Water 2020, 12,and
                 3324visualized with integrated GIS at a higher level than previously.       8 of 24

      Figure 2. Urban hydrogeology system with step-wise knowledge building process: from screening
     Figure  2. data
      existing  Urban   hydrogeologyofsystem
                     to development           with step-wise
                                       decision-making  toolsknowledge
                                                             and plans. building process: from screening
     existing data to development of decision-making tools and plans.
      Urban management and planning, involving natural and anthropogenic processes requires a
 systemicprocess
     The   focus oncontributes  to adata:
                     the following    large amount of data and flexible use of selected information is
needed in order to avoid starting over again whenever new situations arise. Thus, there is a need to
 •    Basic hydrogeological information system (including climate, hydrogeology, surface-water
determine which information should be made digitally available, and how this can be performed by
      catchment and sea level, and potential changes to them);
which digital processes. The evaluation of existing, digitally-available hydrogeological data and
 •
modelsDrinking   water-supply
        from previous           and
                         studies, andwaste   water plans;
                                        the evaluation of supplementary data, are important parts of the
 •    Urban
analytical   infrastructure
           process            and environment
                    and working                  (including issues
                                   methods for determining         to support
                                                              increased        infrastructure
                                                                        resilience            development,
                                                                                    and sustainability.
      cultural, and  environmental    risk assessment);
     Urban management and planning, involving natural and anthropogenic processes requires a
 •    Planning
systemic         hierarchy
          focus on          and its data:
                    the following   management.

•     Basic
        Whathydrogeological
               is important is thatinformation      system and
                                       urban management       (including
                                                                   planningclimate,   hydrogeology,
                                                                             activities require a good surface-water
                                                                                                         understanding
      catchment
 of current          and sea level,and
               hydrogeological        andhydrological
                                            potential changes    to them);
                                                          conditions,    a good comprehension of their evolution
•overDrinking       water-supply
         a long time,               and waste
                         and a reliable           water on
                                            estimation   plans;
                                                            the consequences of potential changes expressed in
•termsUrban    infrastructure
          of modelling           and environment
                           scenarios.                 (including
                                        It involves natural         issues to support
                                                              and anthropogenic         infrastructure
                                                                                     processes   from twodevelopment,
                                                                                                            viewpoints,
      cultural, and
 contributing           environmental
                   to greater  resiliencerisk
                                            andassessment);
                                                 sustainability:
•     Planning hierarchy and its management.
 •      A geoscientific urban perspective that includes new model building, monitoring, and assessment;
 • What        is important
        An adaptive     planningisand that   urban management
                                         governance    perspective thatandhandles
                                                                             planning    activities information
                                                                                   the necessary      require a and
                                                                                                                  good its
understanding
        correct use. of current   hydrogeological     and   hydrological    conditions,   a good   comprehension      of
their evolution over a long time, and a reliable estimation on the consequences of potential changes
 3. Hydrogeology
expressed     in terms inof Odense
                            modelling (Denmark)—Methods
                                          scenarios. It involvesof    Mapping
                                                                   natural      and Assessment
                                                                           and anthropogenic      processes from two
viewpoints, contributing to greater resilience and sustainability:
        Odense Municipality (Denmark) is a good basis for a practice example, since the water supply,
•the municipality,
      A geoscientific   and urban
                             the former    county authority
                                      perspective              (the Danish
                                                     that includes      new counties
                                                                               model were    closedmonitoring,
                                                                                        building,     in 2007 as a result
                                                                                                                    and
 of a assessment;
       local (municipalities) and regional (counties) governmental reform) have had a long tradition of
•dataAn collection
            adaptiveand    groundwater
                        planning             mapping.perspective
                                   and governance        Therefore, data   and experience
                                                                      that handles           are available
                                                                                     the necessary           for further
                                                                                                      information   and
 knowledge
      its correctbuilding.
                    use.

3.3.1. Subsurface Mapping
   Hydrogeology           and Assessments
                   in Odense  (Denmark)—Methods of Mapping and Assessment
       It is important
      Odense            to use(Denmark)
               Municipality     a robust hydrodynamic
                                           is a good basissubsurface  model
                                                            for a practice    (anthropogenic
                                                                           example,  since the and geological)
                                                                                               water  supply,
the municipality, and the former county authority (the Danish counties were closed in 2007 as aselected
 and  relatable  time  series that  can define  indicators to assess the groundwater    dynamics   of   result
ofaquifers.   One of the keysand
   a local (municipalities)    to replicable scientific work
                                   regional (counties)        in Odense
                                                        governmental      is using
                                                                       reform)     common
                                                                                 have        public
                                                                                      had a long    databases
                                                                                                 tradition  of
 with relevant, standardized, and correct datasets that are easy to access. This ensures that the same
 basis for decision-making and for information updating are used. The foundation for this work was the
 development of a ‘new’ city-scale 3D geological and hydrogeological model that provides a coherent
 and updated basis for the urban water cycle analysis and for management of the urban subsurface.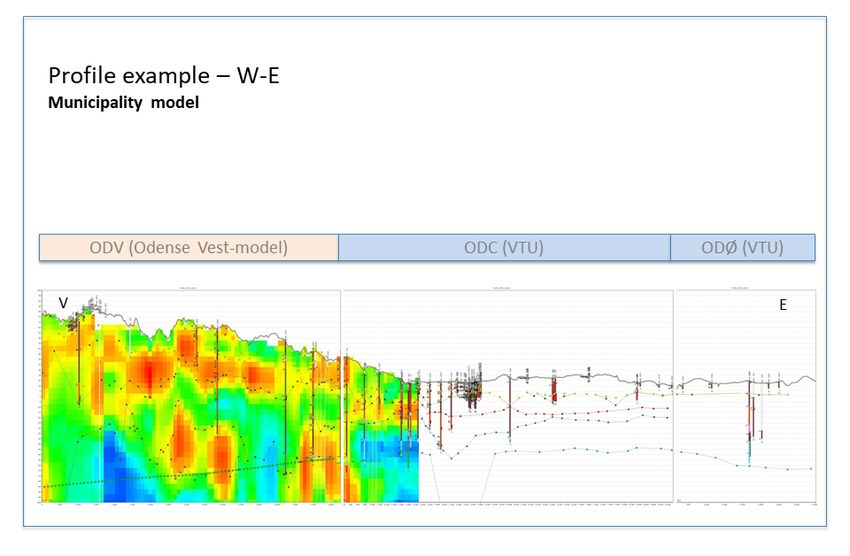
and relatable time series that can define indicators to assess the groundwater dynamics of selected
aquifers. One of the keys to replicable scientific work in Odense is using common public databases
with relevant, standardized, and correct datasets that are easy to access. This ensures that the same
basis for decision-making and for information updating are used. The foundation for this work was
the development of a ‘new’ city-scale 3D geological and hydrogeological model that provides a
Water 2020, 12, 3324 9 of 24
coherent and updated basis for the urban water cycle analysis and for management of the urban
subsurface.
Depending on
Depending on the
the specific
specific situation,
situation, one
one must
must select
select hydraulic
hydraulic assessment
assessment models
models that
that are
are built
built
on these
on these datasets
datasets (see
(see Figure 1). The
Figure 1). The connection
connection with the work
with the work performed
performed inin knowledge-building
knowledge-building
(from data collation to hydrodynamic model) is important for the following hydrological
(from data collation to hydrodynamic model) is important for the following hydrological assessments assessments
and monitoring.
and monitoring. Dealing
Dealing with
with hydrogeological
hydrogeological modelling
modelling we
we differentiate
differentiate between
between existing
existing project
project
situations and
situations and aa new
new municipality
municipality model
model with
with aa year-by-year
year-by-year updating.
updating. Figure
Figure 33 illustrates
illustrates the
the four
four
steps consisting of Subsurface data, Hydrodynamic subsurface modelling, Hydrological
steps consisting of Subsurface data, Hydrodynamic subsurface modelling, Hydrological assessment assessment
and Monitoring.
and Monitoring.
Figure3.3.The
Figure Thefour
foursteps:
steps: Subsurface
Subsurface urban data, Subsurface modelling,
modelling, Assessment,
Assessment,and
andMonitoring.
Monitoring.
Requirements of a City Scale Concept Hydrodynamic Model Framework
Requirements of a City Scale Concept Hydrodynamic Model Framework
First, a city-scale concept is required to allow the combination of anthropogenic and hydrogeological
First, a city-scale concept is required to allow the combination of anthropogenic and
information. It is essential that the modelling, in selected areas, is based on detailed knowledge of
hydrogeological information. It is essential that the modelling, in selected areas, is based on detailed
natural and man-made processes and their potential impacts. When the modelling of subsurface
knowledge of natural and man-made processes and their potential impacts. When the modelling of
knowledge is extended to the entire municipality systematic mapping rather than a project-based
subsurface knowledge is extended to the entire municipality systematic mapping rather than a
approach is mandatory. This is a cross-disciplinary process with several challenges:
project-based approach is mandatory. This is a cross-disciplinary process with several challenges:
•• The
The established
established hydrogeological
hydrogeological model
model is is based
based on
on heterogeneous
heterogeneous information
information from
from the
the existing
existing
boreholes, geophysics, maps, and models of varying quality
boreholes, geophysics, maps, and models of varying quality and age; and age;
•• The
The anthropogenic
anthropogenic man-made
man-made deposits
deposits beneath
beneath the
the cities
cities differs
differs in
in age,
age, scale
scale and
and origin
origin from
from
geological
geological deposits. Collation of data and modelling on anthropogenic deposits are relatedthe
deposits. Collation of data and modelling on anthropogenic deposits are related to to
urban history
the urban and and
history deviates veryvery
deviates much fromfrom
much hydrogeological processes;
hydrogeological processes;
•• A
A workflow
workflow for for interlinking
interlinking and
and merging
mergingdifferent
differentkinds
kindsofofmodels
modelshashastotobe
bedesigned;
designed;
•• A definition
A definitionof ofdue
duecare
careininregard
regardofofthe
themaintenance
maintenance ofof the
the modelling
modelling is necessary,
is necessary, andand
hashas to
to be
be defined
defined fromfrom
the the outset;
outset;
•• A design
A design ofof information
information output
output has
has to
to be
be defined.
defined.
3.2. Development of ‘New’ City Scale Hydrogeological 3D-Model
In Odense, the national geological survey, the municipality, and the local water utility found in
2012 that most geological and hydrogeological mappings was in rural areas, but similar activity for
the urban areas was lacking. Thus, a goal was established to produce one model at a municipality or
city scale, which, through sustained maintenance and development, could be improved year-on-year
with the introduction of new geological and hydrogeological data and information on anthropogenic
changes. The focus was put on groundwater and surface water, the connection between deep and
shallow aquifers, the secure use of existing models all relevant data, large-scale overview mapping,
and detailed small-scale mapping, and based on the selected typical work situations (see Table 5 and
Figure 4). A hydrogeological 3D municipality model project was established through a pilot study
(‘Development of a 3D Geological/Hydrogeological model as basis for the urban water cycle’ [25–31]).
The pilot-project was completed in 2015 with a report [25–31], and the developed model was selected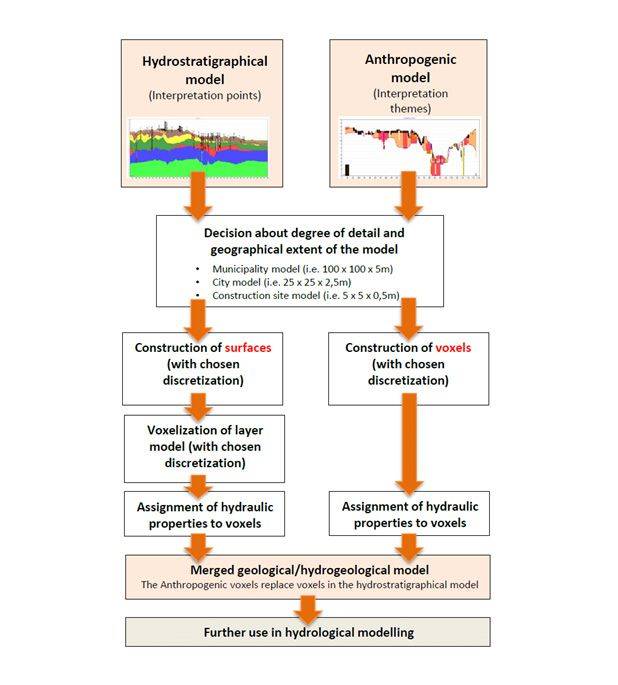
Water 2020, 12, 3324 10 of 24
as one of the examples of good practice of urban modelling by the European COST Action TU1206
Sub-Urban project ([6,32] (pp. 64–74)).
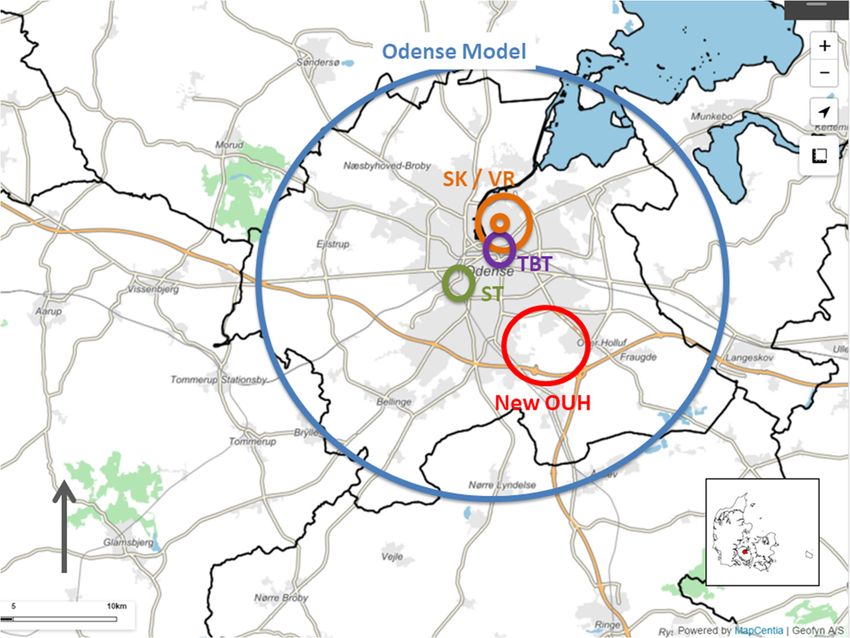
Table 5. Adaptive ‘real’ planning and governance projects chosen for design of the ‘new’ urban
hydrogeological model in Odense.
Management and Planning Situation Study Test Location
Early project evaluation for major construction
Potential areas for infiltration Odense new
planning, green/blue solutions, and prospects for
and runoff University Hospital
geothermal plants
Adaptive planning project for re-urbanization after Collection and use of old and
Thomas B.
the abandonment of a four-tracked road through the new geotechnical data and
Thriges Gade
heart of the city visualization
Well-field study of the effect of stopping urban Mapping of existing
groundwater abstraction and potential use of ditches low-lying areas with poor Sanderum Tørvehave
for surface run-off possibilities of surface runoff
Collection and use of new Vinkælderrenden—a
Residential area project to increase the water
detailed data and modelling part of City quarter
infiltration into soil due to high surface runoff
(see [25]) Skibhuskvarteret.
Water 2020, 12, x FOR PEER REVIEW 11 of 25
Figure 4. Location
Figure 4. Location of
of projects
projects used
used for
for development
development ofof aa conceptual
conceptual design
design ofof The
The Odense
Odense Model.
Model.
(SK/VR) Skibhuskvarteret/Vinkælderrenden, (TBT) Thomas B. Thrigesgade, (ST) Sanderum
(SK/VR) Skibhuskvarteret/Vinkælderrenden, (TBT) Thomas B. Thrigesgade, (ST) Sanderum Tørvehave,
Tørvehave,
(New OUH)(New
New OUH)
OdenseNew OdenseHospital
University University
(forHospital (for descriptions
descriptions see Table 5). see Table 5).
The following four case-studies illustrate several important technical aspects for the Odense urban
subsurface and hydrogeological model:
The first case-study focuses on the design of a hydrodynamic model area for the entire municipality
level area and some separate detailed areas. Analysis has been performed on the current and potential
planning and management activities (see Table 5) that were compared with existing data and models.
The analyses searched for optimal solutions. This model should be able to operate on a municipal level
and in selected areas (constructions and up to city-quarter, see Table 2) with a detailed discretization.Water 2020, 12, 3324 11 of 24
Consequently, the Municipality model had to be built on existing digitized data and include the
Figure 4. Location of projects used for development of a conceptual design of The Odense Model.
following elements: deep and shallow aquifers,
(SK/VR) Skibhuskvarteret/Vinkælderrenden, deepThomas
(TBT) and shallow geology, man-made
B. Thrigesgade, deposits,
(ST) Sanderum
and constructions.
Tørvehave, (New Figure
OUH)5New
shows a view
Odense of the resultant
University Hospital conceptual model.
(for descriptions see Table 5).
Figure 5.
Figure 5. Conceptual
Conceptual frame
frame for
for the
the hydrodynamic municipality model
hydrodynamic municipality model [25,29]:
[25,29]: Yellow layer indicates
Yellow layer indicates
anthropogenic origin; blue line is estimated hydraulic groundwater level, and red box indicates aa
anthropogenic origin; blue line is estimated hydraulic groundwater level, and red box indicates
detailed modelling
detailed modelling area.
area. Scale
Scale in
in meters.
meters.
case-study focuses
The second case-study focuses on
on hydrogeological
hydrogeological modelling
modelling beneath
beneath cities.
cities. The existing data
from Odense city revealed areas withwith only
only limited
limited or old
old data
data (see
(see Figure
Figure 6).
6). The lack of sufficient
site-specific data [33] caused difficulty in making sound decision-making and assessing uncertainty,
and led to the need for gathering supplementary data. The operation of assembling data, especially of
geotechnical and cadastral types, proved to be time consuming, and data updating and modelling
required professional administrative governance.
Modelling of the urban anthropogenic layer represents the third case-study. This layer consists
of bricks, buildings, constructions, pipes, roads, excavations, urban fill, and many other materials
of different age. The modelling process includes cadastral data coming from the municipality, data
characterizing the sewer system and water supply network (from the local water utility, VCS Denmark),
as well as borehole logs and geophysical surveys (from GEUS and VCS Denmark).
The information is frequently updated as result of urban dynamics. A rule based data handling
procedure was chosen to process and update systematically the huge amount of data—GeoScene3D
Software (www.GeoScene3D.com) being selected for data processing. Finally, a detailed voxel model
for the anthropogenic layer of the Thomas B. Thrigesgade (Odense City) has been obtained, which is
illustrated in Figure 7.Water 2020, 12, x FOR PEER REVIEW 12 of 25
site-specific data [33] caused difficulty in making sound decision-making and assessing uncertainty,
and led to the need for gathering supplementary data. The operation of assembling data, especially
Water 2020, 12, 3324and cadastral types, proved to be time consuming, and data updating and modelling
of geotechnical 12 of 24
required professional administrative governance.
Figure 6.
Figure 6. Variations
Variations inin data
data density
density in
in the
the subsurface
subsurface information
information in in Municipality model on
Municipality model on west–east
west–east
profile [25,29]. The western side of the urban area is shown with a comprehensive
profile [25,29]. The western side of the urban area is shown with a comprehensive groundwater groundwater
mapping illustrated
mapping illustrated byby the
the ‘colored’
‘colored’ results
results of
of the
the geophysical
geophysical survey
survey (Odense
(Odense Vest
Vest model).
model). The
The city
city
center is located in the middle profile and has many shallow boreholes, and on the eastern
center is located in the middle profile and has many shallow boreholes, and on the eastern side limited side limited
groundwater
Water groundwater interests
2020, 12, x FORinterests are illustrated
are
PEER REVIEW illustrated byby restricted
restricteddata
dataavailability.
availability. 13 of 25
Modelling of the urban anthropogenic layer represents the third case-study. This layer consists
of bricks, buildings, constructions, pipes, roads, excavations, urban fill, and many other materials of
different age. The modelling process includes cadastral data coming from the municipality, data
characterizing the sewer system and water supply network (from the local water utility, VCS
Denmark), as well as borehole logs and geophysical surveys (from GEUS and VCS Denmark).
The information is frequently updated as result of urban dynamics. A rule based data handling
procedure was chosen to process and update systematically the huge amount of data—GeoScene3D
Software (www.GeoScene3D.com) being selected for data processing. Finally, a detailed voxel model
for the anthropogenic layer of the Thomas B. Thrigesgade (Odense City) has been obtained, which is
illustrated in Figure 7.
Figure 7. Visualization
Figure 7. Visualization of
of detailed
detailed voxel
voxel modelling
modelling ofof an
an urban
urban area [25,30] with
area [25,30] with buildings,
buildings, and
and
transecting boxes for roads and, pipes converted to clay-sand % and combined with different soil
transecting boxes for roads and, pipes converted to clay-sand % and combined with different soil types.
types.
Defining the procedure of working with different models and model scales stays as the fourth
Defining
case-study. the procedure
Urban modellingofoften
working with the
requires different
use ofmodels and model
information scales sources
from other stays asin
theorder
fourth
to
step. Urban modelling often requires the use of information from other sources in order
augment model information or regional trends. To combine geological models and anthropogenicto augment
model information or regional trends. To combine geological models and anthropogenic models a
common workflow is required. Figure 8 illustrates the anthropogenic data, the resulting
anthropogenic layer and the combined anthropogenic-geological model. Figure 9 shows a workflow
for merging a municipality model and a detailed anthropogenic model.Figure 7. Visualization of detailed voxel modelling of an urban area [25,30] with buildings, and
transecting boxes for roads and, pipes converted to clay-sand % and combined with different soil
types.
Defining the procedure of working with different models and model scales stays as the fourth
Water 2020, 12, 3324 13 of 24
step. Urban modelling often requires the use of information from other sources in order to augment
model information or regional trends. To combine geological models and anthropogenic models a
common
models workflow
a common is required.
workflow FigureFigure
is required. 8 illustrates thethe
8 illustrates anthropogenic
anthropogenicdata,
data, the resulting
the resulting
anthropogeniclayer
anthropogenic layerand
andthe
thecombined
combinedanthropogenic-geological
anthropogenic-geologicalmodel.
model. Figure
Figure99shows
showsaaworkflow
workflow
for merging a municipality model and a detailed anthropogenic
for merging a municipality model and a detailed anthropogenic model. model.
Figure8.8. Visualization
Figure Visualization of
ofThomas
ThomasBBThriges
ThrigesDistrict
District(in
(indark
darkpurple).
purple). On
On the
theleft
leftisisanthropogenic
anthropogenic
Water 2020, 12, x FOR PEER REVIEW 14 of 25
data;
data; in the middle the anthropogenic layer; on the right the combined geologicaland
in the middle the anthropogenic layer; on the right the combined geological andanthropogenic
anthropogenic
model
model[25,30].
[25,30].
Figure 9. Workflow for the combined geological and anthropogenic model [25] of the urban area.
Figure
3.3. ‘New’ 9. Workflow
Approach for the combined
for Monitoring geological
Groundwater and
Levels inanthropogenic
Odense model [25] of the urban area.
Monitoring
3.3. ‘New’ of shallow
Approach groundwater
for Monitoring levels offers
Groundwater Levels important
in Odense information in urban hydrogeological
studies, especially if they are part of long time-series. The monitoring data can offer a valuable
Monitoring
picture ofand
of the spatial shallow
temporalgroundwater levels offers
evolution of groundwater important
levels and urbaninformation
groundwater in urban
dynamics.
hydrogeological studies, especially if they are part of long time-series. The monitoring
The monitoring of complementary parameters, such as water temperature and quality, can offer data can offer
a valuable
valuable pictureknowledge.
additional of the spatial and temporal evolution of groundwater levels and urban
groundwater dynamics. The monitoring of complementary parameters, such as water temperature
and quality, can offer valuable additional knowledge.
In Denmark, observation of groundwater levels mainly takes place in three types of monitoring
wells. At the national level, monitoring is normally performed in boreholes outside urban areas and
is used to study natural processes (e.g., changes in winter net precipitation on groundwater level) inWater 2020, 12, 3324 14 of 24
In Denmark, observation of groundwater levels mainly takes place in three types of monitoring
wells. At the national level, monitoring is normally performed in boreholes outside urban areas and is
used to study natural processes (e.g., changes in winter net precipitation on groundwater level) in areas
that are not affected by abstraction and other man-made influences. The second level relates to licenses
for groundwater abstraction, and the monitoring wells are situated near wellfields. Finally, the third
level relates to the collation of additional data for hydrogeological surveys, for example for detailed
modelling of groundwater levels due to the infiltration of excess rainwater (as seen in Vinkælderrenden
in Odense) [34]. Groundwater monitoring for the preservation of ecosystems, and the cultural heritage
is not a standard procedure.
In Odense City, comprehensive monitoring networks, which were established in the mid-1960s for
wellfields, were later abandoned. Today, this information would have been useful for detailed urban
studies, but a valuable picture of the evolution of groundwater levels since the 1950s is given 15
Water 2020, 12, x FOR PEER REVIEW
byofthe
25
national monitoring system (See Figure 10).
Figure 10.
Figure 10. Illustration
Illustration of
of development
development of of groundwater
groundwater level
level in
in surroundings
surroundings ofof Odense.
Odense. The
The figure
figure
shows annual
shows annual precipitation
precipitation (mm
(mm onon left-hand
left-hand axis,
axis, blue
blue columns)
columns) compared with groundwater
compared with groundwater depth
depth
in the three national monitoring wells (in m below ground level on right-hand axis) (Vejstrup
in the three national monitoring wells (in m below ground level on right-hand axis) (Vejstrup 165.34, 165.34,
Morud 136.34
Morud 136.34 and
and Måre
Måre 155.84)
155.84) [35].
[35]. Data
Data from
from Geological
Geological Survey
Survey of of Denmark
Denmark and
and Greenland
Greenland andand
Danish Meteorological Institute, processed by the local water utility (VCS
Danish Meteorological Institute, processed by the local water utility (VCS Denmark).Denmark).
impacts of
Earlier urban monitoring focused on the impacts of groundwater
groundwater abstraction
abstraction on neighboring
neighboring
quality, but
wells and drinking water quality, but today
today there
there is
is aa tendency
tendency to to focus
focus on
on the impacts of changes in
abstraction patterns
groundwater abstraction patterns and
and their
their impacts
impacts of of subsurface
subsurface constructions
constructions and
andinfrastructure.
infrastructure.
monitoring in national monitoring wells has been improved in time.
The frequency of monitoring time. In early
performed by discrete
days, this monitoring was performed discrete observations
observations (just(just aa few
few times
times per year) but this was
improvedto
later improved tomonthly
monthlyreadings,
readings,andandtoday,
today, data-loggers
data-loggers measure
measure groundwater
groundwater levels
levels remotely
remotely up
upseveral
to to several
timestimes
a daya(for
day (for studying
studying the relation
the relation between between shallowwater-level
shallow aquifers aquifers water-level and
and wetlands).
wetlands).
3.4. Urban Groundwater Studies on the Interaction of Hydrological Events
3.4. Urban Groundwater
A master study ofStudies on the Interaction
the Nordic Centre of of Hydrological
Excellence Events
on Resilience and Societal Security
(NORDRESS)
A master[36] illustrated
study of thethat the forced
Nordic infiltration
Centre of rain-water
of Excellence from pavedand
on Resilience areas (as investigated
Societal Security
in Skibhuskvarteret),
(NORDRESS) leads to a marked
[36] illustrated that theincrease
forced ininfiltration
groundwater of levels close to
rain-water the infiltration
from paved areas basins.
(as
The local geology
investigated appears to exertleads
in Skibhuskvarteret), a majorto ainfluence on this phenomenon,
marked increase in groundwater since high
levels hydraulic
close to the
conductivity is needed
infiltration basins. The to ‘spread’
local theappears
geology infiltrated water.a Increases
to exert of groundwater
major influence level of up tosince
on this phenomenon, 1 m,
are
highmodelled
hydraulicinconductivity
the Odense area due totoincreased
is needed winter
‘spread’ the precipitation,
infiltrated and an increased
water. Increases sea-levellevel
of groundwater of a
similar
of up tomagnitude occurs near
1 m, are modelled the
in the Odense
Odense River
area dueand Fjord (due
to increased to global
winter warming and
precipitation, and sea level rise
an increased
and stormofsurges),
sea-level a similarwhich challenges
magnitude water
occurs nearmanagement activities
the Odense River andfor climate
Fjord (due change
to globaladaptation
warming and
risk reduction.
sea level rise and storm surges), which challenges water management activities for climate change
adaptation and risk reduction.
Another NORDRESS master study [37] evaluated previous assessments of Odense flooding risks
and established that without adaptation work, flood damage at Odense will increase from 3.9 million
of Danish kroners in 2010 to 9.3 million of Danish kroners by 2100. The study [37] revealed a
projection of 239 million of Danish kroners for the expected increase in damage costs resulting fromWater 2020, 12, 3324 15 of 24
Another NORDRESS master study [37] evaluated previous assessments of Odense flooding risks
and established that without adaptation work, flood damage at Odense will increase from 3.9 million of
Danish kroners in 2010 to 9.3 million of Danish kroners by 2100. The study [37] revealed a projection of
239 million of Danish kroners for the expected increase in damage costs resulting from climate change
by the year 2100 and highlighted the need for a cost–benefit analysis of potential adaptation options.
The need for adaptation is further challenged by the expected increase of maximum runoff of
the Odense River. Several reports [37,38] suggest a 40% increase in the daily maximum 100-year
return period runoff event in Odense River by year 2100. The NORDRESS study [37] highlighted that
the inundation resulting from concurrent events from storm surges and river flooding could result
in damage costs of some 833 million of Danish kroners for publically owned properties. This does
not include critical infrastructure damage costs nor the potential interruption of commerce due
Water 2020, 12, x FOR PEER REVIEW 16 of 25
to inaccessibility.
In Odense (Figure 11 [37]), the interacting impacts from different hazards are important for
In Odense (Figure 11 [37]), the interacting impacts from different hazards are important for
urban planning strategy. It is critical to manage disaster risk reduction, climate change adaptation,
urban planning strategy. It is critical to manage disaster risk reduction, climate change adaptation,
and water-supply security in an integrated and adaptive way.
and water-supply security in an integrated and adaptive way.
Figure 11. Scenario of potential climatic coincidence of increased runoff in Odense River and
Figure 11. Scenario of potential climatic coincidence of increased runoff in Odense River and increased
increased sea level in Odense Fjord. Resultant flooding (yellow to red) is observed along downstream
sea level in Odense Fjord. Resultant flooding (yellow to red) is observed along downstream part of
part of Odense River [37].
Odense River [37].
3.5. ‘New’ Concept of Adaptive Planning and Governance
Classical modes of planning were grounded in rationalistic, authoritarian planning model where
Classical
politically described goals were translated into plans implemented by the administration. Contrary, Contrary,
adaptive planning
to this adaptive planning and
and governance
governance is is grounded
grounded in in neo-institutionalism,
neo-institutionalism, social-science
social-science based
approaches which
approaches whichconsider
considergovernance,
governance, collective
collective action,
action, informal
informal rulesrules and
and the the redefinition
redefinition of
of spatial
spatial planning
planning towardgovernance.
toward “place” “place” governance.
Instead of Instead
focus onofscientific-rational
focus on scientific-rational
developmentdevelopment
plans, in the
plans,
new in the new
concept, concept,
focus focus is on communicative
is on communicative determination determination
of needs, theofjoint
needs, the joint development
development of plans in
of plans in participatory processes and the activation of citizens to participate in spatial planning [39].
Adaptive planning and governance therefore focus on polycentric governance e.g., cross-sectoral and
multi-level coordination with focus on learning capacity and adaptability of plans and actor
networks. The main advantage of the new concept compared to the old classical mode of planning is
that it enhances adaptability and capacity for self-organization and learning [40]. Learning here isYou can also read