Impacts of Extreme Weather Events on Hydromorphology of UK Rivers Aşırı Hava Olaylarının Birleşik Krallık Nehir Hidromorfolojisine Etkisi - Brunel ...
←
→
Page content transcription
If your browser does not render page correctly, please read the page content below
Research Article
  Impacts of Extreme Weather Events on Hydromorphology of UK Rivers
  Aşırı Hava Olaylarının Birleşik Krallık Nehir Hidromorfolojisine Etkisi
                           Seher Gulcin Yilmaz1,2*, Abdul Chaudhary2, Rakesh Kanda2
   1
    Ministry of Agriculture and Forestry, General Directorate of Water Management, 06510, Ankara, Turkey
                 sehergulcin.yilmaz@tarimorman.gov.tr (https://orcid.org/0000-0002-2443-8862)
     2
       Institute of Environment, Health and Societies, Brunel University London, Uxbridge, UB8 3PH, UK
                     abdul.chaudhary@brunel.ac.uk (https://orcid.org/0000-0001-9438-0857),
                       rakesh.kanda@brunel.ac.uk (https://orcid.org/0000-0002-5427-3982)
                             Received Date: 01.11.2020, Accepted Date: 05.01.2021

                                                     Abstract
In this study, we assessed the effects of extreme weather events on Hydro-morphological Quality Elements in
rivers of the United Kingdom alongside other pressures that will provide significant challenges for the
implementation of the Water Framework Directive in the UK in terms of cost-effectiveness and sustainability.
While observed meteorological data and river data sets were used for assessing changes in river systems and
weather patterns, for future assessments, UK Climate Projections 2018 data was used. The studies in the literature
have shown that during periods of extreme events, the river hydro-morphology is affected especially in terms of
river flows, sediments and riparian zones such as draughts, and intense and heavy rainfall leading to reduced or
exceptionally high flow respectively. Reduced flows can lead to the loss of habitat of aquatic organisms and an
increase in fish deaths. Whilst increased river flows lead to changes of the hydro-morphology of rivers including
changes to sediment dynamics and channels, rivers are also under negative effects of anthropogenic hydro-
morphological pressures such as building dams and water abstractions. Furthermore, changes in river hydro-
morphology can cause other problems such as increasing water temperature and decreasing dissolved oxygen, and
thereby degrading Biological Quality Elements and Physico-Chemical Quality Elements. To deal with and
mitigate these problems, a holistic view of water policy that considers climate change projections, reduces water
demand, changes agricultural and urban land use practices, improves water availability and quality is required.
          Keywords: Extreme weather events, climate change, water framework directive, ecological quality
status, river hydro-morphology

                                                        Öz

Bu çalışmada, Birleşik Krallık'taki aşırı hava olaylarının nehirlerdeki Hidro-morfolojik Kalite Elementleri
üzerindeki etkileri, Su Çerçeve Direktif’i uygulamasında sorunlara yol açabilecek diğer baskılarla birlikte
değerlendirilmiştir. Nehir sistemi ve hava olaylarındaki değişiklikleri değerlendirmek için gözlemlenen
meteorolojik ve nehir veri setleri kullanılırken, gelecek değerlendirmeler için Birleşik Krallık İklim
Projeksiyonları 2018 verileri kullanılmıştır. Literatürdeki çalışmalarda aşırı hava olayların olduğu dönemlerde
nehir hidro-morfolojisinin özellikle nehir akışları, sedimentleri ve nehir kıyı bölgeleri açısından etkilendiği
bulunmuştur. Azalan akışlar, sudaki organizmaların yaşam alanlarının kaybına ve balık ölümlerinin artmasına
neden olabilir. Artan nehir akışları, sediment dinamiği ve kanallarındaki değişiklikler de dahil olmak üzere
nehirlerin hidro-morfolojisinde değişikliklere yol açarken, nehirler, bina barajları ve su soyutlamaları gibi
aktiviteler de dahil olmak üzere antropojenik hidro-morfolojik basınçların olumsuz etkileri altındadır. Buna ek
olarak, nehir hidro-morfolojisindeki değişikler su sıcaklığını arttıran ve çözünmüş oksijen miktarını azaltan başka
problemlere sebep olabilir ve böylece Biyolojik Kalite Elementleri ve Fiziko-Kimyasal Kalite Elementlerini
indirgeyebilir. Birleşik Krallık’ta aşırı olayların yoğunluğunun ve sıklığının artması, Su Çerçeve Direktifi’nin
maliyet etkinliği ve sürdürülebilirlik açısından uygulanmasında zorluklara neden olacağına hiç şüphe yoktur. Bu
sorunlarla başa çıkmak ve bunları azaltmak için, iklim değişikliği projeksiyonlarını dikkate alan, su talebini
azaltan, suyun mevcudiyetini ve kalitesini iyileştiren, tarımsal ve kentsel arazi kullanım uygulamalarını değiştiren
bütüncül bir su politikası gereklidir.
          Anahtar kelimeler: Aşırı hava olayları, iklim değişikliği, su çerçeve direktifi, ekolojik kalite durumu,
nehir hidro-morfolojis

*Corresponding author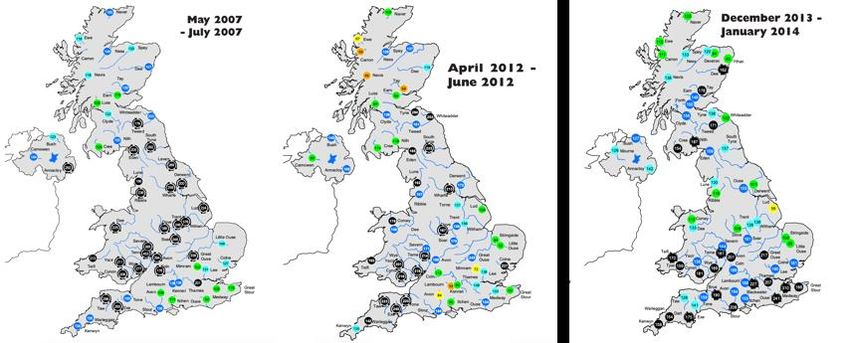
Introduction

       Fossil fuel consumption has increased very substantially since the Industrial Revolution
starting in the middle of 18th century England. In 1750, Great Britain produced about 5.2
million tons of coal per year, and by 1850, it was producing 62 million tonnes per year. Global
fossil-fuel consumption has also increased exponentially. During the 20th century, there was
more than a 1300-fold increase in the use of fossil fuels. Burning coal produces about 15 billion
tonnes of carbon dioxide (CO2) each year around the world at the present time. Coal still
accounts for about a third of the world’s fossil energy consumption. Fossil fuels (coal, natural
gas, and oil) are the primary source of air pollution, emitting a range of pollutants to the
atmosphere including CO2, Nitric Oxide (NOx), Sulfur Oxides (SOx) and other greenhouse
gases. Therefore, the use of fossil fuels as the world’s primary energy source contributes to the
many environmental problems being observed today. In particular, greenhouse gas emissions
have increased the greenhouse effect and are the major cause of climate change
(Intergovernmental Panel on Climate Change [IPCC], 2014).

      One of the unexpected problems that climate change causes is extreme weather events
(Ren et al., 2018). The frequency, intensity and duration of extreme events are also changing
due to many human factors, such as the growing global population which has increased from
670 million people at the start of the industrial revolution to over 6.7 billion (a 10 fold increase);
there has also been an increase in urbanisation and infrastructure across the world. Changes in
extreme events can be observed in some statistical parameters such as mean and variance of
events. In addition to climate change caused by anthropogenic activities, some extreme events
occur due to natural variability. Therefore, it is important to take natural variability into account
for a better understanding of extreme events in the future alongside changes caused by
anthrophonic activity (Field et al., 2012; United Kingdom Climate Change Risk Assesment
[UKCCRA], 2017).

      Climate change causes some alteration on weather events such as precipitation and
temperature, and this is expected to be effective on a global scale. Additionally, in some
regions, some extreme events have increased, they have become more frequent and more
intense in particular regions (Herrero et al., 2018; IPCC, 2013). These observations have started
to be seen with increasing concern. There is some evidence that many of these increases are
related to human activities. (Ren et al., 2018).

      Extreme events may cause serious problems for the environment such as floods, storms,
and water contamination. To illustrate, when it rains much more than expected over a short
time, floods can occur and cause serious and destructive harm to river flows, regimes and
sediments depending on the size of the flood. Some positive changes in river water quality can
be associated with the decrease in occurrence and duration of extreme events (United Kingdom
Technology for Agriculture and Genetics [UKTAG], 2008)

      The world has seen an increase of 0.85 [0.65-1.06] °C in the average global (combined
land and ocean surface) temperature from 1880 to 2012. This trend in global warming has also
been observed in England, which is reported in the central England temperature data series,
which has good correlation with temperature data sets from other global sources (UK Climate
Change Risk Assessment [UKCCRA], 2017). In recent decades, the UK has had milder winters
and hotter summers, and since 1990, all ten of the warmest years in the UK have occurred
during this period. Surprisingly eight of them have occurred since 2002 (Kendon et al., 2015).
Furthermore, the frequency of heatwaves has started to increase and have occurred many times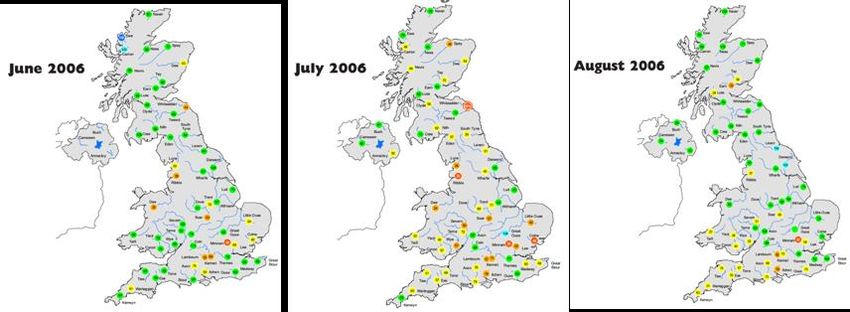
since 2000, with the most critical recorded heatwaves occurring in 2003, 2006 and 2018. These
observations show that because of the impacts of climate change, extreme events, which have
serious impacts on the environment, have started to be observed more frequently and
intensively in recent years (Guillod et al., 2017). The UK Climate Change Risk Assessment
Report (2017) concludes that extreme events such as floods, heatwaves, and droughts will
become common threats for the UK and advises regulators to take serious and permanent
precautions to mitigate these forecasts.

      If climate change mitigation plans are not adopted and extreme events such as floods and
heatwaves become more frequent and intense in the future, such events could change the
geomorphology of riverine habitat and the river ecology. It is possible to alter the river’s quality
and habitat quantity as extreme events such as floods change river geomorphology which
consists of riparian, slope, discharge, catchment geology and sediment supply. Additionally,
human activities such as engineering works for the protection of floods exacerbate the impacts
of extreme floods on rivers by changing the riparian zones and river flows that minimize the
river channel width over time (Death et al., 2015). During periods of extremes, a flood could
not find enough channel width, and the destructive impacts of floods could be more intense
(Death et al., 2015).

      To deal with problems in water bodies, on October 2000, The European Parliament and
The Council of The European Union published an establishment of a framework regarding
water policy for their community actions (EU Water Framework Directive [WFD] 2000/60/EC,
2000). The aim of the WFD required all member states to achieve “good status” in all types of
water bodies by establishing measurement programmes. For different types of water bodies,
the Ecological Quality Status needs to be assessed by member states. For surface waters, the
classification of ecological status is defined by Biological Quality Elements (BQEs), Physico-
chemical Quality Elements (PCQEs) and Hydro-morphological Quality Elements (HMQEs)
(Romero et al., 2013). Water bodies are classified into five categories used by the WFD
classification scheme, and these are high status, good status, moderate status, poor status and
bad status (Table 1). To achieve high status a water body must meet the conditions of each of
the WFD Quality elements. A lower classification is based on the degree of deviation from
reference conditions. The hydro-morphological quality element is only considered for water
bodies that meet the other two quality elements. The WFD has set an objective for all water
bodies in the EU to achieve at least ‘good status’ but almost half of the water bodies in Europe
are currently below this standard.

Table 1

Definition of Ecological Status of Water Bodies under the WFD (Environment Agency, 2006)
                                   Water Framework Directive Quality Elements
  Ecological Status
                                      BQE                        PCQE                 HMQE
                                                                                      Meets
     High status               Meets conditions            Meets conditions
                                                                                    conditions
                            Deviates slightly from
     Good status                                           Meets conditions       Not considered
                             reference conditions
   Moderate status           Moderate deviation           Moderate deviation      Not considered
    Poor status                   Deviation                Major deviation        Not considered
    Bad status                    Deviation               Greater deviation       Not considered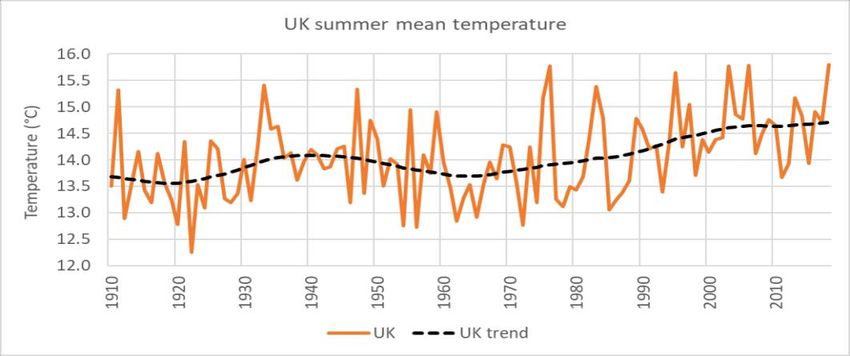
A hydro-morphology assessment considers the hydrological (water flow, energy) and
geomorphological (surface features) attributes of water bodies and is a “supporting element”
which means that for water bodies where ecological status is less than ‘high status’ or is
changing status from high to good ecological status, the hydro-morphological state is not taken
into account as a component of overall ecological status (Environment Agency, 2006). When
used in the assessment of ecological status, both natural and anthropogenic variables including
river flow regimes and fluvial geomorphology are considered. High status is determined if the
water body has no or very minor anthropogenic changes regarding the HMQE (The Secretary
of State, 2015). Additionally, as indicated previously, the WFD requires its members to define
their rivers’ ecological status based on BQEs, PCQEs, as well as HMQEs which consider the
hydrological regime, river continuity, and morphological conditions as detailed in Annex V of
the WFD (Ilnicki et al., 2010; The Secretary of State, 2015). It is known that any changes in
ecological status could be the result of changes in one or more of the elements. Although
chemical elements could be measured according to their main quality, hydro-morphological
elements cannot be measured in the same way (Department for Environment, Food & Rural
Affairs [DEFRA], 2006).

        Hydro-morphological Quality Elements (HMQEs) is one of the main parts of
Ecological Quality Status for surface water bodies under the water framework directive
(Reynard, 2010). By helping to describe conditions of water bodies, all EU members need to
consider all mandatory and recommended parameters for these elements. Surface water bodies
such as rivers, and lakes have specific HMQEs including the hydrological regime, river
continuity and morphological conditions as reported in Annex V of the WFD, and these are
described as ‘supporting the biological elements’ by the WFD (The Secretary of State, 2015;
United Kingdom Technical Advisory Group [UKTAG], 2003). Assessment categories of
surface water bodies defined by the WFD is shown in Figure 1.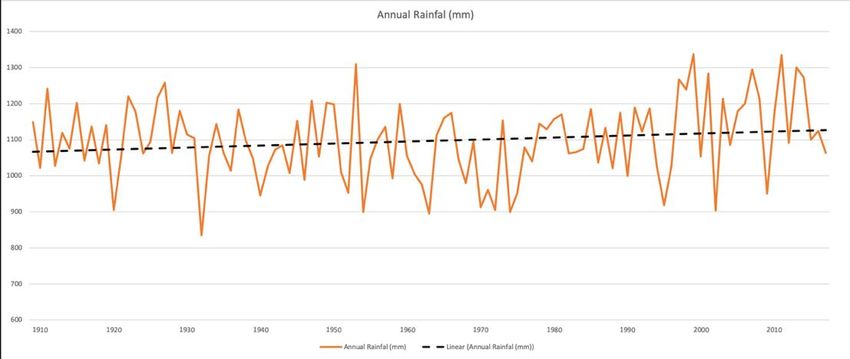
Figure 1

Assessment of Ecological Status of Rivers (Adapted from Department for Environment, Food
& Rural Affairs [DEFRA], 2009; European Environment Agency [EEA], 2018)

        It is known that any changes in ecological status could be the result of changes in one
or more of each of these elements, and HMQEs are defined to be supportive of BQEs, and the
reverse case could occur (Department for Environment, Food & Rural Affairs [DEFRA], 2006;
Environment Agency, 2006). It is not avoidable to have impacts on river biota whilst
responding to the effects of extreme climate events and weaken ecological resilience. Any
changes in river morphology, hydrology, and riparian cover could cause some problems for the
cold water refugia such as salmonids. Also, any channelization for flood risk increases
sediment loads and reduces habitat diversity (Whitehead et al., 2009). Furthermore, Feld et
al.(2014) showed that one of the important pressures and major threats to lotic ecosystems and
biodiversity in Europe is hydro-morphological alterations. Also, the study suggested that it is
essential to develop and identify new indicators for detecting biodiversity loss and changes in
ecosystems.

        Moreover, increasing drought and flood intensity due to climate change can affect river
flow regimes and morphology. Thermal impacts where reduced flow occur will be exacerbated
by increased temperature. Moreover, having lower flows and higher water residence times in
rivers can cause serious problems such as eutrophication, ecosystem functions, algal growth
and decreasing oxygen level. It is also known that changes in water temperature can have
impacts on aquatic systems and some species could be more sensitive to changes, even for
small changes. Increasing rainfall comes with biophysical impacts such as diffuse pollution
and soil erosion (Whitehead et al., 2009; UK Climate Change Risk Assessment [UKCCRA],
2012a; Orr et al., 2015; O’Briain, 2019).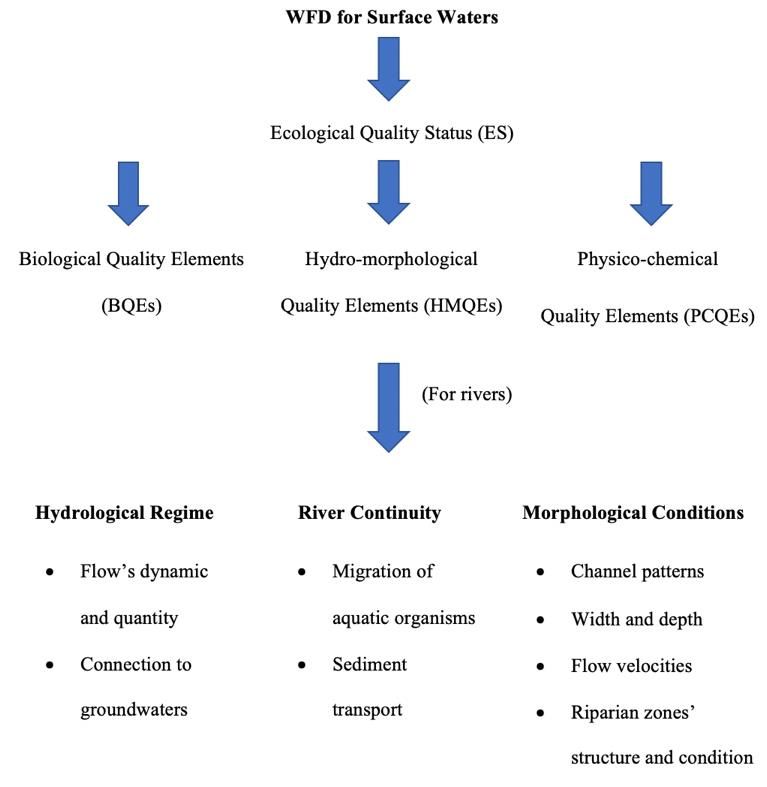
Any changes in air temperature and rainfall, projected by climate models could have
impacts on river flows and alter dilution for pollutants. There is no doubt that chemical reaction
kinetics, quality, and ecological status of water bodies will be affected by warmer water.
Increased flows will cause some changes in stream power, sediment transfer and loads, which
have the potential to change the morphology of rivers. Having lower flows in rivers could cause
reduced dilution, and this could result in higher concentrations of pollutants, which makes the
purpose of improving water quality standards hard within the WFD. Additionally, it will cause
increased biochemical oxygen demand (BOD), lower dissolved oxygen (DO) concentrations,
and have impacts on organic pollutant concentrations in rivers. While ammonia levels fall due
to higher rates of nitrification, BOD and phosphorus levels increase under the reduced flows
in the summer periods (Whitehead et al., 2009)

        All monitoring programmes for assessment of river basins and flood risk should
consider all ecological quality elements including hydro-morphological quality elements. Also,
any effects of hydro-morphology on biological elements should be considered in the future
within the timeframe of monitoring programmes. There are lots of differences among member
state countries for giving priorities to hydro-morphological elements, and sediment transport
is considered more in the River Basin Management Plans compared to Flood Risk Management
Plans (Nones et al., 2017). To evaluate the rivers’ hydrological and morphological conditions,
direct and indirect pressures and nature of anthropogenic changes must be considered by the
appropriate agency (The Secretary of State, 2015).

        It was expected that all EU members would reach good status in all water bodies by
2015, called the first planning cycle; however, many member states faced problems to develop
programmes and had limited change in their ecological status. Nearly half of the surface water
bodies within the EU remained the same and did not reach the aims of the WFD. Additionally,
in the first cycle (from 2009 to 2015), only 10% of water bodies that were classified at a
moderate status or below reached good status. Therefore, the timeline to achieve good status
was postponed to 2027 (Giakoumis and Voulvoulis, 2019; Van Rijswick and Backes, 2015).

         Any changes in the future climate or socio-economy may affect the ability of member
states to reach desired environmental conditions to achieve the required WFD ecological status.
To exemplify, it is known that the objectives of the WFD could be more difficult by the
worsening hydro-morphological issues and nutrient enrichment in the 2050s across Europe,
which also applies for England and Wales. It is expected that hydro-morphology will be
degraded in the future, and there should be more measures for dealing with these challenges
with sustainable and cost-effective approaches and adaptations for common issues in different
scenarios (Henriques et al., 2015)

        An assessment of the ecological status of the UK in 2009 reported that almost half of
the surface water did not meet good status. It was determined that there were many significant
pressures from the point and nonpoint sources, hydro-morphological alterations and other
pressures which impacted on water bodies in failing river basin districts. Additionally, UK
forecasts mention the increase of precipitations and temperatures and extreme events, which
will continue to increase and be more frequent in the future, however; there is not enough
knowledge regarding re-occurrence time. Serious and permanent precautions for the protection
of bodies is required to mitigate these threats (UK Climate Change Risk Assessment
[UKCCRA], 2012). Modelling studies of UK climate predicts hotter summers which are
expected to cause lower river flows and reduce water levels. Extreme events such as heatwaves
also place pressures on the demands of water supply.
This study reports on the pressures and negative impacts of extreme weather events on
hydro-morphological quality elements of water bodies in the United Kingdom. The paper
considers the UK’s weather changes and trends over the last century and identifies and
considers the possible obstacles and barriers resulting from climate change and extreme events
in the implication of the WFD in the UK in the future.
Method
Design and Search Strategy
The Web of Science and Scopus databases were used to address the objectives of the
research. Searches were limited to English articles, published between January 1980 to present
in peer-reviewed journals. UK Met Office meteorological data sets were searched for
parameters such as temperature, rainfall and extreme event occurrence in the UK. Climate and
other factors that could impact on HMQEs related to river hydro-morphology were determined
using data sets available online. Additional parameters that have the potential to impact or
change hydro-morphological quality elements were identified to assess potential problems for
the implementation of the WFD in the UK. The following parameters were considered:
Temperature: To visualize the changes over the world from 1850 to 2018 and in the
UK from 1884 to 2018, data sets were obtained from the UK Met Office. Additionally, maps
showing temperature changes over the world and the UK was obtained from IPCC. Data for
extreme events including drought periods were obtained from the UK Met Office. For future
assessment, United Kingdom Climate Projections 18 data was used ( UK Climate Projections
18 [UKCP18], 2018)
Rainfall: To assess observed rainfall trends in the UK, data containing annual,
seasonal, and monthly participations values (mm) from 1910 to 2018 collected from the UK
Met Office was used. For future assessment of precipitation changes, data was obtained from
UKCP18 for the UK under five different scenarios, and from IPCC for world rainfall records.
River changes: To show any changes in rivers, data such as river flows was obtained
from the UK National River Flow Archive, the UK Monthly Hydrological Summaries,
Environment Agency River Hydrology, Annual State of the UK Climate, and Centre for
Ecology & Hydrology.
Data Analyses
To analyse data sets to learn any impacts of extreme events on rivers, firstly data sets
were reproduced using Microsoft Excel. Periodical and overall min, max, and mean values
were compared and shown in the graphs to see how rainfall and temperature trends changed
over the years. Also, regional values were compared to see how the UK was affected by
extremes regionally. Weather maps from the UK Met Office were used and compared to assess
how extreme weather events were effective over the UK. The differences and connections
between hydro-morphological variables such as river flows, channel width, and riparian zones
and extreme weather conditions such as heatwaves, floods, and droughts were identified by
comparing the periodical weather results. For future assessment, different scenarios were
shown in the same graphs, which allowed comparing the projections related to weather
patterns.Results and Discussion
Climate Change and Extreme Events Analyses
Many physical responses such as changes in air temperature, in rainfall, the melting of
glaciers and ice sheets, and increasing sea levels are indicators of climate change (IPCC, 2013).
According to IPCC, even if global warming was limited at 1.5 degrees above pre-industrial
levels, the effects of climate change would still be effective on earth. Such scenarios demand
planning and preparedness for adverse weather effects including storms, sea-level rise,
heatwaves, weather-related diseases, and other effects that have adverse impacts on society and
the environment (Emma, 2018).
Although regional climate change outcomes are uncertain, many latest assessments
include the projection of changes in the occurrence of weather and climate events, which
mainly focuses on frequency, intensity and duration. These changes, with increasing
vulnerability, could increase stress on society and environment, and increase the tendency for
adverse effects of climate change around the world (Field et al., 2012).
Since the 1950s, extreme events and climate events, such as a decrease in cold
temperature extremes and the increase in warm temperature extremes and heavy rainfall events
have started to change, some of these changes have been linked to anthropogenic influences.
Other changes in extremes, that could occur include an increase in the number of warm days
and nights, and a decrease in the number of cold days and nights globally. Also, in most of
Europe, Asia and Australia, there has been an increase in the frequency of heatwaves and the
intensity and occurrence of the temperature extremes. ((Intergovernmental Panel on Climte
Change [IPCC], 2014).
UK temperature analysis.
The dominant cause of global and UK temperature changes can be attributed to
increasing greenhouse gases (GHGs) in the atmosphere. Furthermore, there is a substantial
body of evidence that suggests that these emissions are due to human activities rather than
natural causes and the observed temperature changes are not a result of natural climate
variations (Adger and Brown, 1993). These findings are based on national inventories of
greenhouse gas emissions, which form a part of the UK’s ratification the United Nations
Framework Convention on Climate Change (UNFCCC) which came into force in March 1994.
Under its obligation to the convention, the UK is required to regularly update national emission
inventories of GHGs. A report lasts submitted in 2019 (Brown et al., 2019) contains national
greenhouse gas emission estimates for the period 1990-2017 and includes descriptions of the
methods used to produce the estimates.
Evidence of global warming is highly convincing, global temperature measurements
from worldwide records show that average temperatures have risen by nearly 0.8 ºC since the
late 19th century, which is a rise of 0.2 ºC/decade. This is also the case of temperature records
in the UK, which like other parts of the world also show significant trends towards higher
temperatures; i.e. in England, temperatures have risen by 1 ºC since the 1970s. Temperatures
have also increased in other parts of the UK, in Scotland and Northern Ireland they have arisen
by 0.8 ºC since 1980 (Jenkins et al., 2008). Recent decades have seen the largest increase in
temperature, for example, the last decade in England was the second hottest in the past 100
years and eight new high-temperature records have been set during the last two decades. Whencompared to the annual average UK land temperature during the period of 1961-1990, the
period of 2005-2014 was 0.9°C higher, and 2014 was the warmest year. While ten of the
warmest years has observed since 1990, and eight of them has occurred since 2002 (Karoly
and Stott, 2006; Kendon et al., 2016).
Hawkins (2019) visualised these temperature trends using an animated spiral graphic
and later he used warning strip charts, that contain chronologically ordered coloured stripes to
describe the temperatures in the UK for the period 1850 – 2018. The warning charts show that
most warming years were observed in the last two decades and the latter part of the last century.
Alongside higher mean temperatures over lands and seas, the UK has also experienced more
extreme events and experienced milder winters and hotter summer in recent years (UK Climate
Change Risk Assessment [UKCCRA], 2017).
Global climate models (GCMs) have been used to predict how temperatures will change
around the world. To analyse specific regions, regional climate models (RCMs) have been
useful tools in providing fine-scale and regional results. One of the RCMs is the United
Kingdom Climate Projections (UKCP), first published in 2009, and supported by the UK Met
Office and DEFRA (UKCP18), were used with finer scale and more detailed information by
covering both land and surrounding seas around the UK. These models show that UK annual
average temperatures will change by 2100 under five different scenarios at the 95th percentiles.
Scenarios are for the low (RCP2.6), medium (RCP4.5 and RCP6.0), high emissions (RCP8.5),
and the UKCP09 medium emissions scenario (SRES A1B), relative to baseline of 1981-2000.
Even if the low scenario (RCP2.6) remained effective, the UK would still be warmer and there
would be around 0.75 °C increase in annual average temperature, while the scenario would
progressively get worse and for the high emissions (RCP8.5) the temperatures will increase
around 8.6 °C (Lowe et al., 2019).
UK rainfall analyses.
Over the past 100 years, while the global precipitations have changed, the UK climate
has also changed with an increase in the winter rainfall and a decrease in the summer rainfall.
While more heavy rainfall events are observed winter rainfalls, the summer rainfall decreases
(Emma, 2018).
In Figure 2, it is shown how the precipitations changed in the UK from the 1910s to
2018 with the value of min, max and average of 1981-2010, 1910-2018, and 1910-1980 period.
While the wettest period was observed in 2000 and 2012 with 118% of average, the driest
period was observed in 1993 with 74% of average. Since 1998, seven of the ten wettest years
has observed. These are 2000, 2012, 2014, 2008, 2002, 2015, and 1998, respectively.Figure 1
The UK Rainfall Time Series from 1910-2010 (Data from UK Meteorological Office, 2019)
UK Rainfall 1910-2010
Average of Rainfall (mm) pre 1981 Average of Rainfall (mm) post 1980
120
110
Average rainfall (mm)
100
90
80
70
60 Pre-1981 rainfall Average 89.6 mm Post-1980 rainfall Average 93.3 mm
50
1913
1943
1973
1982
1910
1916
1919
1922
1925
1928
1931
1934
1937
1940
1946
1949
1952
1955
1958
1961
1964
1967
1970
1976
1979
1985
1988
1991
1994
1997
2000
2003
2006
2009
Under the five different scenarios, UKCP18 has projected the changes in the
precipitation over areas of the UK. Although annual average rainfall may not change over the
21st century, it is expected to increase in more extreme events (Emma, 2018). In the UKCP18,
it is found that while a smaller increase is observed over Scotland, a larger increase is observed
in the South of England. In projections of changes in 30-year mean annual, winter and summer
mean precipitation by the 2050s under the medium emissions scenario, the UK is expected to
see increases in winter rainfall by approximately 5% to 30%, and to see 20%-40% decrease or
1%-7% increase in summer rainfall (UK Climate Change Risk Assessment [UKCCRA],
2012). Projections show that while warmer and wetter climate will occur in winters, hotter and
drier climate will occur in the summer. As a result of natural variability in the climate system,
natural structure of the winter and summertime periods, cold and drier winters, or wetter
summer will still occur with less frequency.
UK Extreme Events
Heatwaves.
The UK has undergone many heatwaves since the beginning of the 20th century. Figure
3 shows the summer mean temperature from 1910 to 2018 in the UK. The warmest summer of
1911 was equal with 1976, 2003, 2006 and 2018.Figure 2
Summer Mean Temperature in the UK from 1910 (Data from UK Meteorological Office,
2018a)
Since the 1980s, heatwaves have started to become more frequent and the trend from
1910 to 2018 is upward, which has seen average summer temperatures increase by about 1.0°C
from an average daily temperature of 13.6°C to 14.6°C. Furthermore, the average maximum
temperature is also increasing. Table 2 shows that during the period 1981-2010 compared to
the period 1961-1990, the maximum average temperature has increased in every month
between the two time periods (annual average increase between the two periods is 0.6 °C)
Table 2
UK Average Temperatures (Maximum and Minimum Average Temperatures in the Periods
1981-2010 and 1961-1990, and the Difference in Maximum Average Temperature)
Climate Period 1981 – 2010 Climate Period 1961 – 1990 Difference in
Maximum Minimum Maximum Minimum Maximum
Month
Temperature Temperature Temperature Temperature Temperature
(°C) (°C) (°C) (°C) (°C)
January 6.4 0.9 5.7 0.4 0.7
February 6.6 0.7 5.8 0.2 0.8
March 8.9 2.1 8 1.4 0.9
April 11.4 3.4 10.6 2.8 0.8
May 14.7 6 14.1 5.5 0.6
June 17.3 8.8 17 8.4 0.3
July 19.4 10.9 18.6 10.2 0.8
August 19.1 10.8 18.4 10.2 0.7
September 16.5 8.8 16 8.4 0.5
October 12.8 6.2 12.7 6.2 0.1
November 9.1 3.3 8.4 2.7 0.7
December 6.7 1.1 6.5 1.2 0.2
Annual 12.4 5.3 11.8 4.8 0.6Floods and heavy rainfalls.
Many extreme events including floods and heavy rainfalls have been intensively and
frequently observed in the UK since the late 20th century. There has been a 17% increase in the
total amount of extreme rains from 2008 to 2017, when compared to the 1961-1990 period.
Figure 4 shows how the UK’s rainfall changes annually, showing an incremental trend upwards
over the last 30 years period. Additionally, while the largest changes are observed in Scotland,
most of the southern and eastern areas are not affected as much. Although the extreme events
vary inter-annually, the general trend is consistent with the increase in the rainfall over the UK.
Figure 3
Annual Rainfall Changes in the UK from 1910 to 2018 (Data from UK Meteorological Office,
2019)
The period 2008 to 2017 has set several new rainfall records. The months of May, June
and July in 2007 were exceptionally wet months with twice the 1961-1990 average. And 2012
was one of the wettest years in the UK with several destructive floods. During the year, most
parts of England, Wales and eastern Scotland received twice or three times the average rainfall.
Also, some local areas received over four time average (UK Meteorological Office, 2012). In
December 2013 and January 2014, the UK experienced some of the most widespread and
destructive floods on record which occurred in many parts of the UK. In Scotland, the rail
network had periods of shut down, and many houses were left without power for weeks. While
in December, heavy rainfall was effective over Scotland, the south part of the UK was affected
severely in January (Figure 5) (UK Meteorological Office, 2014).Figure 4
December 2013 and January 2014 Rainfall with 1961-1990 Average UK Meteorological
Office, 2018b)
The IPCC 5th Assessment Report for policymakers’ forecasts that the UK will see a rise
in rainfall of about 10% in annual average rainfall by 2100 compared to the period 1985-2005.
The forecast also predicts that the UK is very likely to see more heavy rainfall events in the
next 50-100 years. Heavy and prolonged rainfall events, resulting in lots of rain falling in a
short time will lead to a higher incidence of flooding over time. The economic growth of the
United Kingdom, particularly certain parts of the UK such as the South East of England have
seen a significant increase in property developments on floodplains over the past 10 years and
one in five of those properties is at risk of flooding. In the UK, between 2001 and 2011, 200,000
homes were built in floodplains. Therefore, the increase in heavy rainfalls places these
developments at high risk.
Impacts of Climate change and Extreme Events on Hydro-morphological Quality
Elements
The UK’s surface, transitional and coastal waters are highly affected by anthropogenic
activity. Like many other countries, the UK has over the centuries changed the course and
character of its water bodies to make water available for agriculture, to develop urban areas, to
produce hydroelectric power or to protect its communities from flooding. Physical changes to
water bodies that result from activity such as water abstraction, water flow engineering (dams,
weirs, and locks), morphological alterations (changes to the channel, riparian and flood plain)
are called hydro-morphological pressures as they alter the water flow dynamics and
morphology (or physical structure) of the water body. Hydro-morphological changes can
induce habitat alterations i.e. change in flow frequency, flow duration, change in sediment
transport, loss of floodplains or intertidal area, change in river profile and estuaries and change
in connection with groundwater (Kristensen et al., 2012). Therefore, Hydro-morphological
pressures can have a significant impact on the aquatic environment.
In addition to direct impacts of anthropogenic alterations, the hydro-morphology of a
river can also be affected by climate change. One of the significant results of climate change
may be the increase, duration and intensity of extreme events such as floods or heatwaves,which affect the hydrological conditions of rivers, including flow and water levels (Bauwens
et al., 2013; Hannaford, 2015; Lehner et al., 2006; Nováky and Bálint, 2013). These events are
also known as hydrological hazards which are associated with water’s movement, distribution
and occurrence. Because of the complexity of systems and the interaction between hydrology
and climate, for any given system, the changes it experiences in hydrological and
morphological conditions is generally not widely understood or extensively studied (Arnell,
2003; Guan et al., 2016; Visser-Quinn et al., 2019; Yousefi et al., 2018).
River flow regimes are key indicators of anthropogenic climate-driven changes in river
flows (Hannaford, 2015). River flow regimes help understand how spatial and temporal
changes occur and to identify any future changes. Additionally, it is possible to identify and
learn the river or catchments sensitivity to climate change (Bower et al., 2004; Howden et al.,
2009). This type of studies to understand the relationship between climate change and extreme
events and river flow is helped by the excellent gauging station network, consisting of 1400
stations. The data from these stations is kept by the National River Flow Archive. However,
most of the gauging stations were installed in the 1960s and 1970s and therefore there is a lack
of data from the 19th or early 20th century. Furthermore, there is considerable missing data from
stations particularly during extreme flow periods of very high or low flow episodes (Dixon et
al., 2006).
River flow changes in the UK during heatwaves.
Although low river flows as a consequence of dry weather which occur during
heatwaves receive less attention than high flows caused by high rainfall, low flows are
nevertheless a significant issue. Reduced flows reduce the protective dilution effect of rivers
on aquatic life, leading to changes and the loss of habitat for aquatic animals and plants. For
example, fish deaths increase during droughts and low river flow. Also, during low flow events,
water abstraction for agriculture and water supply needs to be constrained, affecting
households, agriculture and industry.
Evidence of low river flows during drought periods in the UK is available during two
record-breaking heatwaves during this century. Figure 6 shows river flows in the July heatwave
of 2006. The river flow changes were collected from monthly hydrological and described as;
exceptionally high flow (black), notably high flow (dark blue), above normal (blue), normal
range (green), below normal (yellow), notably low flow(orange), exceptionally low flow (red).Figure 5
River Flow Changes in the UK During the July 2006 Heatwave (Adopted from The Natural
Environment Research Council's (NERC) Centre for Ecology & Hydrology (CEH) [NERC
CEH], 2018)
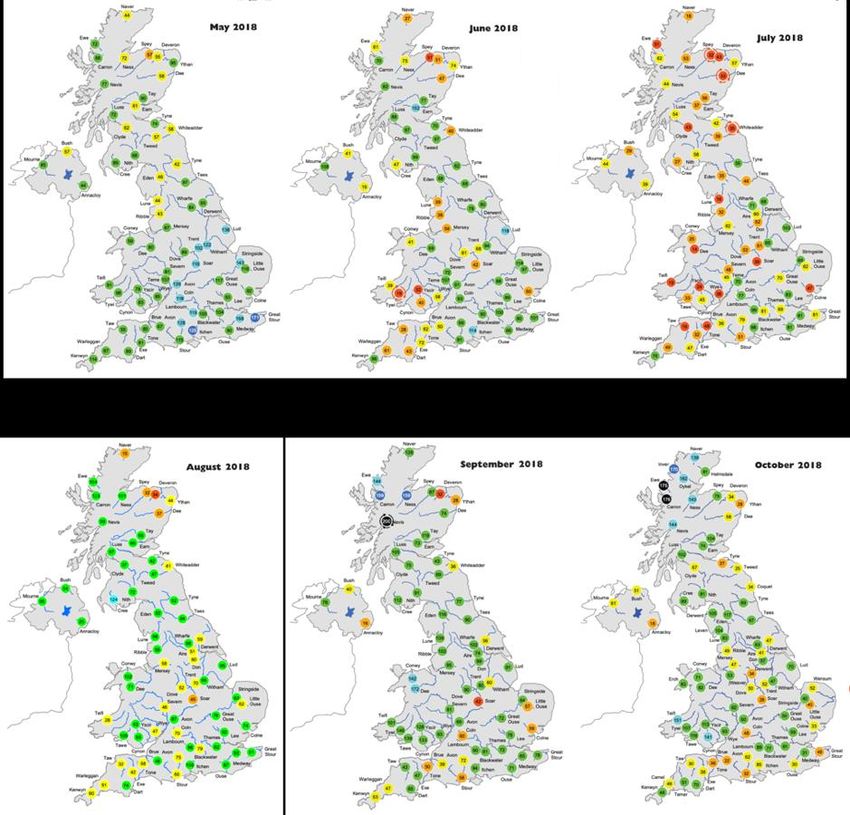
River flow changes in the UK during the 2018 heat wave provide further evidence of
climatic effects, shown in Figure 7. The figure illustrates that river flows were highly affected
during heat waves, showing that flows in May were normal, occasionally below average, but
almost 80% of river flows were under normal range and some exceptionally low in July (the
peak of the heatwave). In August 2018, the status was getting better and turned into normal in
September.Figure 6
River Flow Changes in the UK During the 2018 Summer Heatwave (Adopted from The Natural
Environment Research Council's (NERC) Centre for Ecology & Hydrology (CEH) [NERC
CEH], 2018)
River flow changes in the UK during heavy rainfalls.
In addition to impacts of heatwaves on river flows, heavy rainfalls also have significant
impacts on river flows including flooding. The UK experienced heavy and prolonged rainfall
and flooding during 2007, 2012, and 2013-2014, the flooding had very destructive effects on a
large number of communities in the UK. During these periods, many parts of England,
Northern Ireland, and Scotland were under heavy rainfall which caused these areas to be
extremely wet. When analysing the river flow changes during this period, it is found that rivers
were above average flow, some had exceptionally or notably high flow as shown in Figure 8.
The UK, especially central England were most affected by these extreme events in 2007.Figure 7
River Flow Changes over the UK in 2007, 2012, and 2013-2014 (Periods of Heavy Rainfall)
(Adopted from The Natural Environment Research Council's (NERC) Centre for Ecology &
Hydrology (CEH) [NERC CEH], 2018)
Therefore, it is possible to say that the river flows are affected by extreme events. These
effects could be either more flows above average that can cause floods and heavy rainfalls, or
fewer flows below average for heatwaves.
Although many studies have focused on the relationship between hydrology and
geomorphology, only a few studies have been conducted for analysing the effects of extreme
events on channel hydrology and morphology (Yousefi et al., 2018). According to Phillips
(2002), it is found that flash flooding has impacts on geomorphology and has caused channel
changes.
The study for seasonal analyses in the UK was conducted by Hannaford and Buys (2012).
It is observed that while north and west part of the UK’s winter high flows were at a high level,
central and southwest England and eastern Scotland’s autumn high flows were at a high level.
Also is found that there was an increase in the high flows of some lowland catchments and that
although summer and spring flows were more complex and mixed, in some regions there were
increase trends in both seasons. Other studies also showed that results are generally on the same
side for the UK and that there is a tendency to increase high flows. (Hannaford, 2015).
Moreover, according to Dixon et al. (2006), flow regimes at 56 gauging stations from
1962 to 2001 in Wales And English Midlands were analysed. It is found that while significant
high flow trends were observed in winter in the west of studies, flows were at a high level in
east of study areas in autumn. Additionally, from 1977 to 2016 period, the increase in the
annual and autumn extreme flows was observed in the Severn uplands (Biggs and Atkinson,
2011).
On the contrary, according to Hannaford (2015), there is no sufficient evidence for any
long term trend (decrease or low flows) in river flows. However, past events showed that there
has been remarkable hydrological volatility and that the UK rivers have been vulnerable to
extremes such as major floods and storms in winters.As indicated above, the frequency of extreme events is increasing. More heavy rainfalls
accelerate the soil erosion and cause the contamination of watercourses and loss of valuable
soils. Floods are the main cause of erosion, waterlogging and compaction. (Environment
Agency, 2018; Reynard, 2010)
Additionally, changes in the width of River Dane, Bollin, and Severn in various years
are shown in Table 3. In the study conducted in these rivers showed that there was a seasonal
difference in the high flow events, and the complexity in the morphology and flows was
observed. Other factors such as extended growing season and vegetation may have significant
impacts on them (Hooke, 2006).
Table 3
Changes in Width of Channels
River Dane 1984 1996 2001
Width (m) 18.6 15.7 17.2
Last peak Q (m3 s-1) 79.4 20 130.7
River Bollin 1970 1984 2001
Width (m) 10.3 8.0 9.85
Last peak Q (m3 s-1) 39.56 38.91 48.65
River Severn 1973 1984 1992
Width (m) 21 25.5 26.5
Last peak Q (m3 s-1) 131.18 207.11 230.97
Apart from the studies in the UK, a study conducted in Iran confirmed the impacts of
extremes on rivers and found that flood discharge on 14 April 2016 was at the highest level in
records for the last 60 years in Karoon River. Also, it is found that the channel width was
significantly affected by extreme floods by analysing the OLI Landsat images taking before
and after the flood. An increase from 192m to 256m in the average channel width was observed.
Moreover, extensive bank erosion (almost 1290ha) because of increased flow power caused
the channel width (Yousefi et al., 2018). Additionally, the result of this study goes hand in hand
with the study conducted in Austria. In this study, it is found that extreme flood had impacts
on rivers and widened the channel (Hauer and Habersack, 2009).
Moreover, it is known that one of the results from a series of floods is the sediment
exhaustion and that more effective floods may have more impacts on sediment changes from
earlier floods. Therefore, it is more complex to understand the series of floods' effects on
sediment dynamics and channels than single floods (Carling, 2013). During most high flow
events, sediments tend to move, and movement can be vary depending on sediment size and
hydrological regime of river (Hooke, 2006). In the UK, it is expected that extreme events will
occur more frequently and with greater intensively as described above. According to Boardman
(2015) and Burt et al. (2015), the increasing trend in average rainfall could cause an increase
in soil erosion in southern England.Additionally, the impacts of extremes on the river channel has been reported by Guan
et al. (2016), and it is found that extreme floods have an essential impact on adjusting the river
channel. The channel changes due to extreme events have impacts on flood hazards and will
be increased with more extreme flooding. Therefore, it can be described as a chain or cycle
that affects each other. While extremes affect the channel conditions, any changes in the
channel conditions can cause greater impacts of extremes, as it is more vulnerable to any
changes and external factors.
While, in higher flood events, more erosion is observed, more deposition is observed
in lower events. Therefore, it is possible to say that sequential high flow year may cause an
increase in the channel width and that lower and single peak flows may result in more
deposition (Hooke, 2006). On the contrary, to improve morphology, increase sediment
porosity, and enhance the instream and riparian fauna and flora, some low and artificial floods
have been used, which removed the lateral sediments and restricted the riverbeds (Mürle et al.,
2003).
Many studies have shown that having riparian vegetation has been an effective and
cheap way to protect and minimize the effects of floods on banks, and that most riparian
vegetation areas are less eroded. It is also responsible for the many natural systems related to
water quality. However, as riparian vegetation seems to be an interface between water and
territory, in extreme events such as flash floods, it is not possible to deal with floods’
destructive impacts (Fernandes et al., 2016; Keesstra et al., 2012; Yousefi et al., 2018).
A study conducted by Fernandes et al. (2016) showed that the most important factor
that caused changes in riparian is hydrological changes under the extreme water scarcity. It is
found that an expected decrease in the annual mean flows in rivers will cause riparian shrinkage
in the 21st century. These results were also corroborated by the other studies conducted by Poff
and Zimmerman (2010) and Rivaes et al. (2014). The low natural streamflow caused by
extreme events also leads to a reduction in both patch size and riparian zone areas. Without
any adaptation, it will be more vulnerable to climate change, and will alter the overall
ecosystem functions as it is an important part of them (Capon et al., 2013).
It is also reported by Garssen et al. (2014) and later by Carolina (2015) that intense and
long term drought more than 30 days has impacts on narrowing the riparian wetland zone, with
accelerating the riparian wetland species losses. On the other hand, modelling studies showing
how the flow regime changes due to climate change confirmed that riparian areas are expected
to decrease in the areas most affected by climate change (Rivaes et al., 2013).
In addition to direct impacts of extremes on riparian zones, wildfire danger should be
taken into account, as high temperatures and strong winds enhance the occurrence of fire.
To simplify and summarize, Table 4 shows the effects of extreme events on river hydro-
morphology on changes and risks on HMEQs.Table 4
Important Risks and Changes from Extreme Weather Events on River Hydro-morphology
Extreme Events Risks and Changes on HMQEs
Low River Flows
Heatwave Low Water Levels
Riparian Shrinkage
High River Flows
Riparian Changes due to Soil Erosion
Mitigation of Aquatic Organisms
Flood
Sediment Exhaustion
Channel Changes due to More Deposition
Increased Channel Width
Impacts of Human Induced Modifications on River Hydro-morphology
Water retention, abstraction, hydropower, metering, tourism, recreation, and any other
activities related to anthropogenic progress have impacts and pressures on water ecosystems,
especially rivers. The rivers’ physiochemistry, hydro-morphology and hydrology can be
modified by intense human activities to deal with the effects of climate change. The most
common pressures (Table 5) for hydro-morphological alterations are non-natural flows,
damming, straightened planforms, reinforced banks and in-channel structures in the rivers, has
caused many rivers in Europe and the UK to be below good ecological status. (Bauwens et al.,
2013; Colas et al., 2017; Nováky and Bálint, 2013; Rinaldi et al., 2013; Shuker et al., 2015;
Villeneuve et al., 2018)
Table 5
Potential Drivers for Causing Pressures on Surface Water Morphology
Potential Driver Examples of Specific Pressure
Agriculture Water abstraction, river straightening, grazing
Urban development Building weirs, dams, building flood banks
Water supply and wastewater
Water abstraction/discharge
management
Power generation Changes to flows
Mining, quarrying and mineral
Water abstraction/contamination
extraction
Hydraulic fracturing Water abstraction/contamination
Flood defence Building flood walls, embankments
Coastal defence Building walls, redirecting flow
Navigation Straightening, widening deepening of channel, dredging
Recreation Building structure e.g. piers, jetties, boat slipwaysIn urban areas, the term Urban River Syndrome described by Walsh et al. (2005)
explains the ecological degradation of streams draining to urban land due to alteration of low
regimes. Symptoms of urban stream syndrome include changes in channel morphology,
increase of pollutants and nutrient, reduced biotic diversity and increase in tolerant species
(Elbrecht et al., 2016; Shuker et al., 2015). Flows and riverine ecosystems are affected by
regional developments and land use for water withdrawals. Increased point and nonpoint
source pollution from urban and rural areas is a problem for the alteration of hydro-
morphology. It is also possible to say that dry or wet deposition of pollutants has impacts on
alterations (Johnston et al., 2017).
It is identified that almost 75% of the UK rivers have regimes that cannot be considered
as natural due to hydrological alterations (Black et al., 2005). The UK Environment Agency
published in 2011 a report on the state of river habitats in England and Wales in which they
report that river channels have been extensively modified across England, Wales and the Isle
of Man. The report states that over many centuries, rivers have been straightened, widened,
deepened and dammed, mainly to improve farming or to reduce the risk of flooding. As a result,
river habitats have become impoverished and the biodiversity of wildlife they support has
declined. These impacts on ecological health are worsening in some areas as the demand for
water increases, directly affecting river systems by excessive withdrawing of water
(Environment Agency, 2018). These effects are particularly problematic during drought
conditions when there are reduced flows. In the UK many rivers are affected and influenced
water abstractions and discharges (Wade et al., 2015). These effects pose problems for meeting
WFD good ecological status in rivers.
Pressures of Hydro-morphological Changes on BQEs and PCQEs
Changes in hydro-morphology of water bodies due to pressures from human activities
or the effects of climate change, especially extremes described above places pressures
ecological systems (Friberg, 2014). While extreme events directly impact on quality elements
and on the ability of water bodies to reach good ecological status, any changes in the hydro-
morphological quality elements may affect the others quality elements (BQE and PCQE) in
negative ways. Not only do hydro-morphological alterations have direct impacts on fish,
macroinvertebrates, and macrophyte, they can cause changes in water temperature and reduce
the chemical status of water bodies (Reynard, 2010; Villeneuve et al., 2018).
Hydro-morphological degradation has different pressures on different organisms.
While macroinvertebrates, fishes, and macrophytes responded remarkably to degradation,
diatoms did not respond to the changes in the hydro-morphology (Hering et al., 2006).
Villeneuve et al. (2018) also found that nutrient and organic matter flows have been affected
by changes to hydro-morphology. When rivers experience lower flows especially during a
heatwave or low rainfall periods, they are highly sensitive to nutrient and pollution as the
dilution of chemicals is lowered. In addition to low dilution capacity, higher chemical arrivals
from the riparian zones and agricultural areal would also probably increase the challenges to
maintain good ecological and chemical status (Herrero et al., 2018; Outram et al., 2014). Also,
low river flows reduce the oxygen level in freshwaters and increase the concentration of
pollutants. Combined with higher temperatures and more sunlight, it is likely to cause increase
eutrophication and algal blooms, which can disrupt the ecosystem balance (Environment
Agency, 2018; Herrero et al., 2018; Reynard, 2010). In the future, it is expected that
anthropogenic influences will increase the challenges of eutrophication risk because of lower
flows and increased water abstraction. Particularly due to the impacts of global warming andless rainfall for the UK (Howden et al., 2009). Even at present, there are many species and
habitats under pressures because of low river flows. Lower flows can cause a decrease in the
richness of taxonomy because of losing habitat types. Additionally, sediments and reduction
of flow velocity have directly or indirectly had negative impacts on the habitat quality of many
communities such as invertebrates. When sediments and flow velocity are taken into account
together, the impacts of them would be stronger than individual impacts (Elbrecht et al., 2016).
It is found that river temperature is affected by river flow, river regulation, riparian
zone, river channel morphology and anthropogenic modifications (Environment Agency, 2007;
O’Briain et al., 2017; Orr et al., 2015; Piccolroaz et al., 2018). Also, any changes in air or
ground temperatures and hydrological changes have direct impacts on water temperatures
affected by the size of riparian vegetation that provides the shade for cooling the areas including
river and riparian ecosystems. It is known that density, viscosity, solubility, and chemical
reaction rates, called physical characteristics, are highly vulnerable to water temperature
changes. In lowland river areas, it is expected that the decrease in dissolved oxygen
concertation will be observed because of warmer temperatures and droughts. Therefore, it is
possible to say that overall, water temperature is highly linked to water quality. Studies show
that increase in air temperature caused warmer water bodies has resulted in the decrease of
dissolved oxygen concertation, and increase on biochemical oxygen demand and suspended
solids (Acreman et al., 2009; Bauwens et al., 2013; Cox and Whitehead, 2009; Kalny et al.,
2017; The Secretary of State, 2015). On the other hand, similar to impacts of water temperature
on PCQEs, invertebrates, and most communities and species in freshwater ecosystems may be
affected. Freshwater species’ growth rate, distribution, and reproduction are also changed by
temperature variations. Recently, the water temperature has reached the lateral levels for some
species in the northern part of England (Environment Agency, 2018; O’Briain et al., 2017).
Future Implications of the WFD
There is no doubt that the changes in the climate system will affect the planned
improvement of the quality and management of water bodies. All member states have a
responsibility under the WFD to have good status or higher in their water bodies in order to
protect and improve aquatic systems across Europe by 2027. In order to achieve all objectives
of the WFD, it is essential to integrate with other key policies such as urban planning, flooding,
climate and energy policies. For member states, including the UK. To attain a good status in
all water bodies, the most important factor is to have effective environmental management. As
extensions have been applied to members in the 1st six-year plan, it would be good to consider
any extensions where natural conditions such as unexpected extremes do not allow water
systems to improve in time (Carvalho, Mackay, Cristina, et al., 2019). Poor links between
stressors and impacts on the ecosystem have been one of the weaknesses of the WFD. In the
assessment scheme, there are lots of identification of the impacts of BQEs compared to other
quality elements. For the hydro-morphological pressures, in contrast, there is not enough
identification, with few exceptions. Also, as discussed in previous sections, there is a
possibility that across Europe, in the future we may need to live under conditions of more
intense and extreme weather events, and at best weather conditions that be equal to today’s
extreme conditions. The changes in weather patterns are of growing concern and may cause a
delay in the implication of WFD in the UK. One of the main reasons for failing to achieve
objectives of the WFD is the hydro-morphological degradation of water bodies which is a key
part towards the understanding of the impacts, changes and actions for the improvement of
quality elements (England and Gurnell, 2016; González del Tánago et al., 2016). Hydro-
morphological degradation and other pressures such as nutrient enrichment have the potentialYou can also read