Climate Model Berlin - Analysis Maps (2016 Edition)
←
→
Page content transcription
If your browser does not render page correctly, please read the page content below
04.10 Climate Model Berlin - Analysis
Maps (2016 Edition)
Overview
In order to justify the significance of the environmental field of urban climate as comprehensively as
possible, extensive model simulations were carried out for the first time in the year 2002/2003 with the
mesoscale climate model FITNAH 3D (see Methodology) (SenStadt 2003, SenStadt 2004). The
necessary input data and the analysis results were prepared in this first application in a spatial
resolution of 200 m x 200 m, in the update of 2008/2009 (SenStadt 2009) then with a resolution of 50
m x 50 m. According to the recording accuracy possible at that time, the results of the model-based
climate analysis primarily permitted assessments of the climatic situation and possible effects of
construction projects at the level of superior or sub-spatial planning of scale level 1:50,000 till 1:5,000.
On the other hand, for actual projects in the scope of the binding urban land-use planning with a scale
level of ≤1:5,000, the detailed assessments required there at the level of the individual building
structures could not be achieved till now.
Owing to the central importance of the geo-data of the environment atlas for the topic of urban climate,
therefore, it became absolutely necessary to provide information with a spatial higher resolution.
For this purpose, the EFRE project "GIS-supported modelling of parameters relevant for urban
climate in the basis of high resolution building and vegetation data" was carried out from 2013-
2015.
This project was financed by European Funds for Regional Development (EFRE) and the City
State of Berlin (project number: 027EFRE GDI) for measures for building up the geo-data
infrastructure (GDI) (SenStadtUm 2015).

In the scope of the project, the urban area of Berlin as well as the surrounding region with a total area
of around 1,800 km² was analysed and evaluated with respect to climate in a resolution of 10m x 10m.
The processing of an investigation area of this expansion with a screen width of only 100m²
represented a first country-wide at the time of study and required model attributes of FITNAH-3D
optimised          and          customised            mainly         to          these         requirements.
Figure 1 illustrates the multiplication of the detailing of the spatial resolution in the steps 200 m x 200
m to 10 m x 10 m (factor 400).

                                                     1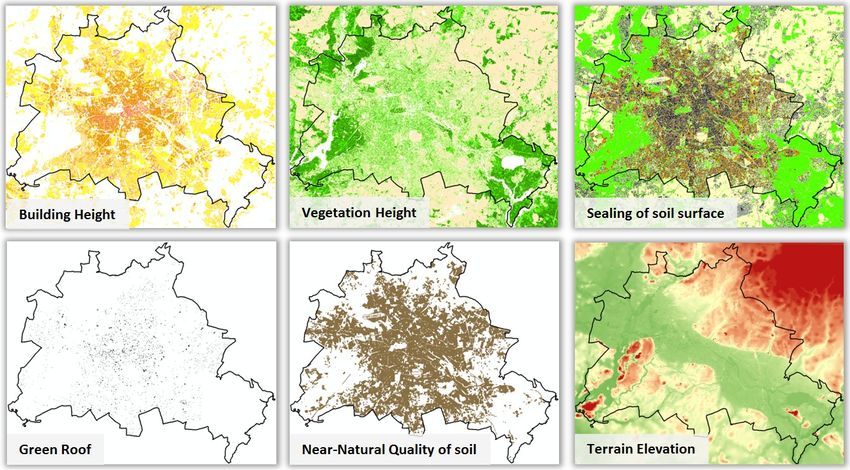
Fig. 1: Grid widths of the three modelling versions of the climate model Berlin between 2002-2003
(200 m edge length) and 2013-2015 (10 m).

Such an extensive refinement of the spatial resolution of the modelling also requires, at the same time,
correspondingly detailed data basis, which were available especially with high-resolution building and
vegetation data (SenStadtUm 2014, see Statistical Base).
The 10 m x 10 m screen resolution now available enables a usability of the analysis results also for
the evaluation and assessment processes at the level of the binding urban land use planning (land
use plan level) or of the corresponding projects.
A modern climatic analysis designed for practice must particularly encompass the process system of
air-exchange flows, and attempt to make a connection between these processes and the structuring of
the area under investigation into spaces which are favorable and unfavorable, respectively, in terms of
urban climate and air-quality. These two terms describe, from a climatic viewpoint, the structure of an
area into compensation spaces, affected spaces and connecting structures (air-stream channels), and
an understanding of such an area as a construct consisting of compensation and stress areas.
"A compensation space is thus an undeveloped space characterized by vegetation, which by
generating cool and fresh air, can reduce or eliminate air-quality or bio-climatic burdens in an affected
space via functional exchange interaction. An impact area is a space which is burdened, built-up or
planned for construction, and which is connected to an adjacent compensation space via air exchange
processes, or to a non-adjacent compensation space via an ventilation lane" (cf. Mosimann, Frey,
Trute and Wickenkamp 1999). This procedure thus breaks fundamentally with the previously common
static view based on urban climate zones, which subdivided the area of investigation into spatial units
in which the micro-climatically most important factors were relatively homogeneous and the effects
hardly differed (cf. VDI 1997).
The approach of model use selected here with combined evaluation of statistical base data of climate
stations operated for many years (SenStadtUm 2015a) has the following important benefits:
    •   The comparability of results in the overall area is ensured.
    •   In addition to the qualitative statements designed to characterize particular urban climatic
        phenomena, quantitative statements concerning climate-ecological conditions and exchange
        processes are also possible.
    •   Climate-ecological compensation and process spaces are localized in the urban area and
        represented in their spatial dimensions as precisely as possible.
    •   An important aspect of the climate-ecological compensation potential of open areas - the cold-
        air balance - has been investigated on a comprehensive city-wide basis for the first time in
        Berlin.
This investigation, too, supports the repeatedly confirmed connection between the climate of various
urban areas and their structure in terms of buildings, open areas and vegetation. However, the typical
local climate is not only generated by the structure of an urban area but also by its situation within the
city. Hence, different areas of a city can interact mutually, or with the surrounding countryside. The
temperature differences between neighboring areas are of decisive importance for the climatic
exchange. A reduction of these differences, e.g. due to an increase in the structural density, or the
uniformization of structures, will cause the urban climate to deteriorate. The objective of the present
updated maps 04.10.01 - 04.10.07 is to present the results of the current application of climate
modelling.
As compared to the last edition of 2009, the range of topics of the parameters shown was
extended, with respect to the evaluated parameters as well as also the spatial differentiation by
offering now the original screen resolution as well as the averaged block (partial) area values
as the basis for the planning advice map in the Geoportal (see Method, SenStadtUm 2016).
In order to achieve comparability with the climate parameters already published in the Digital
Environmental Atlas, the distribution of air temperature during two time segments is also presented,
although a direct comparison of the map representations based on measurements and analogical
conclusions with the results of simulations of model applications requires that the differing frameworks
be taken into account. This advice has also be considered when comparing the results of the both
FITNAH model applications of the 2003/2004 edition and 2009. As on the one hand scope and level
of detail of the input data, and, on the other hand, model enhancements may result in differing findings
and classifications.
Moreover, the representations of the spatial delimitation and quantification of the autochthonous air
exchange processes are of special significance. The term "autochthonous" describes climatic events
                                                  2
which occur locally or independently (that is without outside effects, e.g. extensive wind flows; the
opposite is "allochthonous"). They are based in the climatic effectiveness of the particular utilization
structures in their respective environments, and thus provide a sound basis for the derivation of
concrete planning recommendations.
Statistical Base
The application of numerical simulation models requires acquisition of basic data and of
meteorological ancillary conditions in a territory extending beyond the actual investigation area. This is
designed to assure that the model can "swing itself into place", so as to be able to simulate conditions
as realistically as possible at the margins of the actual project area (for the methodology of the
FITNAH climate model used here, (cf. Methodology / Supplementary Notes). Hence, the investigation
area consists of two major components: the approx. 890 km² area of the city of Berlin, and an approx.
900 km² area in the suburbs (cf. Fig. 2).
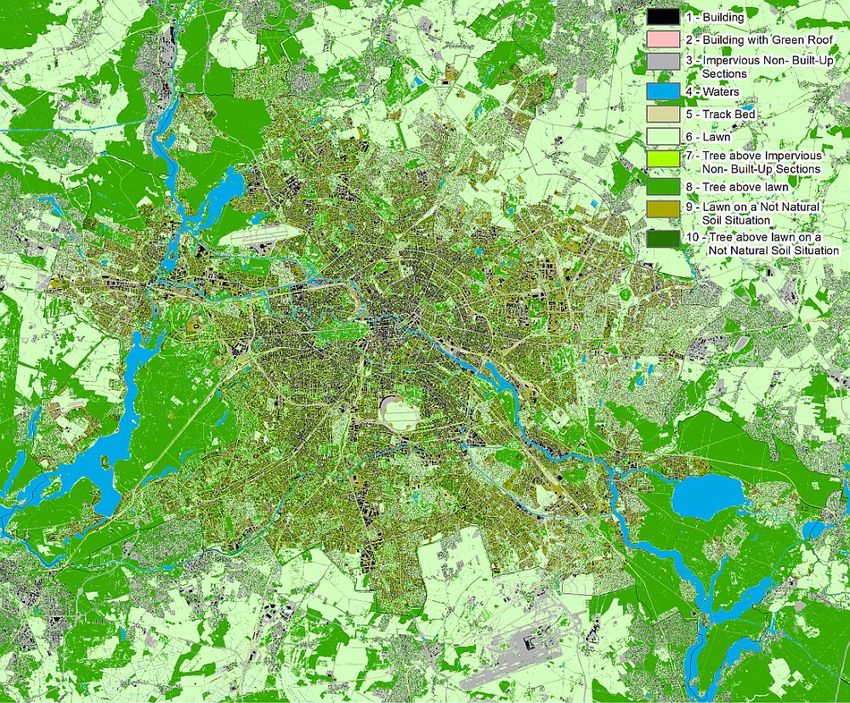
Fig. 2: Expansion of the investigation area (1,800 km²) and classification of the land use for model
application. A key with 10 usage classes is used, which is adjusted to the requirements of the model
FITNAH 3D.
The quality of the model results depends decisively on the degree of detail of the input data. Till now,
the block-based data of the Urban and Environmental Information System (ISU) were used primarily
for climatic model applications. The digital block map ISU5_UA 2010 in the scale 1:5,000 represents
the reference areas for the information related to block (partial areas), amongst others, for the real
area usage and for degree of sealing (SenStadt 2010, SenStadtUm 2012) and is hence a suitable
basis for meso-scale modelling in a resolution of 50 m x 50 m. However, this screen size of each
2,500m² also implies that small-scale input data, such as the building data of the automated land
register map (ALK) used for the currently present version of the model application (see Fig. 3,
SenStadtUm 2015b) cannot be linked adequately resolved. Consequently, for the screen resolution of
10 m x 10 m established in the limiting area between the micro-scale and the meso-scale, an
extended approach for including small-scale usage data became necessary.
3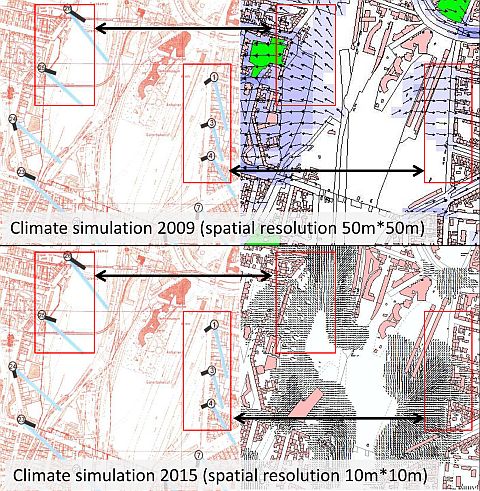
Fig. 3: Section of the automated land register map (specification of building floors in Roman numerals)
(SenStadtUm 2015b).

Corresponding preliminary work for equipping this project with land use and vegetation data having
very high degree of detail could be done with the elaboration of the map 06.10 "Building and
vegetation heights" (SenStadtUm 2014). Along with the actual object data: 'Area size', 'maximum,
minimum and mean height' as well as 'Use according to object type catalogue of ALK' and 'Greening
of the roof yes/no', the technical data entered for the individual buildings and vegetation objects also
enable links to the official building codes as well as to the block (partial) area codes of ISU5_UA 2010.
Over and above the stock of around 540,000 ALK building objects (as on 06/2014), from the
mentioned stock of building and vegetation height entries approx. 70,000 additional building objects
like scales, garages, leaves and other non-ALK objects could also be considered.
Owing to their degree of detail, this data represents the decisive basis for the present climate
modelling with a resolution of 10 m. The most important geo-basis data are summarised in Fig. 4.

Fig. 4: Geo-data basis for the application of the climate model FITNAH 3D

On the whole, the application of the climate model Berlin in its current version, is based on the
following components building upon one another:
     1. the evaluation of long-term operation of measurement stations in Berlin and Potsdam as the
        basis for calibrating the model results (SenStadtUm 2015a)
     2. extensive analysis steps for working out an established database, as well as

                                                   4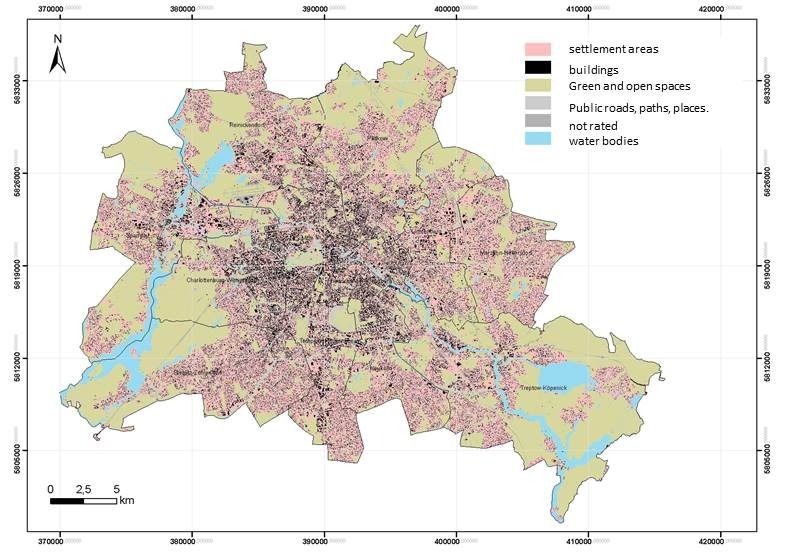
3. the preparation of three planning advice maps that supplement one another (SenStadtUm
         2016).
Following data bases were used for conducting the process steps 2 and 3:
    ●    GEO-NET Umweltconsulting GmbH, Hanover: GIS-based modelling of parameters relevant
         for urban climate based on high-resolution building and vegetation data; EFRE project 027
         Urban climate Berlin (SenStadtUm 2015),
    ●    Data of the Urban and Environmental Information System (ISU) of SenStadtUm, III D 1,
         version 31.12.2010:
            ▪   Block map 1: 5,000 (ISU5_UA),
            ▪   Land Use data (SenStadt 2010),
            ▪   Criteria for evaluating the soil functions, map of closeness to nature (SenStadtUm
                2013),
            ▪   Uncorrected degrees of sealing (grid data) - intermediate result of the rule-based
                classification (SenStadtUm 2012),
            ▪   Building and vegetation heights (SenStadtUm 2014),
    ●    Ground level (DGM5) (SenStadt 2010a),
    ●    Automated land register map Berlin (ALK), version 01.06.2014 (SenStadtUm 2015c),
    ●    Locations of the social infrastructure (Planning area related information system for
         monitoring and analysis (PRISMA) (SenStadtUm 2015c) as well as Regional Office for
         Health and Social Affairs (LAGeSo) (LAGeSo 2014),
    ●    Detailed map of the Berlin's network of roads, version 11/2014 (SenStadtUm 2014a),
    ●    State of Brandenburg:
            ▪   ALKIS database Building and actual use, version 10/2013 (LGB 2013),
            ▪   Ground levels (DGM25) (LGB 2013a),
Model calculations use grid-based representations of input variables. For providing the model input
data, therefore, the area geometry had to be transferred to 10 m x 10 m grid cells each with a uniform
usage structure. This was done in a multi-staged query cascade, which is shown in Fig. 5. In partial
areas, the described model input data were supplemented by usage information of the Urban and
Environmental Information System (ISU) or by the vector data of the block map 1:5,000 (ISU5_UA
2010). This mainly concerns the information about water bodies, for road space and track areas. While
high resolution building and vegetation data can also be used for the neighbourhood of Berlin, the
sealing information was present only for the urban area of Berlin. More information about the interface
structure could be taken from the ALKIS database of National Survey of Brandenburg.

                                                   5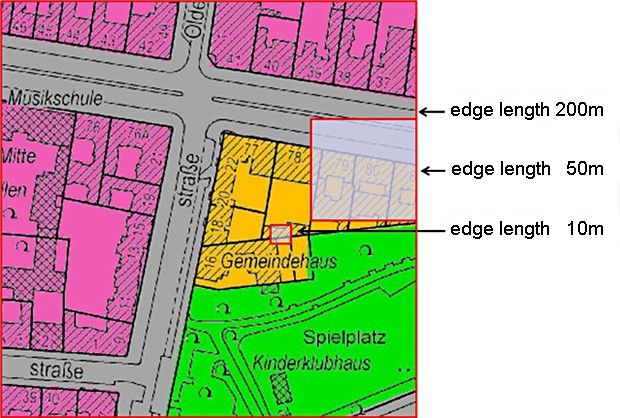
Fig. 5: Database and data flow for the application of the climate model FITNAH 3D

Methodology
One important factor in the creation and formation of an urban climate are the soil and surface
characteristics, which have been changed in the urban area in relation to the surrounding countryside.
The result is urban overheating and also the local urban wind circulation. Wind and temperature as

                                                  6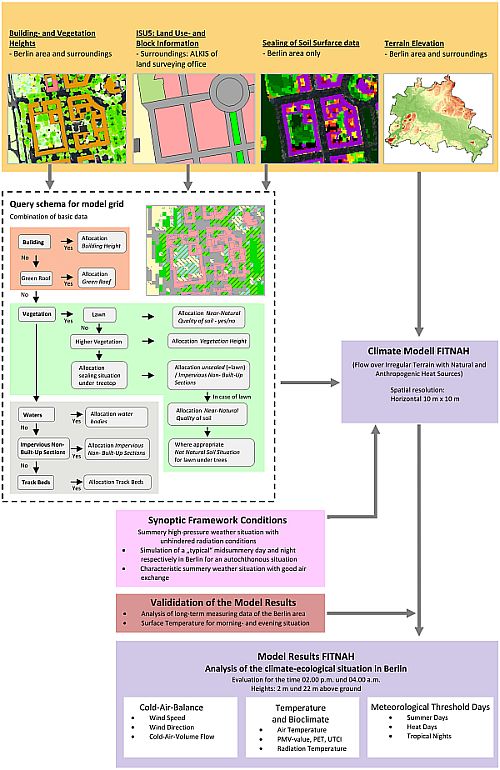
well as quanta derived from them are the dominant factors affecting the assessment of urban climate
from the aspects of human bio-meteorology and air quality.
The investigation and recording of the urban climate can be carried out with the help of various
methods. These include field measurements, long-range ascertainment methods, wind tunnel studies,
and the application of numerical simulation models.
Direct numerical simulation models are particularly well capable of representing the meteorological
quanta, which are spatially and temporally very strongly variable, due to the great complexity of the
building structure.
The detailed calculation of the wind and temperature conditions in the Berlin area within the scope of
this actualization has been carried out using the FITNAH (Flow over Irregular Terrain with Natural and
Anthropogenic Heat Sources) model. Groß 1993 and Richter & Röckle n.d. present detailed
mathematical and physical descriptions of the model. Further detailed indications for the basic
structure and approach of the three-dimensional FITNAH model, and for the interpretation of the
model results, can be seen herein, on the basis of an exemplary comparison with measurement data,
under Methodology/Supplementary Notes.
Generally, numerical simulation models are accepted for use in many fields of meteorology, since the
data obtained provide important basic information for many areas of life (cf. Overview of the Most
Important Models). The weather forecast for the next 1-5 days is obtained almost exclusively by
means of such complex and extensive computer models. Knowledge of possible changes of our global
climate over the next decades can also be derived from such calculations. And finally, models of a
similar type are used to calculate the local and the regional distributions of meteorological variables in
the atmosphere (Groß 2002).
Independent from the various scales and task definitions, all models are based on the same
mathematical-physical system of equations. Only in detail are there scale-specific differences.

Meteorological and synoptic general conditions for model calculation
Along with determinations internal to the model, the meteorological general conditions also play a
major role. Under the complete project, two model runs were conducted with the meso-scale climate
model FITNAH for a high-summer weather situation with a horizontal resolution of 10 m. The first
model run is based on an allochthonous west wind weather condition occurring relatively frequently in
Berlin during the summer months. The second model run is based on an autochthonous weather
condition without higher-level wind influence used regularly for an analysis of the urban climate.
Additional data, differentiated in space, were derived from the various climatological parameters from
the resulting meteorological fields. On the whole, therefore, three supplementing extensive data sets
are available.
During the high pressure weather conditions (autochthonous weather conditions) the local climatic
special features of a landscape can be expressed very well. Such a weather condition is characterised
by a cloudless sky and a very weak, overlaying synoptic wind. In case of the numeric simulations
carried out here, the large-scale synoptic general conditions were laid down accordingly:
    •   Cloud cover 0/8
    •   no overlaying geostrophic wind
    •   relative humidity of the air mass 50%
    •   19°C air temperature at 09:00 p.m.
The comparatively low wind speeds at a low-exchange weather condition cause a reduced exchange
of air in the air layer near the ground. A simultaneously high irradiation and emission can consequently
lead to local human bio-meteorological and air-hygienic polluted areas. Characteristic for this (high-
pressure) weather condition is the origin of independent cold air streams (corridor winds), which are
driven by the temperature gradient between the cool open spaces and the warmer settlement areas.

                                                    7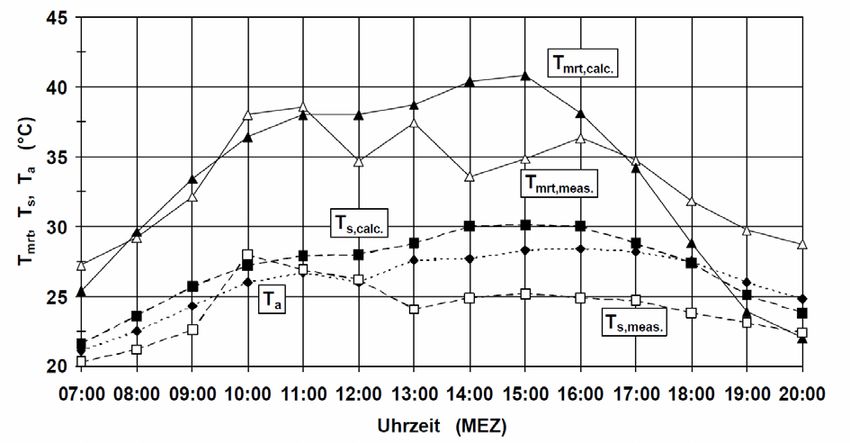
Fig. 6: Course of temperature and vertical profile of the wind speed at noon time for various land uses

Calculated parameters and characteristic values, final climate analysis
map
During the analysis phase of the project, a large number of meteorological parameters were calculated
at three points of time. Along with the day situation (02:00 p.m.), the evening as well as the early
morning were also simulated at time sections 10:00 p.m. and 04:00 a.m. The observed height levels
were at 2 m and 22 m above ground.
For the analysis part 04.10, grid maps and block-based maps are present, in which the individual
parameters as well as also the meteorological climatic parameters are shown as mean area values.
The summary Climate Analysis Map 04.10.7 builds the conclusion of the analysis as one of the main
results of the study (see Map Description).

Determination of climatic parameters in the Berlin area (04.10.6)
A "climatic parameter" implies a day, on which a defined threshold value of a meteorological
parameter is achieved or exceeded. In the context of the topic of urban climate, mainly the following
climatic parameters are relevant, because they are closely associated with the occurrence of bio-
climatic loads in settlement areas:
    ●   Summer Days (maximum temperature ≥ 25 °C)
    ●   Hot Days (maximum temperature ≥ 30°C)
    ●   Tropical Nights (minimum temperature ≥ 20 °C)
The long-term measurements of climatic parameters (SenStadtUm 2015a) show a characteristic
distribution of minimum and maximum temperatures on Summer Days for the various measurement
locations in the urban area. The distribution reflects the different heat behaviour of the city, which
results as a whole from the different usage structures as also from the position of a location within an
urban area. In case of an otherwise similar use, the spatial position within the city thus determines, to
what extent a location can benefit from the cooler surroundings or is present in the influence of over-
heated adjacent city areas. An open space under the influence of the urban heat island will show a
lower diurnal cycle than a similar area outside of the city. Since the absolute level of the summer
temperature is determined primarily by the prevalent weather condition and only a modification is done
by the situation of the location in the urban area, conclusions can be drawn from the measured
temperatures of a location about the level at another location on the basis of the characteristic
temperature differences.
The exceeding of defined values for the daily minimum / maximum determines the occurrence of the
so-called climatic parameters. Since the daily extremes and also the simultaneously measured
temperature differences at the stations show a characteristic distribution among one another, by
knowing the temperature difference it can be determined for a reference location, how high is the

                                                   8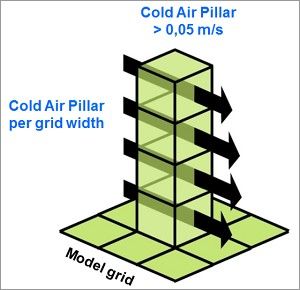
probability that the threshold values will be exceeded there. If the frequencies of climatic parameters
per year are known for a reference location, the frequencies at another location can be estimated.
Reference geometry for designating the climatic parameters is the block map 1:5,000 (ISU5_UA
2010), for which the grid-based temperature values of model simulation given therein were calculated
using statistical methods. In a further step, temperature differences were determined for the values
calculated for the DWD station Tempelhof (measurement period 2001 to 2010). Based on these
temperature differences and the functional relationship between the temperature differences and the
occurring frequencies of climatic parameters, these can be interpolated extensively to the urban area.

Climate Analysis Map (04.10.7)
The results obtained by applying the climate model FITNAH led to an extensive latest stocktaking of
the climatic situation in the urban area and in the nearby surroundings. According to the VDI guideline
3787, Sheet 1, the Climate Analysis Map represents "the spatial climatic attributes of a reference area,
which set in based on area usage and topography. The thermal, dynamic as well as air-hygienic
conditions are shown. Note: The Climate Analysis Map contains and replaces the earlier synthetic
climate function map." (VDI 2015).
This restructuring of thermal alignment and naming for preparing climate maps also follows the latest
display in environment atlas by replacing the earlier climate function map 04.11.1 as part of evaluation
map (SenStadt 2009) by the current Climate Analysis Map as completion of the analytical map part.
The aim of the map is to demarcate the areas of the city according to their different climatic functions
i.e. their effect on other areas. Starting point is the classification of the study area in settlements with
bio-climatic and/or air-hygienic loads (effective area) on one hand, and on the other, in cold-air
producing, undeveloped and areas with pronounced vegetation (compensation areas) If these areas
do not directly touch one another and the air-exchange processes are strong enough, linearly aligned,
low developed open spaces (air channels) can connect both of them. The mutual demarcation of
favourable and unfavourable areas as well as of the connecting structures results in a complex picture
of process system of air-exchange streams of the compensation area-effective area structure.
The climatic function areas to be demarcated should provide information about the areas, in which
    ●   on one hand there is a potential for relief of other (adjacent and remote) areas,
    ●   on the other hand, the strongest additional loads are expected over and above the large-scale
        influence,
    ●   preferably air-exchange areas are to be assumed i.e. an important role is assumed for the
        ground-level transport of fresh air.
The individual legend units are explained below.
The cold air producing areas are the open areas with pronounced vegetation, such as forests, parks
and small garden areas, which are shown as 'green areas' according to their use. For characterising
their compensation effect, the Cold Air Volume Flow is included in the Climate Analysis Map. It
expresses the inflow of cold are from the adjacent grid cells in m³/s per 10 m grid cell (map 04.10.1).
The green area portions, which show a climate-ecological effective Cold Air Volume Flow of more
than 90 m³/s, are highlighted with a shading. This makes it clear, which portions of a green area are to
be considered as especially climatically relevant.
The ranges of the positive effects were termed as operation area of cold air origin areas in the
Climate Analysis Map. These are to be considered as continuation of the Cold Air Volume Flow
emanating in the settlement areas from the green and open areas. Frequently, a good aeration is
present here as well as a trend towards a lower heat island effect.
A (positive) development relevant to climate shows an overall sealing degree of average less than
30 %. Because of their climatically favourable features, these areas show a more or less strong origin
of cold air and favour the effect of nightly cold air in the direction of remote settlement areas.
The depiction of the heat island effect in the settlement areas and in the road space illustrates the
thermal situation in the urban area during the night hours. The basis for this is the respective average
night air temperature per area at 04:00 a.m., whereby the value determined over all areas is 17.8 °C.
The demarcation of the evaluation classes is based on the method described for Z-transformation in
VDI guideline 3785 Sheet 1 (VDI 2008), which is based on the local/regional value level of an analysis
and evaluates the deviation of a parameter from the mean conditions in an investigation area. Unlike
as in the planning advice map, the spatial characteristic of the nightly heat island effect is present in
the foreground so that here the block area are shown differentiated with an exceeding of the area

                                                     9
mean value (Z-value < 0). In the planning advice map, the settlement areas are evaluated as bio-
climatically favourable with a Z-value of ≤ 0.
Tab. 1: Evaluation of the nightly heat island effect in settlement areas and in road space
during the summer sunny weather conditions
Mean Z-value of air
Range of mean air temperature
temperature at 04:00 a.m. per Evaluation
at 04:00 per category
area
≤0 14.5 °C to 17.8 °C Not available
> 0 to ≤ 1 > 17.8 °C to 18.7 °C Weak
> 1 to ≤ 2 > 18.7 to < 19.5 °C Moderate
>2 ≥ 19.5 °C to < 21.3 °C Strong
Tab. 1: Evaluation of the nightly heat island effect in settlement areas and in road space during
the summer sunny weather conditions
This corresponds to a temperature value of less than 17.8 °C, at which there is no nightly over-
heating. This is contrasted by the settlement / road areas with a mean value of more than 19.5 °C,
which are classified as strong heat island effect. This is the same as an over-heating of more than 1.7
Kelvin (K).
The connections of different causes and characteristics in the form of lines and areas serve the air
exchange at the ground level. Pathways connect cold air origin areas (compensation areas) and load
areas (effective areas) with one another and hence are an elementary part of the air exchange. Four
different air exchange types were worked out in the maps under consideration of the process:
● Cold air pathway, mainly induced thermally,
● Cold air pathway, mainly induced orographically (e.g. smaller river plains),
● Area-wise cold air outflow to slope ranges (in case of slope inclination >1°),
● Extensive air and ventilation pathways (lowlands of larger flowing water bodies).
The identification of cold air pathways is oriented to the autochthonous flow field of the FITNAH
simulation. The indicated pathways, except the river lowlands, are areas with pronounced vegetation
with a linear alignment to the effective areas.
In order to identify the area with slope inclinations >1°, on which an extensive outflow of cold air
takes place, a relief analysis was carried out with the ground elevation model used in FITNAH.
For displaying the traffic-dependent air load, the data of the environment atlas map 03.11.2 "Traffic-
dependent air load" was taken for information (SenStadtUm 2011). In the map, both the central traffic-
dependent air pollutants of fine dust (PM10) and nitrogen oxide (NO2) have been joined together to
make an emission index.
The signature wind field changes denotes settlement areas having a potential for higher gustiness
and sudden change of wind direction. These are the area types of core areas and large settlements,
whose development can lead to corresponding effects on the wind field.
Moreover, the noise control structures are also shown in the Climate Analysis Maps, which were
taken from noise mapping only for information (SenStadtUm 2013a). Their relevance for the climatic
functions results from the fact that these are the structures, which sometimes can have a height of
several metres. This results in a potential effect on nightly cold air flows. The knowledge of their
position represents an important additional information in evaluating the air exchange processes,
since the noise protection walls cannot be considered explicitly in the model.
Verification of the results of the climate model FITNAH
The information derived from the model runs was checked by means of data from a study of local
climatic functions of open spaces in the Gleisdreieck area of Schöneberg.
On the basis of an extensive comparison, the measurement results of the study were compared with
the simulation results of the model application.
As a result of this comparison, a good level of agreement can be established between the results of
the measurement project and the modeling of the local air-current field in the Gleisdreieck area using
FITNAH.
10The self-generated, local current phenomena postulated by the model calculations can largely be
confirmed by the measurements. Details on flow direction and speed are within the same range. The
relevant air exchange processes – small-scale, orographically caused cold-air outflow from the
Viktoriapark area of Kreuzberg and thermally induced compensation currents between the open areas
of the Gleisdreieck and the adjacent buildings – are recorded and represented equally, both
qualitatively and quantitatively (cf. Vogt 2002a, pp. 26 et seqq.). However, a more regionally
characterized compensation flow between central Berlin and the surrounding countryside cannot be
confirmed by either of the two methodological approaches (cf. Methodology / Supplementary Notes).
Approach, data basis and method of the process used for updating the climate data take into
account a largest possible, simultaneously extensive detailing of the resulting statements.
However, owing to the dynamic development in the city, the initial prerequisites for the
evaluation on individual areas change faster than the possible update cycle of the maps in the
environment atlas. Therefore, it is recommended to use the overlay function with the
respectively latest air patterns in the geo-portal for an area check as well as for a comparison
with the technical data of the analysis maps. From this, one can drawn inferences for the
usability of the results.
Methodology / Supplementary Notes
In the following, extensive additional information on the topical complex of the methodological
processing of the Berlin climate model is provided. The text thus complements the contents of the
chapter Methodology.
The concept and methodology of the FITNAH climate model
The basic structure of the three-dimensional FITNAH model consists of the conservation
equations for impulse, mass and internal energy, as well as balance equations for moist components
and additive elements to the air. The various turbulent currents are connected to the calculable mean
quanta with the aid of empirical inclusions. The turbulent diffusion coefficient appearing in that context
is calculated from the turbulent kinetic energy, for which an additional equation is solved.
The warming and cooling rates in the atmosphere due to the divergence of the long-wave radiant
fluxes are calculated by means of a procedure in which the emissivity of the water vapor in the air is
taken into account.
For detailed simulations in real terrain, the orography, and particularly the effect of wooded areas
and urban structures on the distribution of the meteorological quanta must also be taken into
account in a realistic manner. For this purpose, FITNAH is provided with special parameterization.
A forest or grove will be incorporated into the model via stock-specific quanta, such as tree height,
stock density and tree species. This permits, among other things, the simulation of the reduction of the
mean speed in the stock, the rise of the turbulence in the crown area and the strong nightly cooling in
the upper crown third, in agreement with available observations.
With consideration for the city-specific quanta building height, sealing and degree of construction
coverage, and anthropogenic waste heat, the typical formation of an urban heat island at a reduced
mean air current can be simulated (cf. Groß 1989).
The entire system of equations, including the parameterization, is transformed into a coordinate
system which corresponds to the terrain. That permits, in particular, the formulation of the ancillary
conditions of the various meteorological quanta in a problem-specific manner, specifically at the lower
edge, the ground. The calculation of the earth surface temperature is carried out via an energy-flux
balance, in which perceptible and latent heat current, the soil heat flow, short and long-wave radiation
components, and anthropogenic heat flow are considered.
The differential equation of the equation system used is transferred to finite-difference equations and
solved on a numerical grid. The spatial grid size Δx used here is 10 m in the two horizontal
dimensions. The vertical grid interval is not equidistant, and the calculation areas are particularly
dense in the near-ground atmosphere, in order to incorporate the strong variation of meteorological
quanta realistically. The lowest calculation areas up to a height of 22m are 2m, beyond that 4m. The
interval Δz becomes ever greater as the height increases, and the top limit of the model is located at a
height of 3,000 m above ground. This is the altitude at which it is assumed that the disturbances
caused by orography and land use at ground level (cf. Fig. 7) will have faded away.
11Fig. 7: Example for depicting a natural landscape in the model area character (from: Richter & Röckle
n.d.)
Verification of the results of the climate model FITNAH
For checking the information levels derived from the model runs, one can fall back on the evaluation of
long-term operated measurement stations in Berlin and Potsdam conducted in the scope of the EFRE
project (SenStadtUm 2015a). These station data also helped in deriving maps for distribution of the
mean number of meteorological climatic factors 2001-2010 (Map 04.10.6).
To check the informational levels derived from the model runs, a study of local climatic functions in the
open spaces of the Gleisdreieck area can be used. The orienting investigation on current and
temperature fields in the Gleisdreieck area is methodologically composed of:
• stationary measurement, summer semester 2001 (four measurement operations); and
• mobile measurements, winter semester 2001-2002 (four measurement operations).
The meteorological framework conditions seemed suitable to permit self-generated current systems to
develop in the area of the Gleisdreieck (cf. Vogt 2002a and Vogt 2002b).
The following working hypotheses were to be checked by the measurement operations:
1. There is an autochthonous, regional current which transports cold air over the low-friction
structures of the track area (i.e., an air-stream channel) from the Teltow area into the center of
Berlin;
2. The Gleisdreieck area, which is characterized by open spaces, provides cold air to the
immediately adjacent built-up neighbourhoods;
3. There is a cold-air outflow from the area of Viktoria Park in Kreuzberg, which intrudes into the
open spaces of the Gleisdreieck area.
These assumptions agree with the hypotheses on the formation of autochthonous current systems
between differently structured urban areas in this investigation, and therefore should be ascertainable
again in the model results of the FITNAH simulations as well. The measurement data on the current
field can therefore be used to check the plausibility of the model results herein.
However, a restricted applicability of this comparison must be assumed:
• The meteorological framework conditions for measurement were not in every case ideal for
the clear development of self-generated current systems.
• A mobile and stationary measurement can always have only a random-sample character
(spatially and temporally).
• The mobile measurements carried out during the winter semester were conducted during
periods of extreme sub-freezing temperatures.
• "Virtually stationary" short-term measurements are involved, since at each of the 37
measurement points in sequence, the wind field parameters were ascertained for approx. 4
minutes. The measurement procedures for the recording of the wind field for this area
probably lasted about 4 to 5 hours. Thus, what is represented is not a wind field for a defined
period of time.
12• In the model runs which were used for the comparison, ideal framework conditions for the
formation of self-generated flow systems were assumed, i.e. the top current has a speed of
0 m/s.
Check of the working hypotheses on the autochthonous wind field
In this comparison, the results achieved within the early night time hours at 2.5 m above ground are to
be considered as a matter of priority. Thus, far-reaching comparability of the model vs. the
measurement results is ensured in this regard. The comparison is carried out on the basis of an
established working hypothesis on flow conditions in the area under investigation:
• There is an autochthonous, regional current which transports cold air over the low-
friction structures of the track area (i.e. a ventilation lane) from the Teltow area into the
center of Berlin.
Neither in the measurement procedure nor in the model calculations can any regional current
be ascertained which uses the low-friction open spaces of the railway facilities as an air-
stream channel.
Any such current system would have had to be demonstrated in the measurements at the
Monumentenbrücke measurement point (cf. Vogt 2002a, p. 14). However, all that could be
ascertained from the measurement operations was the intervention of the top current into the
relatively low-friction, vegetal areas of the Gleisdreieck. Even the mobile, winter measurement
ascertained no such current (cf. Vogt 2002b, pp. 78 et seqq.).
The model result, too, would not support any extensive exchange flow. The flow field (10 PM)
shows a locally determined mosaic of small-scale air exchange cells, which are for the most
part thermally induced. As a rule, the spatial extent of these "flow cells" is between 500 m and
1,200 m (cf. Fig. 5).
• The Gleisdreieck area, which is characterized by open spaces, provides cold air to the
immediately adjacent built-up neighborhoods.
The measurement provided clear indications of the existence of these local equalization
currents (cf. Vogt 2002a, p. 15). However, the less-than-optimal meteorological framework
conditions during many of the measurement procedures and the temporal delay at mobile
measurements prevented a comprehensive illustration of these current systems.
On the other hand, the model results generated by FITNAH provide a comprehensive picture
of the spatial character of these local, primarily thermally induced current systems. In addition
to the item-related statements of the measurements, the model results permit statements
concerning the range (i.e., penetration depth) of the flows into the adjacent built-up areas. The
area between the Lützowstraße and Kurfürstenstraße test points on the western edge of the
Gleisdreieck area can be taken as an example. The cold air formed locally here penetrates
approx. 500 m into the built-up area.
The flow speeds measured or modeled achieve very similar orders of magnitude. As a rule,
these thermally induced current systems are accompanied by wind speeds of from 0.1 to 0.5
m/s. The measurement projects indicate that these value were achieved both in the summer
and the winter semesters (cf. Vogt 2002a, pp. 19 and 22). There is also a cold air flow at the
Möckernstraße, whereas the penetration range amounts up to 150 m (cf. Fig. 8).
• There is a cold-air outflow from the area of Victoria Park in Kreuzberg.
The measurement results on local cold-air outflow from the area of Viktoria Park in Kreuzberg
confirm these FITNAH simulation calculations (cf. Vogt 2002a, p. 17). The measurements
confirmed the canalization of the cold-air outflow through the Kreuzbergstraße and
Großbeerenstraße. This flow was accompanied by low wind speeds of 0.7 to 0.2 m/s.
13Fig. 8: Verification of the results of the climate model FITNAH 3D, application 2009 and 2015 (always
right part of the figure) with the help of stationary and mobile measurements in the area of triangular
junction (figure on the left, from Vogt 2002a and Vogt 2002b). In the figure on the left, the lines
originating from the measurement points point to the direction, from which the wind comes; in the
figure on the right, the wind arrows show the direction of flow
Result
Overall, there is good agreement between the results of the measurement procedure and the
modeling of the local current field in the Gleisdreieck area using FITNAH.
The self-generated, local current phenomena postulated by the model calculations can largely be
confirmed by the measurements. Data on flow direction and speed are within the same ranges. The
relevant air exchange processes - small-scale, orographically-determined cold-air outflows from the
Viktoriapark in Kreuzberg and thermally induced compensation currents between the open spaces of
the Gleisdreieck and the adjacent built-up neighborhoods - have been ascertained and represented
equally, both qualitatively and quantitatively (cf. Vogt 2002a, pp. 26 et seqq.). However, it was not
possible, by either of the two methodical approaches, to support any regionally-characterized
compensation current between central Berlin and the surrounding countryside.
Map Description
Given below is a joint description for all the individual evaluations of model calculations. Links are
given to the individual focus areas for a faster orientation in the text:
14● 04.10.1 Near Ground Wind Field and Cold Air Volume Flow (10:00 p.m. and 04:00 a.m.)
● 04.10.2 Air Temperature (02:00 p.m. and 04:00 a.m.)
● 04.10.3 Radiation Temperature (02:00 p.m. and 04:00 a.m.)
● 04.10.4 Nocturnal Cooling Rate between 10:00 p.m. and 04:00 a.m.
● 04.10.5 Evaluation Index of Physiological Equivalent Temperature (PET)
● 04.10.6 Number of meteorological climatic factors in the middle of the years 2001-2010
● Number of Summer Days
● Number of Hot Days
● Number of Tropical Nights
● 04.10.7 Climate Analysis Map
Within the mentioned topics, the different spatial structures (grid, block) as well as the different points
of time and height sections are mapped separately as further differentiations in the maps. These
different pieces of information can be selected for each topic via the level switching of the Geoportal
( ).
The model calculations were started in the evening at the time of the sunset and carried out till sunrise
of the day after the next. The time sections, in which the model results are to be selected, can be
selected freely in principle (minutes till seconds). The individual climatic parameters for the various
points of time (MEZ) are evaluated and shown in the form of maps, which permit inferences about
the climatic functions and their significance.
The date 10:00 p.m. represents the reversal from irradiation to emission situation shortly after the
sunset and stands for the start of a phase with a high cooling dynamics in the differently structured
partial areas in the city. The date 04:00 a.m. stands for the maximum cooling within the body of the
city in a high summer clear night. Both the points of time are thus relevant mainly for characterising
the nightly air-exchange. The time section 02:00 p.m. is also suitable for evaluating the bio-climatic
situation during the day, because at this point of time the solar irradiation and consequently also the
air temperatures are strongly pronounced. The time of 02:00 p.m. as evaluation time was also
necessary for the evaluation of the bio-climatic stresses during the day newly included in the current
version of the planning advice map (SenStadtUm 2016).
The analysis maps 04.10.1 to 04.10.5 are present in grid-based as well as block-based form. In doing
so, the statistical, not weighted mean value of all grid cells overlapping the block / partial block areas
is shown. The meteorological climatic factors (Maps 04.10.6) as well as the Climate Analysis Map
(Map 04.10.7), on the other hand, are present only in the form of a block, since these were not
modelled directly, but instead were derived from the grid-based results of climate modelling.
Given below is a brief description of individual, exemplary results of model calculations for the
complete city area.
In chapter Map Description / Supplementary Notes, a differentiated explanation is provided for an
exemplary area in the district of Charlottenburg-Wilmersdorf
Map 04.10.1 Near Ground Wind Field and Cold Air Volume Flow
(10:00 p.m. and 04:00 a.m.)
General comments
The good aeration of the settlement areas can lead to a reduction of human bio-meteorological loads
(see Moriske and Turowski 2002). Thus, in the night hours, the bringing up of cooler air from the
surrounding areas can lower the temperature level of the warmer air masses present in the city, which
leads to a reduction of heat load on the people in the summer months. If this introduced cooler air is
free of air pollutants (fresh air), the aeration then simultaneously also leads to an improvement of the
air-hygiene situation.
For evaluating the aeration situation, consequently, it is necessary to have the suitable assignment of
load areas and compensation areas, which provide the correspondingly unloaded air as well as a
circulation system, which can bring about the transportation of air masses.
The ground level temperature distribution causes horizontal air pressure differences, which, in turn,
are triggers for the local, thermal wind systems. Starting point of these processes are the night
temperature differences, which become set between the settlement areas and the open spaces with
pronounced vegetation. At the prone areas, the cooled and hence heavy air comes in motion in the
15direction of the deepest point of the terrain. This gives rise to cold air outflows at the slopes (incl.
MOSIMANN et al. 1999). The wind speed of this small-scale phenomenon is determined primarily
through the temperature deficit to the surrounding air and through the inclination of the terrain.
Along with the orographically caused flows with cold air outflow, the so-called floor/structure winds i.e.
a direct compensation flow from high to low air pressure are also formed. They arise, when strongly
overbuilt or sealed areas get heated more strongly than the surrounding open spaces and, as a result,
a thermal trough arises over the urban areas. Consequently, the resulting pressure gradient can be
compensated through inflowing cooler air masses from the surrounding regions (Kiese et al. 1992).
For characterising these flows, it is important that the air can be accelerated over a certain stretch and
is not hindered by the available obstacles, such as the built-up area. The floor/structure winds are
closely restricted, often only weakly pronounced flow phenomena, which can be overlaid by a weak
overlaying wind. Their speed lies mostly below 0.2 m/s (Mosimann et al. 1999).
The temperature differences typical for land use start building shortly after sunset and can last for the
whole night. In doing so, grasslands and arable regions especially prove to be productive of cold air.
Depending upon the surface features and cooling rates, the rapid development of cold air streams is
associated with this, which at first are very weak vertically (5-10 m layer height) and form between the
multitude of areas with different temperatures.
Map contents
Climate-ecological compensatory effects potentially originate from all unbuilt and unsealed areas,
inside as well as outside of the city area. To what extent can this potential unfold, depends on the
respective boundary conditions, from the size of the area, the vegetation structure, the position in the
city area as well as on the surroundings characterised by construction. The large number of open
spaces within the city, as compared to the other metropolises, is extremely significant for a city like
Berlin not classified topographically to a large extent, because here the city-climatic compensation for
the core area of the city takes place primarily through circulations caused thermally, which calls for a
highest possible nearness of green and built areas to each other (see Map 04.11.1 Planning Advices
Urban Climate 2015, Fig. 8).
The representation of the near-ground temperature field involves the grid instrument of temperature at
the near-ground layer of the atmosphere (0-5 m above ground). If several land uses with different area
shares are present within a grid cell, the temperature shown is calculated from the proportional
weighting. Thus, the simulated temperature values are comparable only for larger areas with a uniform
or comparable land use with ground-bound measurements.
Decisive for the temperature distribution are the land-use dependent soil and surface characteristics,
as well as their interactions with the atmospheric processes in the near-ground boundary layer. Within
the soil, heat and temperature conductivity are of importance in this regard. The greater the heat
conductivity of the soil, for example, the faster and more deeply heat can penetrate into the
corresponding material - but also: the faster it can escape again.
The surface composition of natural and artificial areas determines, via the albedo (reflection capacity)
and the emissivity, the quantity of energy available in the short and long-wave ranges of radiation for
warming/cooling. Finally, the turbulence condition of the near-ground atmosphere plays a major role in
the transportation of perceptible and latent energy to and from the ground. All processes mentioned
are interconnected via the energy balance of the soil, and determine the temperature of the surfaces
and the layers of air above them.
The grid-map levels represent ground level pronounced cold air flow field at a height of 2 m at the
night evaluation times of 10:00 p.m. and 04:00 a.m. in 10 m x 10 m resolution as well as at roof level
at a height of 22 m above ground. The wind field in the form of direction of flow and flow speed is
mapped via the arrow direction and arrow length in the form of vectors for all cells of the model grid
with a minimum speed of ≥ 0.05m/s relevant for the climate. These grid-based data are supplemented
by the display of the Cold Air Volume Flow as area value in m³/s. The term of Cold Air Volume Flow
implies the product of flow speed of cold air, its vertical (layer height) and horizontal expansion of the
flowed cross-section (flow width). It thus describes the quantity of cold air in the unit m³, which flows
every second through – in this case - a 10 m x 10 m grid cell (see Fig. 9).
16Fig. 9: Schematic diagram of cold air volume flow (Source: GEO-NET 2013)
The Volume Flow is thus a measure of the inflow of cold air and determines the magnitude of the
aeration potential. Since it is a parameter integrated over height, there is no display for the roof level.
All cells of the 10 m x 10 m grid are mapped with a value of > 60m³/s, for which a potential climate-
ecological effectiveness is determined. The qualitative evaluation of this meteorological parameter is
shown in Tab. 2. The classification of the grid-based Cold Air Volume Flow is oriented to the method
for Z-transformation described in the VDI guideline 3785 Sheet 1 (VDI 2008). This method is based on
the local/regional value level in a period of study and evaluates the deviation of a parameter from the
mean conditions in this area. This method results in four evaluation categories of grading very
favourable / favourable / less favourable / unfavourable.
Tab. 2: Classification of the grid-based cold air volume flow
Volume flow in
Mean Z-value per grid cell Evaluation
m³/s
< -0.5 Low 60 - 90
1 to 0 High 90 - 1 (upper S1 limit) Very high > 145
Tab. 2: Classification of the grid-based cold air volume flow
The penetration depth of cold air in settlement areas and hence also the measure of bio-climatic
favourable effect during the high pressure weather conditions in summer depends on the development
structure and the intensity of cold air dynamics. In line with the increasing building height and density,
single and town house complexes are flown through better than a block and perimeter development.
At the analysis time of 10:00 p.m., shortly after the sunset, the evening cooling phase starts, whose
intensity depends on the respective structures and hence also influences the cold air flow field that is
building up. In the context of inner-city green and open spaces, these are mostly rather a small-scale
pronounced air exchange processes, in which the Cold Air Volume Flow hardly exceeds 90 m³/s.
Depending upon a cold-air producing area and the surroundings, the cold air acts between 50 m and
300 m in the development. This makes it clear that mainly an adequate number and favourable
position of these relief areas is significant for reducing the stresses inside the city.
High or very high volume flows in this section of time are observed only in the outlying areas and are
mostly related to the local cold air outflows. These are encountered on the eastern bank of the river
Havel along the Grunewald or to the south of the Great Müggelsee in the city forest of Bürgerheide.
At the time of 04:00 a.m., the cooling of the green and open spaces and hence also the production of
cold air is much advanced. The span of the penetration depth varies perceptibly and lies, depending
upon the structural conditions, between 100 m and more than 1000 m. In areas of settlement types
with lot of greenery, their 'independent' production of cold air is also added, which is then reflected in
the favourable bio-climatic conditions there (SenStadtUm 2016). Parts of the inner-city block and
17perimeter development as well as of the district centres, on the other hand, are not flown through by
cold air in the second half of the night too, because their high building density and hence the higher
temperature level weaken the possible cold air flows, as long as they are present in the potential
activity range of compensation areas at all.
Map 04.10.2 Air Temperature (02:00 p.m. and 04:00 a.m.)
General comments
Decisive for the temperature distribution are the land-use dependent soil and surface characteristics,
as well as their interactions with the atmospheric processes in the near-ground boundary layer. Within
the soil, heat and temperature conductivity are of importance in this regard. The greater the heat
conductivity of the soil, for example, the faster and more deeply heat can penetrate into the
corresponding material - but also: the faster it can escape again.
The surface composition of natural and artificial areas determines, via the albedo (reflection capacity)
and the emissivity, the quantity of energy available in the short and long-wave ranges of radiation for
warming/cooling. Finally, the turbulence condition of the near-ground atmosphere plays a major role in
the transportation of perceptible and latent energy to and from the ground (Map 04.06 Surface
Temperatures Day and Night, Edition 2001).
All processes mentioned are interconnected via the energy balance of the soil, and determine the
temperature of the surfaces and the layers of air above them.
Map contents
The temperature conditions of the ground level atmosphere are similarly mapped based on grid and
block at different times of the day as levels of the main map.
In general, although the night temperature distributions are more expressive for evaluating the climatic
potentials of relief and loading of areas, they also show the characteristic differences in the noon
hours (02:00 p.m.) according to area distribution.
Sealed areas as well as open spaces with lawns are heated strongly during the day, the reason for
which is the intensive solar irradiation, the lack of shading as well as the strong heating of the ground
level air layer. The temperatures that occur here can lie between 30 °C and 32 °C, which represent the
highest values in the scope of the modelled summer situation.
The forest areas as well as larger inner-city green areas, like the Great Zoo show at this time about
3K lower temperatures in their parts having trees.
Areas with pronounced construction are although higher in their overall temperature level, but here
a differencing of the temperature behaviour reflecting the respective small-scale situation can be seen
here in the grid display. This is an event of further detailing of data basis and model grid associated
with this version of climate modelling. This now makes it possible, for instance, to differentiate grid
cells with trees or grass from the sealed areas in their temperature behaviour and to evaluate them
accordingly. The block-related aggregations smoothens the differences built by the not weighted mean
value formation.
The lowest values are encountered over water surfaces owing to their specific heat capacity, they
behave very homogeneously and act for compensating the climate during the day.
Depending upon the individual surface attributes of the different land uses, the earth surface cools
during the night in different intensities, the temperature distribution at 04:00 a.m. in the morning
reflects the time of the strongest cooling.
While this cooling is very low for bodies of water, due to their good heat-accumulating qualities, open
areas like fields and meadows show a strong drop in temperature. In wooded areas, the crowns of
the trees protects the near-ground atmosphere below from cooling off strongly; therefore, forests stand
out in the temperature distribution as relatively warm areas.
In the urban areas, cooling is reduced considerably by the presence of heat-storing materials like
concrete and stone. For one thing, the quantity of heat stored during the day causes the temperature
not to decline so strongly. Moreover, the low wind speeds of turbulent and latent heat currents, which
might otherwise remove warm air, are reduced. The urban areas thus continue to remain warmer on
the whole. The temperature differences at the unbuilt city limits or the surroundings can be more than
8K in the early morning hours. These high horizontal differences are not quite achieved in the
neighbourhood to the inner-city open spaces, sometimes, there is also a negative effect on the green
areas from the built areas.
18You can also read