Centromeric cohesion failure invokes a conserved choreography of chromosomal mis-segregations in pancreatic neuroendocrine tumor - Genome Medicine
←
→
Page content transcription
If your browser does not render page correctly, please read the page content below
Quevedo et al. Genome Medicine       (2020) 12:38
https://doi.org/10.1186/s13073-020-00730-9

 RESEARCH                                                                                                                                           Open Access

Centromeric cohesion failure invokes a
conserved choreography of chromosomal
mis-segregations in pancreatic
neuroendocrine tumor
Rene Quevedo1,2†, Anna Spreafico1,3†, Jeff Bruce1, Arnavaz Danesh1, Samah El Ghamrasni1, Amanda Giesler1,
Youstina Hanna1, Cherry Have4, Tiantian Li1, S. Y. Cindy Yang1,2, Tong Zhang1,4, Sylvia L. Asa4,
Benjamin Haibe-Kains1,2,5,6, Monika Krzyzanowska1, Adam C. Smith4,7, Simron Singh8, Lillian L. Siu1,3* and
Trevor J. Pugh2,6,9*

  Abstract
  Background: Pancreatic neuroendocrine tumors (PANETs) are rare, slow growing cancers that often present with local and
  distant metastasis upon detection. PANETS contain distinct karyotypes, epigenetic dysregulation, and recurrent mutations in
  MEN1, ATRX, and DAXX (MAD+); however, the molecular basis of disease progression remains uncharacterized.
  Methods: We evaluated associations between aneuploidy and the MAD+ mutational state of 532 PANETs from 11
  published genomic studies and 19 new cases using a combination of exome, targeted panel, shallow WGS, or RNA-seq. We
  mapped the molecular timing of MAD+ PANET progression using cellular fractions corrected for inferred tumor content.
  Results: In 287 PANETs with mutational data, MAD+ tumors always exhibited a highly recurrent signature of loss of
  heterozygosity (LOH) and copy-number alterations affecting 11 chromosomes, typically followed by genome doubling
  upon metastasis. These LOH chromosomes substantially overlap with those that undergo non-random mis-segregation due
  to ectopic CENP-A localization to flanking centromeric regions in DAXX-depleted cell lines. Using expression data from 122
  PANETs, we found decreased gene expression in the regions immediately adjacent to the centromere in MAD+ PANETs.
  Using 43 PANETs from AACR GENIE, we inferred this signature to be preceded by mutations in MEN1, ATRX, and DAXX. We
  conducted a meta-analysis on 226 PANETs from 8 CGH studies to show an association of this signature with metastatic
  incidence. Our study shows that MAD+ tumors are a genetically diverse and aggressive subtype of PANETs that display
  extensive chromosomal loss after MAD+ mutation, which is followed by genome doubling.
  (Continued on next page)

* Correspondence: lillian.siu@uhn.ca; trevor.pugh@utoronto.ca
Rene Quevedo and Anna Spreafico are shared first authors.
1
 Princess Margaret Cancer Centre, University Health Network, 610 University
Avenue, Suite 5-718, Toronto, Ontario M5G 2M9, Canada
2
 Department of Medical Biophysics, University of Toronto, Toronto, Ontario,
Canada
Full list of author information is available at the end of the article

                                        © The Author(s). 2020 Open Access This article is licensed under a Creative Commons Attribution 4.0 International License,
                                        which permits use, sharing, adaptation, distribution and reproduction in any medium or format, as long as you give
                                        appropriate credit to the original author(s) and the source, provide a link to the Creative Commons licence, and indicate if
                                        changes were made. The images or other third party material in this article are included in the article's Creative Commons
                                        licence, unless indicated otherwise in a credit line to the material. If material is not included in the article's Creative Commons
                                        licence and your intended use is not permitted by statutory regulation or exceeds the permitted use, you will need to obtain
                                        permission directly from the copyright holder. To view a copy of this licence, visit http://creativecommons.org/licenses/by/4.0/.
                                        The Creative Commons Public Domain Dedication waiver (http://creativecommons.org/publicdomain/zero/1.0/) applies to the
                                        data made available in this article, unless otherwise stated in a credit line to the data.
Quevedo et al. Genome Medicine    (2020) 12:38                                                                    Page 2 of 15

 (Continued from previous page)
 Conclusions: We propose an evolutionary model for a subset of aggressive PANETs that is initiated by mutation of MEN1,
 ATRX, and DAXX, resulting in defects in centromere cohesion from ectopic CENP-A deposition that leads to selective loss of
 chromosomes and the LOH phenotype seen in late-stage metastatic PANETs. These insights aid in disease risk stratification
 and nominate potential therapeutic vulnerabilities to treat this disease.
 Keywords: Exome sequencing, Pancreatic neuroendocrine tumors, Molecular timing, Gene expression profiling, Whole-
 genome sequencing, Molecular cytogenetics, Loss of heterozygosity, Genetic instability, Publicly available data

Background                                                          In our study of 532 PANETs, we sought to understand
Pancreatic neuroendocrine tumors (PANETs) are rare neu-          the pathogenesis of PANETs by examining the relationship
roendocrine malignancies largely derived from pancreatic         between MAD mutations, chromosomal instability, cohe-
islet alpha- [1] and beta-cells [2]. Approximately half of all   sion, and CENP-A localization. We found that MAD muta-
PANETs are non-functional, defined as the absence of             tions (MAD+) in PANET tumors were strongly predictive
hormone secretion, and thus resulting in asymptomatic            of a highly conserved pattern of loss of heterozygosity
progression and late detection that typically co-occurs with     (LOH) and copy-number (CN) alterations across select
liver metastasis [1]. These tumors are characterized by mu-      chromosomes, typically followed by genome doubling in
tations in chromatin modifiers MEN1, ATRX, and DAXX              late-stage disease or metastatic disease. These patterns of
(MAD) (in 46, 18, and 31% of tumors, respectively) [3–7]         chromosome mis-segregation are likely to stem from mis-
and typically dichotomize into a genome that is either           localization of CENP-A in DAXX-deficient cells, resulting
highly aneuploid or largely diploid with few copy-number         in merotelic attachments and premature sister chromatid
variants (CNVs) [8–17]. Scarpa et al. defined a subtype of       separation via cohesion fatigue. Herein, we show that an
PANETs with a recurrent pattern of whole chromosomal             aggressive subtype of PANETs follows a conserved progres-
loss (RPCL) in chromosomes 1, 2, 3, 6, 8, 10, 11, 15, 16,        sion of molecular events that originates from non-random
and 22 [17], while Stumpf et al. defined recurrent gains in      chromosome mis-segregation and may suggest potential
the complementary set of chromosomes [8] suggesting a            therapeutic targets to disrupt this choreography.
link via whole-genome duplication mechanisms or a tech-
nical difference in data normalization. The RPCL subtype         Methods
is enriched for MAD mutations as well as an alternative          Tissue acquisition
lengthening of the telomere (ALT) phenotype [17]                 Our whole-exome sequencing (WES) cohort originated
which indicates a potential functional link between the          from 4 patients enrolled in the NET-SEQ study (Clinical-
two. A recent characterization of PANETs highlights              Trials.gov, NCT02586844) at the Princess Margaret Cancer
the role of epigenetic modifications into distinct               Centre. Of the 7 patients registered in this study, 4 had
subtype of this disease [2].                                     histological or cytological diagnosis as well-differentiated
   DAXX co-immunoprecipitates with both menin and                pancreatic neuroendocrine tumors (PANETs) to be used
ATRX via its C-terminal [18] and N-terminal regions, re-         for exploratory analysis. Our shallow whole-genome
spectively [19]. The menin-DAXX complex assembles on             (sWGS) cohort was comprised of 15 NET samples pro-
DNA where DAXX is unoccupied by histone variant H3.3/            vided by the Ontario Tumour Bank. Three sample types
H4 and functions to enhance marks of H3K9me3 at the              were processed: buffy coat blood cells, formalin-fixed
promoter of membrane metallo-endopeptidase (MME), a              paraffin-embedded (FFPE) tissues at time of diagnosis, and
colorectal cancer oncogene [20–22]. The DAXX-ATRX                fresh-frozen core needle biopsies.
complex participates in a functionally distinct pathway,
catalyzing replication-independent deposition of the histone     Genomic characterization
variant H3.3 at telomeric and pericentric heterochromatin        We sequenced DNA from the WES cohort to target a
regions [23–25]. Directly associated with H3.3 is the H3         depth of 250× coverage in tumors and 50× coverage in
variant, CENP-A [26], a histone protein that is responsible      normals. We also generated RNA sequencing (RNA-seq)
for assembling kinetochore proteins and dependent upon           libraries from these cases, which we sequenced using ~ 80
DAXX- [18, 25, 27, 28] and ATRX-mediated [24, 29–32]             million reads. We sequenced DNA from the sWGS cohort
histone modifications for its endogenous localization [33,       to 0.34× mean coverage. Sequence data were aligned to
34]. Dysregulation of DAXX induces mis-localization of           the human reference genome sequence build hg19. Vari-
CENP-A, resulting in chromosomal instability, neocentro-         ant detection in exome data was performed using MuTect
mere formation, and micronuclei formation, a common re-          [36] and HaplotypeCaller [37], while copy-number profiles
sult of premature sister chromatid separation [35].              were called using VarScan2 [38] and Sequenza [39]. Loss

Quevedo et al. Genome Medicine   (2020) 12:38                                                                 Page 3 of 15

of heterozygosity data was inferred from both DNA and          HaplotypeCaller. All SNPs were divided into groups based
RNA data by determining purity-adjusted allelic fractions.     on chromosomes and were then discretized into either
Gene-wise transcript abundances were quantified using          homozygous (AF ≥ 0.8 or AF ≤ 0.2) or heterozygous (AF >
the Cufflinks suite of tools [40]. Pseudo allele-specific      0.2 and AF < 0.8). We only focused on SNPs that were
copy-number profiles were estimated from sWGS data             homozygous in the maternal DNA and heterozygous in the
using 500 kB bins tiled across the genome to count the         NET-001 germline DNA. For each LOH chromosome, we
number of reads and the number of heterozygous variants        calculated the fraction of SNPs that were homozygous and
in each bin. To validate these copy-number calls, we           either matched the maternal SNPs or did not (paternal), or
paired this analysis with fluorescence in situ hybridization   were heterozygous.
on complementary FFPE tissues.
                                                               CENP-A ChIP analysis
CENP gene expression analysis                                  WIG files for the Nechemia dataset were downloaded from
We analyzed 148 PANET gene expression profiles obtained        GEO:GSE111381 [43], while BigWIG files for the Nye data-
from published microarray datasets: 99 generated by Sada-      set were downloaded from GEO:GSE120230 [35]. Peaks
nandam et al. [41] (GSE73338) and 49 from Chan et al. [1]      were assigned to cytobands based on the hg19 reference
(GSE117851). We compared expression patterns to a set of       genome. CENP-A peaks were summarized across a refer-
normal pancreatic islet cells from 57 non-diabetic and 20      ence “merged peaks” representation defined by Nye et al.
diabetic donors (GSE41762) generated by Tang et al. [42].      using two metrics: the max peak height for each merged
To approximate whether the CN signature was retained in        peak or reads per kilobase of peaks per million mapped
MAD+ PANETs from these datasets, we first separated            reads (RPKM).
samples based on whether they carried MAD mutations              For the Nye dataset, overlapping peaks between DAXX
and computed the z-score for gene expression against the       and control groups were compared using a t-statistic. To
MAD− PANETs on a per gene basis. Genes were mapped             test for an elevated number of peaks in each cytoband,
back to the human genome assembly hg19, and a                  we calculated the Kolmorogov-Smirnov D-statistic by
loess regression with a 50% smoothing span was fitted          comparing the peaks found only in that cytoband against
to these values.                                               peaks found across the entire genome.
  To calculate whether genes near the centromeres in LOH
chromosomes are lower expressed than the rest of the           Alternative lengthening of telomere
chromosomal arm, we took the aforementioned gene ex-           Telomere lengths for all sWGS data were analyzed using
pression z-scores and calculated the arm-level gene expres-    Telomerecat [44]. Samples were split between PANETs
sion percentile and fractional distance to the centromere.     and GINETs, and a one-sided t test was done on the es-
Chromosomes were stratified into LOH and heterozygous          timated telomere lengths. A one-sided F test was also
chromosomes, and a loess regression was fit to the gene-       conducted to calculate for difference in variance.
level z-scores. To estimate regions of the chromosome arm
that were repressed or elevated relative to the rest of the    Meta-analysis of published datasets
arm, we used an arm-level empirical cumulative density         Whole-exome sequencing of the BON-1 and QGP-1
function to estimate the percentile of each gene.              PANET cell line from Vandamme and colleagues [45]
                                                               was re-analyzed, and LOH segments were called based
Detection of monoallelic expression                            on allelic fractions (European Nucleotide Archive study
To detect monoallelic expression of genes, we called all       ID: PRJEB8223). Copy-number profiles derived from
SNPs from RNA-seq data using HaplotypeCaller [37].             CGH microarray data were obtained from data tables
We tested each gene containing 2 or more SNPs for              described in six publications [8–16] and transcribed into
MAE using a weighted t test. The allelic fractions of all      genomic coordinates (Additional file 1) by mapping to
SNPs in a gene, weighted by the number of reads sup-           cytobands using the UCSC Table Browser hg19 cytoBan-
porting that SNP call, were compared to all SNP allelic        dIdeo file (http://hgdownload.cse.ucsc.edu/goldenPath/
fractions across the entire sample. By bootstrapping this      hg19/database/cytoBandIdeo.txt.gz). Each copy ratio seg-
calculation 1000 times per gene, we obtained the average       ment was assigned a value corresponding to the copy-
z-statistic for each gene and compared it to a null distri-    status. Jaccard index values were calculated to measure
bution created using a similar test where the gene set is      the asymmetric binary concordance between any two
replaced with randomly selected SNPs.                          copy-number profiles.

Detection of parental skewing                                  Molecular timing in project GENIE
SNPs from WES data of NET-001 tumor, matching                  Copy-number profiles and mutational data of PANETs
blood DNA, and maternal DNA were estimated using               from AACR’s project GENIE (v1.0.1) were downloaded
Quevedo et al. Genome Medicine (2020) 12:38 Page 4 of 15
from Sage Synapse (https://www.synapse.org/; synapse IDs: S2b). Additionally, we validated the CN inference in our
syn7851250, syn7851253, and syn7851246). In total, 43 13 sWGS samples using fluorescent in situ hybridization
PANET samples had both copy-number information and of centromeric probes targeting LOH chromosomes 3 and
mutational information. The molecular timing of these 10, and zygosity-intact 7 and 17 (Additional file 4: Table
samples was determined by estimating the tumor purity re- S2a). To rule out the possibility of germline LOH, we con-
quired for every possible copy-number profile to generate firmed that all patients had a diploid heterozygous genome
the observed tumor purity for all somatic mutations. The in their germline DNA (Additional file 3: Fig. S3a).
simplest copy-number profile that fits the constraints of
pathologist purity ± 0.15 and copy-number constraints im-
posed by the relative copy-states of somatic mutations was Extended validation of CN and LOH signature
used to infer molecular timing of the disease. Next, we sought to expand our validation through inclu-
Additional methods and detailed version and param- sion of a larger, clinically derived cohort made available
eter information are available in the Additional file 2. through the AACR GENIE consortium [46]. While
genome-wide zygosity calls were not available for the
Results GENIE cohort, we were able to stratify the CN profiles
Mutations in MEN1, ATRX, and DAXX are characteristic of of 165 PANETs samples into MAD+ (n = 99) and MAD
chromosome mis-segregation errors − (n = 66) subgroups. Consistent with our genome-wide
To characterize the molecular profiles of PANETs (Add- cohort, the targeted clinical panel sequencing data reca-
itional file 3: Fig. S1), we generated an exome and whole- pitulated the same pattern of losses and gains (Fig. 1c)
genome dataset totaling 19 samples. The exome cohort and a near perfect overlap of MAD+ karyotypes. Chro-
consisted of whole-exome sequencing (WES) paired with mosomes 8, 9, 15, and 21 had more than one prominent
RNA-seq across 4 patients, 6 samples (4 metastatic sam- copy-states, suggesting more variable copy-number al-
ples, 2 of which are complemented with their diagnostic terations of these chromosomes (Fig. 1f). PANETs in the
tissue) (Additional file 4: Table S1a). Our whole-genome GENIE cohort without MAD mutations were largely
cohort consisted of 13 PANETs analyzed using shallow diploid with fewer recurrent gains and losses compared
(0.3×) whole-genome sequencing (sWGS) and a 21-gene to those with MAD mutations (Fig. 1g).
panel targeted deep sequencing, paired with FISH of 4 We defined a CN signature by utilizing all available CN
centromeric probes across 5 of the 13 samples (Add- aberrations (CNA) data to calculate the co-occurence of
itional file 4: Table S1b). Moreover, we included 165 copy-number states between chromosomes. By taking the
PANET samples from version 5.0 of the publicly available copy-number states with the highest propensity (Fig. 1f),
AACR GENIE dataset [46] (Additional file 4: Table S1c). we flagged aberrations that are synchronous in their pres-
By stratifying our cohort based on MAD status (MAD+ entation from those that are random independent events
n = 18/19), we discovered a highly recurrent copy-number (Additional file 3: Fig. S4a). Furthermore, we identified loss
and LOH pattern that overlapped the RPCL pattern de- of chromosome 7 (Additional file 3: Fig. S4b) and gain of
scribed by Scarpa et al. [17] in our exome and whole- chromosomes 1, 6, and 16 (Additional file 3: Fig. S4d) as
genome cohorts (Fig. 1a, b). Three cases in our whole- aberrations strongly antagonistic of our copy-number
genome cohort did not exhibit this LOH pattern; this pat- signature. Since the aberrations are largely chromosomal in
tern is undetected in NET-105 due to low tumor purity size, we hypothesized that these CNA were likely a result
obscuring the signal (purity = 0.25, Additional file 4: Table of mis-segregation errors from merotelic events resulting
S1b), while NET-130 and NET-131 did not show LOH in in lagging chromosomes.
chromosomes 15, 16, 21, and 22. Although the inferred To evaluate whether PANET model systems accurately
ploidy between samples differed, almost every case demon- recapitulate these well-defined molecular signatures, we in-
strated LOH for chromosomes 1, 2, 3, 6, 8, 10, 11, 16, 21, ferred genome-wide zygosity using publicly available WES
and 22 and retained heterozygosity for chromosomes 4, 5, data from two metastatic PANET cancer cell lines, BON-1
7, 9, 12, 13, 14, 17, 19, and 20 (Fig 1d). Chromosomes 15 and QGP-1 [45]. While both cell lines exhibited a high
and 18 showed no consistent pattern of variation with het- degree of aneuploidy and LOH, neither were MAD+ and
erozygosity and LOH occurring in equal proportions. the affected chromosomes differed dramatically between
Moreover, the LOH chromosomes were largely copy- cell lines and when compared to the MAD+ PANETs in
neutral (i.e., diploid) while the heterozygous chromosomes our meta-analysis (Additional file 3: Fig. S5). These results
showed copy-gain (Fig. 1e), mimicking the pattern are in agreement with those of Boora et al. [47], suggesting
observed by Stumpf et al. [8–10]. We validated the CN that BON-1 and QGP-1 are genetically distinct from clin-
and LOH regions identified in our WES samples using the ical samples of MAD− and MAD+ PANETs and should be
Affymetrix SNP 6.0 array (Additional file 3: Fig. S2a) and used with caution in understanding PANET cancer biology
allelic skewing in RNA sequencing (Additional file 3: Fig. or for pharmacological screening.Quevedo et al. Genome Medicine (2020) 12:38 Page 5 of 15 Fig. 1 Loss of heterozygosity and copy-number profiles for PANET samples. Loss of heterozygosity profiles depicted as being copy-loss/haploid (blue), copy-neutral/diploid (purple), or copy-gain/triploid+ (red) for each PANET sample in the a exome, b whole-genome, and c AACR GENIE cohorts. Motif plots describe the most recurrent zygosity (d) or copy-number (e–g) states for each chromosome. MAD+ PANETs in the exome and whole-genome cohorts depict patterns of copy-neutral and copy-gain (e), while PANETs in the AACR GENIE cohort depict patterns of copy- loss and copy-gain for MAD+ samples (f) and copy-neutral for MAD− samples (g)
Quevedo et al. Genome Medicine    (2020) 12:38                                                                        Page 6 of 15

The MAD phenotype is associated with alternative                  et al. defined centromeric CENP-A loads in HeLa cells
lengthening of telomeres                                          throughout the cell cycle under endogenous and ectopic
To test whether MAD+ PANETs in our cohort exhibited               CENP-A expression [43] (Additional file 3: Fig. S9). Nye
ALT phenotype as reported by Jiao et al. [45, 48], we com-        et al. characterized non-centromeric CENP-A binding in
pared the overall length of telomeres between 13 PANETs           DAXX-depleted and DAXX-intact SW480 colorectal can-
and 10 MAD− GINETs (gastrointestinal neuroendocrine               cer cells [35] (Fig. 2b, c).
tumors) using sWGS. We observed longer telomere                      In HeLa cells, chromosomal CENP-A levels in the
lengths in PANETs (p = 0.031; one-sided t test) as well as        centromere were more similar between endogenous and
greater variation across samples (p < 0.001; one-sided F          ectopic expression conditions than between cell cycle
test) suggestive of an ALT phenotype (Additional file 3:          phase, with chromosomes 2 and 9 containing the highest
Fig. S6). In the sWGS cohort, NET-129 lacked any MAD              level of deposition and chromosomes 14, 19, and 21 the
mutations and displayed telomere length concordant with           lowest (Additional file 3: Fig. S9). Meanwhile, in SW480
the average length of GINET telomeres. The presence of            cells, there was an increase of ectopic CENP-A occupancy
ALT might suggest disruption of H3.3 incorporation,               from 397 to 1124 kb when DAXX was depleted, the
which we hypothesize is linked to the chromosomal mis-            majority of this coverage occurring in chromosomes
segregation pattern observed.                                     8, 19, and 21 while losing coverage on chromosomes
                                                                  1, 16, and 17 (Fig. 2d).
Mis-segregation errors are associated with DAXX-linked               Using the single-cell sequencing (SCS) data from Wor-
cohesion fatigue                                                  rall et al., we tested whether mis-segregation of specific
The MAD+ CN signature may be a result of selective pres-          chromosomes were related to centromeric CENP-A level
sures favoring the retention and loss of certain chromo-          and centromere size [49]. We did not observe any cor-
somes, or merely a stochastic event that always leads to the      relation between CENP-A levels in centromeric regions
same karyotype. We first hypothesized that retention of           and mis-segregation rates (rEndogenous_g1,g2 = − 0.005, −
chromosomes may be a consequence of selective pressures           0.09, rElevated_g1,g2,RC = − 0.11, 0.01, − 0.41), nor with the
due to monoallelic expression (MAE). By examining 36              coverage or number of CENP-A binding sites acquired
PANETs (23 MAD+, 13 MAD−) from our study and Chan                 in DAXX-depleted conditions (rcoverage = 0.08, rcount =
et al. [1] that exhibited the LOH signature (Additional file 3:   0.12). However, there was a significant correlation be-
Fig. S7), we only found 11 genes that exhibited evidence of       tween the frequency of mis-segregation per chromosome
MAE scattered across 7 of the 8 chromosomes that were             and the size of centromeres as well as flanking cytobands
always heterozygous, leaving chromosome 14 unexplained            (hg19: rCEN = 0.58, p < 0.01; rflank = 0.51, p = 0.01; Fig. 2e).
(Additional file 3: Fig. S8a). Our second hypothesis was that     The features that most correlated with chromosomal
there is a genetic predisposition to losing chromosomes           mis-segregation rates were the mean CENP-A levels
from one parent. For NET-001, we flagged heterozygous             across all ectopic locations (rDAXX = 0.51, p = 0.02; rCon-
single-nucleotide polymorphisms (SNPs) in germline DNA            trol = 0.43, p = 0.06) and levels in regions close to the
that were observed to be homozygous in the matched                centromeric regions under both DAXX-depleted and
tumor and germline DNA collected from the patient’s               control conditions (rDAXX = 0.56, p = 0.02; rControl = 0.58,
mother. We determined that only 8 of the 11 chromo-               p = 0.02; Fig. 2f). While the majority of ectopic CENP-A
somes exhibiting LOH were of maternal origin (Chr1, 6, 8,         peaks localized to the flanking regions of centromere
11, 13, 15, 21, and 22) and 3 were paternal (Chr2, 3, and         (Fig. 2b), we found that newly acquired CENP-A peaks
18) (Additional file 3: Fig. S8b), hence showing no statis-       in DAXX-depletion conditions were primarily localized
tical significance for favoring parental origin (p = 0.23, bi-    to these flanking regions (Fig. 2c). These results suggest
nomial test). Overall, we show that there are no robust           that DAXX-deficient tumors may mis-localize CENP-A
selective factors driving our copy-number signature sug-          to ectopic sites that flank the centromere, which could
gesting that another mechanism may be at play.                    possibly seed the formation of neocentromeres and favor
   A recent publication by Worrall et al. [49] details a non-     merotelic attachments of select chromosomes.
random chromosome mis-segregation pattern in SW403
colorectal cancer cells similar to our own (Fig. 2a; r = 0.50,    LOH chromosomes in MAD+ PANETs exhibit a gene-
point-biserial correlation) that is due to cohesion fatigue,      repressive environment directly adjacent to the
resulting in premature sister chromatid separation and            centromere
lagging chromosome formation. To explore the possibility          It has been shown that proximity to chromocenters and
of centromere dysfunction as the underlying mechanism             pericentromeric regions results in gene repression [50].
driving formation of the MAD+ CN signature, we inte-              Therefore, to test whether PANETs have increased CENP-
grated our genomic data with two ChIP-seq datasets char-          A loading in a similar fashion to DAXX-depleted colorectal
acterizing CENP-A binding locations. Nechemia-Arbely              cells, we tested whether there is a corresponding decrease
Quevedo et al. Genome Medicine (2020) 12:38 Page 7 of 15 Fig. 2 Ectopic CENP-A loading localizations in DAXX-depleted and wild-type SW403 colorectal cancer cell lines from the Nye et al. dataset. a Mis- segregated chromosomes identified by Worrall et al. through single-cell analysis, compared to the LOH chromosomes we define. b, c Chromosome- relative localization of CENP-A peaks that are found in either DAXX-depleted-only regions (b) or peaks that are found in both DAXX-depleted and control cells (c) for both the commonly mis-segregated and normal-segregation chromosomes as identified by Worrall et al. d Depiction of acquired, maintained, and lost CENP-A peaks when SW403 undergo DAXX depletion. e Correlation plots between mis-segregation fractions and size of the centromere (CEN), or the cytobands immediately flanking the centromere (periCEN) on the p-arm or q-arm. f Correlation plots between the number of CENP-A peaks and mis-segregation fractions
Quevedo et al. Genome Medicine    (2020) 12:38                                                                     Page 8 of 15

of gene expression in regions proximal to the centromere          MEN1 = 0.00029, DAXX = 0.00011, binomial test) when
in the LOH chromosomes. We examined the gene expres-              using a cutoff of 0.85 cancer cell fraction. ATRX mutations
sion profiles of 122 PANETs with known MAD mutational             reached significant enrichment at a cancer cell fraction cut-
status from two datasets: Sadanandam et al. [41] (28              off of 0.63, which is expected as LOH on the X chromo-
MAD+, 47 MAD−) and Chan et al. [1] (30 MAD+, 17                   some occurs infrequently in PANETs and may not always
MAD−). We first verified that the MAD+ samples recap-             require LOH as a second hit due to X-inactivation. We ob-
itulate our previously defined copy-number signature              served that 35/39 MAD+ PANET samples follow a mo-
(Fig. 3a, b). By normalizing the expression scores of each        lecular timing model of MAD mutations prior to LOH (4/
gene for all genes on the chromosome arms, we sought to           4 exome cohort, 10/12 whole-genome cohort, 21/23
identify whether there were regions on the chromosome             GENIE cohort) (p = 3.4 × 10⁻⁷, binomial test). Collectively,
that had lower or higher expression. We observed that             our results provide evidence that acquisition of MEN1 and
there was a region, between 0 and 0.025 fractional distance       DAXX/ATRX mutations is an early event that leads to a
of the centromere to the end of the chromosome arms,              genome-wide LOH event, likely through centromere fa-
which had decreased gene expression in LOH chromo-                tigue from merotelic attachments.
somes relative to heterozygous chromosomes (Fig. 3c, d).
While this observation was noted in both datasets, it was         Meta-analysis of copy-number profiles informs the
noticeably absent in a dataset composed of 77 normal pan-         molecular progression towards late-stage PANETs
creatic islet cells [42] (Fig. 3c). The minor discrepancies be-   PANET CN profiles have been extensively reported in the
tween PANET datasets may reflect the inherent noise in            literature, each with their own reported chromosomes of
RNA-seq data, the stratification of LOH and heterozygous          significance. Scarpa et al. [17] examined 102 clinically
chromosomes without genome data to validate, or the sim-          sporadic PANETS and identified 4 CN groups: (G1) CN
plifying assumption that chromosomal arms only have sin-          loss affecting > 50% of the genome, (G2) a diploid genome
gle copy-state. As seen in the colorectal cell lines, the         with little to no LOH or CN loss, (G3) CN gains affecting
increased deposition of CENP-A in the pericentromeric re-         ~ 100% of the genome, and (G4) a mix of CN-LOH and
gion due to DAXX depletion may be linked to a corre-              CN gains. The absolute copy-number profiles of our ex-
sponding decrease of gene expression in this region,              ome cohort revealed 3 of the 4 groups described by Scarpa
suggesting an unseen mechanism for chromosomal mis-               et al. The pancreatic diagnostic sample for patient NET-
segregation pattern in PANETs.                                    003 displays the G1 signature while the liver-metastasis
                                                                  sample displayed the G4 CN-LOH signature. Similarly,
Mutational events in MAD genes precede chromosomal                NET-009 presented with a similar transition of the G4
mis-segregation                                                   CN-LOH signature towards a G3 whole-genome gain
Given the progression of events proposed by our mis-              (Fig. 1a), suggesting a mechanism of whole-genome dupli-
segregation model, we assessed whether MAD mutations              cations underlying PANET progression.
arose prior to LOH events. Hence, we developed a molecu-             To further validate these groupings across independent
lar timing analysis for the initial release of AACR GENIE         cohorts, we analyzed previously published CGH datasets
dataset (Additional file 3: Fig. S1) [46]. We obtained allelic    for the same signatures of absolute loss of LOH chromo-
fractions for clinical panel sequencing data from 43 mixed        somes (G1) or gain of retained chromosomes (G4). Due to
primary/metastasis samples (29 MAD+, 14 MAD−) that                the inability of CGH to detect CN-LOH and whole-
contain both copy-number and somatic mutation data in             genome gains, we anticipated tumors with the G3 profile to
the GENIE v1.0 data freeze. Of the MAD+ population, 26/           appear similar to G4 profiles defined by no aberrations in
29 samples co-occur with the CN signature versus only 1/          the LOH chromosomes with gains of the retained chromo-
14 MAD− samples (Additional file 3: Fig. S10).                    somes. To compare the CGH copy-number data with our
  We next estimated the allele-specific CN profile of the         current study, we performed a meta-analysis of 226 NETs
GENIE cohort using the observed allelic fractions, CN log2        from 8 previous reports (Supplementary Data) [8–16]. By
ratios, and pathologist-estimated tumor purities (± 0.15)         clustering the absolute copy-number profiles of our NETs
(Supplementary Data). Of the MAD+ GENIE PANETs, 6/                and published datasets (Online methods), we demonstrated
29 samples with low (< 30%) tumor cellularity were ex-            that tumors were divided into 5 clusters characterized by
cluded from the analysis. The remaining 23 PANETs                 high and low fractions of genome-wide aneuploidy (Add-
showed a strong tendency to adopt a CN model with can-            itional file 3: Fig. S11a). PANETs in our exome and whole-
cer cell fraction of MAD mutations at 1.0, reinforcing the        genome cohorts were mostly represented in cluster 1 which
hypothesis that these mutations occur prior to LOH and            best represented G4 PANETs. Cluster 5 displayed loss of
genome doubling events (Fig. 4). We observed a significant        LOH chromosomes, suggesting that they best represent G1
enrichment of MEN1 and DAXX mutations prior to LOH                PANETs. Cluster 4 was composed of 9 samples but con-
and genome doubling events (Bonferroni adjusted p values:         tained karyotype that is reminiscent of profiles from the
Quevedo et al. Genome Medicine (2020) 12:38 Page 9 of 15 Fig. 3 Gene expression recapitulating the copy-number signature of MAD+ PanNETs. a, b The copy-number signature was inferred from RNA-seq data from the Sadanandam (nMAD+ = 28, nMAD− = 47) and Chan (nMAD+ = 30, nMAD− = 17) datasets by calculating the z-score on a per-gene basis using MAD+ PANETs compared to MAD−. These plots visualize data from the a Sadanandam dataset and the b Chan dataset. c, d Regions of a chromosome arm that have elevated or repressed gene expression in MAD+ samples for the LOH chromosomes (red) relative to genes on heterozygous chromosomes (blue) are plotted against the fractional distance to the centromere (0 = at centromere boundary, 1 = chromosomal arm end). Three datasets are illustrated here: the Tang et al. dataset composed of 77 normal pancreatic islets (top), the Sadanandam PANET dataset (middle), and the Chan PANET dataset (bottom). d Distances between loess regression lines of LOH to heterozygous chromosomes where all 3 aforementioned datasets are overlapped on each other to better visualize overlapping and discordant regions relative to normal islet cells GENIE cohort, suggesting that this may reflect a CN signature were in fact more aggressive. We separated normalization error rather than true biology. The samples based on copy-number profiles with high- remaining clusters 3 and 5 were largely diploid with few re- chromosomal instability (high-CI) or low-chromosomal current CN aberrations such as chromosome 11 loss. instability (low-CI) (Additional file 3: Fig. S11b). PANETs As PANETs with increased chromosomal instability are with high-CI were more likely to be metastatic (OR 4.35, characteristic of late-stage and more aggressive PANETs 95% CI [1.99, 9.52]; p = 0.00; Cochrane’s Q) (Fig. 5), and [48], we next sought to validate whether PANETs with the the majority of the high-CI NETs were those found in
Quevedo et al. Genome Medicine         (2020) 12:38                                                                                    Page 10 of 15

 Fig. 4 Cancer chromosome fraction for MAD genes in the GENIE PANET samples. Estimations of the theoretical tumor allelic fraction for MEN1
 (red diamond), DAXX/ATRX (red square), and other gene-level mutations (gray circles) for the copy-number model (number of ALT alleles/ploidy)
 that best represents the pathologist-estimated purities across the different cohorts. A fraction of 1.0 indicates a homozygous variant, and 0.5 a
 heterozygous variant. Any deviations from these values represent variance in the observed allelic fractions

clusters 1, 4, and 5 (Additional file 3: Fig. S11a); all tumors             pattern of LOH affecting select chromosomes following
follow the proposed model of PANET CN progression.                          somatic mutations of MEN1 and DAXX or ATRX. By lever-
Thus, loss of the LOH chromosomes appears to be an ini-                     aging expression profiles for 122 of the 306 PANETs [1,
tial step towards metastasis, reflecting a transient state                  41], we show that this CN signature may be linked to per-
due to the small sample size, resulting in a more stable                    turbation of core kinetochore processes which would in-
and metastatic genome-doubled PANET (Fig. 6).                               duce chromosomal mis-segregations. A recent publication
                                                                            from Worrall et al. suggests that there may be order in the
Discussion                                                                  timing of chromosomal mis-segregation stemming from
In our study, we integrate large publicly available data-                   merotelic attachments and cohesion fatigue [49]. Strikingly,
sets of PANETs to show a remarkably conserved MEN1-                         their mis-segregation fractions from SCS partially over-
and DAXX/ATRX-driven metastatic disease progression.                        lapped our LOH signature, suggesting a potential mechan-
Across 306 PANETs with inferable copy-number profiles                       ism that we investigated using large CENP-A ChIP-seq
and MAD mutational status, we observed a well-defined                       datasets [35, 43]. Our results support the hypothesis that
Quevedo et al. Genome Medicine (2020) 12:38 Page 11 of 15 Fig. 5 Meta-analysis of the CGH datasets for the highly aneuploid PANET tumors (High-CI) against the low aneuploid PANET tumors (Low-CI). The parameters being compared are the metastasis status of the tumor type (Met+, metastasis present; Met−, no metastasis) and the functional status (F, functional; NF, non-functional) depletion of DAXX is associated with increased merotelic attachment [42]. The “placeholder theory” posits chromosome-specific ectopic CENP-A deposition, result- that H3.3 acts as a placeholder at centromeric domains ing in decreased gene expression [50], that correlates with during S phase, to be replaced by CENP-A during late G1 mis-segregation frequencies. Finally, using the AACR [25]. H3.3 deposition at tandem repeat sites in centromeric GENIE dataset [46], we show that MEN1 and DAXX/ and pericentromeric regions [27] is largely guided by the ATRX mutational events all preceded the onset of chromo- DAXX-ATRX complex. Disruption of H3.3 deposition is somal instability in clinical samples, subsequently resulting evident due to the presence of the alternative lengthening in LOH and whole-genome duplication to propagate of telomere phenotype exclusively seen in the MAD+ chromosomal stability and increase tumor aggressiveness PANETs [4, 24, 51, 52]. Using a dataset produced by Nye in 226 PANETs [8–16]. Overall, we define the molecular et al. that illustrates mis-localization of ectopic CENP-A in progression mechanisms for an aggressive subtype of SW480 cells under DAXX-depleted conditions [35], we PANETs which is also the first known observations to sup- calculated a significant correlation with increased CENP-A port the non-random chromosome mis-segregation theory deposition in regions flanking the centromere and mis- [49] in primary clinical tumor specimens. segregation fraction per chromosome. To translate these We observed that non-random mis-segregation of chro- findings to PANETs, we observed a region immediately ad- mosomes in the SW480 colorectal cancer cell line [49] jacent to the centromeres in LOH chromosomes in two largely overlaps the LOH chromosomes in PANETs. This published PANET datasets that had decreased gene ex- chromosome-specific overlap suggests that merotelic at- pression relative to the rest of the chromosome arm. Thus, tachment and lagging chromosome formation is the com- we propose that promiscuous CENP-A deposition to flank- mon underlying mechanism guiding patterns of mis- ing centromeric regions is a factor that induces merotelic segregation. Unequal chromosome and centromere sizes as attachments, lagging chromosome formation, and the mis- well as levels of CENP-A can predispose chromosomes to segregation pattern proposed by Worrall et al.
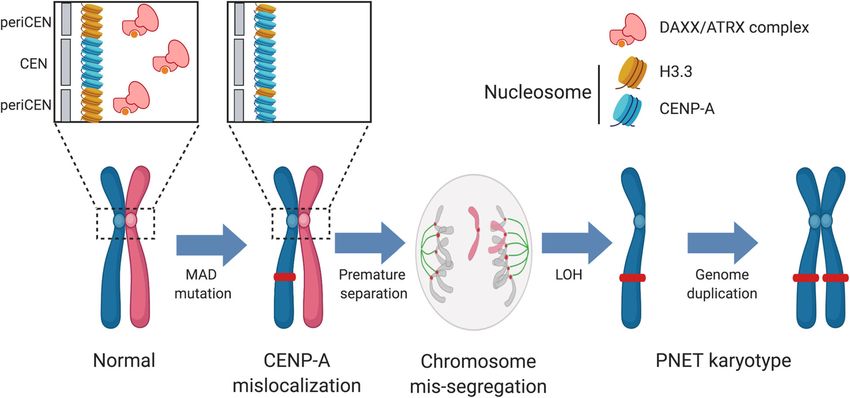
Quevedo et al. Genome Medicine        (2020) 12:38                                                                                  Page 12 of 15

 Fig. 6 Proposed molecular progression mechanism for pancreatic neuroendocrine tumors. Normal islet cells acquire a mutation in MEN1, and
 ATRX or DAXX which leads to perturbed deposition of H3 histone variants H3.3 and CENP-A at nucleosomes in centromeric sites. This results in
 premature sister chromatid separation and loss of one allele, followed by a series of genome duplications

   The functional effects of aneuploidy are generally detri-              our epigenetic dysregulation hypothesis due to the ab-
mental to cellular proliferation [53, 54] and can induce                  sence of publicly available ChIP-seq of H3.3 and CENP-
aneuploidy-associated stresses [55]. Loss of an entire                    A data in MAD+ and MAD− PANETs. Instead, we pro-
chromosome can have drastic effects, resulting in slowing                 vide preliminary results leveraging work in SW480 and
of cell growth [53] but may allow advantages through loss                 HeLa cells paired with evidence of a repressive gene en-
of tumor suppressor genes (TSG) [56]. Additionally, dupli-                vironment proximal to centromeres in PANETs to pro-
cation of the remaining chromosomal region following a                    vide compelling evidence to pursue further in vivo
CN loss could harbor advantageous alterations, allowing                   validation of this disease progression. Furthermore, we
cells to overcome the negative growth effects of chromo-                  acknowledge that there are minor variations in copy-
somal loss [57] or enhance for homozygous expression of                   number and LOH profiles in the literature [16, 60, 61],
preceding oncogenic mutations [58]. A study by Taylor                     but we hypothesize that these differences are a reflection
et al. illustrates this point in lung epithelial cells where they         of stochastic chromosomal instability events, mutational
used CRISPR-Cas9 to induce loss of chromosome 3p. After                   profiles allowing for more aneuploidy tolerance (e.g.,
several passages of slow growth, the cells acquired whole-                TP53 mutation), or synthetic lethality which may alter
chromosome duplication to overcome the negative growth                    which chromosomal losses are tolerated.
effects incurred from the aberration [57]. PANETs are well
characterized as slow growing neoplasms that are clinically
detectable only when they have metastasized [59]; the initial             Conclusions
steps of disease progression described as near-global LOH                 In our study, we observed a conserved trend of MEN1-,
could be an underlying mechanism for this slow growth.                    ATRX-, and DAXX-induced chromosome mis-segregation,
Acquired whole-genome duplication would be the tumor’s                    leading to the characteristic karyotype of aggressive
way to alleviate the negative growth effects of MAD-                      PANETs. These findings pave the way for functional valid-
induced LOH, resulting in a more aggressive tumor that                    ation studies to recreate the molecular progression of
harbors loss of tumor suppressor genes but is not con-                    PANETs in model systems. Understanding the molecular
founded by aneuploidy-associated stresses.                                basis of disease progression towards a more metastatic state
   While the sample size of our in-house PANET cohort                     has several benefits, specifically for risk stratification,
is small, we were able to leverage publicly available data-               treatment design for intermediate progression stages, and
sets allowing us to create a unifying model of disease                    possibly even prophylactic treatment in at-risk individuals.
progression to explain the remarkable consistency be-                     As loss of heterozygosity appears as the molecular trigger
tween karyotypes. However, due to the nature of this                      for metastases, genome duplication acts as a mechanism to
meta-analysis, we were unable to confidently validate                     stabilize the genome.
Quevedo et al. Genome Medicine             (2020) 12:38                                                                                           Page 13 of 15

Supplementary information                                                         Toronto. AS is supported by a Conquer Cancer Foundation ASCO Young
Supplementary information accompanies this paper at https://doi.org/10.           Investigator Award.
1186/s13073-020-00730-9.
                                                                                  Availability of data and materials
 Additional file 1. Details of CGH datasets, listing chromosome gains             All somatic mutations and copy-number aberrations from the exome and
 and losses as reported in the paper of origin.                                   whole-genome cohort can be found in Additional files 5 and 6, while raw se-
                                                                                  quencing data is controlled access at EGAS00001004239 (https://www.ebi.ac.
 Additional file 2. Supplementary methods for the manuscript.                     uk/ega/studies/EGAS00001004239).
 Additional file 3. Supplementary figures for the manuscript.                     All CGH analyzed during this study are included in Additional file 1 as well as
 Additional file 4. Supplementary tables for the manuscript.                      in the supplementary files of the original publications [8–16].
                                                                                  Publicly available gene expression profiles from PANETs were obtained from
 Additional file 5. Somatic mutation calls from the exome and whole-              GEO datasets GSE73338 (doi: 10.1158/2159-8290.CD-15-0068) [41] and
 genome cohort analyzed in this study.                                            GSE117851 (doi: 10.1038/s41467-018-06498-2) [1]. Gene expression profiles
 Additional file 6. Cellular fraction estimates of SNVs from 43 samples           from normal pancreatic islet cells were obtained from the GEO dataset
 from the AACR GENIE v1.0 cohort as well as the exome and whole-                  GSE41762 (doi: 10.1126/scitranslmed.3009934) [42].
 genome datasets generated in this study.                                         Data for CENP-A ChIP-seq data were obtained from GEO datasets GSE111381
                                                                                  (doi: https://doi.org/10.1101/428557) [43] and GSE120230 (doi: https://doi.
                                                                                  org/10.1371/journal.pone.0205948) [35].
Abbreviations                                                                     Whole-exome sequencing data from PANET cell lines were obtained from
AACR: American Association for Cancer Research; ALT: Alternative                  European Nucleotide Archive study ID: PRJEB8223 (doi: https://doi.org/10.
lengthening telomere; CKG: Core kinetochore genes; CN: Copy number; CN-           1530/JME-14-0304) [45].
LOH: Copy-neutral loss of heterozygosity; CNA: Copy-number alterations;           The datasets generated during and/or analyzed during the current study are
FFPE: Formalin-fixed paraffin-embedded; FISH: Fluorescence in situ                available in the AACR GENIE repository, http://www.cbioportal.org/genie/
hybridization; GENIE: Genomics Evidence Neoplasia Information Exchange;           (doi: 10.1158/2159-8290.CD-17-0151) [46].
GINET: Gastrointestinal neuroendocrine tumor; GTEx: Genotype-Tissue
Expression project; LOH: Loss of heterozygosity; MAD+: Mutant MEN1 and            Ethics approval and consent to participate
ATRX/DAXX; MAD−: Wild-type MEN1 and ATRX/DAXX; MAE: Monoallelic                   The University Health Network Research Ethics Board (UHN REB) approved
expression; NET: Neuroendocrine tumor; PANET: Pancreatic neuroendocrine           this study (protocol number 13-6061-C) that includes obtaining informed
tumor; RPCL: Recurrent pattern of whole chromosomal loss; RPKM: Reads per         consent from participants to collect, store, use, and share biological samples
kilobase of peaks per million mapped reads; SCS: Single-cell sequencing;          and data for the study. The UHN REB operates in compliance with the Tri-
sWGS: Shallow whole-genome sequencing; TCN: Total copy number;                    Council Policy Statement, ICH Guideline for Good Clinical Practice E6(R1), On-
TSG: tumor suppressor gene; WES: Whole-exome sequencing                           tario Personal Health Information Protection Act (2004), Part C Division 5 of
                                                                                  the Food and Drug Regulations, and Part 4 of the Natural Health Products
Acknowledgements                                                                  Regulations and the Medical Devices Regulations of Health Canada. This re-
We thank the staff of the Princess Margaret Genomics Centre (www.                 search conformed to the Declaration of Helsinki.
pmgenomics.ca, Neil Winegarden, Julissa Tsao, Nick Khuu, and Gurbaksh Basi)
and the Bioinformatics and High-Performance Computing Core (Carl Virta-           Consent for publication
nen, Zhibin Lu, and Natalie Stickle) for their expertise in generating the se-    Participants consented to sharing of de-identified data, having their name,
quencing and microarray data used in this study. We thank Dr. Suzanne             address, and telephone stripped from any reports, publications, or presenta-
Kamel-Reid for helping to transfer the biological material to the Pugh lab in     tions originating from this study. All participant information was anonymized.
the initial steps of this study. We also thank Michael F. Berger of the Memor-
ial Sloan Kettering Cancer Center for facilitating pathology estimates for sam-   Competing interests
ples within the AACR GENIE cohort. Biological materials were provided by          The authors declare that they have no competing interests.
the Ontario Tumour Bank, which is funded by the Ontario Institute for Can-
cer Research. This study was conducted with the support of the Ontario Insti-     Author details
tute for Cancer Research (OICR, PanCuRx Translational Research Initiative).       1
                                                                                   Princess Margaret Cancer Centre, University Health Network, 610 University
                                                                                  Avenue, Suite 5-718, Toronto, Ontario M5G 2M9, Canada. 2Department of
Authors’ contributions                                                            Medical Biophysics, University of Toronto, Toronto, Ontario, Canada. 3Division
RQ analyzed and interpreted the genomic data and did all the subsequent           of Medical Oncology and Hematology, University of Toronto, Toronto,
bioinformatic analysis. AS recruited the NET patients and organized the           Ontario, Canada. 4Laboratory Medicine Program, University Health Network,
transfer of tissues for downstream analysis. BHK, JB, AD, and CY assisted in      Toronto, Ontario, Canada. 5Department of Computer Science, University of
the algorithm development and managed the data on the PMGC                        Toronto, Toronto, Ontario, Canada. 6Ontario Institute for Cancer Research,
computing cluster. AG organized the transfer of fresh core biopsies and           Toronto, Ontario, Canada. 7Department of Laboratory Medicine and
diagnostic blocks to the Pugh lab for DNA/RNA extraction. TL and YH               Pathobiology, University of Toronto, Toronto, Canada. 8Susan Leslie Clinic for
performed the macrodissection, tissue-staining, DNA/RNA extraction, and li-       Neuroendocrine Cancer, Sunnybrook Odette Cancer Center, Toronto, Ontario,
brary preparation. SA provided all pathological reviews of the tissues used in    Canada. 9Princess Margaret Cancer Centre, University Health Network, 101
this project. AS and CH ran all the cytogenetic experiments. SS, LS, and TJP      College Street, TMDT, Room 9-305, Toronto, Ontario M5G 1L7, Canada.
organized and managed this project. The authors read and approved the
final manuscript.                                                                 Received: 28 August 2019 Accepted: 10 March 2020

Funding
This project was funded by grants from the Cancer Research Society and the        References
Carcinoid NeuroEndocrine Tumour Society Canada (#19341, TJP) and the              1. Chan CS, Laddha SV, Lewis PW, Koletsky MS, Robzyk K, Da Silva E, et al.
Princess Margaret Cancer Centre Neuroendocrine Tumour Research Fund                   ATRX, DAXX or MEN1 mutant pancreatic neuroendocrine tumors are a
(LLS). TJP is supported by the Canada Research Chairs program. Infrastructure         distinct alpha-cell signature subgroup. Nat Commun. 2018;9(1):4158. https://
support was provided by the Princess Margaret Cancer Foundation; Canada               doi.org/10.1038/s41467-018-06498-2.
Foundation for Innovation, Leaders Opportunity Fund, CFI 340 #32383; and          2. Cejas P, Drier Y, Dreijerink KMA, Brosens LAA, Deshpande V, Epstein CB,
Ontario Ministry of Research and Innovation, Ontario Research Fund Small              et al. Enhancer signatures stratify and predict outcomes of non-functional
Infrastructure Program (TJP). RQ is supported by a Medical Biophysics                 pancreatic neuroendocrine tumors. Nat Med. 2019;25(8):1260–5.
Excellence Ontario Student Opportunity Trust Fund Award from the Princess         3. Yao JC, Hassan M, Phan A, Dagohoy C, Leary C, Mares JE, et al. One
Margaret Cancer Centre, the Province of Ontario, and the University of                hundred years after “carcinoid”: epidemiology of and prognostic factors for
Quevedo et al. Genome Medicine (2020) 12:38 Page 14 of 15
neuroendocrine tumors in 35,825 cases in the United States. J Clin Oncol. 25. Dunleavy EM, Almouzni G, Karpen GH. H3. 3 is deposited at centromeres in
2008;26(18):3063–72. S phase as a placeholder for newly assembled CENP-A in G1 phase.
4. Jiao Y, Shi C, Edil BH, de Wilde RF, Klimstra DS, Maitra A, et al. DAXX/ATRX, Nucleus. 2011;2(2):146–57.
MEN1, and mTOR pathway genes are frequently altered in pancreatic 26. Pluta AF, Earnshaw WC, Goldberg IG. Interphase-specific association of
neuroendocrine tumors. Science. 2011;331(6021):1199–203. intrinsic centromere protein CENP-C with HDaxx, a death domain-
5. Francis JM, Kiezun A, Ramos AH, Serra S, Pedamallu CS, Qian ZR, et al. binding protein implicated in Fas-mediated cell death. J Cell Sci. 1998;
Somatic mutation of CDKN1B in small intestine neuroendocrine tumors. Nat 111(Pt 14):2029–41.
Genet. 2013;45(12):1483–6. 27. Goldberg AD, Banaszynski LA, Noh K-M, Lewis PW, Elsaesser SJ, Stadler S,
6. Banck MS, Kanwar R, Kulkarni AA, Boora GK, Metge F, Kipp BR, et al. The et al. Distinct factors control histone variant H3.3 localization at specific
genomic landscape of small intestine neuroendocrine tumors. J Clin Invest. genomic regions. Cell. 2010;140(5):678–91.
2013;123(6):2502–8. 28. He Q, Kim H, Huang R, Lu W, Tang M, Shi F, et al. The Daxx/Atrx complex
7. Cunningham JL, Díaz de Ståhl T, Sjöblom T, Westin G, Dumanski JP, Janson protects tandem repetitive elements during DNA hypomethylation by
ET. Common pathogenetic mechanism involving human chromosome 18 promoting H3K9 trimethylation. Cell Stem Cell. 2015;17(3):273–86.
in familial and sporadic ileal carcinoid tumors. Genes Chromosomes Cancer. 29. Stimpson KM, Sullivan BA. Review of histone H3K4 methylation keeps
2011;50(2):82–94. centromeres open for business. EMBO J. 2011;30(2):233–4.
8. Stumpf E, Aalto Y, Höög A, Kjellman M, Otonkoski T, Knuutila S, Andersson 30. Baumann C, Viveiros MM, De La Fuente R. Loss of maternal ATRX results in
LC. Chromosomal alterations in human pancreatic endocrine tumors. Genes centromere instability and aneuploidy in the mammalian oocyte and pre-
Chromosomes Cancer. 2000;29(1):83–7. https://doi.org/10.1002/1098- implantation embryo. PLoS Genet. 2010;6(9):e1001137.
2264(2000)9999:99993.0.CO;2-Z. 31. Ritchie K, Seah C, Moulin J, Isaac C, Dick F, Bérubé NG. Loss of ATRX
9. Terris B, Meddeb M, Marchio A, Danglot G, Fléjou JF, Belghiti J, et al. leads to chromosome cohesion and congression defects. J Cell Biol.
Comparative genomic hybridization analysis of sporadic neuroendocrine 2008;180(2):315–24.
tumors of the digestive system. Genes Chromosomes Cancer. 1998;22(1):50–6. 32. Bergmann JH, Rodríguez MG, Martins NMC, Kimura H, Kelly DA, Masumoto
https://doi.org/10.1002/(SICI)1098-2264(199805)22:13.0.CO;2-6. H, et al. Epigenetic engineering shows H3K4me2 is required for HJURP
10. Tönnies H, Toliat MR, Ramel C, Pape UF, Neitzel H, Berger W, Wiedenmann targeting and CENP-A assembly on a synthetic human kinetochore. EMBO J.
B. Analysis of sporadic neuroendocrine tumours of the enteropancreatic 2011;30(2):328–40.
system by comparative genomic hybridisation. Gut. 2001;48(4):536–41. 33. González-Barrios R, Soto-Reyes E, Herrera LA. Assembling pieces of the
https://doi.org/10.1136/gut.48.4.536. centromere epigenetics puzzle. Epigenetics. 2012;7(1):3–13.
11. Kulke MH, Freed E, Chiang DY, Philips J, Zahrieh D, Glickman JN, Shivdasani 34. Shrestha RL, Ahn GS, Staples MI, Sathyan KM, Karpova TS, Foltz DR, Basrai MA.
RA. High-resolution analysis of genetic alterations in small bowel carcinoid Mislocalization of centromeric histone H3 variant CENP-A contributes to
tumors reveals areas of recurrent amplification and loss. Genes chromosomal instability (CIN) in human cells. Oncotarget. 2017;8(29):46781–800.
Chromosomes Cancer. 2008;47(7):591–603. 35. Nye J, Sturgill D, Athwal R, Dalal Y. HJURP antagonizes CENP-A
12. Speel EJ, Scheidweiler AF, Zhao J, Matter C, Saremaslani P, Roth J, et al. mislocalization driven by the H3.3 chaperones HIRA and DAXX. PloS One.
Genetic evidence for early divergence of small functioning and 2018;13(10):e0205948. https://doi.org/10.1371/journal.pone.0205948.
nonfunctioning endocrine pancreatic tumors: gain of 9Q34 is an early event 36. Cibulskis K, Lawrence MS, Carter SL, Sivachenko A, Jaffe D, Sougnez C, et al.
in insulinomas. Cancer Res. 2001;61(13):5186–92 PMID:11431358. Sensitive detection of somatic point mutations in impure and
13. Zhao J, Moch H, Scheidweiler AF, Baer A, Schäffer AA, Speel EJ, et al. heterogeneous cancer samples. Nat Biotechnol. 2013;31(3):213–9.
Genomic imbalances in the progression of endocrine pancreatic tumors. 37. McKenna A, Hanna M, Banks E, Sivachenko A, Cibulskis K, Kernytsky A, et al.
Genes Chromosomes Cancer. 2001;32(4):364–72. The Genome Analysis Toolkit: a MapReduce framework for analyzing next-
14. Floridia G, Grilli G, Salvatore M, Pescucci C, Moore PS, Scarpa A, Taruscio D. generation DNA sequencing data. Genome Res. 2010;20(9):1297–303.
Chromosomal alterations detected by comparative genomic hybridization 38. Koboldt DC, Zhang Q, Larson DE, Shen D, McLellan MD, Lin L, et al. VarScan
in nonfunctioning endocrine pancreatic tumors. Cancer Genet Cytogenet. 2: somatic mutation and copy number alteration discovery in cancer by
2005;156(1):23–30. https://doi.org/10.1016/j.cancergencyto.2004.04.015. exome sequencing. Genome Res. 2012;22(3):568–76.
15. Haugvik S-P, Vodák D, Haugom L, Hovig E, Gladhaug IP, Heim S, Micci F. 39. Favero F, Joshi T, Marquard AM, Birkbak NJ, Krzystanek M, Li Q, et al.
Transcriptomic profiling of tumor aggressiveness in sporadic nonfunctioning Sequenza: allele-specific copy number and mutation profiles from tumor
pancreatic neuroendocrine neoplasms. Pancreas. 2016;45(8):1196–203. sequencing data. Ann Oncol. 2015;26(1):64–70.
16. Nagano Y, Kim DH, Zhang L, White JA, Yao JC, Hamilton SR, Rashid A. Allelic 40. Trapnell C, Roberts A, Goff L, Pertea G, Kim D, Kelley DR, et al. Differential
alterations in pancreatic endocrine tumors identified by genome-wide single gene and transcript expression analysis of RNA-seq experiments with
nucleotide polymorphism analysis. Endocr Relat Cancer. 2007;14(2):483–92. TopHat and Cufflinks. Nat Protoc. 2012;7(3):562–78.
17. Scarpa A, Chang DK, Nones K, Corbo V, Patch A-M, Bailey P, et al. Whole- 41. Sadanandam A, Wullschleger S, Lyssiotis CA, Grötzinger C, Barbi S, Bersani S,
genome landscape of pancreatic neuroendocrine tumours. Nature. 2017; et al. A cross-species analysis in pancreatic neuroendocrine tumors reveals
543(7643):65–71. molecular subtypes with distinctive clinical, metastatic, developmental, and
18. Feng Z, Wang L, Sun Y, Jiang Z, Domsic J, An C, et al. Menin and Daxx metabolic characteristics. Cancer Discov. 2015;5(12):1296–313. https://doi.
interact to suppress neuroendocrine tumors through epigenetic control of org/10.1158/2159-8290.CD-15-0068.
the membrane metallo-endopeptidase. Cancer Res. 2017;77(2):401–11. 42. Tang Y, Axelsson AS, Spégel P, Andersson LE, Mulder H, Groop LC, et al.
19. Wang X, Zhao Y, Zhang J, Chen Y. Structural basis for DAXX interaction with Genotype-based treatment of type 2 diabetes with an α2A-adrenergic
ATRX. Protein Cell. 2017;8(10):767–71. receptor antagonist. Sci Transl Med. 2014;6(257):257ra139. https://doi.org/10.
20. Drané P, Ouararhni K, Depaux A, Shuaib M, Hamiche A. The death-associated 1126/scitranslmed.3009934.
protein DAXX is a novel histone chaperone involved in the replication- 43. Nechemia-Arbely Y, Miga KH, Shoshani O, Aslanian A, McMahon MA, Lee
independent deposition of H3.3. Genes Dev. 2010;24(12):1253–65. AY, et al. DNA replication-mediated error correction of ectopic CENP-A
21. Haase G, Gavert N, Brabletz T, Ben-Ze’ev A. A point mutation in the deposition maintains centromere identity. bioRxiv. 2018:428557. https://doi.
extracellular domain of L1 blocks its capacity to confer metastasis in colon org/10.1101/428557.
cancer cells via CD10. Oncogene. 2017;36(11):1597–606. 44. Farmery JHR, Smith ML, NIHR BioResource - Rare Diseases, Lynch AG.
22. Lewis PW, Elsaesser SJ, Noh K-M, Stadler SC, David Allis C. Daxx is an H3.3- Telomerecat: a ploidy-agnostic method for estimating telomere length from
specific histone chaperone and cooperates with ATRX in replication- whole genome sequencing data. Sci Rep. 2018;8(1):1300.
independent chromatin assembly at telomeres. Proc Natl Acad Sci U S A. 45. Vandamme T, Peeters M, Dogan F, Pauwels P, Van Assche E, Beyens M, et al.
2010;107(32):14075–80. Whole-exome characterization of pancreatic neuroendocrine tumor cell
23. Watson LA, Goldberg H, Bérubé NG. Emerging roles of ATRX in cancer. lines BON-1 and QGP-1. J Mol Endocrinol. 2015;54(2):137–47. https://doi.org/
Epigenomics. 2015;7(8):1365–78. 10.1530/JME-14-0304.
24. Morozov VM, Gavrilova EV, Ogryzko VV, Ishov AM. Dualistic function of Daxx 46. AACR Project GENIE Consortium. AACR project GENIE: powering precision
at centromeric and pericentromeric heterochromatin in normal and stress medicine through an international consortium. Cancer Discov. 2017;7(8):
conditions. Nucleus. 2012;3(3):276–85. 818–31. https://doi.org/10.1158/2159-8290.CD-17-0151.You can also read