Microdissected pancreatic cancer proteomes reveal tumor heterogeneity and therapeutic targets - JCI Insight
←
→
Page content transcription
If your browser does not render page correctly, please read the page content below
RESEARCH ARTICLE

                                          Microdissected pancreatic cancer
                                          proteomes reveal tumor heterogeneity
                                          and therapeutic targets
                                          Tessa Y.S. Le Large,1,2,3,4 Giulia Mantini,2,4,5 Laura L. Meijer,1,2 Thang V. Pham,2,4 Niccola Funel,6
                                          Nicole C.T. van Grieken,6 Bart Kok,1 Jaco Knol,2,4 Hanneke W.M. van Laarhoven,7 Sander R.
                                          Piersma,2,4 Connie R. Jimenez,2,4 G. Kazemier,1 Elisa Giovannetti,2,5 and Maarten F. Bijlsma3,8
                                          Department of Surgery and 2Department of Medical Oncology, Amsterdam University Medical Centers, Free University
                                          1

                                          Amsterdam, Cancer Center Amsterdam, Amsterdam, Netherlands. 3Laboratory for Experimental Oncology and
                                          Radiobiology, Amsterdam University Medical Centers, University of Amsterdam, Cancer Center Amsterdam, Amsterdam,
                                          Netherlands.4OncoProteomics Laboratory, Amsterdam University Medical Centers, Free University Amsterdam, Cancer
                                          Center Amsterdam, Amsterdam, Netherlands. 5Cancer Pharmacology Lab, Fondazione Pisana per la Scienza, Pisa, Italy.
                                          6
                                              Unit of Anatomic Pathology II, Azienda Ospedaliera Universitaria Pisana, Pisa, Italy. 7Department of Medical Oncology,
                                          Amsterdam University Medical Centers, University of Amsterdam, Cancer Center Amsterdam, Amsterdam, Netherlands.
                                          8
                                              Oncode Institute, Amsterdam, Netherlands.

                                                      Pancreatic ductal adenocarcinoma (PDAC) is characterized by a relative paucity of cancer cells that
                                                      are surrounded by an abundance of nontumor cells and extracellular matrix, known as stroma. The
                                                      interaction between stroma and cancer cells contributes to poor outcome, but how proteins from
                                                      these individual compartments drive aggressive tumor behavior is not known. Here, we report the
                                                      proteomic analysis of laser-capture microdissected (LCM) PDAC samples. We isolated stroma,
                                                      tumor, and bulk samples from a cohort with long- and short-term survivors. Compartment-specific
                                                      proteins were measured by mass spectrometry, yielding what we believe to be the largest PDAC
                                                      proteome landscape to date. These analyses revealed that, in bulk analysis, tumor-derived proteins
                                                      were typically masked and that LCM was required to reveal biology and prognostic markers. We
                                                      validated tumor CALB2 and stromal COL11A1 expression as compartment-specific prognostic
                                                      markers. We identified and functionally addressed the contributions of the tumor cell receptor
                                                      EPHA2 to tumor cell viability and motility, underscoring the value of compartment-specific protein
                                                      analysis in PDAC.

Authorship note: EG and MFB
contributed equally to this work.

Conflict of interest: MFB has received    Introduction
research funding from Celgene and
                                          Large-scale omics efforts to identify key mediators of tumor biology have typically focused on the tumor
acted as a consultant to Servier.
                                          compartment as an entity by itself, and tissue samples for gene expression and genomic analyses are com-
HWMVL has a consultant/advisory
role with Bristol-Myers Squibb, Lilly,    monly selected based on high tumor purity (1). This bias toward the epithelial compartment understates
MSD, Nordic Pharma, Novartis, and         the influence of the microenvironment and its heterocellular composition (2). Further, by studying tumor
Servier. HWMVL received research          tissue in bulk, the composition of specific compartments within the tumor can be masked. Bioinformatics
funding from Bayer, Bristol-Myers         efforts to delineate the compartment-specific expression have overcome this problem partially and increased
Squibb, Celgene, Janssen, Lilly, Nordic   our understanding of tumor biology (3). However, the inference of cellular composition by bioinformatics
Pharma, Philips, Roche, and Servier.      remains an estimation that requires validation, for instance, by the analysis of physically separated compart-
Copyright: © 2020, American Society       ments. Especially in light of current molecular subtyping efforts to improve survival prediction and achieve
for Clinical Investigation.               a personalized treatment schedule, the characterization of the specific expression profiles of tumor cells and
Submitted: March 25, 2020                 their microenvironment is key to identify patient groups more effectively and to discover therapeutic targets.
Accepted: June 24, 2020                        The relevance of the tumor-stroma interaction is of particular importance in tumors that are char-
Published: August 6, 2020.                acterized by high stromal content, such as pancreatic ductal adenocarcinoma (PDAC). PDAC typically
                                          consists of small tumor islands surrounded by abundant extracellular matrix (ECM) and stromal cells,
Reference information: JCI Insight.
2020;5(15):e138290.                       which together constitute the vast majority of the tumor bulk (4). This stroma is known to drive mul-
https://doi.org/10.1172/jci.              tiple protumorigenic features in PDAC tumor cells; it stimulates proliferation and metastatic growth,
insight.138290.                           creates an immune-suppressive environment (5), and activates signaling via mechanobiology (6).

insight.jci.org   https://doi.org/10.1172/jci.insight.138290                                                                                                           1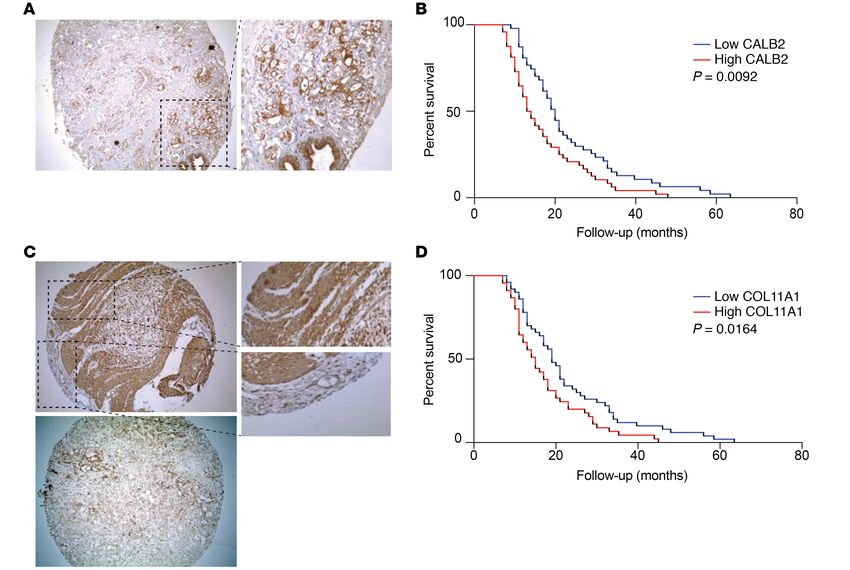
RESEARCH ARTICLE
However, stromal depletion strategies had disappointing clinical results, suggesting that PDAC stroma
also harbors tumor-restraining properties that suggest that a complex stromal plasticity exists (7–9).
PDAC responds poorly to systemic treatment, and only 9% of all patients diagnosed with PDAC survive
more than 5 years (10). New chemotherapeutic regimens have improved the survival rate by several months
(11, 12), and, hopefully, (neo)adjuvant multimodal approaches will improve survival further (13, 14). How-
ever, a better understanding of this tumor type is essential for the development of more effective, targeted
therapeutic approaches and to select patients for such therapies. Several gene expression–based classification
efforts have delineated the heterogeneity that is thought to contribute to the typical poor outcomes (15, 16),
but most studies have largely ignored the separate stromal and epithelial contributions. Moffitt et al. (17)
established molecular PDAC subtypes specific to the epithelial and stromal compartment by using an in sili-
co deconvolution method on the transcriptomic landscape of bulk tumor tissue. Recently, Maurer et al. (18)
performed in-depth transcriptomics of laser-capture microdissection (LCM) of PDAC, validating stromal
and epithelial subtypes. These data provided evidence of the differential expression and pathways in both
tumor cells and stroma and their divergent effects on prognosis. This compartment-specific complexity in
PDAC warrants further understanding of each contribution to the disease outcome.
To date, no large-scale proteomic studies have been performed to identify the tumor- and stroma-specific
protein landscapes of PDAC. Importantly, LCM can select compartment-specific areas and highly enrich the
analysis for specific cell types (19). So far, LCM has predominantly been coupled with genomic or transcrip-
tomic analysis, whereas proteomic studies of LCM material are rare due to the laborious efforts required
to yield enough protein from the samples, especially from the stromal compartment (20). With the recent
advances in sensitivity, throughput, and scan rate of liquid chromatography–mass spectrometry–based
(LC-MS–based) proteomics (21), coupling LCM with LC-MS has become an attractive approach for identi-
fying the functional proteomic landscape of PDAC and unraveling compartment-specific biology.
We hypothesized that tumor and stromal proteomic landscapes can yield complementary molecular
information downstream of the transcriptome. Furthermore, we postulated that these data can be leveraged
to dissect compartment-specific biology with prognostic value and to reveal targetable pathways. In this
study, we report an extensive data set from LCM PDAC tissue and patient-derived xenografts (PDXs) and
identify over 6000 proteins.
Results
Clinicopathological evaluation and depth of analysis. Of the 39 evaluated primary tumor samples, 16 were
selected for LCM after confirmation of PDAC histology, with selection based on tissue quantity, tissue
quality, and a tumor percentage of at least 5%. Additionally, bulk tumor analysis was performed on 11 sam-
ples matched with the LCM samples as well as on 5 unmatched bulk tumor samples. Baseline clinical char-
acteristics of the total group (n = 21) are shown in Table 1 (additional information is provided in Supple-
mental Tables 1 and 2; supplemental material available online with this article; https://doi.org/10.1172/
jci.insight.138290DS1). Three patients showed no sign of recurrence at last follow-up visit. The median
overall survival (OS) of the cohort was 358 days. Age, sex, disease stage, and nodal involvement showed no
statistically significant association with OS in this surgical cohort, likely due to small group sizes. Eleven
patients received adjuvant systemic therapy, which associated with improved OS (log-rank test, P = 0.04).
Tumor purities ranged from 5% to 70% (Supplemental Figure 1A), reflecting the known abundance of, and
variance in, stromal content in PDAC.
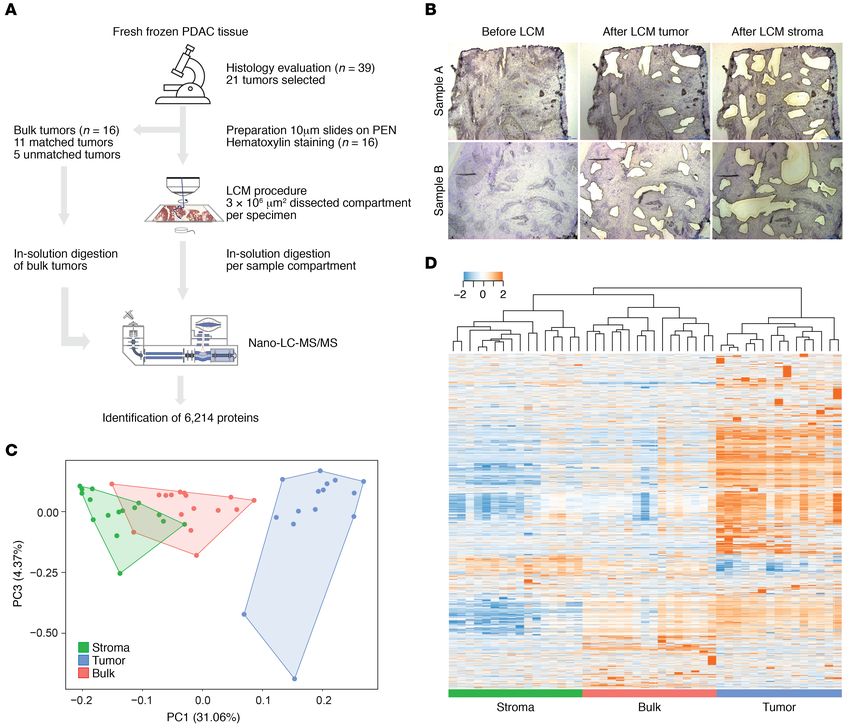
A visualization of the workflow is shown in Figure 1A. Large areas of tumor and adjacent stromal
areas were successfully isolated by LCM (Figure 1B). Single-shot LC-MS/MS analysis identified a total of
6214 unique proteins, yielding the deepest proteome data set of PDAC to date to our knowledge. Technical
replicates were highly correlated (Supplemental Figure 1B), confirming reproducibility of the workflow.
We identified 1866 unique epithelial proteins and 220 unique stromal proteins (Supplemental Figure 1C),
indicating that protein expression is most heterogeneous in the tumor cell compartment.
Principal component analysis (Figure 1C) confirmed successful separation of the compartments, and this
was supported by unsupervised clustering (Figure 1D) and correlation analysis (Supplemental Figure 1D).
Interestingly, bulk tumors were more similar to the stromal samples than to the tumor compartment, regard-
less of tumor purity. Pearson correlation analysis confirmed the significantly higher correlation of bulk sam-
ples to compared with that of bulk samples to the tumor compartment (P < 0.0001, Supplemental Figure
1E). This result is in agreement with the high fraction of stroma in these tumors and emphasizes the caveats
insight.jci.org https://doi.org/10.1172/jci.insight.138290 2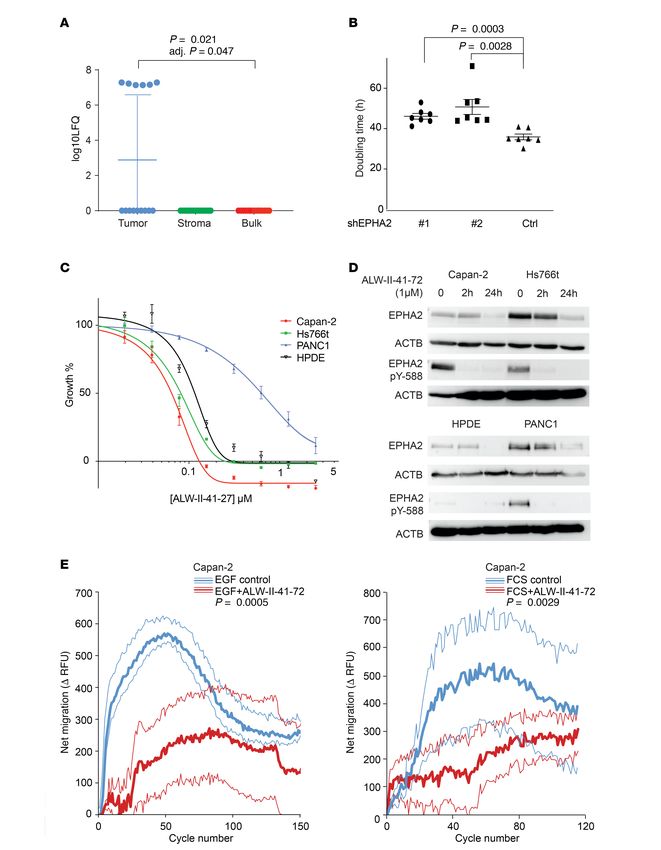
RESEARCH ARTICLE

                                  Table 1. Baseline characteristics of the cohort

                                  Clinicopathological characteristics                                        (n = 21)
                                  Age at time of diagnosis, yr, median (range)                             69 (50–80)
                                  Sex, no. (%)
                                                            Female                                           11 (52.4)
                                                              Male                                           10 (47.6)
                                  CA19.9 (U/mL), median (range)                                          319.5 (5–12,639)
                                  ASA classification, no. (%)
                                                                1                                            1 (4.8)
                                                                2                                           14 (66.7)
                                                                3                                           6 (28.6)
                                  Treatment, no. (%)
                                               Resection of the primary tumor                                21 (100)
                                  Disease stage (AJCC 8th edition)
                                                          1B, no. (%)                                         1 (4.8)
                                                          2A, no. (%)                                        3 (14.3)
                                                          2B, no. (%)                                        9 (42.9)
                                                           3, no. (%)                                        7 (33.3)
                                                           4, no. (%)                                         1 (4.8)
                                  Adjuvant therapy, no. (%)
                                                     No adjuvant therapy                                    10 (47.6)
                                                         Gemcitabine                                        11 (52.4)
                                  Disease-free survival, d, median (95% CI)
                                             Overall survival, d, median (95% CI)                          369 (2–736)

                                  of bulk tumor analyses. Moreover, interpatient correlation of tumor compartment samples was significantly
                                  lower (mean R2 = 0.5731) than interpatient correlation of stromal samples (mean R2 = 0.7377; P < 0.0001,
                                  Supplemental Figure 1F), indicating that the tumor compartment is the predominant source of heterogene-
                                  ity in PDAC. This can partly be explained by the lower protein variety of the stromal compartment, as is
                                  shown from the lower number of different proteins expressed in stroma (Supplemental Figure 1C), but we
                                  propose that this is caused primarily by the relative genetic instability in the tumor compartment.
                                       Biological characterization of epithelial and stromal proteomes. Unsupervised clustering using known
                                  markers for epithelial and stromal cells (Figure 2A) confirmed successful separation of compartments.
                                  This was also evident from per-sample analysis of selected tumor marker proteins (Supplemental Fig-
                                  ure 1G). To further validate our LCM approach and compartment specificity, proteome data from 10
                                  previously established PDAC PDXs (22) were generated. In these models, mouse cells and matrix pro-
                                  teins rapidly replace the human stroma, and the limited homology in amino acid sequence between
                                  mouse host and human donor can be leveraged to identify stromal and tumor cell–derived proteins.
                                  Species-specific unique proteins were allocated to a human or mouse protein set if they were identified
                                  in 5 of 10 samples. This approach yielded 1159 human- and 355 mouse-specific proteins, which we
                                  take to represent tumor and stroma proteins, respectively (Supplemental Data File 5). Single-sample
                                  gene set enrichment analysis (ssGSEA) showed strong correlation of mouse proteins to the stromal
                                  proteins from the LCM approach. Likewise, human proteins associated with the epithelial/tumor LCM
                                  compartment, but this enrichment was less evident (Figure 2B). The latter is likely caused by human
                                  PDX (tumor cell) proteins that are also expressed in stroma, diluting the relative enrichment. Addi-
                                  tionally, ssGSEA of in silico identified stromal and tumor subtypes (17) showed an enrichment pattern
                                  confirming compartment specificity. Two tumor samples showed lower enrichment for both previously
                                  described Moffitt subtypes (17), implying the existence of tumor cell clones of other subtypes within
                                  these tissues or contamination by normal pancreatic tissue.
                                       Regulation of protein expression downstream of RNA transcription is known to contribute to dispari-
                                  ties between transcriptome and proteome data. To assess whether this is the case in models for PDAC, we
                                  correlated RNA-Seq data from the PDXs to their proteomics data and found an intermediate correlation
                                  of 0.55 between protein and mRNA transcripts, in line with previously reported data (Supplemental Figure
                                  2A) (23). Of note, some proteins showed very high correlation to their transcripts, such as ENO1, while

insight.jci.org   https://doi.org/10.1172/jci.insight.138290                                                                             3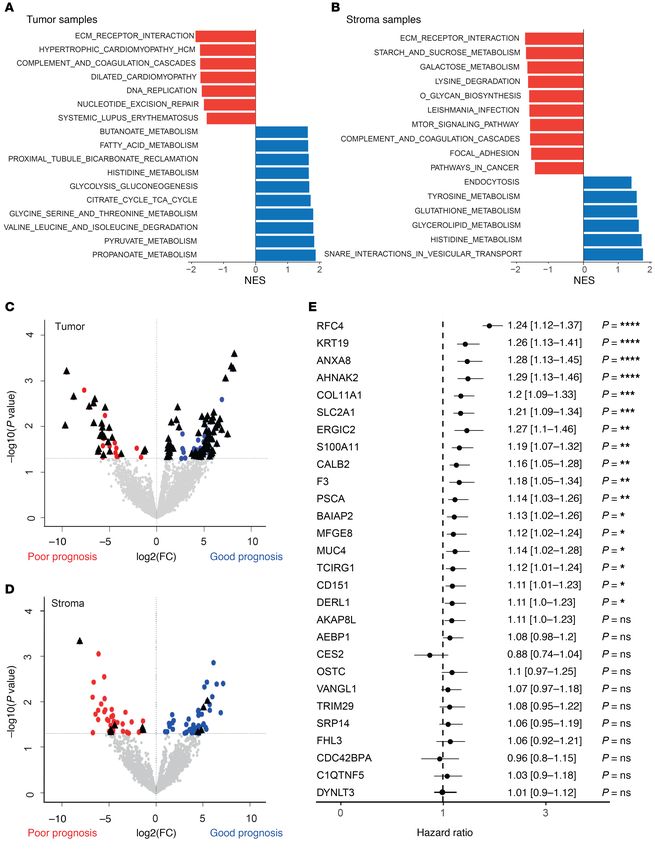
RESEARCH ARTICLE

Figure 1. Proteome analysis of PDAC samples. (A) Flowchart of the experimental set up of the proteome landscape analysis (n = 16 for the LCM anal-
ysis, n = 16 bulk tumor analysis). (B) Representative example images of 2 PDAC tumors during the LCM procedure. Slides show before and after tumor
microdissection and after stroma microdissection. Original magnification, ×10. (C) Principle component analysis (PCA) of MS/MS data shows separation
of the epithelial compartment from stroma (n = 16), tumor (n = 15), and bulk samples (n = 11). (D) Unsupervised hierarchical clustering of all proteins shows
compartment-specific expression of all samples (n = 42). Heatmap colors indicate relative expression levels.

                                   others showed very poor correlation (PSMB1; Supplemental Figure 2, B and C). These findings suggest
                                   that a sizeable fraction of proteins are not accurately reflected in transcriptome data and underscore the
                                   added value of proteome analysis.
                                        Next, we performed group GSEA of canonical pathways and biological processes. These analyses con-
                                   firmed the divergent biological functions of tumor and the tumor microenvironment. Global pathway and
                                   signature analysis revealed characteristic pathways, such as ECM organization, complement cascade, and
                                   epithelial-mesenchymal transition, for the stroma (Figure 2C; Hallmark gene sets). In epithelial samples,
                                   enrichment of spliceosome and glycan biosynthesis signatures were found (Figure 2D; KEGG pathway
                                   gene sets). These associations confirm the biology known to underlie the epithelial and stromal compart-
                                   ments in PDAC. Moreover, the high enrichment for cancer cell populations also allowed the identification
                                   of less-explored biological processes. This includes, for example, oxidative phosphorylation, which was not
                                   recognized in bulk human tissue samples that largely reflect stromal GSEA signatures (Figure 2, C and D).

insight.jci.org   https://doi.org/10.1172/jci.insight.138290                                                                                                4
RESEARCH ARTICLE

Figure 2. Successful LCM yields compartment-specific protein identification and biology enrichment. (A) Unsupervised hierarchical clustering of known
tumor and stromal protein markers shows mutually exclusive expression patterns. (B) ssGSEA of previously published and newly created mouse/human
PDX tumor and stroma gene sets (17) was performed, showing enrichment in concordance with compartment specificity. Data are shown in heatmap. Each
column represents a tumor (n = 15) or stroma sample (n = 16). Each row represents a gene set that was used for enrichment. Colors indicate the enrichment
score. (C) Radar plots of GSEA performed on “Hallmarks of cancer” and “KEGG pathways” (D) between sample origin reveal divergent biology of PDAC
tumor and stroma, where bulk samples resemble stromal biology. Significant enriched gene sets were identified with GAGE (56), and the top 5 gene sets
from each tissue origin with a P value of less than 0.05 are visualized.

                                       Furthermore, unsupervised clustering on the most variable compartment-specific proteins showed 2
                                  subclasses in the epithelial compartment, (Supplemental Figure 3A), of which cluster 2 showed a trend
                                  toward improved OS (Supplemental Figure 3B). Comparison of these groups with existing transcriptome
                                  tumor-specific subtypes revealed intermediate concordance (Supplemental Figure 3A), which might be due
                                  to sample size, precluding effective unsupervised clustering, or inapplicability of RNA-based classifications
                                  on enriched tumor compartment proteome data.
                                       Additionally, a mixture of classical and basal-like protein expression in a single sample was iden-
                                  tified in multiple tumors (Figure 2B), highlighting a degree of intratumor heterogeneity that likely
                                  results from the existence of populations of cells from different subtypes, as was recently described
                                  using gene expression data (24, 25). In the stroma compartment, 2 groups were identified (Supple-
                                  mental Figure 3A), and these associated with the Moffitt et al. stromal subtypes on the proteome level
                                  (17). The normal stroma subgroup showed a trend toward better disease-free survival (DFS, log-rank
                                  test, P = 0.081, Supplemental Figure 3C). The activated stromal phenotype was identified more often
                                  than normal stroma, as described previously (n = 12 vs. n = 4, respectively) (17). In conclusion, these
                                  data reveal a profound heterogeneity in the proteome landscape of PDAC, with complex biological
                                  functionality of both tumor and stroma.

insight.jci.org   https://doi.org/10.1172/jci.insight.138290                                                                                           5
RESEARCH ARTICLE insight.jci.org https://doi.org/10.1172/jci.insight.138290 6
RESEARCH ARTICLE

Figure 3. Differential expression of short-term versus long-term survival reveals prognostic protein markers. GSEA of compartment-specific
prognostic biology of (A) tumor and (B) stroma compartments. Red, poor prognosis gene sets; blue, good prognosis gene sets. The size of the bar
indicates the significant normalized enrichment score (NES). Volcano plots shows differential proteins between poor (n = 6) and good (n = 6) progno-
sis patients in the tumor (C) and stromal compartment (D) (P < 0.05, limma test). Filtering on compartment specificity (cut-off at significance of P <
0.1, limma test). Black triangles indicate compartment-specific filtering. Colored dots represent significant proteins. (E) Forest plot of meta-analysis
of compartment-specific prognostic markers from proteome analysis. Hazard ratio with confidence interval is visualized (*P < 0.05, **P < 0.01, ***P
< 0.001, ****P < 0.0001, random effects model). Of the 28 proteins, 17 were validated as poor prognostic markers in transcriptomic data sets.

                                       Compartment-specific proteins are associated with poor prognosis. Based on the results above, we hypothe-
                                  sized that LCM can enrich for prognostic proteins previously masked in bulk tissue analysis and that it can
                                  uncover tumor biology that underlies the poor disease outcome. To identify prognostic markers, patients
                                  with a short survival (n = 6) were compared with patients that survived more than 2 years following resec-
                                  tion of the tumor (n = 6). These analyses showed divergent compartment-specific biology associated with
                                  disease outcome (Figure 3, A and B). Tumor areas from patients with a poor outcome were enriched for
                                  DNA replication and multiple cardiovascular signatures (Figure 3A), which represent proliferation and
                                  contractility. Importantly, tumor and stromal areas of patients with poor outcomes both showed enrichment
                                  for ECM receptor interaction, emphasizing the interaction of these compartments. Stroma from patients
                                  with a worse survival was enriched for focal adhesion pathway genes (Figure 3B), previously described as
                                  possible mediators of protumorigenic mechanosignaling (6). The majority of prognostic proteins identified
                                  in the stromal compartment by our approach were not specifically expressed in the microenvironment but
                                  were also found expressed in tumorous areas. After filtering for compartment specificity, 23 epithelial (Fig-
                                  ure 3C) and 5 stromal proteins (Figure 3D) were found to associate with poor prognosis.
                                       A meta-analysis based on previously published transcriptomic data sets was implemented for further
                                  validation of the identified markers (15–17, 26–28). Of 28 poor prognostic proteins identified, 17 were val-
                                  idated in the meta-analysis (Figure 3E), of which 15 were from the tumor and 2 from the stromal compart-
                                  ment, respectively. Additionally, of the 28 proteins, 16 were previously described in PDAC biology (Table
                                  2), supporting the validity of our approach.
                                       Next, prognostic stromal and epithelial markers were validated by IHC in 2 large independent cohorts
                                  of patients with resected PDAC (Supplemental Table 3). The epithelial marker calretinin/calbindin 2
                                  (CALB2) was significantly correlated with OS in both cohorts (Figure 4, A and B; Supplemental Figure
                                  4A; and Supplemental Table 3; P = 0.009 and P = 0.006, respectively). Predicted stromal marker collagen
                                  α-1(XI) chain (COL11A1) was significantly correlated with survival in the first independent cohort (Figure
                                  4, C and D; P = 0.016); however, in the second validation cohort, no significance was observed (Supple-
                                  mental Table 3 and Supplemental Figure 4B). This might be explained by the use of a tissue microarrays
                                  (TMAs) with cores selected for high tumor cell content that are therefore less representative of the stroma.
                                       Identification of drug targets against PDAC. PDAC treatment currently depends on combinations of non-
                                  targeted cytotoxics (11, 12). The addition of tyrosine kinase inhibitors (TKIs) could expand the horizon for
                                  PDAC treatment, but currently available TKIs have not shown sufficient efficacy. We hypothesize that stro-
                                  mal proteins have masked targetable epithelial proteins in bulk proteome analyses, and we performed dif-
                                  ferential analysis of bulk samples versus the tumor compartment. Focusing on targetable receptor tyrosine
                                  kinases (RTKs), we identified 2 targetable RTKs in the LCM tumor cell compartment: epidermal growth
                                  factor receptor 1 (EGFR) and ephrin type-A receptor 2 (EPHA2; Figure 5A and Supplemental Figure 5A).
                                  EGFR has previously been targeted in an unselected population of patients with PDAC; the results of this
                                  study showed limited survival benefit (29). EPHA2 has not been targeted in clinical trials with patients
                                  with PDAC, whereas it has shown preclinical potential in modulating the immune evasive characteristic of
                                  PDAC (30). Indeed, a panel of PDAC cell lines showed variable EPHA2 expression (Supplemental Figure
                                  5B), representative of the variable EPHA2 expression identified in our tumor compartment (Figure 5A).
                                  We selected 2 cell lines, Capan-2 and Hs766t, with high EPHA2 expression and phosphorylation to func-
                                  tionally evaluate EPHA2. Downregulation of EPHA2 by shRNAs (Supplemental Figure 5C) resulted in a
                                  reduced proliferation rate in Capan-2 cells (Figure 5B) but not in Hs766t cells (Supplemental Figure 5D),
                                  possibly explained by the higher relative phosphorylation of EPHA2 in the Capan-2 cell line (Figure 5D).
                                       Recently, ALW-41-27, a EPHA2-specific inhibitor, was identified and was shown to target EPHA2 suc-
                                  cessfully in preclinical studies in non–small cell lung carcinoma (31). Exposure to this drug resulted in sub-
                                  stantial inhibition of proliferation in a dose-dependent manner in PDAC cells (Figure 5C), with the stron-
                                  gest effect again found in Capan-2 cells, which have the highest phosphorylation of this kinase (Figure 5D).

insight.jci.org   https://doi.org/10.1172/jci.insight.138290                                                                                           7
RESEARCH ARTICLE
Table 2. Compartment-specific prognostic proteins
Stromal proteins
Protein FC P value Poor (n) Good (n) Meta- Known in Staining on
analysis PDAC HPA
AEBP1 1.4 0.0424 6 6 No No Both
C1QTNF5 8.1 0.0005 6 1 No No Stroma
COL11A1 4.8 0.0422 6 3 Yes Yes (49) NS
FHL3 4.8 0.0477 6 3 No Yes (57) NS
MFGE8 1.4 0.0440 6 6 Yes No Both
Tumor proteins
AHNAK2 6.2 0.0369 6 3 Yes Yes (58) Tumor
AKAP8L 4.7 0.0182 3 0 No No Tumor
ANXA8 9.5 0.0006 6 1 Yes Yes (59) NS
BAIAP2 5.8 0.0109 6 2 Yes No Tumor
CALB2 6.6 0.0026 6 2 Yes Yes (60) Tumor
CD151 6.7 0.0032 4 0 Yes Yes (61) Tumor
CDC42BPA 6.0 0.0166 5 1 No Yes (62) Tumor
CES2 5.6 0.0436 5 1 No Yes (63) Tumor
DERL1 6.7 0.0087 4 1 Yes Yes (64) Tumor
DYNLT3 5.6 0.0175 3 0 No No Tumor
ERGIC2 5.0 0.0365 3 0 Yes No Tumor
F3 7.2 0.0038 4 0 Yes Yes (65) Tumor
KRT19 9.7 0.0098 5 1 Yes Yes (66) Tumor
MUC4 5.5 0.0040 6 1 Yes Yes (67) Tumor
OSTC 5.1 0.0228 6 2 No No NS
PSCA 8.8 0.0023 5 0 Yes Yes (68) ND
RFC4 5.8 0.0147 5 1 Yes No Tumor
S100A11 1.2 0.0336 6 3 Yes Yes (69) Tumor
SLC2A1 3.8 0.0412 4 1 Yes Yes (70) Tumor
SRP14 5.8 0.0089 6 2 No No NS
TCIRG1 1.4 0.0364 6 5 Yes No Tumor
TRIM29 6.1 0.0322 6 3 No Yes (71) Tumor
VANGL1 5.0 0.0111 4 0 No No Tumor
FC, log2-transformed fold change, patients with poor outcomes (Poor) vs. those with good outcomes (Good); HPA,
Human Protein Atlas (http://www.proteinatlas.org/); ND, not detected; NS, no staining performed. Bold font indicates
proteins after meta-analysis with significant associations (meta-analysis with random effects model).
Drug treatment resulted in a reduction of EPHA2 phosphorylation on the activating site phospho-Y588
within 2 hours (Figure 5D), confirming reduced activation. After 24 hours, surviving cells expressed less
total EPHA2, indicating a possible selection for an EPHA2-negative cell population.
To determine the contributions of EPHA2 activity to tumor cell migration, Transwell migration
assays were performed using EGF or FCS as chemoattractants. ALW-41-27 strongly inhibited migra-
tion (Figure 5E, P = 0.0005 and P = 0.0029, respectively). Interestingly, EPHA2-silenced cells were
highly adherent to cell culture substrates and failed to release during trypsinization (Supplemental Fig-
ure 5E), providing further proof for a possible role in attachment and migration of these cells. Given
the contributions of tumor cell migration to metastatic disease, these results and those from the prolif-
eration assays suggest that the inhibition of EPHA2 could be very effective against PDAC in a clinical
setting as well and underlines the usefulness of the current data set for exploration of PDAC biology.
Discussion
This study reports an in-depth proteomic analysis of LCM PDAC. It disentangles the stromal and
tumor cell contributions to the proteome landscape of this aggressive tumor. The analyses performed
show that the abundance of stroma in bulk tissue analysis masks important tumor biology and under-
scores the added value of compartment-specific analysis. We found that protein heterogeneity was
insight.jci.org https://doi.org/10.1172/jci.insight.138290 8RESEARCH ARTICLE
Figure 4. Validation of prognostic proteins CALB2 and COL11A1. (A) Representative IHC of TMA cores with CALB2-positive staining (original magnifi-
cation, ×10 [left]; ×40 [right]). (B) Kaplan-Meier survival analysis of high (red, n = 47) or low (blue, n = 48) expression of CALB2 in the first independent
cohort shows significant correlation to OS (median OS, 13.5 versus 20 months, P < 0.0092, log-rank test). (C) Representative IHC of TMA cores with
CALB2-positive and -negative staining (original magnification, ×10 [left]; ×40 [right]). Additional views of a positive and negative area inside 1 tumor core
are highlighted. (D) Kaplan-Meier analysis of high (red, n = 50) or low (blue, n = 45) expression of COL11A1 shows correlation in the first cohort (median OS,
15 versus 19 months, P < 0.016, log-rank test).
more pronounced in tumorous areas as compared with stroma and used this to identify prognostic
markers and therapeutic targets.
PDAC is known to harbor relatively small tumor islands in vast areas of stroma, and the biology
of both compartments effects multiple oncogenic pathways and thus patient outcome. Despite this
knowledge, most efforts to unravel tumor biology have relied on genetic aberrations and transcrip-
tomic networks (15–17, 27). Previous proteomic studies exploring PDAC used bulk tumor samples,
performed LCM on very small sample sizes, did not reach the depth of proteome landscape currently
described, or did not evaluate the stroma (32, 33). Using our cohort and pipeline, we were able to find
a much higher degree of heterogeneity in the tumor compartment compared with the stroma. This can
be explained by (a) the larger variety of unique proteins identified in tumor areas and (b) the fact that
tumor cells are genetically unstable (compared with stromal cells) and that this is likely reflected in the
heterogeneous proteome landscape (34).
Proteins known to associate with previously established RNA-based tumor subtypes (e.g., the Moffitt
classification, ref. 17) were identified in our landscape. However, tumors were occasionally found to express
proteins from both basal-like and classical subtypes. We propose that this results from the presence of
mixed populations within a tumor, as was also found in recent single-cell RNA-Seq analyses of PDAC (25).
Importantly, “normal” and “activated” stromal subtypes were fully recapitulated in our data, validating
previously described stroma subtypes. Future studies on large cohorts are needed to validate the discrimina-
tive power of transcriptomic subtypes in proteome data.
insight.jci.org https://doi.org/10.1172/jci.insight.138290 9RESEARCH ARTICLE insight.jci.org https://doi.org/10.1172/jci.insight.138290 10
RESEARCH ARTICLE

Figure 5. EPHA2 phosphorylation in PDAC cells conveys sensitivity to the inhibitor ALW-II-27. (A) Differential expression of EPHA2 between bulk (n =
16) and isolated epithelial compartments (n = 15) identified EPHA2 as specifically but heterogeneously expressed in the tumor compartment (limma test,
corrected for multiple testing, P = 0.05) (mean ± SD). (B) Reduction of EPHA2 expression by shRNA in Capan-2 cells significantly reduced proliferation rate
(P < 0.001, unpaired 2-way t test) (mean ± SEM) (n = 7). (C) Dose-response curves of cell lines treated with ALW-II-27. (D) Western blot analysis of cells
after treatment with ALW-II-27 shows reduction of EPHA2 expression and phosphorylation of activation site pY-588. See complete unedited blots in the
supplemental material. (E) Transwell migration of Capan-2 cells was reduced upon pretreatment with 1 μM ALW-II-27, irrespectively of attractant (EGF, P =
0.0005, FCS P = 0.0029, 2-tailed t test with Welch’s correction) (mean ± SEM) (n = 3).

                                        Another proteome approach to evaluate extracellular matrix content is purification of the matri-
                                   some, a technique that measures enriched proteins after degradation of cellular content. However, it
                                   does not take into account the importance of cellular communication and warrants a large volume of
                                   bulk tumor samples, making it less appealing for biopsies or other samples of limited quantity. One
                                   study explored the matrisome of PDAC (35) and indicated that prognostic proteins originate mainly
                                   from the tumor cells, but this study did not measure contributions from both compartments. Impor-
                                   tantly, 4 (AEBP1, C1QTNF5, COL11A1, and MFGE8) of the 5 potential prognostic stromal proteins
                                   identified in the current study were significantly upregulated in the PDAC matrisome compared with
                                   normal tissue, validating our results on proteome level. Large PDAC transcriptomic (RNA) data sets
                                   have been published, and we validated our candidate marker proteins in a meta-analysis of those gene
                                   expression data. We confirmed several known prognostic pancreatic markers and validated CALB2 as
                                   a poor prognostic tumor marker and COL11A1 as a poor prognostic stromal marker in PDAC. CALB2
                                   has previously been described as a diagnostic marker and tumor-promoting protein in mesothelioma
                                   (36). It is associated with poor prognostic basal-like subtypes in other cancers (37). This protein plays
                                   an important role in intracellular calcium regulation, and it is necessary for vital cellular functions
                                   and cell contractility (38). Its role in cancer has not been fully explored; however, the poor prognostic
                                   value could relate to altered mechanobiology known to contribute to PDAC (6). The validated stromal
                                   prognostic marker demonstrated in this study, COL11A1, is a recently discovered effector of stromal
                                   activation and is suggested to play a pan-cancer role in tumor-stroma interaction (39).
                                        Additionally, the comparison of bulk versus tumor-enriched samples showed the advantage of enrich-
                                   ment in proteomic studies, since these, as do genomic and transcriptomic studies, do not rely on amplification
                                   methods. For example, the presence of several kinases was masked in proteomes of bulk tumor. However, by
                                   enriching for tumor areas, we uncovered EPHA2 and functionally validated this kinase as therapeutic target
                                   in PDAC. shRNA knockdown was effective against cell growth in 1 cell line of 2 tested, which correlated with
                                   the phosphorylation of EPHA2. An additional explanation could be that, upon silencing, a bias is introduced
                                   for EPHA2-independent clones. A previously published study in which silencing of EPHA2 was achieved by
                                   siRNAs showed an antiproliferative effect on PDAC cells upon knockdown (40). Interestingly, EPHA2 was
                                   recently identified as a key regulator of the PDAC immune-suppressive microenvironment (30). Experimental
                                   work evaluating additional cell lines for the EPHA2-driven effect using inducible knockdown systems would
                                   strengthen study results; however, our study did revealed strong tumor-inhibiting and antimigration effects of
                                   the EPHA2 inhibitor ALW-41-27 in PDAC cells with high EPHA2 expression. This finding warrants further
                                   evaluation of this compound against PDAC.
                                        There are several limitations to our study, the most important being the relatively small sample size. For
                                   instance, disease stage did not correlate significantly with survival due to small group size. However, this
                                   study remains the largest PDAC proteome landscape to date to our knowledge, and our approach added to
                                   the current knowledge on protein localization in PDAC and validated previously described transcriptomic
                                   stromal subtypes. In addition, despite the lack of association of outcome with staging, associations of sur-
                                   vival with stromal proteome subtypes were strong. The limited sample size might also restrict evaluation of
                                   the full heterogeneity present in PDAC. This was apparent from the discordance between our unsupervised
                                   clustering analysis and the RNA-based tumor cell–specific classification.
                                        A practical limitation was the surface needed to yield optimal proteome exploration. Adding to this
                                   is the fact that proteomics does not incorporate amplification steps, and low abundance proteins can be
                                   underrepresented. Therefore, to create the deepest data, identification and exclusion of possible singular
                                   tumor cells that may exist in the isolated stromal areas was not performed, which could contaminate the
                                   stromal protein landscape to some degree. Despite this limitation, we were able to create a PDAC data set
                                   of depth, with very little cross-compartment contamination.

insight.jci.org   https://doi.org/10.1172/jci.insight.138290                                                                                             11
RESEARCH ARTICLE
The functional experiments were hampered by the limited number of cell lines tested, and future stud-
ies will have to be performed to formally prove the association of EPHA2 levels and phosphorylation with
response to EPHA2 inhibitors. Despite this, our comprehensive exploration by IHC and functional investi-
gation of markers/targets underscores the use of our data set for future studies.
In conclusion, we report a large-scale compartment-specific proteome landscape of PDAC. With this
data set, future bulk tumor proteome data sets can be deconvolved and annotated. We have shown that our
data can be the basis for in vitro analysis of targets of tumor signaling and bidirectional stimulatory com-
munication between PDAC and stromal cells. Moreover, we have shown that prognostic genes can exist in
tumor or its microenvironment or can be expressed by both. Our data underline the need to understand the
biology of PDAC on multiple levels and warrant future large-scale proteome studies of PDAC.
Methods
Further details are provided in the Supplemental Methods.
Sample collection. Snap-frozen tumor samples were evaluated for quality and tumor percentage. The
workflow is shown in Figure 1A. Sixteen samples were eligible for further LCM analysis and prepared as
described previously (41). Additionally, unseparated bulk tumor of 11 matched and 5 unmatched samples
was prepared for single-shot MS/MS analysis. Two patients suffered from postoperative complications and
were excluded from survival analysis but included in tumor biology analysis.
LCM procedure. LCM was performed on the Leica LMD7000 instrument to yield a total surface den-
sity of 3 × 106 μm2 cells per compartment. Selected areas were captured in 0.1% RapiGest SF Surfactant
(Waters) and stored until further use. Samples were sonicated and reduced to a final concentration of 5 mM
dithiothreitol (MilliporeSigma) and 15 mM iodoacetamide (MilliporeSigma). Sequencing-grade modified
trypsin (Promega) was added overnight to a final concentration of 7 ng/μl. Digestion was stopped with
acidification by trifluoroacetic acid (MilliporeSigma). The peptide mixture was centrifuged, and the super-
natant was transferred to a glass-lined MS/MS auto sampler vials. Samples were brought to a volume of 20
μl and stored at –80°C until further analysis.
Peptide preparations of PDX models and bulk tumor tissue. Tissue from 10 previously established PDX
models was used for proteome analysis (22). NSG mice were bred in-house. A minimum of 100 mg tissue
was digested in lysis buffer (9 M urea, 20 mM HEPES pH 8.0, 1 mM Na3VO4, 2.5 mM Na4P2O7, 1 mM
Na2C3H7PO6). 50 μg protein was loaded on a NuPAGE 4%–12% gradient gel (Invitrogen). Proteins were
digested and extracted according to our whole-in-gel protocol, as described previously (42). Bulk PDAC
tumors were lysed, and in-solution digestion was performed according to the protocol of our laboratories
after reduction and alkylation (43).
Nano-LC-MS/MS. Proteins were identified by nano-LC-MS/MS, as described previously (42). Peptides
were separated by an Ultimate 3000 nano-LC-MS/MS system (Dionex LC-Packings). Eluting peptides
were ionized into a Q Exactive HF mass spectrometer (Thermo Fisher Scientific). Intact masses were mea-
sured in the orbitrap using an AGC target value of 3 × 10⁶ charges. The top 15 peptide signals were sub-
mitted to MS/MS in a higher-energy collision cell in MS/MS. MS/MS spectra were acquired at resolution
17.500 (at m/z 200) in the orbitrap.
Protein annotation and data analysis. MS/MS spectra were searched against the Swissprot FASTA file (LCM
data: release March 2017; 42,161 entries, canonical and isoforms; proteome profiles from PdX data were searched
with both human and mouse fasta files;uniprot_human_referenceproteome_2014_01_NO_fragments_42104en-
tries.fasta, 61,552 entries); Uniprot_Mus_musculus_reference_proteome_2015_06_NO_FRAGMENTS_
Canonical and isoforms _34331entries.fasta, 42,296 entries) using MaxQuant 1.5.8.0 (44). Enzyme specificity
was set to trypsin, and up to 2 missed cleavages were allowed. Peptide and protein identifications were filtered
at an FDR of 1% using the decoy database strategy. The minimal peptide length was 7 amino acids. A match-
between-runs setting was implemented for analysis of low abundant proteins in the LCM database. For the PDX
data, peptides mapped to solely human proteins were retained and subsequently collapsed in protein groups.
Protein compartment specificity was correlated to mouse- and human-specific proteins identified from PDX
PDAC tumors (protein had to be uniquely mouse or human specific). The mass spectrometry proteomics data
have been deposited at the ProteomeXchange Consortium via the PRIDE (45) partner repository (data set iden-
tifiers PXD011289 and PXD017393). Protein and peptide data are available in Supplemental Data Files 1–8.
RNA-Seq of PDX models and correlation with protein expression. RNA-Seq of PDX was previously per-
formed and described (EMBL-EBI ArrayExpress code E-MTAB-6830) (46). In short, total RNA was
insight.jci.org https://doi.org/10.1172/jci.insight.138290 12RESEARCH ARTICLE
extracted from PDX model tissue and amplified with the Total Prep RNA amplification kit (Illumina).
RNA was sequenced on the Illumina HiSeq2500. Mapped reads were mapped to both mouse and human
genomes. The RNA transcripts mapping solely the human genome were retained for further analysis.
RPKM data were log2 transformed and filtered to include transcripts with an average read count ≥1 in all
samples, obtaining 14,809 RNA transcripts in total. Human-specific spectral counts were log2 transformed
and filtered to include proteins with an average spectral count ≥3 in all samples, obtaining 1705 protein
groups in total. Spearman’s correlation was applied to the resulting transcriptome-proteome matched file
with 1627 genes (proteins were collapsed at gene level) to evaluate PDX transcriptome and proteome cor-
relation. Methodology was described previously by Wang et al. (23).
In silico validation of prognostic markers. Data from publicly available transcriptomic (microarray or RNA-
Seq) data sets (15–17, 26–28) with survival data were downloaded from GEObase, and each data set was
scaled to a mean of 0, with a standard deviation of 1 to allow meta-analysis. Univariate cox proportional
hazard regression models were evaluated for genes of interest. The Metafor R package (47) was used to
perform meta-analysis validation of identified prognostic markers.
IHC validation on TMAs. Proteins of interest in both compartments, COL11A1 and CALB2, were
evaluated in 2 independent cohorts (n = 95 and n = 95) by staining TMAs as described previously (48).
Assessment of IHC staining of COL11A1 was performed in 3 tumor cores per patient containing represen-
tatives regions of the desmoplastic reaction. Expression was evaluated in relation to the stromal surface,
as described previously (49). IHC of CALB2 was evaluated in the tumorous areas, taking into account
positivity and intensity of the staining, as described previously (50).
Cell culture. PANC1 cells (ATCC) were cultured in RPMI medium (Lonza). Capan-2 cells (ATCC)
and Hs766t cells (ATCC) were cultured in DMEM medium (Lonza). Media was supplemented with 10%
heat-inactivated fetal calf serum (Biowest) and 1% penicillin-streptomycin (Lonza). An immortalized pan-
creatic ductal cell line (HPDE, supplied by Ming Tsao, Ontario Cancer Institute, Toronto, Ontario, Cana-
da) (51) was cultured in supplemented KGM medium (Lonza).
Western blot validation of EPHA2 expression. Cell lysates from PANC1, Hs766t, Capan-2, and HPDE cells
were created with diluted ×10 RIPA buffer (Abcam) containing protease and phosphatase inhibitors. 20
μg protein was used for Western blot. Primary antibodies were incubated in 5% BSA (MilliporeSigma) in
PBST followed by secondary antibodies in 5% blocking buffer. Visualization was performed by an Uvitec
Imaging station (Cleaver Scientific). A list of antibodies is provided in the Supplemental Methods.
Stable EPHA2 knockdown. Lentiviral plasmids were produced by transfecting HEK293T cells with
EPHA2-targeting pLKO.1 constructs (MISSION shRNA Library clone numbers TRCN0000006403 and
TRCN0000197131) and a scrambled control (shc002). Transfected supernatant was collected after 48 hours
and filtered through a 0.45 μm filter (EMDMillipore). At 30% confluence, PDAC cell lines Capan-2 and
Hs766t were transduced and subsequently selected after 48 hours with 2 μg/mL puromycin (MilliporeSig-
ma). Knockdown efficiency was evaluated by Western blot as described above.
In vitro validation of drug target. Cells were plated in 96-wells plates and allowed to attach overnight.
Growth was evaluated over 72 hours with respect to the control at the start of the experiment. To evaluate
proliferation, the doubling time was calculated. A specific EPHA2 inhibitor, ALW-II-41-27 (APExBIO),
was evaluated for cytotoxic effect. DMSO (MilliporeSigma) was used as control. Effect on cell prolifera-
tion was quantified with Sulforhodamine B (MilliporeSigma) protein staining as described previously (52).
Migration was evaluated by Transwell migration as described before (53) following 15 minutes pretreat-
ment. The AUC was calculated for each replicate of the migration curve.
Statistics. Data were analyzed with R (version 3.5.2.). Zeros were imputed based on normal distribu-
tion SD of log-transformed intensity data before differential expression analysis. Differential compart-
ment expression was tested by paired statistics analysis (Limma package) (54) and Benjamini-Hochberg
corrected for multiple testing. Two patients succumbed to postoperative complication (PDAC10 and
PDAC17) and were excluded from the survival analysis. These samples were, however, included in the
proteomics and downstream nonclinical analyses. Prognostic proteins were identified by group compari-
son (short OS, 2 years). GSEA (55) was performed in R. In vitro experimental
comparisons were evaluated by paired or unpaired 2-tailed Student’s t test. Correlation of clinicopatholog-
ical characteristics and gene expression with DFS/OS were evaluated by Kaplan-Meier and log-rank test.
The prognostic value of IHC scoring was tested with uni- and multivariate analysis. Error bars show the
mean ± SEM. A P value of < 0.05 was considered statistically significant.
insight.jci.org https://doi.org/10.1172/jci.insight.138290 13RESEARCH ARTICLE
Study approval. The work described was carried out in accordance with the Declaration of Helsinki.
Approval for tissue collection was obtained from the local medical ethical committees at the Amsterdam
UMC (protocol 14038 for METC VUmc and 2011_126 and 201_181 for AMC, both Amsterdam, the
Netherlands). Ethical approval for the validation cohorts was received from Comitato di Bioetica Azienza
Ospedaliero-Universitaria Pisana, University Hospital of Cisanello, Pisa, Italy (protocol 37677; study no.
3909; July 3, 2013)). All patients provided informed consent for participation in the study. Animal work
was performed in a previous study according to protocols approved by the animal experiment ethical com-
mittee at the Amsterdam UMC (protocol DTB102348, LEX102774).
Author contributions
TYSLL and NF performed LCM. TYSLL, GM, and TVP performed bioinformatic analysis. TYSLL,
LLM, NF, and EG were involved with selection of patient material, clinical data collection, and statisti-
cal analyses. TYSLL, NF, and NCTVG performed pathological review of LCM material and performed
IHC staining. JK, SRP, CRJ, and TVP were responsible for experimental design and mass spectrometry.
TYSLL, HWMVL, GK, EG, and MFB were involved with experimental design and manuscript prepa-
ration. TYSLL, MFB, and BK performed experimental validation. CRJ, EG, and MFB coordinated and
supervised the study. All the authors critically reviewed the manuscript.
Acknowledgments
We would like to acknowledge C. Maurer for his help with the meta-analysis of PDAC transcriptomic data,
and all the patients participating in our studies that made this research possible. This work was supported by a
Cancer Center Amsterdam Alliantie-AIO grant (to EG, MFB, and CRJ), the Bennink Foundation (to GK, EG,
and TYSLL), the Dutch Cancer Society (10212 to CRJ, MFB, and EG), and an Italian Association for Cancer
Research AIRC/Start-Up grant, Italy (to EG). The Netherlands Organization for Scientific Research (Mid-
delgroot project no. 91116017, to CRJ) is acknowledged for supporting the mass spectrometry infrastructure.
Address correspondence to: Elisa Giovannetti, Amsterdam UMC, Vrije Universiteit Amsterdam,
Department of Medical Oncology, De Boelelaan 1117, 1081 HV Amsterdam, Netherlands. Phone:
31.20.444.22.67; Email: e.giovannetti@amsterdamumc.nl. Or to: Maarten F. Bijlsma, Amsterdam UMC,
University of Amsterdam, Laboratory for Experimental Oncology and Radiobiology, Meibergdreef 9,
1105 AZ Amsterdam, Netherlands. Phone: 31.20.5664824; Email: m.f.bijlsma@amsterdamumc.nl.
1. Yadav VK, De S. An assessment of computational methods for estimating purity and clonality using genomic data derived from
heterogeneous tumor tissue samples. Brief Bioinform. 2015;16(2):232–241.
2. Pietras K, Östman A. Hallmarks of cancer: interactions with the tumor stroma. Exp Cell Res. 2010;316(8):1324–1331.
3. Yoshihara K, et al. Inferring tumour purity and stromal and immune cell admixture from expression data. Nat Commun.
2013;4:2612.
4. Wilson JS, Pirola RC, Apte MV. Stars and stripes in pancreatic cancer: role of stellate cells and stroma in cancer progression.
Front Physiol. 2014;5:1–11.
5. Jiang H, et al. Targeting focal adhesion kinase renders pancreatic cancers responsive to checkpoint immunotherapy. Nat Med.
2016;22(8):851–860.
6. Laklai H, et al. Genotype tunes pancreatic ductal adenocarcinoma tissue tension to induce matricellular fibrosis and tumor pro-
gression. Nat Med. 2016;22(5):497–505.
7. Rhim AD, et al. Stromal elements act to restrain, rather than support, pancreatic ductal adenocarcinoma. Cancer Cell.
2014;25(6):735–747.
8. Steins A, et al. High-grade mesenchymal pancreatic ductal adenocarcinoma drives stromal deactivation through CSF-1. EMBO
Rep. 2020;21(5):e48780.
9. Öhlund D, et al. Distinct populations of inflammatory fibroblasts and myofibroblasts in pancreatic cancer. J Exp Med.
2017;214(3):579–596.
10. Siegel RL, Miller KD, Jemal A. Cancer statistics, 2020. CA Cancer J Clin. 2020;70(1):7–30.
11. Von Hoff DD, et al. Increased survival in pancreatic cancer with nab-paclitaxel plus gemcitabine. N Engl J Med.
2013;369(18):1691–1703.
12. Conroy T, et al. FOLFIRINOX versus gemcitabine for metastatic pancreatic cancer. N Engl J Med. 2011;364(19):1817–1825.
13. Conroy T, et al. FOLFIRINOX or gemcitabine as adjuvant therapy for pancreatic cancer. N Engl J Med. 2018;379(25):2395–2406.
14. Neoptolemos JP, et al. Comparison of adjuvant gemcitabine and capecitabine with gemcitabine monotherapy in patients with
resected pancreatic cancer (ESPAC-4): a multicentre, open-label, randomised, phase 3 trial. Lancet. 2017;389(10073):1011–1024.
15. Collisson E a, et al. Subtypes of pancreatic ductal adenocarcinoma and their differing responses to therapy. Nat Med.
2011;17(4):500–503.
insight.jci.org https://doi.org/10.1172/jci.insight.138290 14RESEARCH ARTICLE
16. Bailey P, et al. Genomic analyses identify molecular subtypes of pancreatic cancer. Nature. 2016;531(7592):47–52.
17. Moffitt RA, et al. Virtual microdissection identifies distinct tumor- and stroma-specific subtypes of pancreatic ductal adenocar-
cinoma. Nat Genet. 2015;47(10):1168–1178.
18. Maurer HC, et al. Experimental microdissection enables functional harmonisation of pancreatic cancer subtypes. Gut.
2019;68(6):1034–1043.
19. Funel N, Giovannetti E, Pollina LE, del Chiaro M, Mosca F, Boggi UCD. Critical role of laser microdissection for genetic, epi-
genetic and proteomic analyses in pancreatic cancer. Expert Rev Mol Diagn. 2011;Sep(7):695–701.
20. Braakman RBH, et al. Optimized nLC-MS workflow for laser capture microdissected breast cancer tissue. J Proteomics.
2012;75(10):2844–2854.
21. Aebersold R, Mann M. Mass-spectrometric exploration of proteome structure and function. Nature. 2016;537(7620):347–355.
22. Damhofer H, et al. Establishment of patient-derived xenograft models and cell lines for malignancies of the upper gastrointesti-
nal tract. J Transl Med. 2015;13(1):1–14.
23. Wang D, et al. A deep proteome and transcriptome abundance atlas of 29 healthy human tissues. Mol Syst Biol. 2019;15(2):1–16.
24. Hayashi A, et al. A unifying paradigm for transcriptional heterogeneity and squamous features in pancreatic ductal adeno-
carcinoma. Nat Cancer. 2020;1(1):59–74.
25. Peng J, et al. Single-cell RNA-seq highlights intra-tumoral heterogeneity and malignant progression in pancreatic ductal adeno-
carcinoma. Cell Res. 2019;29(9):725–738.
26. Winter C, et al. Google goes cancer: improving outcome prediction for cancer patients by network-based ranking of marker
genes. PLoS Comput Biol. 2012;8(5):e1002511.
27. Cancer Genome Atlas Research Network. Integrated genomic characterization of pancreatic ductal adenocarcinoma. Cancer
Cell. 2017;32(2):185–203.e13.
28. Yang S, et al. A novel MIF signaling pathway drives the malignant character of pancreatic cancer by targeting NR3C2. Cancer
Res. 2016;76(13):3838–3850.
29. Moore MJ, et al. Erlotinib plus gemcitabine compared with gemcitabine alone in patients with advanced pancreatic cancer: a
phase III trial of the National Cancer Institute of Canada Clinical Trials Group. J Clin Oncol. 2007;25(15):1960–1966.
30. Markosyan N, et al. Tumor cell-intrinsic EPHA2 suppresses anti-tumor immunity by regulating PTGS2 (COX-2). J Clin Invest.
2019;129(9):3594–3609.
31. Amato KR, et al. Genetic and pharmacologic inhibition of EPHA2 promotes apoptosis in NSCLC. J Clin Invest.
2014;124(5):2037–2049.
32. Takadate T, et al. Nm23/nucleoside diphosphate kinase-A as a potent prognostic marker in invasive pancreatic ductal car-
cinoma identified by proteomic analysis of laser micro-dissected formalin-fixed paraffin-embedded tissue. Clin Proteomics.
2012;9(1):8.
33. Leca J, et al. Cancer-associated fibroblast-derived annexin A6+ extracellular vesicles support pancreatic cancer aggressiveness.
JCI. 2016;126(9):1–17.
34. Nones K, et al. Genome-wide DNA methylation patterns in pancreatic ductal adenocarcinoma reveal epigenetic deregulation of
SLIT-ROBO, ITGA2 and MET signaling. Int J Cancer. 2014;135(5):1110–1118.
35. Tian C, et al. Proteomic analyses of ECM during pancreatic ductal adenocarcinoma progression reveal different contributions
by tumor and stromal cells. Proc Natl Acad Sci U S A. 2019;116(39):19609–19618.
36. Blum W, Schwaller B. Calretinin is essential for mesothelioma cell growth/survival in vitro: a potential new target for malignant
mesothelioma therapy? Int J Cancer. 2013;133(9):2077–2088.
37. Taliano RJ, et al. Calretinin expression in high-grade invasive ductal carcinoma of the breast is associated with basal-like sub-
type and unfavorable prognosis. Hum Pathol. 2013;44(12):2743–2750.
38. Cui C, Merritt R, Fu L, Pan Z. Targeting calcium signaling in cancer therapy. Acta Pharm Sin B. 2017;7(1):3–17.
39. Jia D, et al. A COL11A1-correlated pan-cancer gene signature of activated fibroblasts for the prioritization of therapeutic tar-
gets. Cancer Lett. 2016;382(2):203–214.
40. Duxbury MS, Ito H, Zinner MJ, Ashley SW, Whang EE. EphA2: a determinant of malignant cellular behavior and a potential
therapeutic target in pancreatic adenocarcinoma. Oncogene. 2004;23(7):1448–1456.
41. Caponi S, et al. The good, the bad and the ugly: a tale of miR-101, miR-21 and miR-155 in pancreatic intraductal papillary
mucinous neoplasms. Ann Oncol. 2013;24(3):734–741.
42. Piersma SR, Warmoes MO, de Wit M, de Reus I, Knol JC, Jiménez CR. Whole gel processing procedure for GeLC-MS/MS
based proteomics. Proteome Sci. 2013;11(1):17.
43. Piersma SR, et al. Feasibility of label-free phosphoproteomics and application to base-line signaling of colorectal cancer cell
lines. J Proteomics. 2015;127(Pt B):247–258.
44. Cox J, Mann M. MaxQuant enables high peptide identification rates, individualized p.p.b.-range mass accuracies and pro-
teome-wide protein quantification. Nat Biotechnol. 2008;26(12):1367–1372.
45. Vizcaíno JA, et al. 2016 update of the PRIDE database and its related tools. Nucleic Acids Res. 2016;44(D1):D447–D456.
46. Dijk F, et al. Unsupervised class discovery in pancreatic ductal adenocarcinoma reveals cell-intrinsic mesenchymal features and
high concordance between existing classification systems. Sci Rep. 2019;10(1):337.
47. Viechtbauer W. Conducting meta-analyses in R with the metafor. J Stat Softw. 2010;36(3):1–48.
48. Le Large TYS, et al. Proteomic analysis of gemcitabine-resistant pancreatic cancer cells reveals that microtubule-associated pro-
tein 2 upregulation associates with taxane treatment. Ther Adv Med Oncol. 2019;11:1758835919841233.
49. García-Pravia C, et al. Overexpression of COL11A1 by cancer-associated fibroblasts: clinical relevance of a stromal marker in
pancreatic cancer. PLoS One. 2013;8(10):1–13.
50. Thapa B, et al. Calretinin but not caveolin-1 correlates with tumour histology and survival in malignant mesothelioma. Patholo-
gy. 2016;48(7):660–665.
51. Furukawa T, Duguid W, Rosenberg L, Viallet J, Galloway D, Tsao M. Long-term culture and immortalization of epithelial
cells from normal adult human pancreatic ducts transfected by the E6E7 gene of human papilloma virus 16. Am J Pathol.
1996;148(6):1763–1770.
insight.jci.org https://doi.org/10.1172/jci.insight.138290 15You can also read