RhizoVision Explorer: Open-source software for root and measurement standardization - Oxford Academic Journals
←
→
Page content transcription
If your browser does not render page correctly, please read the page content below
RhizoVision Explorer: Open-source software for
root   image    analysis  and    measurement
standardization
Anand Seethepalli1, Kundan Dhakal1, Marcus Griffiths1, Haichao Guo1, Gregoire T. Freschet2, Larry M.
York3,1†

                                                                                                       Downloaded from https://academic.oup.com/aobpla/advance-article/doi/10.1093/aobpla/plab056/6366354 by guest on 07 November 2021
1
  Noble Research Institute, LLC, Ardmore, OK 73401, USA
2
  Theoretical and Experimental Ecology Station, CNRS, 09200 Moulis, France
3
  Biosciences Division and Center for Bioenergy Innovation, Oak Ridge National Laboratory, Oak
Ridge, TN 37830, USA

                                                                       t
                                                                     ip
†
    To whom correspondence should be addressed. E-mail: yorklm@ornl.gov

                                                                   cr
                                                         us
                                              an
                                      M
                          ed
                   pt
          ce
Ac

© The Author(s) 2021. Published by Oxford University Press on behalf of the Annals of
     Botany Company.
This is an Open Access article distributed under the terms of the Creative Commons
     Attribution License (https://creativecommons.org/licenses/by/4.0/), which permits
     unrestricted reuse, distribution, and reproduction in any medium, provided the original
     work is properly cited.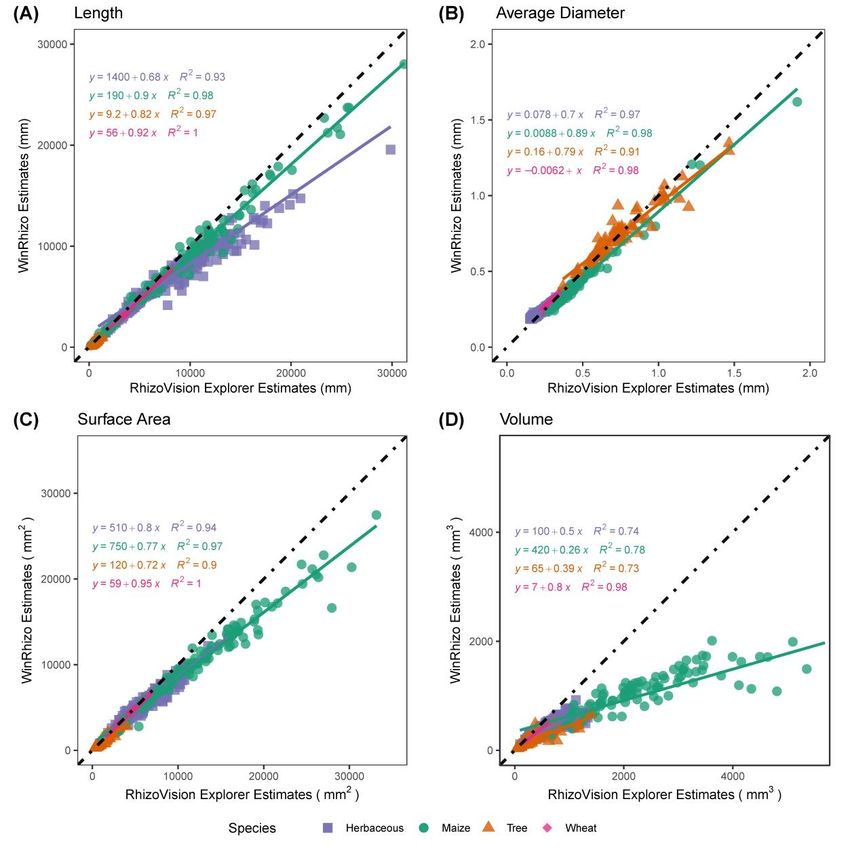
Abstract

Roots are central to the function of natural and agricultural ecosystems by driving plant acquisition
of soil resources and influencing the carbon cycle. Root characteristics like length, diameter, and
volume are critical to measure to understand plant and soil functions. RhizoVision Explorer is an
open-source software designed to enable researchers interested in roots by providing an easy-to-use
interface, fast image processing, and reliable measurements. The default broken roots mode is

                                                                                                        Downloaded from https://academic.oup.com/aobpla/advance-article/doi/10.1093/aobpla/plab056/6366354 by guest on 07 November 2021
intended for roots sampled from pots and soil cores, washed, and typically scanned on a flatbed
scanner, and provides measurements like length, diameter, and volume. The optional whole root
mode for complete root systems or root crowns provides additional measurements such as angles,
root depth, and convex hull. Both modes support providing measurements grouped by defined
diameter ranges, the inclusion of multiple regions of interest, and batch analysis. RhizoVision

                                                                                  t
                                                             ip
Explorer was successfully validated against ground truth data using a new copper wire image set. In
comparison, the current reference software, the commercial WinRhizoTM, drastically underestimated
volume when wires of different diameters were in the same image. Additionally, measurements

                                                           cr
were compared with WinRhizoTM and IJ_Rhizo using a simulated root image set, showing general
agreement in software measurements, except for root volume. Finally, scanned root image sets

                                                         us
acquired in different labs for the crop, herbaceous, and tree species were used to compare results
from RhizoVision Explorer with WinRhizoTM. The two software showed general agreement, except
that WinRhizoTM substantially underestimated root volume relative to RhizoVision Explorer. In the
                                               an
current context of rapidly growing interest in root science, RhizoVision Explorer intends to become a
reference software, improve the overall accuracy and replicability of root trait measurements, and
provide a foundation for collaborative improvement and reliable access to all.
                                       M

Keywords: ground truth, phenotyping, phenomics, rhizosphere, root system architecture, traits
                     e         d
                  pt
        ce
Ac

                                                                                                   2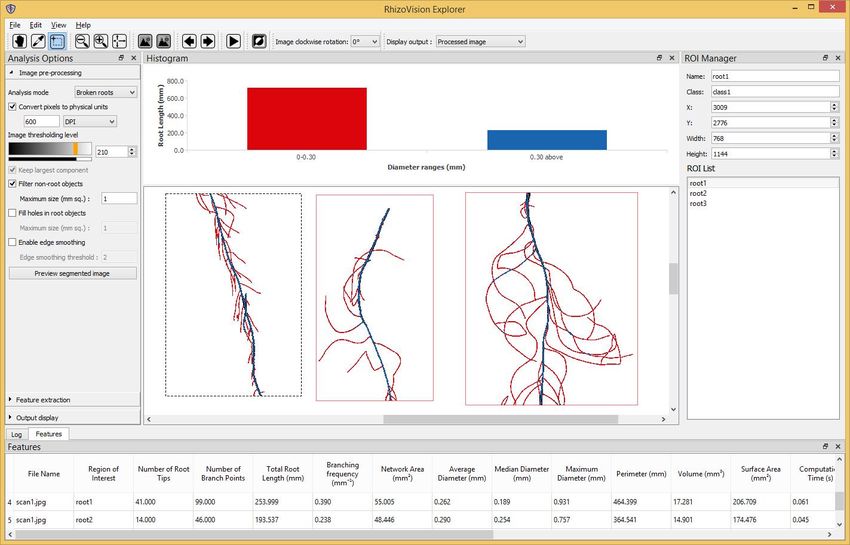
Introduction

Roots are central to understanding and providing answers to pressing global challenges like climate
change’s impact on plant communities, ecosystem services, and food security. From an ecological
perspective, roots are an integral component of global biogeochemical processes, accounting for
46% of the net primary productivity of the terrestrial biosphere globally, ranging from 32% in
croplands, 41%–58% in various forest types, and 64% in grasslands (Gherardi and Sala, 2020). They

                                                                                                         Downloaded from https://academic.oup.com/aobpla/advance-article/doi/10.1093/aobpla/plab056/6366354 by guest on 07 November 2021
have demonstrated influence on countless numbers of plant and ecosystem functions (Bardgett et
al. 2014; Freschet et al. 2020). As such, on an ecosystem level, conceptual understanding,
parameterization, and spatial scaling of various root processes are critical for quantifying carbon,
water, and nutrient fluxes (Warren et al. 2015). From an agricultural perspective, rising demand for
food, increased cost of production, agricultural intensification, and depletion of finite resources in

                                                                                    t
                                                              ip
the face of changing climates have adverse effects on food security prospects (Godfray et al. 2010).
Crops with optimized root traits are considered an important determinant of future food security,
and the key to the second green revolution that can improve farm productivity and sustainability

                                                            cr
(Lynch 2007). Additionally, the root-soil rhizosphere is regarded as the keyspace for the future
discovery of novel root traits relevant to increasing crop and farm productivity (Tracy et al. 2020).

                                                          us
Hence, a better understanding and characterization of belowground plant components will enable a
greater knowledge of the underlying ecosystem processes in both natural and agricultural systems.
                                               an
Due to their vital roles in anchorage, acquisition of water and nutrients, and driving soil biology,
plant root systems have been studied by the scientific community for over 100 years (Lux and Rost,
2012). Roots still remain the least understood plant organ, partly because their underground growth
                                       M

is obscured by the opaque soil matrix (Eshel and Beeckman 2013; Hochholdinger 2016). This
belowground life leads to the need to sample roots by excavation or soil coring, followed by
washing, which requires substantial effort. However, the rewards for measuring roots are great, with
                               d

substantial evidence presented for how numerous root traits directly influence processes like
nitrogen uptake and soil reinforcement (Freschet et al. 2020). The term “phenotyping” has become
                     e

commonly used to mean measuring traits in the context of screening crops for genetic mapping.
                  pt

Typically, these applications require measuring hundreds or thousands of samples, and so high-
throughput phenotyping is the goal (Fiorani and Schurr 2013).
        ce

From a historical perspective, some of the primary root measurements used have included root dry
weight, number, volume, surface area, and length. As explained by (Böhm 1979), the dry weight is
commonly used due to its relative ease and, when measured on distinct organs of a plant, is a good
Ac

indicator of carbon allocation in the plant. Volume is known to correlate with root dry weight in
many circumstances and is relatively easy to measure by water displacement methods (Harrington
et al. 1994; Pang et al. 2011). Although root mass or volume measurements are relatively easy to
measure, they cannot adequately explain many root functions in the plant-soil continuum (Costa et
al. 2000). Böhm (1979) explained that volume did not become widely used because these
parameters cannot distinguish samples with few thick roots from those with many fine roots, nor
can dry weight. By 1970, Gardner (1964) and others had shown that root length was the best
predictor of water uptake, and so was highly desirable to measure. Throughout the 20th century,
root length was typically measured by placing roots on graph paper, using tacks or gum to hold the
ends in place to stretch out, and lateral roots had to be cut away to measure separately (Böhm

                                                                                                     3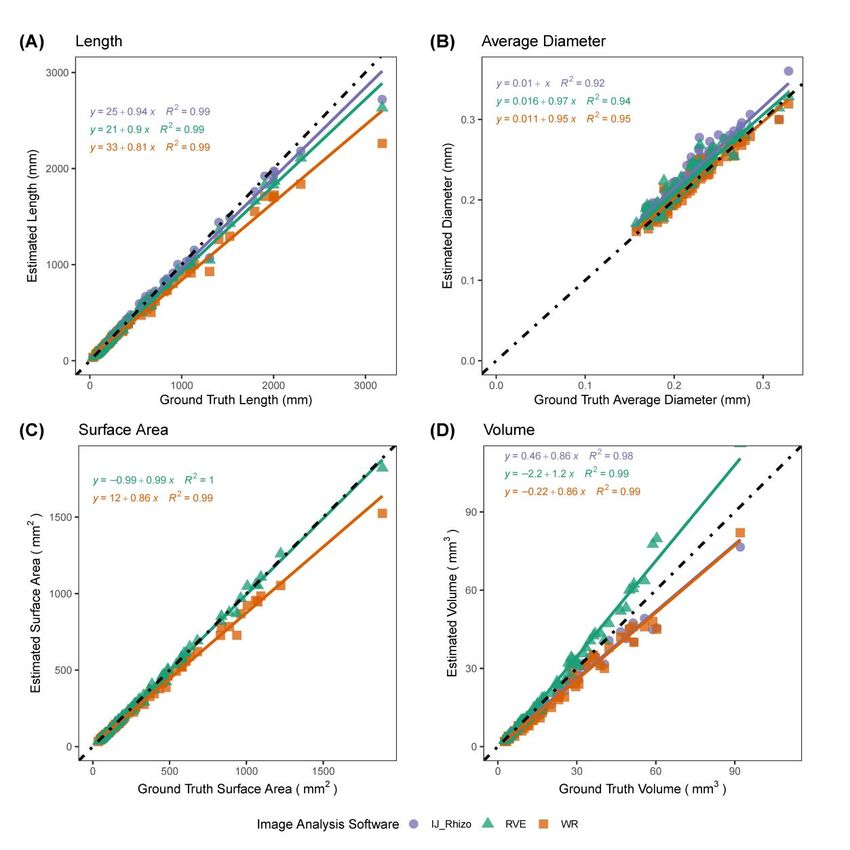
1979). Therefore, any method for measuring the length and other parameters with higher
throughput and precision was highly sought.

Methods designed to overcome the barrier in measuring root length using a ruler or graph paper
date back at least to Newman’s (1966) “line-intersection” method, assuming random placement of
lines and its variant by Tennant using a grid of lines (1975). In these methods, total root length is
estimated by manual counting of roots that intersect a line marker and a formula to convert to root
length. Subsequently, the line-intersection method was digitized using a photo-electric sensor that

                                                                                                           Downloaded from https://academic.oup.com/aobpla/advance-article/doi/10.1093/aobpla/plab056/6366354 by guest on 07 November 2021
traveled over the top of a backlit root sample to count transitions from white to black using a scaler
or electronic counter (Rowse and Phillips 1974). Image-based methods were employed to capture
mini-rhizotron images starting in the 1970s, and these images were processed with the line-
intersection method, either manually or with the digitized version (Upchurch and Ritchie, 1983).

                                                                                     t
Smucker et al. (1987) described a complete algorithm for thresholding a root image, thinning to

                                                               ip
produce a skeleton, using successive boundary erosion to compute a distance map, and calculating
length, surface area, and volume from images acquired using a videotape camera. In parallel, more

                                                             cr
advanced digitized methods for the line-intersection method were still in development in 1989 using
specialized counter devices as described above (Harris and Campbell, 1989). This same type of

                                                           us
counting algorithm was also applied through image analysis to count from images acquired by a
desktop document scanner (Krstansky and Henderson 1989). The business applications of desktop
scanners led to their wider availability and lower costs, while the optical arrangement made the
                                                an
method superior relative to using cameras; leading to higher resolution images with less distortion.
The first reported use of a desktop scanner for acquiring images of spread roots followed by image
analysis of the entire root objects (rather than line-intersection) was described by Pan and Bolton
                                        M

(1991), with the algorithm determining the perimeter of root objects and then deriving root length,
area, and average diameter from that single measurement. WinRhizo™ is a commercial and closed-
source software released in 1993 (Arsenault et al. 1995) based on the principle of standardizing the
                                d

use of desktop scanners and image analysis using similar algorithms as described by Smucker et al.
(1987) to measure root length, diameters, areas, and volumes. ROOTEDGE is free and open-source
                     e

software developed to measure root length from scanned images using the edge-chord algorithm
                  pt

(Kaspar and Ewing 1997), for which a legacy DOS program was still available for download as of the
writing of this article (https://www.ars.usda.gov/midwest-area/ames/nlae/docs/software-available-
        ce

from-nlae/). The edge-chord algorithm efficiently measured the perimeter by summing short chord
segments, and then used the total root pixel count for area to derive length. However,
skeletonization routines as proposed by Smucker et al. (1987) became the preferred method for
Ac

measuring length because of their simplicity and fewer assumptions. Kimura and Yamasaki (2003)
provided a useful refinement of the algorithms to measure length and diameters more accurately
from skeletons, using the NIH Image software (now ImageJ).

Since then, advances in image capture and image processing algorithms have continued and been
widely utilized to measure various root metrics. Roots are imaged across a wide degree of
modalities, such as in situ with minirhizotrons or soil pits, in rhizoboxes, on colored backgrounds, or
with flatbed scanners (Topp et al. 2016). Therefore, image analysis approaches are often specific to
particular types of collected images. At the time of writing, there are 17 root image analysis tools for
single root images and 42 tools for root system images listed on Quantitiative-Plant.org, each with
varying features and assumptions for input image type (Lobet et al. 2013). At present, 2D root
imaging and image analysis is the most popular root phenotyping approach, after root dry weight

                                                                                                       4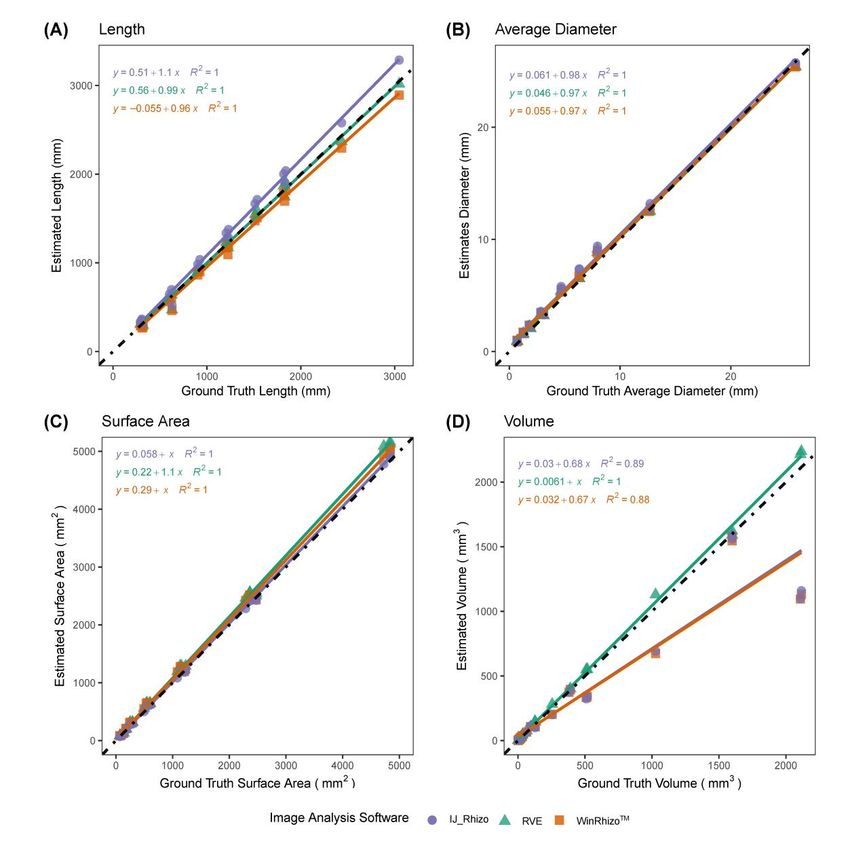
determination, as it is the most accessible and simplest image data to acquire and analyze. Software
that work with 2D branched and connected root system images such as root crowns or seedling root
systems grown on blue paper included EZ-Rhizo (Armengaud et al. 2009), SmartRoot (Lobet et al.
2011), RootNav (Pound et al. 2013), ARIA (Pace et al. 2014), DIRT (Das et al., 2015), and RhizoVision
Analyzer (Seethepalli, Anand et al., 2020). In many cases, roots are not connected as they have been
excavated from the field or pots, and these roots are typically imaged on a flatbed scanner then
analyzed using the commercial WinRhizo™ software (Regent Instrument Inc., Quebec, Canada) or

                                                                                                          Downloaded from https://academic.oup.com/aobpla/advance-article/doi/10.1093/aobpla/plab056/6366354 by guest on 07 November 2021
free software including IJ_Rhizo (Pierret et al. 2013); requiring ImageJ), GiA-Roots (Galkovskyi et al.
2012); no longer available for download), and saRIA (Narisetti et al. 2019; requiring Matlab runtime).
While the growing numbers of image analysis tools for root phenotyping have been really useful to
the root science community, these have also introduced a range of biases and inconsistencies among

                                                                                    t
studies such as the use of pixel counts for length that don’t account for diagonal lengths and

                                                              ip
problems with the calculation of volume (e.g., Rose and Lobet 2019). The different software tools
and measured properties likely reinforced the conceptual barriers between root researcher

                                                            cr
communities (see Freschet et al. 2020). Currently, there is a need to bring these tools together into a
user-friendly, generalist, all-inclusive package that has wide utility across plant science, provides
standardized results, and is open-source.

                                                          us
As presented in detail below, RhizoVision Explorer fills the gap for generalized root image analysis,
with modes to extract several root traits from both connected and unconnected plant root systems.
                                               an
Here we describe aspects of the user-friendly, lightweight, and open-source graphical user interface
that facilitate high-throughput root phenotyping, such as its ease to install and use, support of
multiple image formats, the inclusion of image pre-processing, and batch analysis mode.
                                       M

Additionally, we present the methods and outcomes of the software validation using a novel copper
wire image set and simulated roots with ground truth measurements. For scanned roots, the
software was further compared with WinRhizo™ using images from several plant species and
                               d

functional categories.
                     e

Materials and Methods
                  pt

RhizoVision Explorer (Fig 1) builds upon the functionality and codebase of RhizoVision Analyzer
(Seethepalli and York 2019) to analyze not only root crown images but also broken roots that are
        ce

imaged on a flatbed scanner. The term ‘Explorer’ indicates the user has more freedom to understand
the analysis process and work interactively with the graphical user interface (GUI) to optimize the
desired outcome. The program adds functionality such as greater interaction with the raw,
Ac

segmented, or analyzed image, performing root pruning, and support for the region of interest (ROI).
The minimum-tested system requirements for the RhizoVision Explorer are an Intel or AMD x86 64-
bit processor and a minimum of 4 GB of RAM. If the processor supports Intel AVX 2.0, the program is
accelerated using AVX 2 vector processing instructions. The program does not require any
installation or external dependencies and runs locally on Windows 8.1 or higher, but could be
compiled to run on other operating systems in the future. The program is open-source, and the
zipped binary files for simple installation are available for download at
https://doi.org/10.5281/zenodo.3747697 (Seethepalli and York 2020).

                                                                                                     5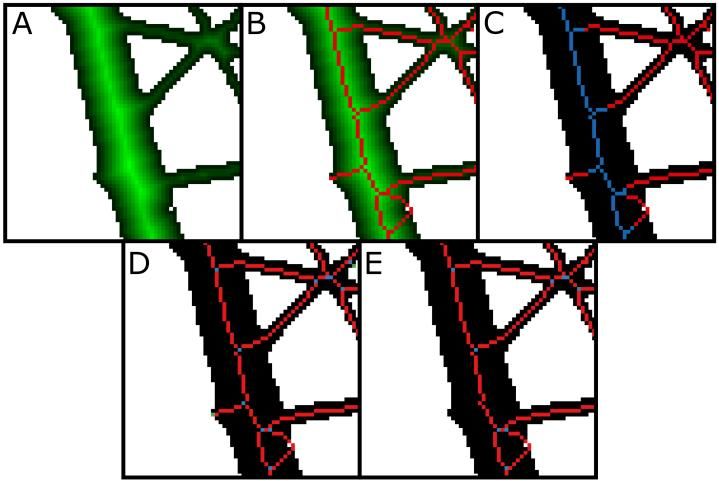
Software Architecture
RhizoVision Explorer is written in C++ (https://github.com/noble-research-
institute/RhizoVisionExplorer) and uses cvutil (https://github.com/noble-research-institute/cvutil), a
C++ library that includes several helper functions that extend the OpenCV library (www.opencv.org)
and was developed by the same team in parallel. These functions include determining the distance
map, creating the skeletal structure, and smoothing the contours of a segmented image.
Additionally, the cvutil library supports adding a user interface to an application with the main

                                                                                                          Downloaded from https://academic.oup.com/aobpla/advance-article/doi/10.1093/aobpla/plab056/6366354 by guest on 07 November 2021
window, extending the user interface with the plugin system, and optionally enabling the ROI system
that can be utilized by the plugins loaded by the application. Finally, the library includes several
plotting functions for data visualization. The cvutil library utilizes the platform-independent Qt C++
library (www.qt.io) to generate the required graphical user interfaces. Using OpenCV and QT enables

                                                                                   t
extending the software and required libraries to be deployed on operating systems other than

                                                              ip
Windows in the future.

                                                            cr
The primary algorithms for extracting features, or measurements, from root images, were
implemented within a plugin to the image processing window. The plugin also includes the logic for
identifying the root topology and generating the feature image with visual elements such as the

                                                          us
skeleton or convex hull overlaid on the segmented image. When the user starts analysis from
RhizoVision Explorer, the main window checks if the image has any ROIs drawn by the user. If any
ROIs are found, then the main window invokes the plugin for extracting features for every sub-image
                                               an
given by the ROI set. Otherwise, the whole image is passed to the plugin for analysis. The plugin then
analyzes the image and returns the extracted features and the segmented and processed images to
the main window. The main window then updates the features table with the extracted features,
                                       M

displays the processed image in the image pane, and updates the bar plot root length histogram that
groups length measurements based on the diameter ranges given by the user before analysis.
                               d

The main window allows the user to change the analysis options interactively and run the analysis,
thereby allowing the user to find the optimal analysis options for an image. These analysis options
                     e

can be saved in a CSV file and loaded later. Similarly, the main window also supports loading and
                  pt

saving the ROIs as annotation text files, so that these annotations can be reused later.

Description of analysis tools in RhizoVision Explorer
        ce

A typical workflow for analyzing a plant root image is to load the image in RhizoVision Explorer by
drag-and-drop or through the file menu. Most common image formats are supported, including
Ac

PNG, JPEG, BMP, and TIFF, in both grayscale and color, but note only the red channel is used for
color images. The Analysis Options pane on the left side of the program lists the options for image
preprocessing, feature extraction, and how the output of the analyzed image is displayed to the
user. The user needs to set the options to be appropriate for any given experiment, preview
segmentation, and then run the analysis. Upon pressing the ‘run analysis’ arrow button, the program
extracts relevant features from the plant root image, displaying the processed image at the center of
the window. The default analysis mode is for broken roots, but the software also has a whole root
mode that will perform an analysis similar to RhizoVision Analyzer including extra features such as
the convex hull, root system width and depth, and angle measurements. The user may convert pixels
to physical dimensions in units of either pixels per mm or DPI (dots per inch) as typically used when
scanning. Apart from the thresholding and color inversion options, which are present in the

                                                                                                      6
RhizoVision Analyzer, the program also supports filtering non-root objects from the background and
filling holes in root objects. Non-root object filtering enables soil particles or other debris, which may
be present after root washing, to be filtered from the image. Hole filling is useful in cases where the
root region in the image may contain bright spots that may be identified as background after
thresholding, and allows the small areas to be filled in that are surrounded by root pixels. The
filtering is performed based on the user-provided maximum size of a filtered component for the
background and the root portions of the image. The maximum size is provided in sq. mm if pixel to
Downloaded from https://academic.oup.com/aobpla/advance-article/doi/10.1093/aobpla/plab056/6366354 by guest on 07 November 2021
millimeter conversion is specified in the program. The program then filters the connected
components based on the size of each component. Fig 2 shows the thresholded images of a root
image patch before and after filtering noisy components. Once the user is satisfied with the various
options, they may also use the batch analysis mode which will apply the current settings to all
t
images in a selected folder and output a metadata settings file and the tabular data file.
ip
The contours, or root surfaces, of the thresholded and filtered image, can be optionally simplified
using the Ramer-Douglas-Peucker line simplifier (Ramer 1972; Douglas and Peucker 1973). The
cr
procedure simplifies the contours of the thresholded image within a user-provided pixel distance
threshold. Small contours of the segmented root can lead to the formation of short lateral roots
us
during skeletonization that are not valid. Therefore, smoothing the surface using line simplification
can reduce the number of these unwanted invalid lateral roots. It is recommended not to set values
higher than 2.0 for pixel distance threshold for line simplification, because it may alter the root
an
topology, leading to an angular appearance.
Using the segmented image generated using the methods described above, a precise Euclidean
M
distance transform (Felzenszwalb and Huttenlocher 2012) is computed for the image (Fig 3A). The
distance transform at any pixel is the shortest distance from the pixel to a background pixel. The
skeletonization of the segmented image is performed by the identification of ridges of the distance
d
transform (Fig 3B). This is done by checking each distance transform pixel if it is greater than two
neighboring pixels of opposite directions. The ridges so identified are not always connected
e
throughout the root system. This is because the distance transforms pixels at the junction of the
pt
main root and its lateral root increase towards the ridge of the main root. Hence, no ridge pixels can
be found that can connect the lateral root to the main root. These ridges are connected in the
steepest ascent algorithm to form a connected skeletal structure. The ridge may be 2 pixels wide in
ce
some places which may be formed in the ridge detection procedure. In such a case, the ridge is
thinned using the Guo-Hall thinning algorithm (Lam et al. 1992) to one-pixel width while preserving
the connectivity of the skeletal structure. The skeletal structure is internally stored as an image
Ac
where pixel values take on the value computed from the distance map for that pixel and use it for
computing the average diameter of all roots and to classify root segments into diameter bins as
described below.
After skeletonizing the segmented image, the topology of the root is identified, which involves
finding the topological branch points, endpoints, and the root segments between any two branch
points or a branch point and an endpoint (Fig 3D). The endpoints, here on called root tips, are
identified as any skeletal pixel having only a single neighboring pixel and branch points have 3 or 4
neighboring pixels. This topology is stored as a copy of the skeletal image where pixels can take
discrete values that encode the type, tip, branch point, or segment. Using this topological image and
the skeletal image, another method for decreasing the number of short, invalid lateral roots was
7devised as an analysis option called “root pruning” as an alternative to using line simplification of the
segmented image. The basic premise of root pruning is that the length of invalid lateral roots will be
no longer than the radius of the parent root from which they branch. When the root pruning option
is selected, the software evaluates the topological image to analyze all root segments starting from a
branch point and ending in a tip. The software determines whether the length from the branch to
the tip is longer than the radius of the branch point plus an additional number of pixels supplied by
the user (Root pruning threshold). If a given lateral root is too short, then its tip and segment are
Downloaded from https://academic.oup.com/aobpla/advance-article/doi/10.1093/aobpla/plab056/6366354 by guest on 07 November 2021
deleted from the topological image and the skeletal image. If the resulting parent branch point has
one neighbor, it becomes a tip; if two neighbors, it becomes merged with the segment to which it
belongs; and if it still has three or more, it remains a branch point. Since new tips can emerge during
this process, root pruning is iterative until no invalid lateral roots remain. Unlike line smoothing, root
t
pruning does not alter the shape of the segmented root image. Root pruning removes the invalid
ip
lateral roots that can inaccurately affect the extracted features, such as the total root length (Fig 3E).
The resulting pruned topological image is used for extracting features requiring lengths and
cr
diameters. Features extracted in RhizoVision Explorer that rely on the segmented image, the skeletal
image, and the topological image are defined in Table 1. Surface area and volume are calculated
assuming that every pixel in the skeleton is a cylinder, calculating based on its height and radius, and
summing those for the entire image or diameter range.
us
Apart from extracting the root features, the program can also be used to visualize the analyzed root
an
interactively. Further, after running the analysis, a histogram appears of root length grouped by
different root diameter ranges provided by the user (Fig 1). Fig 3 shows different ways a processed
root can be visualized. The visualization of a processed image contains options for displaying the
M
distance transform map of the segmented image and generated skeletal structure, or medial axis.
Additionally, for root crown images, the processed image can be optionally displayed with a convex
hull that fits the whole root system, the holes, or the background components separated by the root
d
system and contour of the segmented image. The skeletal structure can be displayed based on the
user-specified diameter ranges (Fig 3C) or based on the topology of the skeletal structure (Fig 3D and
e
Fig 3E). When a root skeletal structure is visualized based on diameter ranges, the ranges can be
pt
selected by the user to distinguish the first and second-order lateral roots (Fig 3C). This also changes
the histogram features that are extracted, to get useful information such as the root length of the
ce
main roots and the lateral roots separately. When generating the skeletal structure based on root
topology, the branch points and root tips are highlighted.
RhizoVision Explorer also supports several tools that dramatically improve the usability of the
Ac
software. One such tool is the region of interest system, termed the ROI Manager. The ROI tool on
the toolbar allows drawing multiple ROIs, and the ROI Manager allows custom naming of a selected
ROI; manually changing XY coordinate position, width, and height; and maintains a list of ROIs in the
image. For each ROI in an image, the roots within that ROI are analyzed separately and reported as a
unique row of data, including a column for the name of the ROI. ROIs can be saved and loaded as an
annotation file and are honored for batch processing.
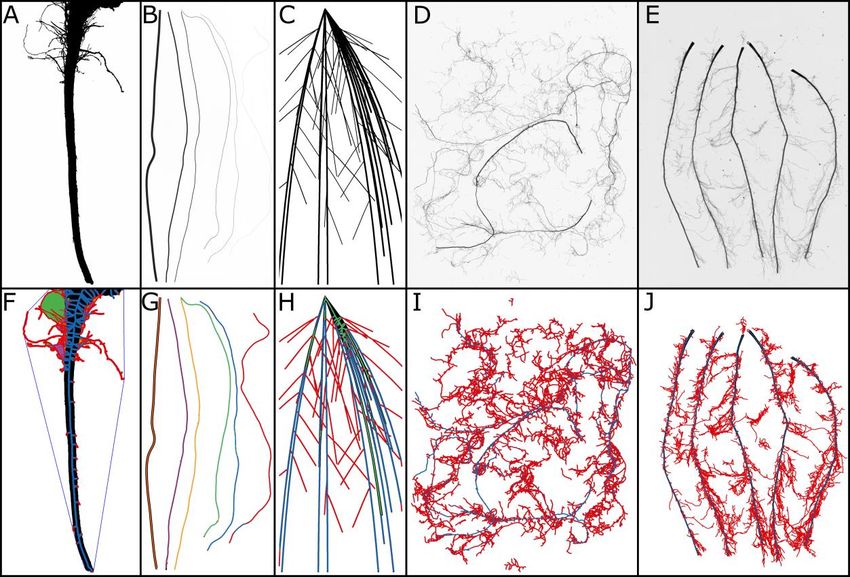
8Validation datasets and procedures
For validation of data extracted from RhizoVision Explorer, known gauges of copper wire (Fig 4B)
were used. Copper wire samples with average lengths of 30.48 cm and various diameter wire gauges
(American Wire Gauge 40, 32, 28, 22, 16, and 10; with the diameter ranging from 0.07 mm – 2.58
mm) were used for the validation. For each gauge, two wires were used for a total of 12 wires. The
diameter of each wire was measured with a digital micrometer and the length was measured by
fitting string to the length of the wire, then measured with a ruler. The surface area and volume for
Downloaded from https://academic.oup.com/aobpla/advance-article/doi/10.1093/aobpla/plab056/6366354 by guest on 07 November 2021
each wire were calculated assuming the wires were cylinders. The average diameter for scans
containing multiple wires was calculated as the weighted diameter based on the length of each wire
in the scan. The wires were then scanned on an Epson Expression 12000XL flatbed scanner with a
transparency unit (overhead light), as common practice for root imaging. The images were digitized
t
at 600 dpi as 16-bit grayscale images and then saved as TIFF (tagged image file format). Scans were
ip
taken in 28 combinations from individual wires to all as shown in Table S1 in order to achieve
variation in total length, average diameter, total surface area, and total volume. The copper wire
cr
image set used here is available in a public repository and can be downloaded at
http://doi.org/10.5281/zenodo.4677546 (Dhakal et al. 2021a).
us
The wire images were processed in RhizoVision Explorer v2.0.2 (Fig 4G) using the following analysis
options: Root type was chosen as broken roots, image thresholding level was set at 191, filter noisy
components on the background was set as true, with the maximum noisy component size of 8 mm2.
an
The threshold value was adjusted until the copper wires were fully visual, without introducing any
deviation in the shape of the wires. The root pruning threshold was set to five pixels. Images were
then processed in batch mode. The same images were processed in WinRhizo™ v2019a using the
M
following analysis options: root detection was based on gray level and thresholding was set manually
at 191 to match the options chosen for RhizoVision Explorer (RVE). Roots were chosen as darker
than the background. Debris and rough edges removal were selected as low.
d
For comparison of performance metrics of RhizoVision Explorer, we chose two popular software for
e
root phenotyping, WinRhizo™, and IJ_Rhizo- the former being a commercial software and the latter
pt
being an open-source, freeware. We used simulated root images of known measurements
(http://doi.org/10.5281/zenodo.1159845; Rose and Lobet 2018) which were previously used in Rose
ce
and Lobet (2019). A Root System Markup Language file had been previously generated using the
root model ArchiSimple (Pagès et al. 2014) for 50 taproot and 50 fibrous root systems which were
then stored as black and white JPEG image files (resolution of 1200 dpi) (Rose and Lobet 2019).
Ac
Images were analyzed with a thresholding value set to 144 for the three software. Values for length,
average diameter, surface area, and volume for the root images for IJ_Rhizo and WinRhizo™ were
used from Rose and Lobet (2018) and batch analyzed to get the corresponding measurements for
RhizoVision Explorer.
To compare the efficacy of RhizoVision Explorer, scanned grayscale root images of maize (Zea mays
L.), wheat (Triticum aestivum L.), and various herbaceous and tree species were analyzed and
compared with the image analysis results from WinRhizo™. The herbaceous species (Fig 4D) include
9 species sampled at ca. 115 days old: (Bromus erectus, Dactylis glomerata, Holcus lanatus, Plantago
lanceolata, Sanguisorba minor, Taraxacum officinale, Lotus corniculatus, Medicago sativa, Trifolium
repens) (Freschet et al. 2018). The maize (Zea mays L.) roots included scans (Fig 4E) from 40-day old
9plants across 30 cm depths for several nodes of roots (Guo and York, 2019). The wheat (Triticum
aestivum L.) roots are entire root systems from 10-day old wheat seedlings grown in hydroponics
(Guo et al. 2020). The tree roots are from the unpublished work of M. Luke McCormack and include
root branches from 14 gymnosperm species sampled from the field (Cephalotaxus harringtonii,
Ephedra distachya, Chamaecyparis pisifera, Ginkgo biloba, Juniperus chinensis, Larix decidua,
Metasequoia glyptostroboides, Picea abies, Pinus resinosa, Pinus strobus, Sciadopitys verticillata,
Taxus cuspidata, Taxodium distichum, Tsuga canadensis). All these image sets were scanned
Downloaded from https://academic.oup.com/aobpla/advance-article/doi/10.1093/aobpla/plab056/6366354 by guest on 07 November 2021
separately in different labs using Epson scanners with transparency units at resolutions of 600 DPI
for maize, wheat, and herbaceous species, and 800 DPI for the tree species. Measurements were
extracted for length, average diameter, surface area, and volume. In RhizoVision Explorer, the
images were analyzed with the following analysis options: (i) Analysis mode as ‘Broken roots’, (b)
Image thresholding level of 205, (c) Filter non-root objects as 8 mm2, (d) Filter holes in root objects
t
ip
set to false, (e) Enable edge smoothing set to false, and (f) Root pruning threshold set to 5. In the
case of WinRhizo™, parameters were kept as the original used by the respective image providers,
cr
thresholding values were set as 205 in the manual mode for maize and wheat roots, automatic for
herbaceous, and global Lagarde with a 64-pixel region size for the tree roots. In both software, the
respective resolution was used. Fig 4 shows the input images including a root crown image as well as
us
the corresponding processed images highlighting the skeletal structure of the roots that are colored
based on various diameter ranges. These 4 image sets of roots from several plant species are
available in a public repository and can be downloaded at http://doi.org/10.5281/zenodo.4677751
an
(Dhakal et al. 2021b).
Statistical analysis
M
Statistical analyses were performed using R (R Core Team 2020) through RStudio (RStudio Team
2020). The R package “ggplot2” (Wickham 2016) was used for data visualization. Other packages
used in the analysis were “ggpmisc” (Pedro 2020), “tidyverse” (Wickham et al. 2019), “ggpubr”,
d
“magrittr”, “readxl”, and “Metrics” (Hamner and Frasco 2018). The R code and tabular data used in
e
this study are available in a public repository and can be downloaded at
http://doi.org/10.5281/zenodo.4677553 (Dhakal et al. 2021c).
pt
Linear regression was used to compare paired measurements for ground truth data and estimated
ce
measurements. Slope (α), intercept (β), and coefficient of determination (R2) of the linear regression
between the ground truth and the estimated values were calculated. In order to quantify the
prediction error for the software, various performance metrics such as mean bias error (MBE), root
Ac
mean square error (RMSE), and determination coefficient (R2) were used. The R package ‘Metrics’
was used for calculating the prediction errors. RMSE is the measure of the standard deviation of the
residuals. MBE is an index to quantify whether the estimates are under- or overestimated. A good
prediction results in the narrow spread of the residuals. Likewise, MBE also informs the direction and
magnitude of the bias.
∑ ( ) (1)
( )
√∑ (2)
10(∑ ) (∑ )(∑ )
( ) (3)
√[ ∑ (∑ ) ][ ∑ (∑ ) ]
where Pi is the estimated value, Oi is the measured value, and N is the sample size. Lower values for
both MBE and RMSE indicate a more accurate prediction.
Results
Downloaded from https://academic.oup.com/aobpla/advance-article/doi/10.1093/aobpla/plab056/6366354 by guest on 07 November 2021
Validation with copper wires
Length
All IJ_Rhizo, RhizoVision Explorer, and WinRhizo™ generated accurate length data for the copper
wires. Determination coefficients were 1 for all software (p < 0.001), indicating a strong correlation
t
between the ground truth measurements and the estimated length (Fig 5A). RMSE for estimated
ip
length for scanned copper wire images for IJ_Rhizo, RhizoVision Explorer, and WinRhizo™ was 10.74
mm, 4.56 mm, and 6.67 mm, respectively. Results show that IJ_Rhizo overestimated length (MBE=
cr
7.84 mm), RhizoVision Explorer slightly overestimated length (MBE = 0.02 mm), and WinRhizoTM
slightly underestimated the length (-4.2 mm) (Table 2).
Average Diameter
us
For average diameter, all three root image analysis software (IJ_Rhizo, RhizoVision Explorer, and
an
WinRhizo™) returned nearly perfect fits (R2 =1; p < 0.001) with similar RMSE values (Fig 5B). IJ_Rhizo,
RhizoVision Explorer, and WinRhizo™, all slightly overestimated average diameter values (MBE 0.03–
0.05 mm, respectively). RhizoVision Explorer had the lowest MBE (0.03 mm) among the three
M
software (Table 2).
Surface Area
d
The surface area for the scanned copper wire images was accurately estimated with all three
software IJ_Rhizo, RhizoVision Explorer, and WinRhizo™ (R2= 1) and RMSE values of 0.40 mm2, 1.42
e
mm2, and 1mm2, respectively (Fig 5C). All of these software overestimated surface area (MBE 0.2
pt
mm2, 1.03 mm2, and 0.72 mm2, respectively) (Table 2).
Volume
ce
RhizoVision Explorerhad a strong agreement between the ground truth measurements and
estimated volume from the scanned copper wire images (R2=1, pPerformance of IJ_Rhizo, RhizoVision Explorer, and WinRhizo™ using simulated root
systems
The determination coefficients obtained for the regression between estimated length and ground
truth values for IJ_Rhizo, RhizoVision Explorer, and WinRhizo™ indicated a strong agreement
between the estimated length and ground truth measurements (R2 = 0.99, p < 0.001) (Fig 6A).
IJ_Rhizo had the lowest RMSE (58.18 mm) and MBE (-5.46) values, followed by RhizoVision Explorer
Downloaded from https://academic.oup.com/aobpla/advance-article/doi/10.1093/aobpla/plab056/6366354 by guest on 07 November 2021
(RMSE = 74.86 mm, MBE = -29.14 mm) and WinRhizo™ (RMSE = 137.72 mm, MBE = -64.50 mm),
respectively (Table 3). The MBEs are positive indicating a tendency to underestimate length for the
three software.
Likewise, the determination coefficients obtained for the regression between estimated average
t
ip
diameter and ground truth average diameter values for IJ_Rhizo, RhizoVision Explorer, and
WinRhizo™ indicated a strong agreement between the estimated length and ground truth
measurements (R2 > 0.9, p < 0.001) (Fig 6B). RhizoVision Explorer and WinRhizo™ had lower RMSE
cr
values (0.02 mm) compared to IJ_Rhizo. A negative MBE (0.01) indicated a tendency to overestimate
diameter for the three software slightly (Table 3).
us
For surface area, because Rose and Lobet (2019) did not include the analysis, the data were not
presented for IJ_Rhizo. Determination coefficients were high for both RhizoVision Explorer and
an
WinRhizo™ (R2>0.99, p 0.98, pDiscussion
In this paper we have introduced RhizoVision Explorer, a freely available, easy-to-use, GUI-based,
precompiled executable software for personal computer (PC) users. To facilitate adoption, the open-
source software can be executed easily on most Windows PCs (Windows 8.1 or 10) without the need
for dedicated GPUs or cloud-hosted services. The program is developed for a modular approach with
the implementation of open-source libraries such as Qt, OpenCV, and a plugin system. Developers
Downloaded from https://academic.oup.com/aobpla/advance-article/doi/10.1093/aobpla/plab056/6366354 by guest on 07 November 2021
can easily build upon the existing open-source software codebase to fit their root research pipeline
and share the software with the root phenotyping community. The software provides interactive
and batch processing modes, region-of-interests functionality, and numerous options for
segmentation, filtering, feature extraction, and output display.
t
To validate the physical measures provided by the software, a novel image set was created using six
ip
diameters of copper wires with known lengths imaged in 28 combinations and scanned with a
similar protocol as for plant roots. RhizoVision Explorer showed excellent agreement with the
cr
ground truth values for total length, average diameter, surface area, and volume. In some cases,
reflections or glare from the smooth copper wire produced non-ideal images with minor
us
imperfections. A published image and dataset were used to compare RhizoVision Explorer with
previous results obtained for IJ_Rhizo and WinRhizoTM. In general, the three software performed
similarly and their inaccuracies can largely be attributed to the ground truth data was based on
an
simulated 3D root systems, but that image analysis results are based on single perspective 2D
projections that increase root occlusion and overlap. When the original 3D images are flattened,
many of the fine roots are effectively combined into larger diameter structures while simultaneously
M
decreasing root length, as seen in Fig 6A showing underestimation of length by all software. Larger
diameter structures would tend to inflate volume estimates, derived from the squared radius in a
cylinder formula, while decreased length would tend to decrease the volume. Therefore, RhizoVision
d
Explorer may overestimate the volume (Fig 6D) due to the increased apparent diameters observable
in the crown of the simulated root images (see green medial axis visible in the upper right of Fig 4H),
e
while WinRhizo and IJ_Rhizo underestimate volume because of their bias in using the average
pt
diameter and length as discussed below. In practice, this type of root occlusion may be minimized at
the imaging stage by ensuring roots are spread with minimal overlap. The root image analysis
community would benefit from further ground truth datasets that correct some of these issues, such
ce
as 2D simulated roots of both connected and unconnected types, with various overlap, root hair
presence, distortion, and diameter heterogeneity.
Ac
For performance evaluation of RhizoVision Explorer with typical scanned root images, and to aid
future root algorithm development, another image set containing wheat, maize, wild herbaceous
species, and tree species was created. In this case, only a comparison with the commonly used
WinRhizoTM was conducted. Overall, the results show good agreement between the two software,
except WinRhizoTM substantially underestimated root volume relative to RhizoVision Explorer.
Previous work had indicated that WinRhizoTM and IJ_Rhizo inaccurately calculate volume based on
the average diameter of all roots in an image and the total length of all roots in the image (Delory et
al. 2017; Rose and Lobet 2019). This method assumes all roots are of the same (average) diameter,
but diameters of roots within a sample can vary 10-fold. In such samples with a great variation of
diameter, the average diameter will be biased by the smaller diameter roots and the volume will be
underestimated. RhizoVision Explorer does not suffer from this inaccurate method, because surface
13area and volume are calculated by assuming that every pixel in the skeleton is a cylinder and
summing across the image or diameter range. The severe volume underestimation possible when
using WinRhizoTM or IJ_Rhizo is readily observable in the copper wire image set (Fig 4B,G), where
RhizoVision Explorer gave the correct result, but WinRhizoTM or IJ_Rhizo only reported half of the
volume in the most extreme cases (Fig 5D). When comparing results between WinRhizoTM and
RhizoVision Explorer across the image sets of various crop and wild species, reasonable agreement is
seen for length, average diameter, and surface area, but in some maize root images with significant
Downloaded from https://academic.oup.com/aobpla/advance-article/doi/10.1093/aobpla/plab056/6366354 by guest on 07 November 2021
diameter heterogeneity between nodal and lateral root diameters (see Fig 4E,J), the WinRhizoTM
volume estimate was five-fold less (Fig 7D). Volume is an important measurement, typically used as
a proxy for root mass and also for the calculation of root tissue density. These measures relying on
volume that exist in the literature and in public root databases like FRED (Iversen et al. 2017) or
t
GRoot (Guerrero-Ramírez et al. 2021) should be carefully evaluated before use.
ip
A subset of 20 images from the herbaceous species image set were analyzed in batch mode in both
RhizoVision Explorer and WinRhizoTM on a Windows computer with an Intel 1.90 GHz i7 processor
cr
and 16 GB RAM. Thresholding values of 220, no filtering, and no diameter bins were used in both
software. RhizoVision Explorer completed the task in 55 seconds, and WinRhizoTM in 185 seconds.
us
These results would depend on computer types and images used but are consistent with general
experience. RhizoVision Explorer can be improved for speed and memory usage by reducing the
number of internal images stored during analysis and optimizing code.
an
RhizoVision Explorer uses global grayscale thresholding to encourage imaging platforms that
maximize the contrast of roots with the background, such as by using the RhizoVision Crown
M
platform for root crown imaging using a backlight (Seethepalli et al. 2020), or use of a flatbed
scanner with a transparency unit (or top light). Therefore, many types of complex images produced
with blue paper screens, rhizoboxes, or minirhizotrons may not work directly, which presents a
d
limitation of the software. Image analysis tools have built-in assumptions of the input image on
which the analysis operations are based, such as high contrast between the roots and the
e
background. Users of these tools should carefully consider each tool before collecting or processing
pt
image data to ensure accurate and representative results. Image preprocessing steps such as
cropping, filtering, or thresholding are often required separately before analysis in software such as
ImageJ. However, several software tools have become available over the past few years for machine
ce
learning approaches for root segmentation from complex backgrounds, with RootPainter being a
GUI-based example (Smith et al. 2020). In addition, ImageJ has many thresholding options, including
color, which could be applied in batch processing. Segmented images can be produced in such a
Ac
companion software, and then processed in RhizoVision Explorer for feature extraction.
Future development of RhizoVision Explorer will focus on correcting any bugs identified, improving
the user interface for convenience, and expanding features measured, especially for differentiating
root classes such as laterals and axial roots or branch orders. In addition, the presence of root hairs
in images can drastically increase all measures but this issue has rarely been discussed in the
literature. Methods to address problems from root hairs may include blurring routines before image
segmentation, or additional methods to prune the skeleton. In order to generate a skeleton that
encodes a more accurate topology, in the future further refinements to define branch points and
delete invalid root tips will need to accommodate the false loops as seen in Fig 3. Most topological
analysis is based on simple considerations of the skeleton branching, however other considerations
14such as child and parent root diameters may help to refine the correct topology. As improvements
are made in identifying root type or order, more measurements at the level of individual roots may
be beneficial such as lateral root insertion angles or diameters. The software is open-source and
community development is highly encouraged. RhizoVision Explorer is intended for roots, however,
it is suitable for measuring leaf area from scanned images, and the plugin-based software
architecture could be extended for other phenotyping needs.
Conclusion
Downloaded from https://academic.oup.com/aobpla/advance-article/doi/10.1093/aobpla/plab056/6366354 by guest on 07 November 2021
RhizoVision Explorer is an image analysis tool that is intended to enable many more researchers to
be able to routinely measure plant roots to answer a variety of biological questions. The graphical
user interface and ready-to-run download for Windows, as seen in other popular image analysis
t
software (Pound et al. 2013), lowers barriers and increases accessibility to image analysis. The
ip
underlying software architecture is modular and with plugin support that is suitable for modifying
for other phenotyping, or other image analysis needs. Future improvements include greater
cr
topology analysis with the ability to predict root order, to provide more features at the diameter bin
or order level such as average diameter and angle. In summary, this open-source software builds on
us
a range of previous software to propose a user-friendly, fast, generalist, collectively improvable, and
all-inclusive tool that will facilitate the standardization of root architectural and morphological
measures.
an
M
e d
pt
ce
Ac
15Data Availability
RhizoVision Explorer is available as a ready-to-run executable for Windows at
https://doi.org/10.5281/zenodo.3747697 (Seethepalli and York 2020).
The open-source code for RhizoVision Explorer written in C++ is available at
https://github.com/noble-research-institute/RhizoVisionExplorer on GitHub.
Downloaded from https://academic.oup.com/aobpla/advance-article/doi/10.1093/aobpla/plab056/6366354 by guest on 07 November 2021
The copper wire image set is available in a public repository and can be downloaded at
http://doi.org/10.5281/zenodo.4677546 (Dhakal et al. 2021a).
These 4 image sets of roots from several plant species are available in a public repository and can be
downloaded at http://doi.org/10.5281/zenodo.4677751 (Dhakal et al. 2021b).
t
ip
The statistical R code and tabular data used in this study are available in a public repository and can
be downloaded at http://doi.org/10.5281/zenodo.4677553 (Dhakal et al. 2021c).
cr
Supporting Information
us
Supplemental Table 1. Combinations of 12 wires used for the copper wire image data set.
Source of Funding
an
The research and software development were funded by Noble Research Institute, LLC and the
Center for Bioenergy Innovation, a U.S. Department of Energy Bioenergy Research Center supported
by the Office of Biological and Environmental Research in the DOE Office of Science, Oak Ridge
M
National Laboratory is managed by UT-Battelle, LLC under Contract DE-AC05-00OR22725 with the
U.S. Department of Energy to L.M.Y.
d
Acknowledgments
e
The authors acknowledge nearly 30 beta testers not listed here that provided helpful feedback to
pt
improve the software before the public release, including in a survey answered by 20 testers.
Especially, the authors thank Arthur Villordon both for his suggestions and his promotion of the
ce
software in the root crop community. The authors thank M. Luke McCormack for providing the tree
root images. Meredith Hanlon provided the speed test results comparing RhizoVision Explorer to
WinRhizoTM. This manuscript has been authored by UT-Battelle, LLC, under contract DE-AC05-
Ac
00OR22725 with the US Department of Energy (DOE). The US government retains and the publisher,
by accepting the article for publication, acknowledges that the US government retains a
nonexclusive, paid-up, irrevocable, worldwide license to publish or reproduce the published form of
this manuscript, or allow others to do so, for US government purposes. DOE will provide public
access to these results of federally sponsored research in accordance with the DOE Public Access
Plan (http://energy.gov/downloads/doe-public-access-plan).
Conflict of interest
The authors declare that they have no conflict of interest.
16References
Armengaud P, Zambaux K, Hills A, Sulpice, R, Pattison, RJ, Blatt, MR, Amtmann, A. 2009. 2009. EZ-
Rhizo: integrated software for the fast and accurate measurement of root system
architecture. The Plant Journal 57: 945–956. doi:10.1111/j.1365-313X.2008.03739.x.
Arsenault JL, Poulcur S, Messier C, Guay R. 1995. WinRhizoTM, a root-measuring system with a unique
overlap correction method. HortSci 30: 906D–906. doi:10.21273/HORTSCI.30.4.906D.
Downloaded from https://academic.oup.com/aobpla/advance-article/doi/10.1093/aobpla/plab056/6366354 by guest on 07 November 2021
Bardgett RD, Mommer L, De Vries FT. 2014. Going underground: root traits as drivers of ecosystem
processes. Trends in Ecology & Evolution 29: 692–699. doi:10.1016/j.tree.2014.10.006.
Böhm W. 1979. Root parameters and their measurement. In: WD Billings, F Golley, OL Lange, JS
t
Olson, eds. Methods of studying root systems. Springer: New York, USA, 125–138.
ip
Costa C, Dwyer LM, Hamilton RI, Hamel C, Nantais L, Smith DL. 2000. A sampling method for
cr
measurement of large root systems with scanner-based image analysis. Agronomy Journal
92: 621–627. doi:10.2134/agronj2000.924621x.
us
Das A, Schneider H, Burridge J, Ascanio AKM, Wojciechowski T, Topp CN, Lynch JP, Weitz JS, Bucksch
A. 2015. Digital imaging of root traits (DIRT): a high-throughput computing and collaboration
platform for field-based root phenomics. Plant Methods 11: 51. doi:10.1186/s13007-015-
an
0093-3.
Delory BM, Weidlich EWA, Meder L, Lütje A, van Duijnen R, Weidlich R, Temperton VM. 2017.
M
Accuracy and bias of methods used for root length measurements in functional root
research. Methods in Ecology and Evolution 8: 1594–1606. doi:10.1111/2041-210X.12771.
d
Dhakal K, Seethepalli A, Griffiths M, Guo H, Freschet GT, York LM. 2021a. Images of copper wires
with various diameters for validating root image analysis [Data set]. Zenodo
e
doi:10.5281/zenodo.4677546.
pt
Dhakal , Seethepalli A, riffiths M, uo H, Freschet T, York LM. 2021b. Scanned images of roots
from wild herbaceous species, trees, maize, and wheat [Data set]. Zenodo
ce
doi 10.5281 zenodo.4677751.
Dhakal , Seethepalli A, riffiths M, uo H, Freschet GT, York LM. 2021c. Data and statistical code
Ac
for the manuscript on RhizoVision Explorer for root image analysis [Data set]. Zenodo
doi 10.5281 zenodo.4677553.
Douglas DH, Peucker TK. 1973. Algorithms for the reduction of the number of points required to
represent a digitized line or its caricature. Cartographica 10: 112–122. doi:10.3138/FM57-
6770-U75U-7727.
Eshel A, Beeckman T. 2013. Plant roots: the hidden half, 4th edn. CRC Press: Boca Raton, FL.
Felzenszwalb PF, Huttenlocher DP. 2012. Distance transforms of sampled functions. Theory of
Computing 8: 415-428. doi:10.4086/toc.2012.v008a019.
17Fiorani F, Schurr U. 2013. Future Scenarios for Plant Phenotyping. Annual Review of Plant Biology 64:
267–291. doi:10.1146/annurev-arplant-050312-120137.
Freschet GT, Roumet C, Comas LH, Weemstra M, Bengough AG, Rewald B, Bardgett RD, De Deyn GB,
Johnson D, limešová J, Lukac M. 2020. Root traits as drivers of plant and ecosystem
functioning: current understanding, pitfalls and future research needs. New Phytologist
doi:10.1111/nph.17072.
Downloaded from https://academic.oup.com/aobpla/advance-article/doi/10.1093/aobpla/plab056/6366354 by guest on 07 November 2021
Freschet GT, Violle C, Bourget MY, Scherer-Lorenzen M, Fort F. 2018. Allocation, morphology,
physiology, architecture: the multiple facets of plant above- and below-ground responses to
resource stress. New Phytologist 219: 1338–1352. doi:10.1111/nph.15225.
Galkovskyi T, Mileyko Y, Bucksch A, Moore B, Symonova O, Price CA, Topp CN, Iyer-Pascuzzi AS,
t
ip
Zurek PR, Fang S, Harer J. 2012. GiA Roots: software for the high throughput analysis of plant
root system architecture. BMC Plant Biology 12: 116. doi:10.1186/1471-2229-12–116.
cr
Gardner WR. 1964. Relation of Root Distribution to Water Uptake and Availability1. Agronomy
Journal 56: 41–45. doi:10.2134/agronj1964.00021962005600010013x.
us
Gherardi LA, Sala OE. 2020. Global patterns and climatic controls of belowground net carbon
fixation. Proc Natl Acad Sci USA 117: 20038. doi:10.1073/pnas.2006715117.
an
Godfray HCJ, Beddington JR, Crute IR, Haddad L, Lawrence D, Muir JF, Pretty J, Robinson S, Thomas
SM, Toulmin C. 2010. Food security: the challenge of feeding 9 billion people. Science 327:
812–818. doi:10.1126/science.1185383.
M
Guerrero-Ramírez NR, Mommer L, Freschet GT, Iversen CM, McCormack ML, Kattge J, Poorter H, van
Der Plas F, Bergmann J, Kuyper TW, York LM. Global root traits (GRooT) database. Global
d
Ecology and Biogeography 30: 25-37. doi:10.1111/geb.13179.
e
Guo H, Habtamu A, Seethepalli A, Dhakal K, Griffiths M, Ma XF, York LM. 2020. Functional phenomics
and genetics of the root economics space in winter wheat using high-throughput
pt
phenotyping of respiration and architecture. New Phytologist.
doi:10.1101/2020.11.12.380238.
ce
Guo H, York LM. 2019. Maize with fewer nodal roots allocates mass to more lateral and deep roots
that improve nitrogen uptake and shoot growth. Journal of experimental botany 70: 5299–
Ac
5309. doi:10.1093/jxb/erz258.
Hamner B, Frasco M. 2018. Metrics: Evaluation Metrics for Machine Learning. R package version
0.1.4.
Harrington JT, Mexal JG, Fisher JT. 1994. Volume displacement provides a quick and accurate way to
quantify new root production. Tree Planter's Notes 45: 121–124.
Harris GA, Campbell GS. 1989. Automated quantification of roots using a simple image analyzer.
Agronomy Journal 81: 935–938. doi:10.2134/agronj1989.00021962008100060017x.
18You can also read


