Climatology of Asian dust activation and transport potential based on MISR satellite observations and trajectory analysis - Atmos. Chem. Phys
←
→
Page content transcription
If your browser does not render page correctly, please read the page content below
Atmos. Chem. Phys., 19, 363–378, 2019
https://doi.org/10.5194/acp-19-363-2019
© Author(s) 2019. This work is distributed under
the Creative Commons Attribution 4.0 License.

Climatology of Asian dust activation and transport potential based
on MISR satellite observations and trajectory analysis
Yan Yu1 , Olga V. Kalashnikova2 , Michael J. Garay2 , and Michael Notaro3
1 Department  of Geography, University of California, Los Angeles, CA 90095, USA
2 JetPropulsion Laboratory, California Institute of Technology, Pasadena, CA 91109, USA
3 Nelson Institute Center for Climatic Research, University of Wisconsin-Madison, Madison, WI 53706, USA

Correspondence: Yan Yu (yuyan06@gmail.com)

Received: 18 August 2018 – Discussion started: 28 September 2018
Revised: 30 November 2018 – Accepted: 18 December 2018 – Published: 11 January 2019

Abstract. Asian dust, primarily emitted from the Takla-         1   Introduction
makan and Gobi deserts, has been reported to reach remote
destinations, such as North America. However, the relative      Long-range transport of Asian dust has been documented
contribution of the Taklamakan and Gobi deserts to dust         in observational records and modeling results. It has been
loadings through long-range transport remains unaddressed       estimated that Asian dust sources account for 3 %–11 % of
in any observational study. Here, the climatology of Asian      global dust emissions (Tanaka and Chiba, 2006). Originat-
dust activation and potential for transport is investigated     ing primarily from the Taklamakan and Gobi deserts (Bory
using stereo observations of dust sources from the Multi-       et al., 2003; Chen et al., 2017b; Prospero et al., 2002; Sun et
angle Imaging SpectroRadiometer (MISR) instrument com-          al., 2001), elevated Asian dust is carried eastward by the pre-
bined with observation-initiated trajectory modeling. MISR-     vailing midlatitude westerlies and crosses over China, South
derived dust plume top height and dust plume motion vec-        Korea, and Japan to the North Pacific (Duce et al., 1980;
tors confirm the peak of dust activation and transport poten-   Huang et al., 2008; Shaw, 1980; Uno et al., 2011; Yumimoto
tial in spring over the Gobi Desert and in both spring and      et al., 2010). Asian dust occasionally reaches North America
summer over the Taklamakan Desert. The long-range tra-          (Eguchi et al., 2009) and the Arctic (Huang et al., 2015) and
jectory patterns of Asian dust, including the influence on      can even be transported for more than one full track around
North America through trans-Pacific transport, are assessed     the globe (Uno et al., 2009). Past observational studies have
using extensive forward trajectories initiated by MISR dust     extensively examined individual cases of long-range, espe-
plume observations. The trajectory analysis reveals latitude-   cially trans-Pacific, transport of Asian dust in terms of the
dependent spread of dust trajectories from the Taklamakan       transport pathways and vertical structure of aerosols (Ari-
and Gobi deserts, with Taklamakan dust dominantly affect-       moto et al., 2006; Eguchi et al., 2009; Liu et al., 2013; Uno et
ing to the south of 50◦ N and Gobi dust primarily affecting     al., 2001, 2008, 2011; Yumimoto et al., 2009, 2010). Several
to the north of 50◦ N in North America. The Asian dust ac-      field campaigns have been conducted to examine the com-
tivation and transport potential exhibit substantial seasonal   position, properties and radiative effects of Asian dust along
and interannual variability, motivating future studies on the   its path of transport, such as the Asian Aerosol Characteri-
potential drivers.                                              zation Experiment (ACE-Asia) (Huebert et al., 2003; Zhang
                                                                et al., 2003), the Intercontinental Chemical Transport Exper-
                                                                iment phase B (INTEX-B) (McKendry et al., 2008), Aeo-
                                                                lian Dust Experiment on Climate Impact (ADEC) (Mikami
                                                                et al., 2006), the National Aeronautics and Space Adminis-
                                                                tration (NASA) Transport and Chemical Evolution over the
                                                                Pacific (TRACE-P) (Jacob et al., 2003), and the Pacific Dust
                                                                Experiment (Stith et al., 2009). However, due to the limited

Published by Copernicus Publications on behalf of the European Geosciences Union.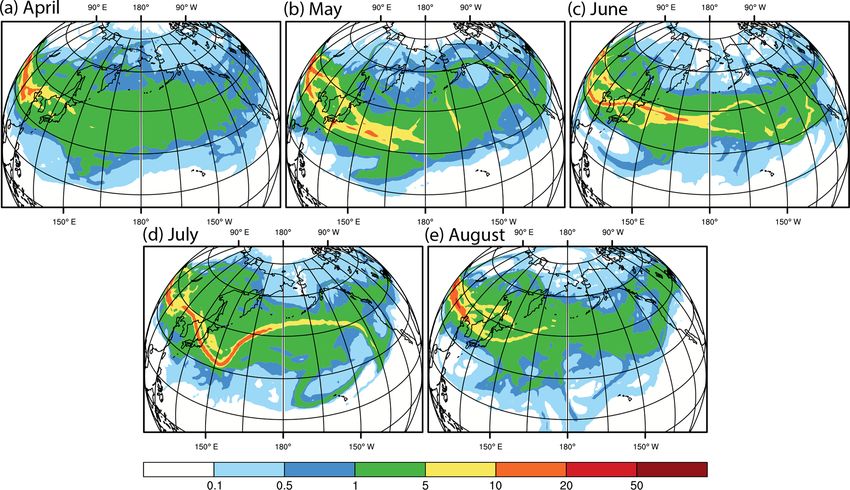
364                                               Y. Yu et al.: Climatology of Asian dust activation and transport potential

temporal coverage, these observational case studies or field      emission and transport need to be verified using observa-
campaigns did not address fundamental long-term statistics,       tional data. Moreover, in light of the distinguished size dis-
such as the frequency of trans-Pacific transport of Asian dust.   tributions, chemical compositions, and optical properties of
   The widely spread Asian dust exerts diverse influences         dust aerosols from the two deserts, knowledge about the dust
on the regional and global environment. East Asian dust of-       activation and transport from the two deserts will facilitate
ten mixes with pollutants, such as sulfate and nitrate, dur-      better understanding of the remote environmental influence
ing the transport over the heavily polluted regions in China      of Asian dust.
(K. Huang et al., 2010; Liu et al., 2014; Wang et al., 2016),        In the current study, dust source activities across the Takla-
leading to degraded air quality downwind in China (Yang           makan and Gobi deserts are examined using stereo retrievals
et al., 2017), South Korea (Ha et al., 2017), Japan (Tobo et      of dust plumes observed by the Multi-angle Imaging Spec-
al., 2010), and the United States (Wu et al., 2015; Zhao et       troRadiometer (MISR) (Diner et al., 1998) instrument on
al., 2008). In particular, based on dust mass fluxes derived      the NASA polar-orbiting Terra satellite. The plume heights
from satellite aerosol optical depth (AOD) observations and       and vector winds are retrieved by the MISR Interactive eX-
zonal wind assimilations, Yu et al. (2012) concluded that the     plorer (MINX) tool (Nelson et al., 2013) in case-by-case
trans-Pacific-transported Asian dust overwhelms the locally       plume analysis. The multi-angle capability of MISR facil-
emitted dust in North America. Asian dust deposits into the       itates the stereoscopic retrieval of heights and motion vec-
marginal seas of China and North Pacific, carrying with it        tors for clouds and aerosol plumes (Moroney et al., 2002).
bioavailable iron that enhances phytoplankton growth (Tan         By incorporating additional information on the direction of
et al., 2017; S.-H. Wang et al., 2012; Yuan and Zhang, 2006).     apparent plume motion from a trained user, the MINX vi-
Asian dust has been widely reported to influence regional         sualization and analysis software enables precise retrievals
and global climate directly by altering the radiative budget      of aerosol plume heights and instantaneous winds at a hor-
and indirectly by modifying cloud microphysics (Chen et al.,      izontal resolution of 1.1 km. In prior studies, MINX plume
2017a; Ge et al., 2008; J. Huang et al., 2010, 2014, 2006a,       height and motion retrievals provided unique and valuable
b; Li et al., 2016; Wang et al., 2010). In particular, observa-   information on aerosol injection heights from volcanic erup-
tional evidence indicates that Asian dust aerosols serve as ice   tions (Flower and Kahn, 2018), fires (Val Martin et al., 2010),
nuclei and influence orographic precipitation processes over      and dust source activations (Kalashnikova et al., 2011). The
the western United States (Creamean et al., 2013).                dust plume measurements from MINX enable the current ex-
   Despite the important role of Asian dust in the global en-     amination of the climatology in dust injection heights, which
vironment, the relative contribution of Asian dust sources,       is a key parameter determining the potential for long-range
namely the Taklamakan and Gobi deserts (Fig. 1), to dust          transport yet has never been examined in observational data,
activity at remote destinations, such as North America, re-       across the Taklamakan and Gobi deserts. Furthermore, pre-
mains unaddressed by observational studies (Chen et al.,          cise observations of dust injection heights allow more accu-
2017a). The Taklamakan Desert is located in the Tarim Basin       rate trajectory modeling for the investigation of dust trans-
of northwestern China and bounded by the Kunlun Moun-             port.
tains, the Pamir Plateau, and Tian Shan mountains to the             Through an analysis of plume height and motion ob-
south, west, and north, respectively. The Gobi Desert is lo-      servations from MISR and application of trajectory analy-
cated to the east of the Taklamakan Desert, covering portions     sis, the present study investigates the climatology in dust
of northern China and southern Mongolia. Based on a size-         source activity and dust transport potential from the Takla-
dependent soil dust emission and transport model, namely          makan and Gobi deserts. In particular, the following ques-
the Northern Aerosol Regional Climate Model (NARCM),              tions are addressed. Which dust source, between the Takla-
Zhang et al. (2003) concluded that the Gobi Desert emitted        makan and Gobi deserts, is a greater contributor towards the
about twice the amount of dust as the Taklamakan Desert           long-range transport of dust, such as the trans-Pacific trans-
during spring of 1960–2002. Based on the Weather Research         port to North America? How often do the trans-Pacific dust
and Forecasting model with chemistry (WRF-Chem) simu-             transport events occur? Is there any seasonality and/or inter-
lation of the massive East Asian dust storm in March 2010,        annual variability in the dust activation and transport poten-
Chen et al. (2017a) revealed comparable dust emission fluxes      tial?
from the Gobi and Taklamakan deserts but suggested the
higher potential for long-range dust transport from the Gobi
Desert where the surface wind is dominantly eastward and          2     Data and method
the ground has higher altitude than the Taklamakan Desert.
Given the substantial uncertainty in simulating dust emission     2.1    MINX retrieval of dust plume height and motion
and transport, due to difficulties in the parameterization of
wind speed, soil water content, and vegetation cover (Uno         Dust plumes from the Taklamakan and Gobi deserts were
et al., 2006), the modeling results regarding the relative con-   processed with the MINX tool. Using multiple MISR im-
tributions of the Taklamakan and Gobi deserts toward dust         agery, the trained user of the MINX tool derives aerosol

Atmos. Chem. Phys., 19, 363–378, 2019                                                www.atmos-chem-phys.net/19/363/2019/
Y. Yu et al.: Climatology of Asian dust activation and transport potential 365
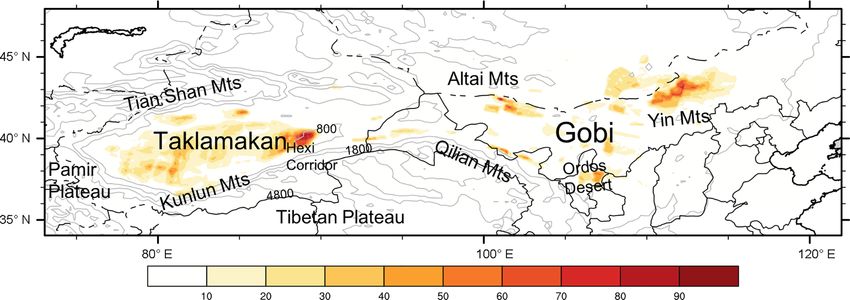
Figure 1. Spatial distribution of dust plume detection frequency (% sample maximum) according to MINX. Grey contours indicate surface
elevation (m) from the Multi-angle Imaging SpectroRadiometer (MISR) digital elevation model (DEM). Dust plume detection frequency in
each pixel is calculated as the number of detected dust plume points per year.
plume top height and wind at a spatial resolution of 1.1 × 2.2 HYSPLIT forward trajectory analysis
1.1 km, with estimated uncertainties in height and wind
speed of 200 m and 1–2 m s−1 , respectively (Nelson et al.,
In order to identify the potential transport pathways of dust
2008). The MINX-based plume height and motion mea-
emitted from the Taklamakan and Gobi deserts, here we ap-
surements are obtained geometrically, independent of back-
ply the Hybrid Single-Particle Lagrangian Integrated Trajec-
ground aerosols and thin cirrus, atmospheric thermal struc-
tory (HYSPLIT) (Stein et al., 2015) model from the Na-
ture, cloud emissivity, or instrument radiometric calibration
tional Ocean and Atmosphere Administration (NOAA) Air
(Kalashnikova et al., 2011). The MISR instrument, with its
Resource Laboratory. The HYSPLIT forward trajectory anal-
380 km swath, views the study region of East Asia every 6–
ysis has been widely used for tracing the downwind evolu-
7 days. Following Nelson et al. (2013), a “dust plume” is
tion of Saharan and Asian dust (Guo et al., 2017; Salvador
defined in this paper as a region of optically distinct dust
et al., 2014; Su and Toon, 2011; Wang et al., 2016). Given
that extends from an identified source to a downwind region,
the spatially widespread influence of Asian dust, long tra-
with a visible connection to the source, so that the direc-
jectories that last for weeks have been analyzed in previous
tion of aerosol transport can be determined visually by the
studies (Guo et al., 2017; Huang et al., 2015; Uno et al.,
user. A “dust plume” typically contains hundreds to thou-
2009; Wang et al., 2013). In the present study, 14-day for-
sands of “dust plume data points”. Dust plumes are identified
ward trajectories from the Taklamakan Desert during 2001–
through MINX from MISR radiance imagery by a trained
2011 and from the Gobi Desert during 2001–2003 are com-
user, with the assistance from the Support Vector Machine
puted based on 6-hourly, three-dimensional wind fields on
(SVM) datasets in the MISR cloud classifiers product (Nel-
a 2.5◦ × 2.5◦ grid from the National Centers for Environ-
son et al., 2013). In the present study, the MINX dust plume
mental Prediction (NCEP)/National Center for Atmospheric
data include 2251 dust plumes with 310 290 dust plume data
Research (NCAR) reanalysis. In recognition of the coarse
points across the central Gobi Desert (36–45◦ N, 90–120◦ E)
spatial resolution of the NCEP/NCAR reanalysis, forward
during 2001–2003, and 8945 plumes with 10 867 131 dust
trajectories from the Taklamakan Desert are also computed
plume data points across the Taklamakan Desert (36–42◦ N,
based on wind fields from the NCEP Global Data Assimila-
77–91◦ E) during 2001–2011. Given the extensive labor work
tion System on a 1◦ × 1◦ grid (GDAS1) during 2006–2011 to
involved in the MINX retrieval, we currently only have
confirm the conclusions from the trajectory analysis driven
3 years of data over the Gobi Desert and 11 years of data over
by the NCEP/NCAR reanalysis.
the Taklamakan Desert. However, the multi-year MINX dust
The initial date, time (around 05:00 UTC), latitude, longi-
plume data provide unique and sufficient information on the
tude, and height of trajectory are obtained from MINX dust
long-term statistics of dust plume characteristics. Accord-
plume observations. Corresponding to the available MINX
ing to the spatial distribution of MINX dust plume samples
dust plume observations, a total of 310 290 forward trajecto-
(Fig. 1), substantial dust activation occurs across the entire
ries are initiated from the 2251 dust plumes across the cen-
Taklamakan Desert, with the highest frequency over the Hexi
tral Gobi Desert (36–45◦ N, 90–120◦ E) during 2001–2003,
Corridor, where the surface wind is intensified due to the tun-
and 10 867 131 forward trajectories are initiated from the
nel effect by surrounding mountains. In contrast, across the
8945 dust plumes across the Taklamakan Desert (36–42◦ N,
Gobi Desert, dust activation is limited to several hotspots,
77–91◦ E) during 2001–2011. Given the spatial resolution of
such as to the lee of the Yin, Qilian, and Altai mountains,
1.1 km of the MINX dust plume data, the trajectories initi-
and over the Ordos Desert.
ated from the nearby points in the same dust plume constitute
www.atmos-chem-phys.net/19/363/2019/ Atmos. Chem. Phys., 19, 363–378, 2019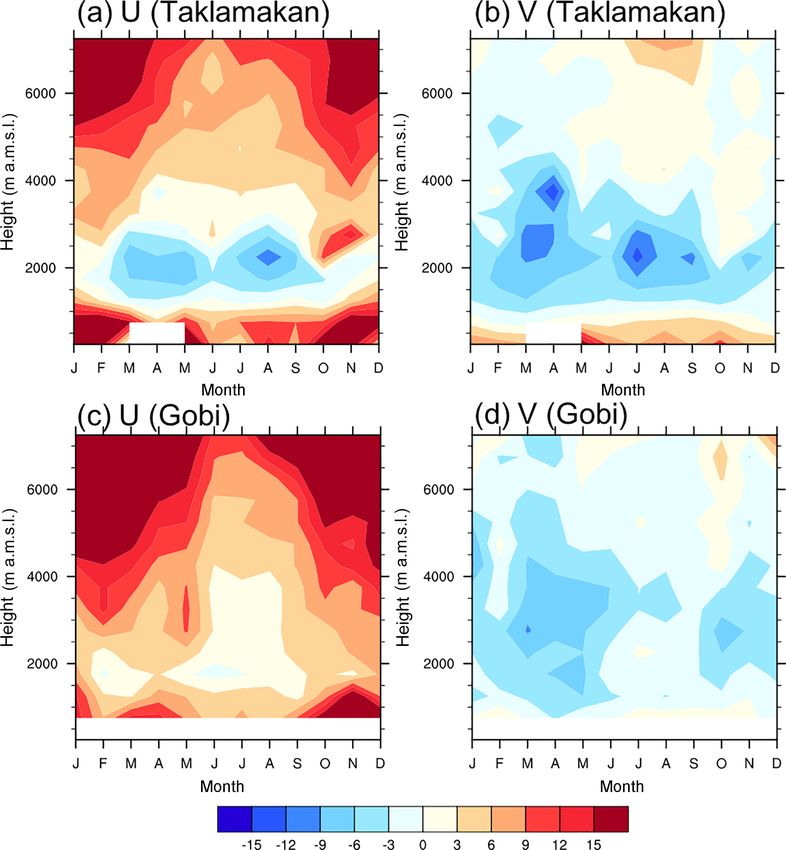
366                                                  Y. Yu et al.: Climatology of Asian dust activation and transport potential

a natural ensemble (Fig. S1 in the Supplement), thereby min-
imizing the trajectory calculation error. By initiating the tra-
jectory model with the observed, precise dust plume height,
the modeled transport pathways are improved. Given the ca-
pability of MISR at observing plume top features, we only
analyze trajectories initiated at the observed dust plume top
height in the current study.
   In order to explore the sensitivity of atmospheric suspen-
sion time to initial injection height over the two deserts, ex-
perimental trajectories from the dust emission hotspots in the
Taklamakan (40◦ N, 89◦ E; elevation of 805 m a.m.s.l.) and
Gobi deserts (43.5◦ N, 130◦ E; elevation of 954 m a.m.s.l.)
were initialized with injection height varying from 100 to
4000 m above ground in the previously reported dust active
months of March–May during 2001–2003 (Fig. 2). Accord-               Figure 2. Atmospheric suspension time (hours) of dust parti-
ing to this experiment, the atmospheric suspension time is           cles emitted from the Taklamakan (40◦ N, 89◦ E; elevation of
sensitive to the initial injection height in the trajectory model    805 m a.m.s.l.) (blue) and Gobi deserts (43.5◦ N, 130◦ E; elevation
for dust particles emitted from both the Taklamakan and Gobi         of 954 m a.m.s.l.) (red) as a function of injection height (m a.m.s.l.),
deserts. Dust particles that are injected higher into the atmo-      based on trajectories in March–May of 2001–2003. The thick lines
sphere generally have higher potential for longer atmospheric        (shading) represent the median (10th to 90th percentiles) of suspen-
suspension time and thereby permit transport over a longer           sion time among 276 trajectories for each injection height.
distance. In particular, particle suspension time is most sen-
sitive to initial injection height when the injection height is
                                                                     ucts based on radiometric heights, such as those retrieved
below 2000 m above mean sea level (a.m.s.l.) over the Takla-
                                                                     by the Geostationary Operational Environmental Satellite
makan Desert and 2500 m a.m.s.l. over the Gobi Desert, po-
                                                                     (GOES) and Moderate Resolution Imaging Spectroradiome-
tentially attributed to the differentiated vertical profile of at-
                                                                     ter (MODIS) AMV algorithms, the geometric heights as-
mospheric stability over the two regions indicated by the cli-
                                                                     signed to MISR CMVs are not sensitive to radiometric cal-
matology in vertical motion (Fig. S2). Incremental increases
                                                                     ibrations, thereby facilitating higher accuracy (Mueller et
of 100 m in initial injection height over both deserts led to in-
                                                                     al., 2017). MISR CMVP has been successfully applied to
creases in the median atmospheric suspension time by more
                                                                     identify dust sources associated with the high frequency of
than 1 week at the most, suggesting the critical role of precise
                                                                     rapidly propagating dust plumes near the surface across north
injection height in accurate modeling of dust transport and
                                                                     Africa and the Middle East (Yu et al., 2018). In addition to
thereby determining the long-range transport. The sensitivity
                                                                     MISR wind, vertical motion from the 0.5◦ × 0.625◦ Modern-
of atmospheric suspension time to injection height appears to
                                                                     Era Retrospective analysis for Research and Applications
be independent of the meteorological driver of the trajecto-
                                                                     version 2 (MERRA-2) (Gelaro et al., 2017) was also ana-
ries, since quantitatively similar sensitivity is evident in the
                                                                     lyzed in an effort to explain the difference in the injection
analysis based on additional trajectories driven by GDAS1
                                                                     height and potential for long-range transport of dust from the
and NCEP/NCAR during 2006–2008 (Fig. S3).
                                                                     Taklamakan and Gobi deserts, and confirm the findings from
                                                                     trajectories driven by NCEP/NCAR and GDAS1 reanalyses.
2.3   MISR wind and MERRA2 reanalysis

In order to identify the dust transport directions over the Tak-     3     Results
lamakan and Gobi deserts, the wind climatology is examined
at different vertical levels at a spatial resolution of 17.6 km      3.1    Asian dust plume characteristics
from version F02_0002 of the MISR Level 3 cloud motion
vector product (CMVP) for the time period of 2000–2017. In           Based on the joint probability distribution of dust plume
this product, imagery from multiple MISR cameras is used             top height and motion speed (Fig. 3), dust particles from
to simultaneously retrieve motion, namely wind speed and             the Taklamakan and Gobi deserts are injected to simi-
direction, and top height of automatically tracked features,         lar heights above sea level, despite generally lower sur-
such as optically thick aerosol plumes and clouds, thereby           face elevations across the Taklamakan Desert. Over both
providing a proxy measure of wind (Mueller et al., 2012).            deserts, the dust plume top heights are most frequently
In data-sparse regions like the Taklamakan and Gobi deserts,         observed between 1000 and 1500 m a.m.s.l., i.e., from the
CMVP provides valuable information on the observed wind              surface to about 500 m above the ground. About 5 % of
and complements any reanalysis or model simulation. Com-             dust plumes are injected to higher than 2 km a.m.s.l. over
pared with other atmospheric motion vector (AMV) prod-               both deserts. The greatest dust plume top height in the

Atmos. Chem. Phys., 19, 363–378, 2019                                                     www.atmos-chem-phys.net/19/363/2019/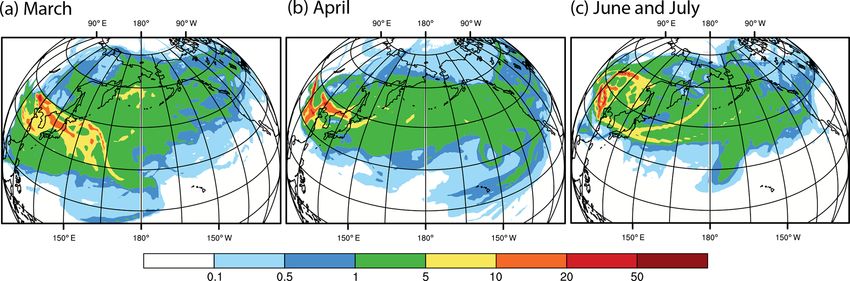
Y. Yu et al.: Climatology of Asian dust activation and transport potential                                                           367

Figure 3. Joint probability density function (%) of dust plume top height (m a.m.s.l.) and moving speed (m s−1 ) across the (a) Taklamakan
Desert during 2001–2011 and (b) central Gobi Desert during 2001–2003 from MINX dust plume observation.

MINX dataset is 3021 m a.m.s.l. over the Taklamakan Desert,            from MODIS (Yu et al., 2008) and the Along-Track Scanning
and 2915 m a.m.s.l. over the Gobi Desert, apparently corre-            Radiometer version 2 (ATSR-2) and Advanced Along-Track
sponding to local dust emissions, rather than from remote              Scanning Radiometer (AATSR) (De Leeuw et al., 2018; So-
dust sources discussed in other studies (Hofer et al., 2017;           gacheva et al., 2018), vertical distribution of dust aerosols
Mikami et al., 2006; Tanaka et al., 2005). Taking into ac-             observed by the Cloud-Aerosol Lidar with Orthogonal Polar-
count the differential sensitivity of atmospheric suspension           ization (CALIOP) lidar instrument (Liu et al., 2008; Proes-
time to dust injection height over the two deserts (Fig. 2),           takis et al., 2018; Xu et al., 2016), as well as dust observa-
dust emitted from the Taklamakan Desert appears to have                tions at weather stations in China and Mongolia (Lim and
higher potential for long-range transport than dust emitted            Chun, 2006), among other observational evidence. Over the
from the Gobi Desert. According to the trajectory analysis,            Taklamakan Desert, the occurrence of dust activation peaks
under dry conditions without wet deposition, dust particles            in April and remains active except for the boreal winter
injected to above 2 km a.m.s.l. over the Taklamakan Desert             months of November–February. An earlier study analyzing
often stay in the atmosphere for longer than 12 days, which            weather station, radiosonde, and reanalysis data suggests a
requires an injection height above 2.5 km a.m.s.l. from the            key role of the nocturnal low-level jet on the dust activation
Gobi Desert (Fig. 2). In addition, the dust plume top height           over the Taklamakan Desert during spring and summer (Ge
over both deserts appears to be independent of wind speed,             et al., 2016). Dust particles are injected to higher levels in
similar with the findings based on MISR observations and               boreal spring and summer, indicating seasonally enhanced
a 1-D plume rise model regarding smoke plumes associated               potential for long-range transport of Taklamakan dust. Over
with wildfires (Sofiev et al., 2012). The elevated dust plumes         the Gobi Desert, dust activation mostly occurs in March and
are mainly associated with weak winds below 5 m s−1 over               April, driven by seasonally enhanced surface wind speeds as-
the Taklamakan Desert, compared with strong winds exceed-              sociated with frequent cyclogenesis over northern China and
ing 15 m s−1 over the Gobi Desert. Indeed, since the dust              Mongolia (Kurosaki and Mikami, 2004). Unlike the year-
plume dataset contains points both over and downwind of                round dryness across the Taklamakan Desert, the Gobi Desert
the source, dust particles from the Gobi Desert are usually            is affected by the East Asian summer monsoon, which in-
activated by strong surface winds exceeding 10 m s−1 . The             hibits summertime dust activation across the Gobi Desert
wind speed decreases quickly downwind of the actual source,            (Arimoto et al., 2006). Dust plume top height also peaks in
causing the apparent discontinuity in the wind speed distri-           March and April over the Gobi Desert, suggesting the highest
bution over the Gobi Desert (Fig. 3b). The different wind              potential for long-range dust transport during these 2 months.
regimes associated with dust injection height are primarily            The July peak of dust injection height over the Gobi Desert
due to soil characteristics across the two deserts, namely             is likely due to enhanced ascent (Fig. S2) but needs further
primarily fine sands across the Taklamakan Desert versus               investigation, especially given the limited samples of dust
coarse, rocky soils across the Gobi Desert (Sun et al., 2013).         plumes during July in the current study.
   Dust activation events occur most frequently in spring over            The climatology in horizontal wind, especially the zonal
both the Taklamakan and Gobi deserts (Fig. 4), consistent              wind, is less favorable for eastward dust transport from
with previous findings based on the climatology of AOD                 the Taklamakan Desert than from the Gobi Desert (Fig. 5).

www.atmos-chem-phys.net/19/363/2019/                                                        Atmos. Chem. Phys., 19, 363–378, 2019
368                                                   Y. Yu et al.: Climatology of Asian dust activation and transport potential

Figure 4. Seasonality in dust plume characteristics from MINX dust plume data. (a, d) Dust plume occurrence per year bar chart, (b, e) injec-
tion height box plot (10th, 25th, 50th, 75th, and 90th percentiles), and (c, f) plume top moving speed box plot, across the (a–c) Taklamakan
(2001–2011) and (d–f) Gobi (2001–2003) deserts, respectively, by month.

Around 2 km a.m.s.l., the predominant wind direction is east-            3.2   Potential transport pathways of Asian dust
erly in most months over the Taklamakan Desert, compared
with dominant westerlies over the Gobi Desert at most verti-
cal levels in most months. However, stronger ascending mo-               The dust transport pathways are complicated after emis-
tion is noted at most vertical levels in most months over the            sion from the Taklamakan Desert (Fig. 6). During the first
Taklamakan Desert than over the Gobi Desert (Fig. S2), in-               2 days after emission, dust trajectories are mainly observed
cluding especially the climatological ascent from the surface            over limited areas in northern China and Mongolia near the
to about 3 km a.m.s.l. during April to October; this indicates           source. Starting from the third day after emission, air parcels
a higher potential for dust over the Taklamakan Desert to be-            that contain dust particles from the Taklamakan Desert begin
come elevated to greater heights and enter the mean west-                to affect the Korean Peninsula, Japan, and the northwestern
erlies above 4 km a.m.s.l. Indeed, vertical motion exerts a              Pacific Ocean and reach the west coast of North America
strong influence on the travel distance of dust particles, as in-        as early as on the sixth day after emission. By day 12 after
dicated by the correlation between dust particle atmospheric             emission, Taklamakan dust trajectories reach scattered areas
suspension time and first 3 h average vertical motion (−0.61             of North America but are more frequently present over other
for Taklamakan and −0.58 from Gobi, both p values < 0.01)                parts of the Northern Hemisphere. Given the widespread na-
according to 10 867 131 trajectories from the Taklamakan                 ture of dust after long-range transport, the absolute values in
Desert and 310 290 trajectories from the Gobi Desert. In con-            the spatial distribution of trajectory endpoint are less infor-
trast, none of the correlations between atmospheric suspen-              mative than the spatial distribution pattern itself, especially
sion time and horizontal winds (U , V , or wind speed) are               after several days after emission. In summary, the trajec-
significant for either desert. The identified key role of verti-         tory passage suggests that dust emitted from the Taklamakan
cal motion in determining the dust particle atmospheric sus-             Desert undergoes various complicated routes, with a small
pension time confirms previous findings based on dust events             portion reaching North America as early as on the sixth day
during the ACE-Asia field campaign (Tsai et al., 2008).                  after emission.
                                                                            Dust from the Gobi Desert undergoes even more compli-
                                                                         cated trajectory pathways that are closer to the Arctic com-

Atmos. Chem. Phys., 19, 363–378, 2019                                                        www.atmos-chem-phys.net/19/363/2019/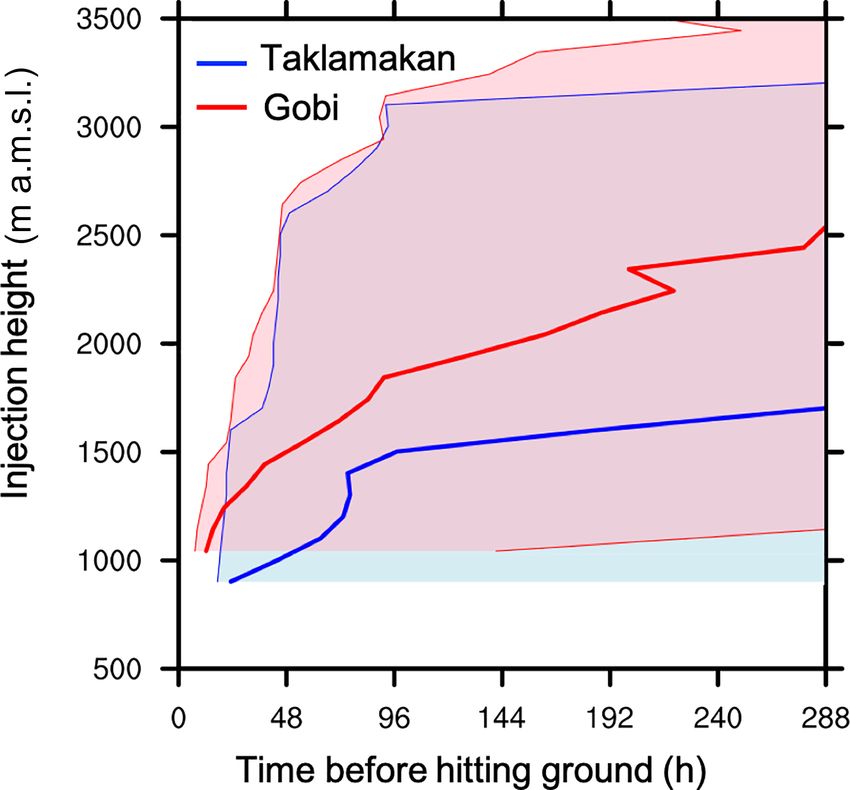
Y. Yu et al.: Climatology of Asian dust activation and transport potential                                                             369

Figure 5. Regional average (a, c) zonal (U ) and (b, d) meridional (V ) wind (m s−1 ) climatology across the (a–b) Taklamakan and (c–d) Gobi
deserts, by month and height. The wind data are from MISR CMVP during 2001–2017, sampling the days with optically thick dust plumes
or clouds. The missing cells represent levels below ground or sampled by CMVP for less than 10 times.

pared with dust from the Taklamakan Desert (Fig. 7). Since              to the trajectory analysis. Along with the seasonal place-
the Gobi Desert is located to the east of the Taklamakan                ment of the predominant midlatitude westerlies, the spread
Desert, Gobi dust begins to influence the northwestern Pa-              of Taklamakan dust exhibits a northward shift from spring to
cific earlier than Taklamakan dust. However, due to compli-             summer, mainly affecting 30–45◦ N over North America in
cated meteorological conditions, likely associated with polar           spring (April–May) and 45–60◦ N in summer (June–August).
fronts and jet streams, Gobi dust trajectories do not arrive to         In May, both polar and subtropical jet streams contribute to
North America until day 8 after emission. Compared with the             the long-range transport of Taklamakan dust, as suggested by
spatial distribution of Taklamakan dust influence, Gobi dust            the apparent bifurcating transport paths (Fig. 8b). Moreover,
trajectories exert an influence over wider areas, ranging from          in May, 1 %–5 % of trajectories from the Taklamakan Desert
as far south as 10◦ N over the Pacific Ocean to as far north as         carry dust to south and southeast Asia, exerting potential in-
the Arctic.                                                             fluence on the onset of south Asian summer monsoon. The
                                                                        presence of Taklamakan dust over south and southeast Asia,
3.3   Seasonality in transport potential of Asian dust                  according to observation-initiated trajectories, supports the
                                                                        findings regarding the influence of Asian dust on the south
The transport potential of Taklamakan dust exhibits sub-                Asian summer monsoon by previous modeling study (Lau et
stantial seasonal variability (Fig. 8). The area affected by            al., 2006). In July, the troughing pattern of trajectories east
Taklamakan dust trajectories generally ranges from 30 to                of Japan is likely caused by the frequent occurrence of extra-
60◦ N, with greater influence in East Asia near its source in           tropical low pressure centers associated with the sea surface
all months. Consistent with implications from dust plume                temperature gradient across the Kuroshio Current and its ex-
height (Fig. 4), Taklamakan dust is frequently transported              tension, along with the subtropical high pressure well devel-
over a long distance in both spring and summer, according

www.atmos-chem-phys.net/19/363/2019/                                                         Atmos. Chem. Phys., 19, 363–378, 2019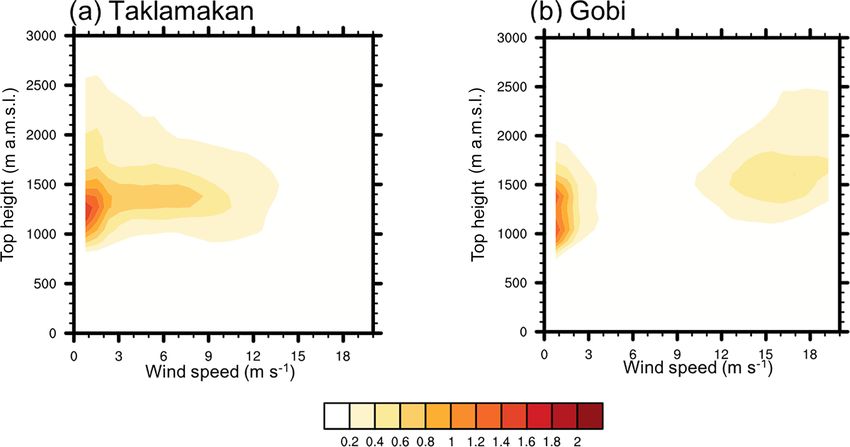
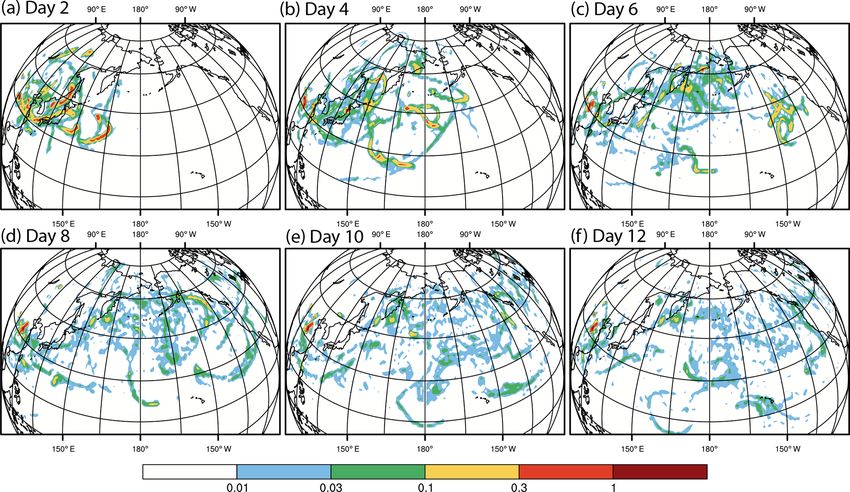
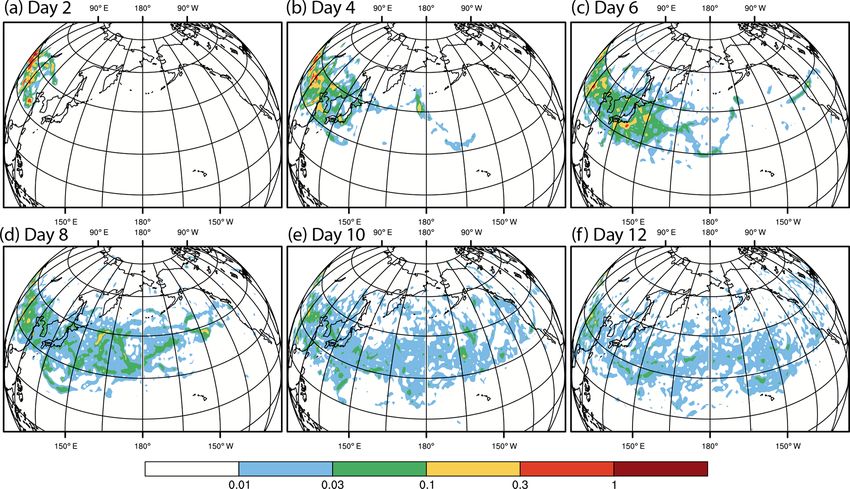
370                                                      Y. Yu et al.: Climatology of Asian dust activation and transport potential

Figure 6. Spatial distribution (%) of trajectory endpoints by the end of days (a) 2, (b) 4, (c) 6, (d) 8, (e) 10, and (f) 12 after emission from the
Taklamakan Desert during 2001–2011. The spatial distribution values over all 1◦ latitude × 1◦ longitude grids in the Northern Hemisphere
sum up to 100 %.

Figure 7. Spatial distribution (%) of trajectory endpoints by the end of days (a) 2, (b) 4, (c) 6, (d) 8, (e) 10, and (f) 12 after emission from
the central Gobi Desert during 2001–2003.

Atmos. Chem. Phys., 19, 363–378, 2019                                                            www.atmos-chem-phys.net/19/363/2019/
Y. Yu et al.: Climatology of Asian dust activation and transport potential                                                                371

Figure 8. Trajectory passage frequency (% of trajectories) from the Taklamakan Desert in (a) April, (b) May, (c) June, (d) July, and (e) August
during 2001–2011. These months are analyzed because there are at least 10 000 data points with initial injection height exceeding 2 km a.m.s.l.
in each of these months. The trajectory passage frequency is calculated as the number of trajectories crossing over each 1◦ latitude × 1◦
longitude grid in the Northern Hemisphere divided by the total number of trajectories from the Taklamakan Desert in each month.

oped in summer centered around 30◦ N, 170◦ E (Tanimoto et                 ber of trajectories passing through and the area affected by
al., 2011).                                                               a substantial number of trajectories from the Taklamakan
   Substantial seasonality is also present in the trajectory pas-         Desert maximize around 40◦ N over North America. In con-
sages of dust particles emitted from the Gobi Desert (Fig. 9).            trast, both statistics maximize around 50–55◦ N over North
Similar to dust particles from the Taklamakan Desert, the                 America for Gobi dust trajectories. Around 40◦ N over North
springtime dust from the Gobi Desert generally spreads                    America, about 500 trajectories from the Taklamakan Desert
wider than summertime dust, consistent with the implication               and 150 trajectories from the Gobi Desert are observed each
from the seasonal cycle of injection height (Fig. 4). The con-            year during 2001–2003, with about 60 % and 20 % of the
strained and northward spread of Gobi dust in June is likely              North American area affected by more than 100 trajectories
due to seasonally weakened and northward displacement of                  per year from the Taklamakan and Gobi deserts, respectively.
polar jet streams. In March, 1 %–5 % of dust trajectories from            Around 55◦ N, these numbers are 300 and 400 trajectories
the Gobi Desert travel over the Bering Strait to the Arctic,              per year from the Taklamakan and Gobi deserts, respectively,
likely causing phenomena like Arctic haze at several kilome-              and 10 % and 20 % of the area affected by more than 100 tra-
ters above the ground (Rahn et al., 1977).                                jectories per year from the Taklamakan and Gobi deserts, re-
                                                                          spectively. The latitudinal distribution of the influence from
3.4   Spread of Asian dust to North America                               both deserts is likely due to the relatively strong northerly
                                                                          wind over the Taklamakan Desert compared to those over
                                                                          the Gobi Desert (Fig. 5). The relatively wider spread of Tak-
Taklamakan dust generally exerts a geographically wider
                                                                          lamakan dust trajectories, compared to Gobi dust trajectories,
spread over North America, especially over the southern
                                                                          in North America is consistent with the implications from the
part of the continent, than Gobi dust, according to trajec-
                                                                          dust plume top height (Fig. 3), atmospheric suspension time
tory analysis (Fig. 10). Overall, 5756 (3.9 %) dust trajectories
                                                                          (Fig. 2), and local meteorological conditions (Figs. 5 and S2)
from the Taklamakan Desert and 3804 (3.7 %) dust trajecto-
                                                                          regarding the higher potential of long-range transport from
ries from the Gobi Desert travel over North America each
                                                                          the Taklamakan Desert. The latitudinal distribution in the in-
year during 2001–2003, affecting 31 % and 23 % of the to-
                                                                          fluence of Taklamakan dust on North America has been ver-
tal area by more than 100 dust trajectories per year from the
                                                                          ified based on additional trajectories during 2006–2011 us-
Taklamakan and Gobi deserts, respectively. Both the num-

www.atmos-chem-phys.net/19/363/2019/                                                           Atmos. Chem. Phys., 19, 363–378, 2019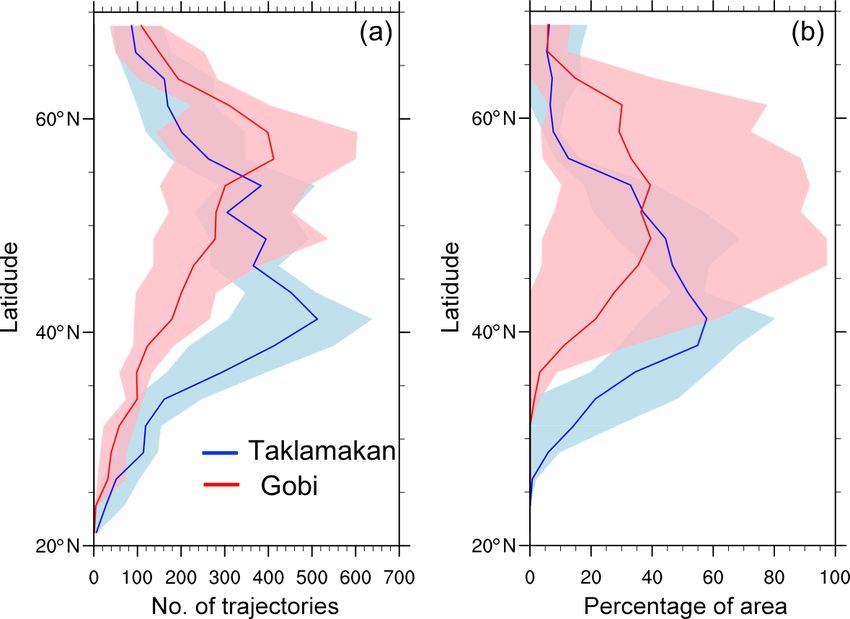
372 Y. Yu et al.: Climatology of Asian dust activation and transport potential
Figure 9. Trajectory passage frequency (% of trajectories) from the central Gobi Desert in (a) March, (b) April, and (c) June and July during
2001–2003. There are at least 2500 data points with initial injection height exceeding 2 km a.m.s.l. in each of the analyzed periods. The
trajectory passage frequency is calculated as the number of trajectories crossing over each 1◦ latitude × 1◦ longitude grid in the Northern
Hemisphere divided by the total number of trajectories from the Gobi Desert in each month.
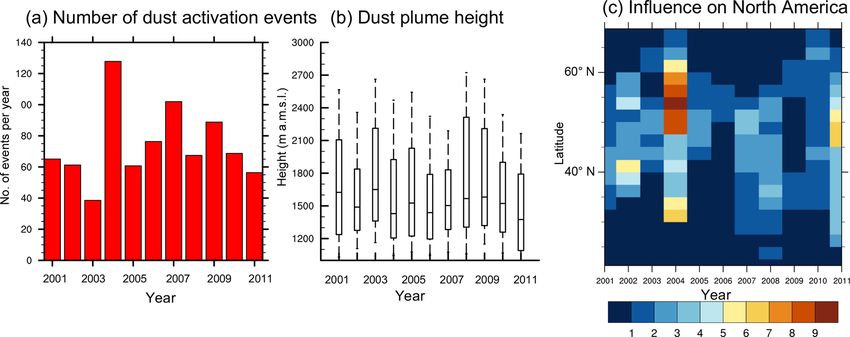
ing 2001–2011 (Fig. 11). The number of dust activation
events captured by MISR and retrieved by MINX varies from
38 events in 2003 to 127 events to 2004. The inhibited dust
activation in 2003 appears to be associated with anomalous
wet soils, which represent the wettest year in a land sur-
face model ensemble simulation of regional soil moisture in
China during 1950–2006 (Wang et al., 2011). The median
dust plume top height varies from 1334 to 1640 m a.m.s.l. in
2003, suggesting substantial variability in the potential for
long-range transport. In addition, the trajectory patterns vary
by year, as indicated by the influence on the remote regions
such North America by latitude. The year 2004 appears to
be the one with the most favorable meteorological condi-
tions for trans-Pacific transport of Taklamakan dust, with the
percentage of trajectories passing over North America max-
imizing at 10 % over around 53◦ N, likely attributed to two
Figure 10. Spread of Taklamakan and Gobi dust to North America factors. One cause is the inhibited springtime dust activation
by latitude, represented by trajectory passage during 2001–2003.
(23 events in March–May) and enhanced summertime dust
(a) Number of trajectories per year from Taklamakan (blue) and
Gobi (red) that pass over each 2.5◦ latitude band. (b) Percentage of
activation (89 events in June–August), with the latter favor-
area in each 2.5◦ latitude band influenced by more than 100 trajecto- ing a northward shift of the dust spread (Fig. 8). Another
ries per year from Taklamakan (blue) and Gobi (red). The shadings factor is likely the large-scale circulation associated with the
represent maximum and minimum values among 2001, 2002, and El Niño starting from June that favors a northward shift of
2003. These years are selected for the analysis because MISR dust the Asian dust spread (Gong et al., 2006). In 2002 and 2011,
plume data are available for both deserts during that period. the influence of Taklamakan dust maximizes at a lower lati-
tude of around 40 and 45◦ N, respectively. In contrast, during
2006 and 2009, the spread of Taklamakan dust trajectories
ing both NCEP/NCAR and GDAS1 as the meteorological over North America is trivial.
drivers, which also exhibits a peak between 40 and 45◦ N Indeed, such interannual variability is also present in the
(Fig. S4). activation and transport of dust emitted from the Gobi Desert,
as suggested by the 3 years of data (Fig. 10). Limited by the
3.5 Interannual variability in Asian dust activation and short record for dust plumes over the Gobi Desert, we did
transport potential not make an effort to examine interannual variability in dust
emission and transport from the Gobi Desert. However, com-
The activation occurrence, injection height, and potential paring the interannual variability in the influence on North
for long-range transport of dust emitted from the Takla- America by the dust trajectories from both deserts during
makan Desert exhibit substantial interannual variability dur-
Atmos. Chem. Phys., 19, 363–378, 2019 www.atmos-chem-phys.net/19/363/2019/Y. Yu et al.: Climatology of Asian dust activation and transport potential 373
Figure 11. Interannual variability in Taklamakan dust activation and transport during 2001–2011. (a) Dust activation occurrence, (b) dust
plume height box plot (10th, 25th, 50th, 75th, and 90th percentiles), and (c) percentage of trajectories passing over North America by latitude.
2001–2003, it appears that the interannual variability in dust dust plume data and trajectory analysis indicate maximized
emission and transport potential is greater for Gobi dust than dust activation occurrence and highest potential for long-
for Taklamakan dust. The greater interannual variability in range transport in spring from both deserts, with about 5 %
Gobi dust emission and transport is potentially caused by the of the trajectories passing over North America. Substantial
complicated meteorological conditions, especially associated summertime dust activation and long-range transport from
with the frontal activity (Tsai et al., 2008), over the Gobi the Taklamakan Desert occur as well.
Desert and along the Gobi dust transport pathways (Figs. 7 Uncertainty in the current results mainly comes from the
and 9). assumptions in trajectory modeling. By treating dust parti-
cles as tracers in the trajectory modeling, processes such as
wet deposition and gravitational settling are ignored. There-
4 Discussion and conclusions fore, the current trajectory analysis provides an upper limit
of the actual frequency of long-range dust transport, in par-
In the current study, the climatology in dust plume charac- ticular the trans-Pacific dust transport from Asian sources
teristics and long-range trajectory of dust from the Takla- to North America. Taking gravitational settling into account,
makan and Gobi deserts are examined using the climatol- the actual potential for long-range transport of dust from the
ogy of dust plume top heights and winds near the source de- Taklamakan Desert, compared to that of the Gobi Desert, is
rived from MISR stereo observations of optically thick dust probability even higher than assessed in the current study,
plume and trajectory analysis. Based on the unique MISR given the smaller particle size of Taklamakan dust. However,
dust plume height and plume motion observations and con- the stronger surface wind that activates dust mobilization in
firmed with trajectory analysis, dust particles emitted from the Gobi Desert likely triggers stronger vertical mixing, as
the Taklamakan Desert generally present higher potential for revealed by Gasteiger et al. (2017) regarding dust transport
long-range transport and exert wider spread in their cone of in the Saharan Air Layer, thus compensating the gravita-
influence across North America through trans-Pacific trans- tional settling to a certain degree. These hypotheses can be
port than dust from the Gobi Desert. The higher transport po- tested by analyzing particle size distributions along trajec-
tential of Taklamakan dust is primarily attributed to greater tories from both deserts using ground and satellite observa-
injection heights from the ground, enabled by finer dust par- tions, as well as performing advanced trajectory analysis that
ticles emitted from the Taklamakan Desert and climatologi- considers gravitational settling and wet deposition of dust
cal mid- to low-level ascending motion in spring and sum- particles.
mer. Furthermore, the relative abundance of Taklamakan and In addition, the current study focuses on trajectories initi-
Gobi dust trajectories over North America depends on lati- ated at the top of observed dust plumes. Given the capabil-
tude, with greater influence from Taklamakan dust trajecto- ity of MISR at observing plume top features, we cannot infer
ries to the south of 50◦ N and greater influence from Gobi the vertical structure of dust plumes from MISR stereo obser-
dust trajectories to the north of 50◦ N across North America. vations. With observed dust plume vertical structure, future
Consistent with previous observational evidence, the MISR
www.atmos-chem-phys.net/19/363/2019/ Atmos. Chem. Phys., 19, 363–378, 2019374 Y. Yu et al.: Climatology of Asian dust activation and transport potential
studies are encouraged to analyze trajectories initiated at all dard Earth Sciences Data and Information Services Center (GES
vertical levels with the presence of dust aerosols. DISC). To request the MINX dust plume data and trajectory
Furthermore, the accuracy of trajectory passages presented model outputs, please contact the corresponding author via email
in this study is limited by the usage of the coarse-resolution (yuyan06@gmail.com).
NCEP/NCAR reanalysis as a meteorological driver. Al-
though the conclusions regarding the sensitivity of atmo-
spheric suspension time to dust injection height and influence Supplement. The supplement related to this article is available
online at: https://doi.org/10.5194/acp-19-363-2019-supplement.
of Asian dust on North America have been confirmed with
trajectory analysis driven by a newer reanalysis with higher
spatial resolution (Figs. S3 and S4), the trajectory-analysis-
Author contributions. YY led the study with inputs from co-
based findings regarding Asian dust transport potential and authors. OVK and MJG provided the MINX dust plume data and
relative contribution of Taklamakan and Gobi dust on remote guidance on their usage. MN supported the trajectory analysis. YY
regions such as North America need to be confirmed by fu- prepared the manuscript and figures with comments from all co-
ture observational and modeling efforts. As an extension of authors.
previous modeling studies (Chen et al., 2017a; Zhang et al.,
2003), model simulations of the size-dependent dust emis-
sion from the Taklamakan and Gobi deserts are encouraged Competing interests. The authors declare that they have no conflict
to incorporate observational constraints provided by MISR of interest.
aerosol and particle shape measurements at different wave-
lengths as well as multi-spectral measurements from other
satellite instruments (J. Wang et al., 2012; Xu et al., 2017). Acknowledgements. MISR CMVP data were obtained from the
In order to verify the identified seasonality in dust trajec- NASA Langley Research Center Atmospheric Science Data Center.
tory patterns, we suggest future studies to take advantage of MERRA-2 meteorological reanalysis was obtained from Goddard
both geostationary and polar-orbiting satellite observations, Earth Sciences Data and Information Services Center (GES DISC).
The MINX dust plume data were processed by Michael Goetz
as well as ground-based lidar observations. Such dust ob-
during his 2012 summer internship at JPL and stored at the Jet
servations per trajectory will eventually connect the trajec-
Propulsion Laboratory. Yan Yu was partially funded by NASA’s
tory analysis with actual dust transport. In order to confirm Postdoc Program (NPP). This work was performed at the Jet
our findings about the latitudinal distribution of the influence Propulsion Laboratory, California Institute of Technology, under a
from Gobi and Taklamakan dust, we encourage future stud- contract with the National Aeronautics and Space Administration.
ies to examine isotopic abundance, mineralogical composi- The authors thank the MISR team for providing facilities and
tion, and particle color information from samples collected useful discussions.
at different locations across North America, given the ele-
mental differences in dust minerals between the Taklamakan Edited by: Jianzhong Ma
and Gobi deserts (Zhang et al., 1997). Reviewed by: two anonymous referees
The present results on the interannual variability in dust
activation and transport motivates further observational in-
vestigations on the natural and anthropogenic drivers of such
variability. The aforementioned satellite observations, espe-
References
cially the long-term stereo and optical measurements from
MISR, will facilitate such observational investigation of the Arimoto, R., Kim, Y. J., Kim, Y. P., Quinn, P. K., Bates, T.
interannual variability in dust emission and transport from S., Anderson, T. L., Gong, S., Uno, I., Chin, M., Huebert,
Asia, as demonstrated by previous examples focusing on B. J., Clarke, A. D., Shinozuka, Y., Weber, R. J., Ander-
north Africa and the Middle East (Notaro et al., 2015; Yu et son, J. R., Guazzotti, S. A., Sullivan, R. C., Sodeman, D. A.,
al., 2018). Future observational studies on the environmental Prather, K. A., and Sokolik, I. N.: Characterization of Asian
drivers of Asian dust emission and transport will also ben- Dust during ACE-Asia, Global Planet. Change, 52, 23–56,
efit from the development of advanced statistical methods, https://doi.org/10.1016/j.gloplacha.2006.02.013, 2006.
such as the Stepwise Generalized Equilibrium Feedback As- Bory, A. J. M., Biscaye, P. E., and Grousset, F. E.: Two dis-
sessment which has been successfully applied to examine the tinct seasonal Asian source regions for mineral dust deposited
in Greenland (NorthGRIP), Geophys. Res. Lett., 30, 1–4,
environmental drivers of north African dust and climate vari-
https://doi.org/10.1029/2002GL016446, 2003.
ability (Yu et al., 2017a, b).
Chen, S. Y., Huang, J., Kang, L., Wang, H., Ma, X., He, Y., Yuan,
T., Yang, B., Huang, Z., and Zhang, G.: Emission, transport, and
radiative effects of mineral dust from the Taklimakan and Gobi
Data availability. MISR CMVP data were obtained from the deserts: comparison of measurements and model results, At-
NASA Langley Research Center Atmospheric Science Data Cen- mos. Chem. Phys., 17, 2401–2421, https://doi.org/10.5194/acp-
ter. MERRA-2 meteorological reanalysis was obtained from God- 17-2401-2017, 2017a.
Atmos. Chem. Phys., 19, 363–378, 2019 www.atmos-chem-phys.net/19/363/2019/Y. Yu et al.: Climatology of Asian dust activation and transport potential 375 Chen, S. Y., Huang, J. P., Li, J. X., Jia, R., Jiang, N. X., Kang, L. T., 2), J. Climate, 30 5419–5454, https://doi.org/10.1175/JCLI-D- Ma, X. J., and Xie, T. T.: Comparison of dust emissions, trans- 16-0758.1, 2017. port, and deposition between the Taklimakan Desert and Gobi Gong, S. L., Zhang, X. Y., Zhao, T. L., Zhang, X. B., Barrie, L. A., Desert from 2007 to 2011, Sci. China Earth Sci., 60, 1338–1355, Mckendry, I. G., and Zhao, C. S.: A simulated climatology of https://doi.org/10.1007/s11430-016-9051-0, 2017b. Asian dust aerosol and its trans-pacific transport. Part II: Inter- Creamean, J. M., Suski, K. J., Rosenfeld, D., Cazorla, A., De- annual variability and climate connections, J. Climate, 19, 104– mott, P. J., Sullivan, R. C., White, A. B., Ralph, F., Min- 122, https://doi.org/10.1175/JCLI3606.1, 2006. nis, P., Comstock, J. M., Tomlinson, J. M., and Prather, K. Guo, J., Lou, M., Miao, Y., Wang, Y., Zeng, Z., Liu, H., He, J., A.: Dust and Biological Aerosols, Science, 339, 1572–1578, Xu, H., Wang, F., Min, M., and Zhai, P.: Trans-Pacific transport https://doi.org/10.1126/science.1227279, 2013. of dust aerosols from East Asia: Insights gained from multiple de Leeuw, G., Sogacheva, L., Rodriguez, E., Kourtidis, K., Geor- observations and modeling, Environ. Pollut., 230, 1030–1039, goulias, A. K., Alexandri, G., Amiridis, V., Proestakis, E., https://doi.org/10.1016/j.envpol.2017.07.062, 2017. Marinou, E., Xue, Y., and van der A, R.: Two decades Ha, R., Baatar, A., and Yu, Y.: Identification of atmospheric of satellite observations of AOD over mainland China us- transport and dispersion of Asian dust storms, Nat. Hazards ing ATSR-2, AATSR and MODIS/Terra: data set evaluation Earth Syst. Sci., 17, 1425–1435, https://doi.org/10.5194/nhess- and large-scale patterns, Atmos. Chem. Phys., 18, 1573–1592, 17-1425-2017, 2017. https://doi.org/10.5194/acp-18-1573-2018, 2018. Hofer, J., Althausen, D., Abdullaev, S. F., Makhmudov, A. N., Diner, D. J., Beckert, J. C., Reilly, T. H., Bruegge, C. J., Conel, Nazarov, B. I., Schettler, G., Engelmann, R., Baars, H., Fomba, J. E., Kahn, R. A., Martonchik, J. V, Ackerman, T. P., Davies, K. W., Müller, K., Heinold, B., Kandler, K., and Ansmann, R., Gerstl, S. A. W., Gordon, H. R., Muller, J. P., Myneni, R. A.: Long-term profiling of mineral dust and pollution aerosol B., Sellers, P. J., Pinty, B., and Verstraete, M. M.: Multi-angle with multiwavelength polarization Raman lidar at the Central Imaging SpectroRadiometer (MISR) instrument description and Asian site of Dushanbe, Tajikistan: case studies, Atmos. Chem. experiment overview, IEEE Trans. Geosci. Remote, 36, 1072– Phys., 17, 14559–14577, https://doi.org/10.5194/acp-17-14559- 1087, https://doi.org/10.1109/36.700992, 1998. 2017, 2017. Duce, R. A., Unni, C. K., Ray, B. J., Prospero, J. M., and Mer- Huang, J., Minnis, P., Lin, B., Wang, T., Yi, Y., Hu, Y., Sun- rill, J. T.: Long-range atmospheric transport of soil dust from Mack, S., and Ayers, K.: Possible influences of Asian dust Asia to the tropical North Pacific: Temporal variability, Science, aerosols on cloud properties and radiative forcing observed 209, 1522–1524, https://doi.org/10.1126/science.209.4464.1522, from MODIS and CERES, Geophys. Res. Lett., 33, L06824, 1980. https://doi.org/10.1029/2005GL024724, 2006a. Eguchi, K., Uno, I., Yumimoto, K., Takemura, T., Shimizu, Huang, J., Lin, B., Minnis, P., Wang, T., Wang, X., Hu, A., Sugimoto, N., and Liu, Z.: Trans-pacific dust trans- Y., Yi, Y., and Ayers, J. K.: Satellite-based assessment port: integrated analysis of NASA/CALIPSO and a global of possible dust aerosols semi-direct effect on cloud wa- aerosol transport model, Atmos. Chem. Phys., 9, 3137–3145, ter path over East Asia, Geophys. Res. Lett., 33, L19802, https://doi.org/10.5194/acp-9-3137-2009, 2009. https://doi.org/10.1029/2006GL026561, 2006b. Flower, V. J. B. and Kahn, R. A.: Karymsky volcano eruptive plume Huang, J., Minnis, P., Chen, B., Huang, Z., Liu, Z., Zhao, Q., properties based on MISR multi-angle imagery and the vol- Yi, Y., and Ayers, J. K.: Long-range transport and vertical canological implications, Atmos. Chem. Phys., 18, 3903–3918, structure of Asian dust from CALIPSO and surface mea- https://doi.org/10.5194/acp-18-3903-2018, 2018. surements during PACDEX, J. Geophys. Res., 113, D23212, Gasteiger, J., Groß, S., Sauer, D., Haarig, M., Ansmann, A., https://doi.org/10.1029/2008JD010620, 2008. and Weinzierl, B.: Particle settling and vertical mixing in the Huang, J., Minnis, P., Yan, H., Yi, Y., Chen, B., Zhang, L., and Ay- Saharan Air Layer as seen from an integrated model, lidar, ers, J. K.: Dust aerosol effect on semi-arid climate over North- and in situ perspective, Atmos. Chem. Phys., 17, 297–311, west China detected from A-Train satellite measurements, At- https://doi.org/10.5194/acp-17-297-2017, 2017. mos. Chem. Phys., 10, 6863–6872, https://doi.org/10.5194/acp- Ge, J., Huang, J., Weng, F., and Sun, W.: Effects of dust storms 10-6863-2010, 2010. on microwave radiation based on satellite observation and model Huang, J., Wang, T., Wang, W., Li, Z., and Yan, H.: Cli- simulation over the Taklamakan desert, Atmos. Chem. Phys., 8, mate Effects of dust aerosols over East Asian and semi- 4903–4909, https://doi.org/10.5194/acp-8-4903-2008, 2008. arid regions, J. Geophys. Res.-Atmos., 119, 11398–11416, Ge, J. M., Liu, H., Huang, J., and Fu, Q.: Taklimakan Desert https://doi.org/10.1002/2014JD021796, 2014. nocturnal low-level jet: climatology and dust activity, Atmos. Huang, K., Zhuang, G., Li, J., Wang, Q., Sun, Y., Lin, Y., and Chem. Phys., 16, 7773–7783, https://doi.org/10.5194/acp-16- Fu, J. S.: Mixing of Asian dust with pollution aerosol and the 7773-2016, 2016. transformation of aerosol components during the dust storm Gelaro, R., McCarty, W., Suárez, M. J., Todling, R., Molod, A., over China in spring 2007, J. Geophys. Res., 115, D00K13, Takacs, L., Randles, C. A., Darmenov, A., Bosilovich, M. G., Re- https://doi.org/10.1029/2009JD013145, 2010. ichle, R., Wargan, K., Coy, L., Cullather, R., Draper, C., Akella, Huang, Z., Huang, J., Hayasaka, T., Wang, S., Zhou, T., and S., Buchard, V., Conaty, A., da Silva, A. M., Gu, W., Kim, G. Jin, H.: Short-cut transport path for Asian dust directly to K., Koster, R., Lucchesi, R., Merkova, D., Nielsen, J. E., Par- the Arctic: A case study, Environ. Res. Lett., 10,114018, tyka, G., Pawson, S., Putman, W., Rienecker, M., Schubert, S. https://doi.org/10.1088/1748-9326/10/11/114018, 2015. D., Sienkiewicz, M., and Zhao, B.: The modern-era retrospec- Huebert, B. J., Bates, T., Russell, P. B., Shi, B., Kim, Y. J., Kawa- tive analysis for research and applications, version 2 (MERRA- mura, K., Carmichael, G., and Nakajima, T.: An overview of www.atmos-chem-phys.net/19/363/2019/ Atmos. Chem. Phys., 19, 363–378, 2019
376                                                        Y. Yu et al.: Climatology of Asian dust activation and transport potential

   ACE-Asia: Strategies for quantifying the relationships between              experiment on climate impact: An overview of Japan-China
   Asian aerosols and their climatic impacts, J. Geophys. Res., 108,           joint project ADEC, Global Planet. Change, 52, 142–172,
   8633, https://doi.org/10.1029/2003JD003550, 2003.                           https://doi.org/10.1016/j.gloplacha.2006.03.001, 2006.
Jacob, D. J., Crawford, J. H., Kleb, M. M., Connors, V. S., Ben-             Moroney, C., Davies, R., and Muller, J. P.: Opera-
   dura, R. J., Raper, J. L., Sachse, G. W., Gille, J. C., Em-                 tional retrieval of cloud-top heights using MISR
   mons, L., and Heald, C. L.: Transport and Chemical Evolu-                   data, IEEE Trans. Geosci. Remote, 40, 1532–1540,
   tion over the Pacific (TRACE-P) aircraft mission: Design, ex-               https://doi.org/10.1109/TGRS.2002.801150, 2002.
   ecution, and first results, J. Geophys. Res.-Atmos., 108, 9000,           Mueller, K., Garay, M. J. Di, Girolamo, L., Jovanovic, V., and Mo-
   https://doi.org/10.1029/2002JD003276, 2003.                                 roney, C.: MISR Cloud Motion Vector Product Algorithm Theo-
Kalashnikova, O. V, Garay, M. J., Sokolik, I. N., Diner, D. J., Kahn,          retical Basis Cloud Motion Vector Product Algorithm Theoreti-
   R. A, Martonchik, J. V, Lee, J. N., Torres, O., Yang, W., Mar-              cal Basis, available at: https://eospso.gsfc.nasa.gov/sites/default/
   shak, A., Kassabian, S., and Chodas, M.: Capabilities and lim-              files/atbd/MISR_L3_CMV_ATBD.pdf (last access: 10 Septem-
   itations of MISR aerosol products in dust-laden regions, Proc.              ber 2018), 2012.
   SPIE 8177, Remote Sensing of Clouds and the Atmosphere XVI,               Mueller, K. J., Wu, D. L., Horváth, Á., Jovanovic, V. M., Muller,
   81770O, https://doi.org/10.1117/12.897773, 2011.                            J. P., Girolamo, L. Di, Garay, M. J., Diner, D. J., Moroney, C.
Kurosaki, Y. and Mikami, M.: Effect of snow cover on threshold                 M., and Wanzong, S.: Assessment of MISR Cloud Motion Vec-
   wind velocity of dust outbreak, Geophys. Res. Lett., 31, L03106,            tors (CMVs) relative to GOES and MODIS Atmospheric Mo-
   https://doi.org/10.1029/2003GL018632, 2004.                                 tion Vectors (AMVs), J. Appl. Meteorol. Clim., 56, 555–572,
Lau, K. M., Kim, M. K., and Kim, K. M.: Asian summer                           https://doi.org/10.1175/JAMC-D-16-0112.1, 2017.
   monsoon anomalies induced by aerosol direct forcing: The                  Nelson, D. L., Chen, Y., Kahn, R. A., Diner, D. J., and Mazzoni, D.:
   role of the Tibetan Plateau, Clim. Dynam., 26, 855–864,                     Example applications of the MISR INteractive eXplorer (MINX)
   https://doi.org/10.1007/s00382-006-0114-z, 2006.                            software tool to wildfire smoke plume analyses, Remote Sensing
Li, B., Gasser, T., Ciais, P., Piao, S., Tao, S., Balkanski, Y., Hauglus-      of Fire: Science and Application, vol. 7089, International Society
   taine, D., Boisier, J.-P., Chen, Z., Huang, M., Li, L. Z., Li, Y., Liu,     for Optics and Photonics, San Diego, California, USA, 2008.
   H., Liu, J., Peng, S., Shen, Z., Sun, Z., Wang, R., Wang, T., Yin,        Nelson, D. L., Garay, M. J., Kahn, R. A., and Dunst, B. A.: Stereo-
   G., Yin, Y., Zeng, H., Zeng, Z., and Zhou, F.: The contribution of          scopic height and wind retrievals for aerosol plumes with the
   China’s emissions to global climate forcing, Nature, 531, 357–              MISR INteractive eXplorer (MINX), Remote Sens., 5, 4593–
   361, https://doi.org/10.1038/nature17165, 2016.                             4628, https://doi.org/10.3390/rs5094593, 2013.
Lim, J. Y. and Chun, Y.: The characteristics of Asian dust                   Notaro, M., Yu, Y., and Kalashnikova, O. V.: Regime shift
   events in Northeast Asia during the springtime from                         in Arabian dust activity, triggered by persistent fertile cres-
   1993 to 2004, Global Planet. Change, 52, 231–247,                           cent drought, J. Geophys. Res.-Atmos., 120, 10229–10249,
   https://doi.org/10.1016/j.gloplacha.2006.02.010, 2006.                      https://doi.org/10.1002/2015JD023855, 2015.
Liu, Q., Liu, Y., Yin, J., Zhang, M., and Zhang, T.: Chemical char-          Proestakis, E., Amiridis, V., Marinou, E., Georgoulias, A. K., Solo-
   acteristics and source apportionment of PM10 during Asian dust              mos, S., Kazadzis, S., Chimot, J., Che, H., Alexandri, G., Bini-
   storm and non-dust storm days in Beijing, Atmos. Environ., 91,              etoglou, I., Daskalopoulou, V., Kourtidis, K. A., de Leeuw,
   85–94, https://doi.org/10.1016/j.atmosenv.2014.03.057, 2014.                G., and van der A, R. J.: Nine-year spatial and temporal evo-
Liu, Z., Liu, D., Huang, J., Vaughan, M., Uno, I., Sugimoto, N., Kit-          lution of desert dust aerosols over South and East Asia as
   taka, C., Trepte, C., Wang, Z., Hostetler, C., and Winker, D.: Air-         revealed by CALIOP, Atmos. Chem. Phys., 18, 1337–1362,
   borne dust distributions over the Tibetan Plateau and surrounding           https://doi.org/10.5194/acp-18-1337-2018, 2018.
   areas derived from the first year of CALIPSO lidar observations,          Prospero, J. M., Ginoux, P., Torres, O., Nicholson, S. E., and Gill,
   Atmos. Chem. Phys., 8, 5045–5060, https://doi.org/10.5194/acp-              T. E.: Environmental Characterization Of Global Sources Of At-
   8-5045-2008, 2008.                                                          mospheric Soil Dust Identified With The Nimbus 7 Total Ozone
Liu, Z., Fairlie, T. D., Uno, I., Huang, J., Wu, D., Omar, A., Kar,            Mapping Spectrometer (Toms) Absorbing Aerosol Product,
   J., Vaughan, M., Rogers, R., Winker, D., Trepte, C., Hu, Y., Sun,           Rev. Geophys., 40, 1002, https://doi.org/10.1029/2000rg000095,
   W., Lin, B., and Cheng, A.: Transpacific transport and evolution            2002.
   of the optical properties of Asian dust, J. Quant. Spectrosc. Ra.,        Rahn, K. A., Borys, R. D., and Shaw, G. E.: The Asian
   116, 24–33, https://doi.org/10.1016/j.jqsrt.2012.11.011, 2013.              source of Arctic haze bands, Nature, 268, 713–715,
McKendry, I. G., Macdonald, A. M., Leaitch, W. R., van Donkelaar,              https://doi.org/10.1038/268713a0, 1977.
   A., Zhang, Q., Duck, T., and Martin, R. V.: Trans-Pacific dust            Salvador, P., Alonso-Pérez, S., Pey, J., Artíñano, B., de Bustos,
   events observed at Whistler, British Columbia during INTEX-B,               J. J., Alastuey, A., and Querol, X.: African dust outbreaks
   Atmos. Chem. Phys., 8, 6297–6307, https://doi.org/10.5194/acp-              over the western Mediterranean Basin: 11-year characterization
   8-6297-2008, 2008.                                                          of atmospheric circulation patterns and dust source areas, At-
Mikami, M., Shi, G. Y., Uno, I., Yabuki, S., Iwasaka, Y., Ya-                  mos. Chem. Phys., 14, 6759–6775, https://doi.org/10.5194/acp-
   sui, M., Aoki, T., Tanaka, T. Y., Kurosaki, Y., Masuda, K.,                 14-6759-2014, 2014.
   Uchiyama, A., Matsuki, A., Sakai, T., Takemi, T., Nakawo,                 Shaw, G. E.: Transport of Asian desert aerosol
   M., Seino, N., Ishizuka, M., Satake, S., Fujita, K., Hara, Y.,              to     the     Hawaiian      islands,     J.    Appl.     Meteorol.,
   Kai, K., Kanayama, S., Hayashi, M., Du, M., Kanai, Y., Ya-                  19,            1254–1259,             https://doi.org/10.1175/1520-
   mada, Y., Zhang, X. Y., Shen, Z., Zhou, H., Abe, O., Na-                    0450(1980)0192.0.CO;2, 1980.
   gai, T., Tsutsumi, Y., Chiba, M., and Suzuki, J.: Aeolian dust

Atmos. Chem. Phys., 19, 363–378, 2019                                                            www.atmos-chem-phys.net/19/363/2019/
You can also read