Pseudomonas aeruginosa reverse diauxie is a multidimensional, optimized, resource utilization strategy - Nature
←
→
Page content transcription
If your browser does not render page correctly, please read the page content below
www.nature.com/scientificreports
OPEN Pseudomonas aeruginosa reverse
diauxie is a multidimensional,
optimized, resource utilization
strategy
S. Lee McGill1,2, Yeni Yung3, Kristopher A. Hunt1,4, Michael A. Henson5, Luke Hanley3 &
Ross P. Carlson1,2*
Pseudomonas aeruginosa is a globally-distributed bacterium often found in medical infections.
The opportunistic pathogen uses a different, carbon catabolite repression (CCR) strategy than
many, model microorganisms. It does not utilize a classic diauxie phenotype, nor does it follow
common systems biology assumptions including preferential consumption of glucose with an
‘overflow’ metabolism. Despite these contradictions, P. aeruginosa is competitive in many, disparate
environments underscoring knowledge gaps in microbial ecology and systems biology. Physiological,
omics, and in silico analyses were used to quantify the P. aeruginosa CCR strategy known as ‘reverse
diauxie’. An ecological basis of reverse diauxie was identified using a genome-scale, metabolic model
interrogated with in vitro omics data. Reverse diauxie preference for lower energy, nonfermentable
carbon sources, such as acetate or succinate over glucose, was predicted using a multidimensional
strategy which minimized resource investment into central metabolism while completely oxidizing
substrates. Application of a common, in silico optimization criterion, which maximizes growth
rate, did not predict the reverse diauxie phenotypes. This study quantifies P. aeruginosa metabolic
strategies foundational to its wide distribution and virulence including its potentially, mutualistic
interactions with microorganisms found commonly in the environment and in medical infections.
Pseudomonas aeruginosa is an opportunistic pathogen commonly isolated from diabetic ulcers, burn wounds,
and battlefield injuries, as well as from the lungs of patients with cystic fibrosis (CF)1–3. Its presence is correlated
with high patient morbidity and m ortality4–6. P. aeruginosa is found in ~ 80% of chronic, diabetic ulcers which
cost the US medical system $20–50 billion per year to t reat4–6. P. aeruginosa virulence and persistence mecha-
nisms are enabled across strains by a pangenome possessing approximately 5,200 core g enes7. Maintaining the
large genome and implementing the myriad of virulence strategies necessitates effective strategies for nutrient
acquisition and nutrient allocation to metabolic pathways. While foundational to its global distribution and
virulence, the basis of the P. aeruginosa central metabolism is poorly understood4,6.
Global regulatory systems select preferred carbon sources from pools of substrates in a process known as
carbon catabolite control (CCC) or carbon catabolite repression (CCR)8. The best studied examples of CCR are
from Escherichia coli and Bacillus subtilis8–10. The metabolic designs of these model organisms, which prefer
glucose over other substrates, form the basis of most textbook CCR e xamples11. The CCR strategy represented
by E. coli and B. subtilis is referred to here as ‘classic carbon catabolite repression’ (cCCR) to distinguish it from
the broader CCR term. P. aeruginosa does not display a cCCR phenotype. Instead, this competitive microorgan-
ism, as evidenced by its global distribution which is arguably broader than E. coli12–14, has substrate preferences
that are almost opposite of E. coli. P. aeruginosa utilizes a CCR strategy termed ‘reverse diauxie’ or reverse
CCR (rCCR) which is defined by a hierarchy of preferred carbon sources that is nearly reverse that of cCCR
preferences8,15. P. aeruginosa can readily catabolize glucose although it is not a preferred substrate, instead this
bacterium preferentially catabolizes less energetic, nonfermentable substrates like succinate. The contrarian
1
Department of Chemical and Biological Engineering, Center for Biofilm Engineering, Montana State University,
Bozeman, MT 59717, USA. 2Department of Microbiology and Immunology, Montana State University, Bozeman,
MT 59717, USA. 3Department of Chemistry, University of Illinois at Chicago, Chicago, IL 60607, USA. 4Department
of Civil and Environmental Engineering, University of Washington, Seattle, WA 98115, USA. 5Department of
Chemical Engineering, Institute for Applied Life Sciences, University of Massachusetts, Amherst, MA 01003,
USA. *email: rossc@montana.edu
Scientific Reports | (2021) 11:1457 | https://doi.org/10.1038/s41598-020-80522-8 1
Vol.:(0123456789)
www.nature.com/scientificreports/
hierarchy of preferred carbon sources is proposed to be central to the versatility of P. aeruginosa. The ecological
basis of rCCR is an open question with few published t heories8,9,16,17. A quantitative understanding of rCCR lags
cCCR. This is a critical knowledge gap that contributes to degradation of patient quality of life and costs society
tens of billions of dollars per y ear5.
Natural environments do not permit unconstrained microbial growth18. Instead, life is constrained by the
availability of resources such as reduced carbon or nitrogen sources18. Phenotypic plasticity can permit micro-
organisms to acclimate to resource scarcity19–21. In silico systems biology approaches have investigated resource
investments (e.g. carbon, nitrogen) into different metabolic pathways via the enzyme synthesis requirements. The
in silico methodologies, often referred to as resource allocation analysis or metabolic tradeoff theory, are powerful
tools for predicting and interpreting phenotypes and have been applied extensively to cCCR microorganisms E.
coli and B. subtilis19,22–30. For example, in silico and in vitro studies of E. coli quantified acclimation to carbon,
nitrogen, or iron limitation along a metabolic tradeoff surface by optimizing the functional return on the limiting
nutrient, at the expense of substrates found in excess21,31. This strategy resulted in ‘overflow metabolisms’ with
the secretion of byproducts like acetate and lactate; overflow metabolisms are also known as the Warburg or
Crabtree effect in e ukaryotes32. Resource allocation analysis has not been applied to rCCR organisms. Given the
large genomic potential and phenotypic plasticity of P. aeruginosa, these approaches hold potential for decoding
the metabolic organization of this problematic bacterium.
Here, the ecological basis of P. aeruginosa rCCR was tested using a combination of physiological studies,
exometabolomics, proteomics, and systems biology. The preference for substrates was measured and pheno-
typic characteristics, like the general lack of an overflow metabolism, were quantified. Proteomics measured a
constitutive core metabolism centered on respiration and a dynamic set of enzymatic pathways that catabolized
specific substrates, directing intermediates toward the core metabolism. The experimental data was analyzed
with a genome-scale, metabolic model of P. aeruginosa and flux balance analysis (FBA) to identify ecological
theories that predicted the observed phenotypes. P. aeruginosa did not optimize substrate preference based on
standard systems biology assumptions such as the maximization of growth rate, as is commonly applied to cCCR
phenotypes. Instead, P. aeruginosa metabolism was organized around a multidimensional, resource utilization
strategy with constitutive expression of a respiration-based, core metabolism and substrate preferences that were
based on minimizing the nutrient investment required to completely oxidize the substrate. Understanding a
molecular-level basis of substrate preference, energy metabolism, and cell growth is foundational to controlling
virulence mechanisms in P. aeruginosa including consortial interactions.
Results
Growth physiology and substrate preference of rCCR. Pseudomonas aeruginosa strain 215 (Pa 215)
is a medical isolate from a chronic wound33,34. Pa 215 was grown in chemically-defined, glucose containing, CSP
G medium (materials and methods, supplementary material S1). Cultures exhibited two distinct exponential
growth phases followed by stationary phase (Fig. 1). A subset of amino acids was consumed preferentially during
the first exponential growth phase, which had the highest specific growth rate (Fig. 1, supplementary material
S2). The second exponential growth phase corresponded with the catabolism of second and third tier amino
acids and glucose. CSP G media contained a small concentration (3 mM) of citrate, which was added as an
ion chelator; however, the citrate was readily catabolized as a preferred substrate during the first growth phase.
The cultures did not exhibit an overflow metabolism defined by the secretion of reduced metabolic byproducts
like acetate, as is typical of microorganisms expressing cCCR p henotypes17,30. Trace amounts of gluconate were
secreted during glucose metabolism but were quickly depleted (supplementary material S3). Amino acid deami-
nation products like α-ketoglutarate and pyruvate were not observed in spent medium or found in only trace
amounts (< 1 mm), respectively.
Substrate utilization order for Pa 215 was quantified using five different formulations of CSP G medium sup-
plemented with permutations of additional carbon sources: lactate (L), acetate (A), and succinate (S) (Fig. 2).
Pa 215 grown on CSP GL medium, preferentially consumed the top tier amino acids, represented by aspartate
in Fig. 2, followed by lower tier amino acids (data for each measured amino acid can be found in supplementary
material S3–S8) and lactate before finally catabolizing glucose. Glucose catabolism was not observed while
lactate was present. Pa 215 grown on CSP GA consumed the top tier amino acids followed by lower tier amino
acids and acetate and finally glucose after the acetate was exhausted. Pa 215 grown on CSP GLA preferentially
consumed top tier amino acids, then lower tier amino acids and lactate followed by acetate and glucose. Finally,
Pa 215 grown on CSP GLAS preferentially catabolized the top tier amino acids, followed by succinate, lactate,
acetate, and ultimately glucose. Ion chelator, citrate, was readily catabolized as a preferred substrate in all media
formulations. No or minimal overflow metabolism (< 4 mM acetate, ~ 3% of lactate and glucose carbon moles
in CSP GL medium) was observed. An exception was CSP GLAS grown cultures which accumulated acetate
(~ 10 mM) above the initial medium concentrations. Upon exhaustion of succinate and lactate, the acetate was
catabolized prior to glucose catabolism. The glucose was not completely catabolized in CSP GLAS medium
because the medium was nitrogen limited (supplementary material S1). Culture parameters are summarized in
supplementary material S2 and data is available in supplementary material S3–S7.
The order of amino acid catabolism was assessed for all five CSP medium formulations by binning the amino
acids into three categories based on their time of exhaustion (Table 1). Binning was used, as opposed to using
an absolute time metric, because each medium formulation had a different number of substrates leading to dif-
ferent total growth times. Other substrate usage metrics were considered including the initial time of substrate
catabolism and nonlinear fitting of the temporal metabolite profiles to calculate a substrate ‘half-life’ v alue35;
these metrics were sensitive to experimental variability during the initial growth phase where small fluctuations
in substrate concentration, based likely on analytical techniques, influenced predictions. All amino acid data,
Scientific Reports | (2021) 11:1457 | https://doi.org/10.1038/s41598-020-80522-8 2
Vol:.(1234567890)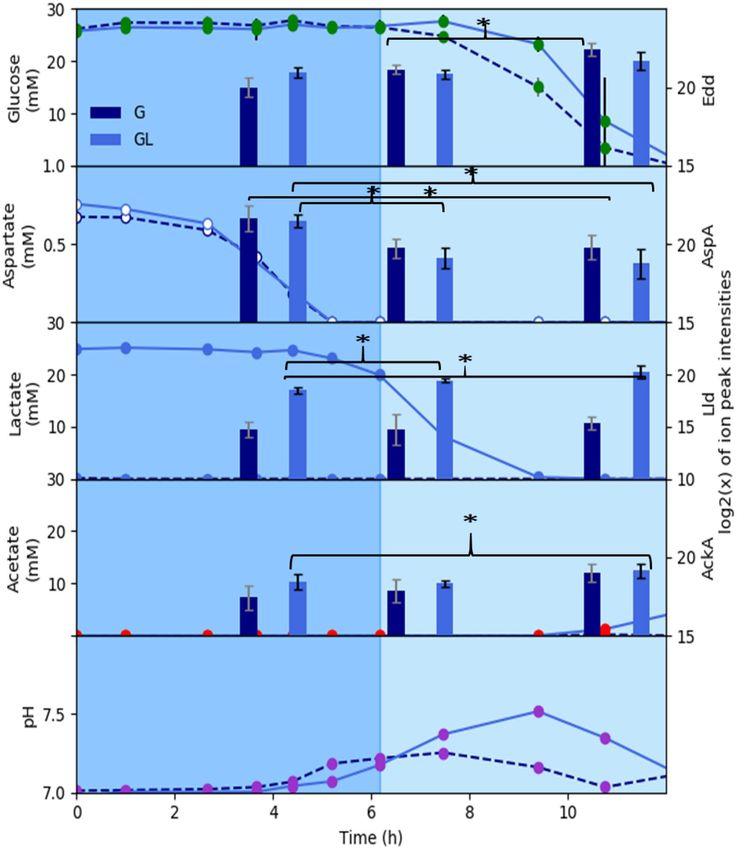
www.nature.com/scientificreports/
Figure 1. P. aeruginosa 215 was grown in chemically-defined, glucose containing, medium (CSP G) in
batch culture. Cultures demonstrated two exponential growth phases highlighted with different background
shading. Amino acids were binned into three categories based on their time of exhaustion. Top tier amino
acids were consumed during the first exponential growth phase while lower tier amino acids and glucose were
consumed during the second exponential growth phase. All values are averages of three biological replicates,
and metabolite values are also averaged from two technical replicates. Additional data can be found in
supplementary material S3.
including bin designations, time metrics, and fitting parameters, can be found in supplementary material S8.
The preferred amino acids, referred to here as top tier, included aspartate, asparagine, glutamine, glutamate, and
alanine. Most top tier amino acids were binned consistently across the five CSP media formulations as quanti-
tated by their small standard deviations. The middle tier amino acids had more variability which may have been
CCR-related or based on the temporal granularity of the experimental sampling schedule. The temporal trends
in medium pH reflected the metabolism of different substrates. Catabolism of amino acids increased medium
pH based on nitrogen chemistry. Catabolism of organic acids also raised the culture pH because the bacterium
imports the protonated base, removing a proton from the medium.
Approximately 90% of the anabolic nitrogen in CSP G medium was in the form of amino acids (supplemen-
tary data S1). P. aeruginosa can use ammonium as the sole nitrogen source36. CSP G medium formulations were
modified with the addition of 2 g/L ammonium chloride to test the effect of nitrogen form. The rCCR phenotype
was not changed by the presence of ammonium. The cultures consumed the amino acids as preferred substrates
followed by lactate and then glucose (supplementary material S9). The amino acid utilization order remained
largely unchanged (supplementary material S10).
The common laboratory strain of P. aeruginosa, PAO1, was also grown on CSP GLAS medium. The PAO1
substrate utilization order of organic acids and glucose was the same as Pa 215 and the order of amino acid
consumption was very similar to Pa 215 (supplementary material S11).
Scientific Reports | (2021) 11:1457 | https://doi.org/10.1038/s41598-020-80522-8 3
Vol.:(0123456789)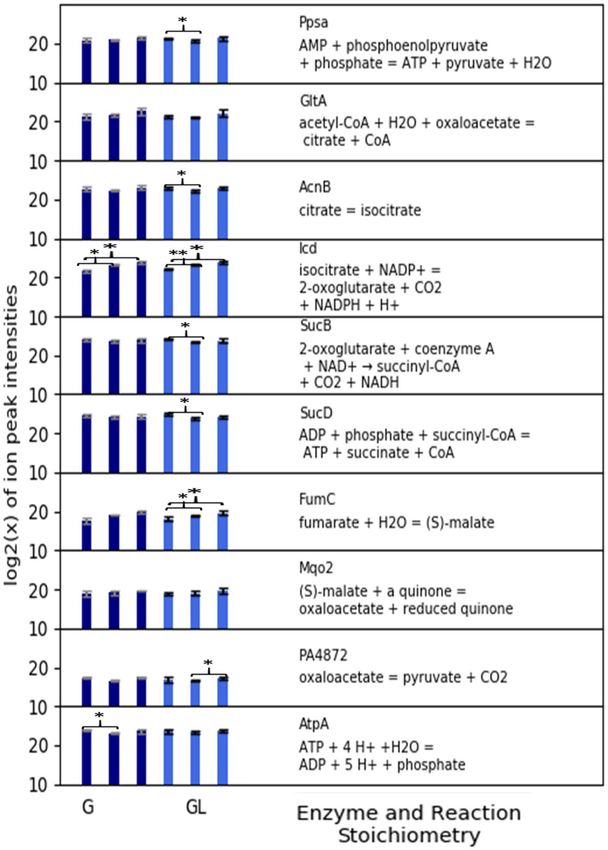
www.nature.com/scientificreports/
Figure 2. P. aeruginosa 215 substrate utilization order during batch growth in chemically-defined media. Panels
plot biomass and substrate concentrations as a function of time for five medium configurations supplemented
with different carbon sources at a concentration of 22 mM each. G = glucose, GL = glucose and lactate,
GA = glucose and acetate, GLA = glucose, lactate, and acetate, GLAS = glucose, lactate, acetate, and succinate.
Aspartate concentration (second y-axis) is plotted as a representative top tier amino acid. Cultures demonstrated
two exponential growth phases highlighted with different background shading. Medium composition and
additional data for each culture can be found in the supplementary material. All substrate values are averages of
three biological replicates and two technical replicates.
Proteomics quantifies a constitutive, respiration‑centric metabolism. Proteomic data were col-
lected from CSP G and CSP GL grown cultures. Proteomic data are more predictive of cell function than tran-
scriptomic or genomic data alone because they represent an actual allocation of resources into relatively stable,
macromolecular pools37,38. Phenotypes were analyzed using label-free proteomics with mass-spectrometry (MS)
of whole-cell lysates collected mid-first, exponential growth phase (4 h), early-second, exponential growth phase
(7 h), and late-second, exponential growth phase (11 h). The proteomics data were analyzed with focus on central
metabolism proteins associated with catabolizing the available substrates and with producing cellular energy.
Enzymes from the tricarboxylic acid (TCA) cycle and associated auxiliary enzymes had largely, constitutive
abundances regardless of the medium formulation and the growth phase (Fig. 3). All TCA cycle enzymes except
the membrane-associated succinate dehydrogenase were detected and quantified. Additionally, the enzymes
oxaloacetate decarboxylase (PA4872) and PEP synthase which process metabolic intermediates from the TCA
cycle for gluconeogenesis, were expressed constitutively. The abundance of ATP synthase subunits was also
constitutive. Membrane-associated, electron transport chain (ETC) enzymes were not detected. It was assumed
that the ETC enzymes were also constitutively expressed based on the TCA cycle and the ATP synthase protein
abundances and the lack of an overflow metabolism.
Enzymes associated with the processing of specific substrates did change in abundance based on presence and
concentration of substrates, contrary to most TCA cycle enzymes (Fig. 4). Aspartate was plotted as a representa-
tive top tier amino acid (Table 1). Protein abundance for aspartate ammonia-lyse (AspA), responsible for the
Scientific Reports | (2021) 11:1457 | https://doi.org/10.1038/s41598-020-80522-8 4
Vol:.(1234567890)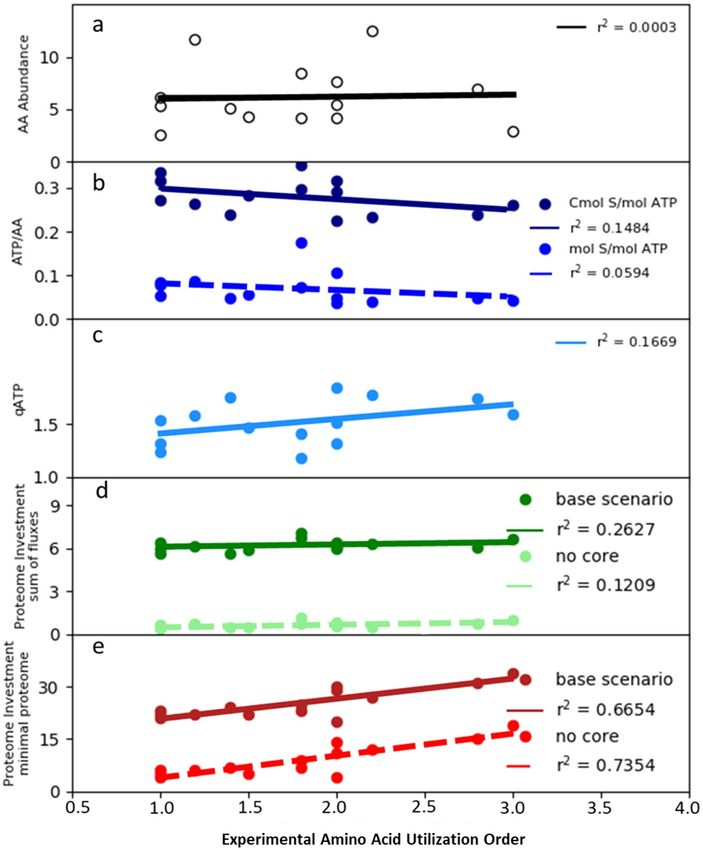
www.nature.com/scientificreports/
AA Score
L-Asn 1±0
L-Asp 1±0
L-Glu 1±0
L-Ala 1.2 ± 0.45
L-Pro 1.4 ± 0.89
L-Gln 1.5 ± 1
Gly 1.8 ± 0.45
L-Thr 1.8 ± 0.45
L-Arg 2±0
L-Iso 2 ± 0.71
L-Ser 2±0
L-Leu 2.2 ± 0.45
L-Val 2.8 ± 0.45
L-Lys 3±0
Table 1. Amino acid utilization order for P. aeruginosa 215 cultures grown on five different, chemically-
defined media supplemented with various additional carbon sources. Amino acids were binned into three
categories (1, 2, 3) based on the time of exhaustion, averaged between three biological replicates for each of five
medium conditions, n = 15. Data can be found in supplementary material S8.
catabolism of aspartate, was elevated during the first exponential growth phase. When aspartate was exhausted,
the abundance of AspA dropped as the metabolism shifted to other substrates. Following the depletion of top
tier amino acids, the presence or absence of lactate was correlated with increasing or minimal abundances of
lactate dehydrogenase protein (Lld), respectively. Pa 215 catabolized glucose, like all Pseudomonads, via the
Enter-Doudoroff (ED) pathway36,39. Abundance of ED phosphogluconate dehydratase (Edd) increased while
glucose was being metabolized, after the exhaustion of top tier amino acids. Acetate kinase (AckA) abundance
increased for the CSP GL culture at the exhaustion of lactate and glucose. AckA quickly metabolized the small
amount of acetate (< 4 mM) secreted at the exhaustion of lactate and glucose.
Proteomic analysis measured additional proteins that displayed changes in expression during exponential
growth and stationary phases. Data can be found at ftp://massive.ucsd.edu/MSV000085590/.
In silico analysis of rCCR phenotypes. CCR is a regulation scheme that contributes to metabolic plastic-
ity. CCR regulation schemes have evolved to control expression of metabolic strategies that favor cellular fitness.
The order of substrate utilization is hypothesized to reflect the ecological strategy used by P. aeruginosa to thrive
in environmental and medical niches. Computational systems biology was used to test hypotheses regarding
what fitness properties were being optimized in the Pa 215 cultures, with predictions compared to experimental
data. In silico analyses used flux balance analysis (FBA) of a published, genome-scale, metabolic model of P.
aeruginosa updated here with genome-supported, amino acid catabolism r eactions40,41 (supplementary mate-
rial S12). Stoichiometric modeling methods, such as FBA, can be utilized with a minimum number of a priori
fitting parameters. The applied FBA considered only steady state simulations. Temporally-resolved simulations
require enzyme kinetic parameters for every considered substrate, which are not available in the literature for P.
aeruginosa.
In silico testing of ecological strategies was applied first to amino acid utilization order and included all experi-
mentally measured amino acids except for aromatic and sulfur containing amino acids due to their specialty
chemistries. The experimental amino acid utilization order did not correlate with the amino acid frequency in
genome open reading frames (Fig. 5a) indicating the amino acids were not consumed solely for protein assembly;
amino acids were also used as anabolic building blocks for other macromolecules and catabolized for cellular
energy (supplementary material S8). Therefore, simulations considered either the production of cellular energy
(e.g. ATP) or cellular growth which was quantified as carbon moles (Cmol) of biomass.
The first round of in silico analyses considered six separate, single dimension, optimization criteria which
were informed by previous studies that examined numerous optimization c riteria22,30,42. The criteria included
(1) maximizing biomass or energy production rates based on electron donor, (2) maximizing biomass or energy
production rates based on electron acceptor (O2), or (3) minimizing nutrient investment into the proteome
required for either biomass or energy synthesis. The results of these simulations are presented in the next two
sections and a summary of the results and analyses can be found in supplementary material S13.
Amino acid utilization order did not correlate with in silico maximization of rates. Computa-
tional approaches for studying metabolism often assume cells utilize metabolic potential to maximize growth
rate43–45. The experimental amino acid utilization order, as quantified across five media formulations (Table 1),
was analyzed using this maximum rate theory. Separate, steady state simulations were run for each individual
amino acid and for either biomass production or cellular energy production. Simulations identified the optimal
phenotypes for the conversion of each substrate into product. The in silico phenotypes which maximized elec-
Scientific Reports | (2021) 11:1457 | https://doi.org/10.1038/s41598-020-80522-8 5
Vol.:(0123456789)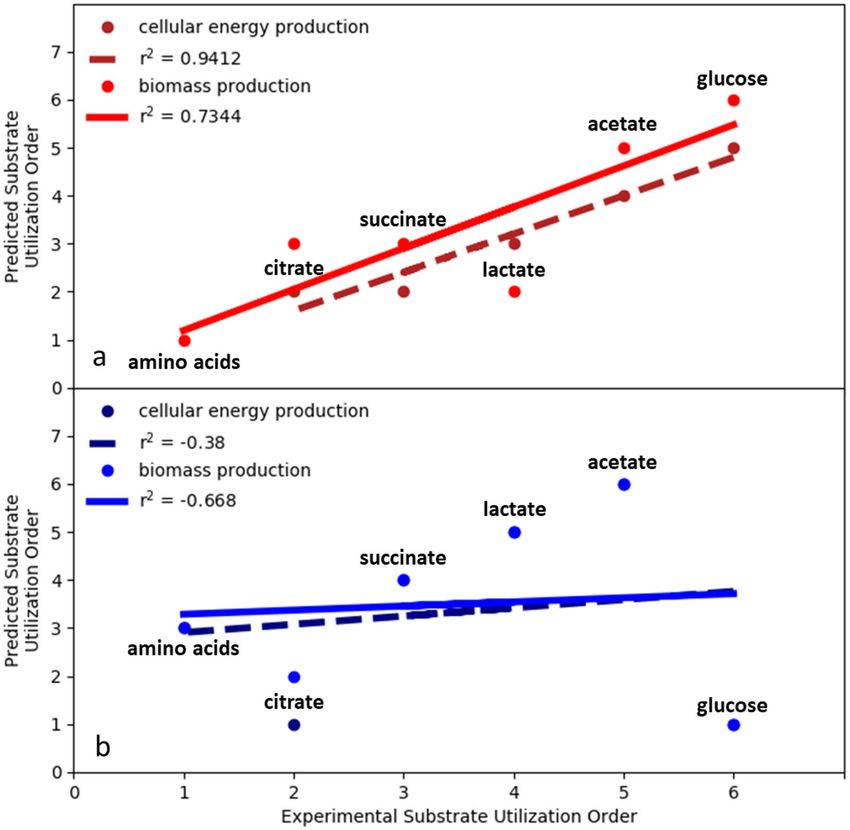
www.nature.com/scientificreports/
Figure 3. Proteomics data for P. aeruginosa 215 grown on chemically-defined, CSP G and CSP GL medium
which contained glucose (G) or glucose and lactate (GL), respectively. CSP G culture data are represented by
dark blue bars and CSP GL culture data are represented by light blue bars. Bars quantify the abundance of the
enzyme during the first exponential growth phase (4 h), early second exponential growth phase (7 h), and late
second exponential growth phase (11 h). Presented enzymes are involved in the tricarboxylic acid (TCA) cycle,
anaplerotic reactions, and ATP synthesis. All values are averaged from three biological replicates. *p value < 0.05;
**p value < 0.01.
tron donor yields also mineralized the substrates secreting only CO2, consistent with in vitro cultures which did
not utilize overflow metabolisms.
Maximizing cellular energy yield per amino acid, on a mole substrate or Cmol substrate basis, did not cor-
relate with amino acid utilization order, having r2 values of 0.06 and 0.15 respectively (Fig. 5b). The in silico
phenotypes which maximized yields were used to calculate maximum product rates using enzyme parameters
from survey studies46,47 and experimental medium composition (supplementary material S1). This common
theoretical treatment linked product yields to product rates such that maximizing one maximizes the other, this
was an assumption of convenience and the advantages and disadvantages of its application have been discussed
in the l iterature30,43,48. Maximizing the rate of cellular energy production (or growth) did not predict amino acid
utilization order, as the correlation was r 2 = 0.17 (Fig. 5c) (supplementary material S13–S18).
Scientific Reports | (2021) 11:1457 | https://doi.org/10.1038/s41598-020-80522-8 6
Vol:.(1234567890)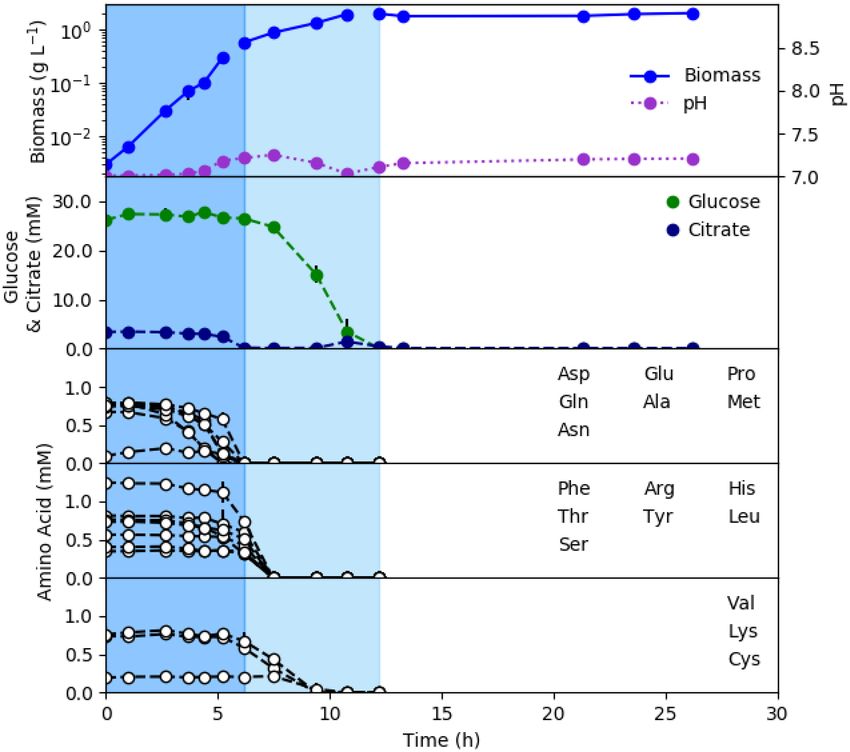
www.nature.com/scientificreports/
Figure 4. Substrate-specific, protein abundances for P. aeruginosa 215 cultures grown on chemically-defined
CSP G (dark blue bars and dashed lines) and CSP GL (light blue bars and solid lines) media which contain
glucose and glucose + lactate, respectively. Substrate concentrations for each enzyme are plotted in the same
panel to highlight relationships. The three bars represent batch growth time points 4, 7, and 11 h. Metabolite
values are averaged from three biological replicates and two technical replicates. Protein values are averaged
from three biological replicates. *p value < 0.05; **p value < 0.01.
P. aeruginosa has a respiration-centric metabolism. The rate maximization criterion was also applied to
O2 which is required to mineralize the amino acids under the experimental conditions. This alternative, rate
maximization criterion predicted substantial overflow metabolisms for most of the amino acids. This predicted
phenotypic trait was not consistent with the experimental data indicating the criterion was not relevant for Pa
215 metabolism (supplementary material S13).
Amino acids with high cellular energy yields (mol ATP (mol amino acid)−1) also had high biomass yields
(Cmol biomass (mol amino acid)−1); the two yields correlated with an r2 value of 0.99 (supplementary data S18).
Therefore, maximizing rates for cellular energy production or biomass production had similar trends and neither
predicted rCCR phenotype (supplementary material S13).
Scientific Reports | (2021) 11:1457 | https://doi.org/10.1038/s41598-020-80522-8 7
Vol.:(0123456789)www.nature.com/scientificreports/
Figure 5. In silico analysis of reverse carbon catabolite repression (rCCR) substrate utilization order in
P. aeruginosa 215. (a) Amino acid frequency in genome open reading frames plotted as a function of the
experimental amino acid utilization order. (b) Optimal in silico cellular energy yield from the catabolism of
each amino acid plotted as a function of experimental amino acid utilization order. Analysis considered both
moles of amino acid and carbon moles (Cmol) of amino acid. (c) in silico maximization of cellular energy rate
(qATP = mmol ATP g cdw−1 h−1) plotted as a function of experimental amino acid utilization order. Enzyme
parameters were based on a survey study of catabolic enzymes (0.5 mmol AA g c dw−1 h−1, Km = 0.2 mM, and
CSP G medium composition, see supplementary material S1). (d) Computational analysis of amino acid
utilization order based on resource investment into proteome for complete oxidation of substrate using the
sum of fluxes as a proxy for proteome investment. Analysis considered a base metabolism scenario where all
enzyme-catalyzed reactions were considered and a refined, no core metabolism scenario where only enzyme-
catalyzed reactions extraneous to the experimentally-measured, constitutive proteome core where considered. A
subset of the core enzymes is shown in Fig. 3 while an explicit list can be found in supplementary material S15.
(e) Proteome investment analysis using the minimal proteome investment proxy to predict experimental amino
acid utilization order. Analysis considered base metabolism scenario and refined, no core metabolism scenario.
Single dimension optimization of resource investment predicted overflow metabolism, incon-
sistent with rCCR phenotypes. Computational analysis was used to identify phenotypes that minimized
Scientific Reports | (2021) 11:1457 | https://doi.org/10.1038/s41598-020-80522-8 8
Vol:.(1234567890)www.nature.com/scientificreports/
resource investment into catabolic pathways. Explicit investment models were not possible in non-model organ-
ism, P. aeruginosa. Therefore, two previously developed resource investment proxies were applied to estimate
relative, proteome investment into central metabolism19,22,49,50. The flux minimization proxy assumes the total
network flux is proportional to the enzymatic resources required to synthesize the necessary p roteome19,22,42,51.
Another proxy for protein investment minimizes the number of enzyme catalyzed reactions (a.k.a. minimal pro-
teome investment) identifying the smallest proteome required to realize an in silico phenotype19. These hypoth-
eses assumed central metabolism enzymes could be approximated as having the same molecular weight with the
same amino acid distribution.
Both proxies for resource investment, when applied as the single optimization criterion, predicted overflow
metabolisms for most amino acids (supplementary material S13,S15,S16). The in vitro experimental cultures did
not demonstrate substantial overflow metabolisms indicating these single dimension criteria were not relevant
for Pa 215 phenotypes.
Substrate utilization order was consistent with a resource utilization strategy optimizing sub-
strate oxidation and proteome investment. Life occurs in multifactorial environments with multiple
stressors influencing phenotypes20,42,52. Two dimensional, optimizations of in silico phenotypes were performed
where the first dimension considered the optimal conversion of substrate into cellular energy which com-
pletely oxidized the substrate. The second dimension approximated the nutrient investment into the enzymes
required to realize the in silico phenotype, for example the amount of anabolic nitrogen required to synthesize
the proteome or the amount of ATP required to form the associated peptide b onds19,22 (supplementary material
S15,S16). Both the flux minimization and minimal proteome investment proxies were tested. Two-dimensional
optimization (2-DO) using the flux minimization proxy had poor correlations with the observed amino acid
utilization order (Fig. 5d). Alternatively, 2-DO using complete substrate oxidation and the minimal proteome
proxy predicted the experimental utilization order for amino acids ( r2 = 0.67) (Fig. 5e).
2-DO was further refined using experimentally measured proteomics data. The constitutively expressed
TCA cycle, anaplerotic enzymes, ATP synthase, and electron transport chain (Fig. 3) were considered part of a
core, constitutive proteome, independent of substrate. The refined, 2-DO theory considered only the resource
investment extraneous to the conserved, core proteome. This theory lead to improved predictions of amino acid
utilization order with the minimal proteome investment theory but not the flux minimization theory (Fig. 5d, e).
The outlier amino acid in Fig. 5e was serine. Serine is catabolized via the L-serine dehydratase enzyme which is
2 concentrations were necessary for its f unctionality53. The
O2-labile suggesting higher cell densities and lower O
predictive accuracy of the analysis improved to a correlation of r 2 = 0.88 if serine data were excluded.
2-DO, considering complete oxidation of substrate and minimal proteome investment, was extended to
the other CSP media substrates including organic acids and glucose. Analysis applied the minimal proteome
investment with conserved core proteome assumption and considered both cellular energy production as well
as the more complex biomass production (Fig. 6a). The experimental substrate utilization hierarchy, which was
determined using culturing data from the five CSP media formulations, was used to assess the accuracy of the
predictions (Fig. 2). The in silico analysis accurately predicted, substrate utilization order with r2 correlations
of 0.94 and 0.73 for cellular energy and biomass production, respectively. The cellular energy simulations had a
noteworthy correlation with experimental data suggesting ATP production was a superior in silico optimization
criterion for Pa 215. The biomass simulations considered an aggregate amino acid substrate pool containing all 20
metabolites, which was not considered for cellular energy simulations. As anticipated, the aggregate amino acid
pool greatly reduced the requirement for enzymatic steps by negating de novo amino acid synthesis reactions
(Fig. 6a, supplementary material S15,S16). The correlation between the predicted and experimental substrate
utilization order for the biomass simulations was not as strong due largely to the predicted order of lactate and
citrate utilization. The discrepancy could be due to a couple factors. First, the computational approach approxi-
mated the resource investment necessary to synthesize the in silico proteome by assuming all enzyme-catalyzed
reactions required the same amount of anabolic resource. This was a necessary simplification due to the lack of
detailed data for P. aeruginosa that could be improved as more data becomes available. Additionally, the experi-
mental utilization order was based on five separate media formulations which resulted in five separate, dynamic,
batch growth profiles each with their own intricacies including cometabolism of substrates.
The maximization of rate criterion was also tested with the additional substrates. The analysis assumed opti-
mal product yields on substrate were proportional to the optimal product rates43. The maximum rate criterion
did not predict the experimental utilization order for organic acids over glucose. In fact, the predicted utilization
order had negative correlations with the experimental data (Fig. 6b). Additional optimizations and aggregate
substrate simulations were considered (supplementary material S17–S19). None outperformed the presented
approach in terms of accuracy and simplicity.
Discussion
P. aeruginosa preferentially consumes nonfermentable, lower energy substrates, such as succinate over glucose in
a strategy known as reverse diauxie or rCCR. The term has been defined in terms of substrate preference relative
to cCCR organisms E. coli and B. subtilis. The rCCR preference for nonfermentable substrates is associated with
minimal overflow metabolism and, under certain conditions, can result in cultures preferentially catabolizing
substrates that do not maximize cellular growth r ates10,36,54–57. The CSP media studied here did not result in this
property. The term ‘inverse diauxie’ has been proposed to describe microorganisms that prefer substrates that
sustain lower growth rates58. The rCCR strategy has enabled the broad, global distribution of P. aeruginosa in
both environmental and medical niches including chronic, diabetic ulcers. The hierarchy of substrate preferences
for Pa 215 was: amino acids such as aspartate, followed by citrate, succinate, lactate, acetate, and finally glucose.
Scientific Reports | (2021) 11:1457 | https://doi.org/10.1038/s41598-020-80522-8 9
Vol.:(0123456789)www.nature.com/scientificreports/
Figure 6. Predicted substrate utilization order, based on in silico analysis, compared to experimental substrate
utilization order for cultures of P. aeruginosa 215 growing on chemically-defined media. The experimental
substrate utilization order was: (1) aggregate pool of amino acids, (2) citrate, (2) succinate, (3) lactate, (4)
acetate, and (5) glucose. (a) Substrate utilization order predictions for cellular energy production and biomass
production using a two-dimensional optimization including complete substrate oxidation and minimal
proteome investment. Simulations used a refined, core proteome theory where only enzyme-catalyzed reactions
extraneous to the experimentally-measured, constitutive, core proteome where considered. A subset of the core
enzymes is shown in Fig. 3 while the explicit list can be found in supplementary material S15. (b) Predicted
substrate preference based on the ‘maximization of rate’ criterion for cellular energy production and biomass
production. In silico product yield on substrate was assumed proportional to rate.
These preferences were also observed with P. aeruginosa PAOI grown on CSP GLAS medium (supplementary
material S11). Pa 215 maintained, constitutively, core TCA cycle enzymes and regulated the abundance of the
proteins required for specific substrates as needed to convert the substrates into central metabolism intermedi-
ates. Analysis using an in silico metabolic model and FBA determined the rCCR phenotype was consistent with
a multidimensional, resource utilization strategy where substrate utilization order was based on minimizing the
proteome investment required to mineralize the metabolite. Optimization of multiple cellular functions simulta-
neously has been reported previously for cCCR model organism E. coli, albeit with optimization c riteria22,52. The
rCCR phenotypes were not consistent with the commonly applied, systems biology criterion, which maximizes
growth rate43,44. Pseudomonads are commonly found in consortia and the rCCR metabolism is proposed to pro-
vide fitness advantages in these competitive environments59,60. Consortia with populations expressing rCCR and
cCCR phenotypes have the metabolic basis for an effective division of labor, thus avoiding overlapping substrate
preferences which can result in species competition and e xclusion61–65 (Fig. 7). cCCR organisms prefer primary
substrates like glucose where fast growth rate is likely a strong fitness determinant. Glucose can be catabolized
by cCCR microorganisms via respiration, fermentation, or a combination of the two strategies. This flexibility
enables tradeoffs between high yields during a fully respiratory catabolism and fast rates, with the associated
overflow metabolism, during (partially) fermentative c atabolism30,48. rCCR organisms avoid competition for
Scientific Reports | (2021) 11:1457 | https://doi.org/10.1038/s41598-020-80522-8 10
Vol:.(1234567890)www.nature.com/scientificreports/
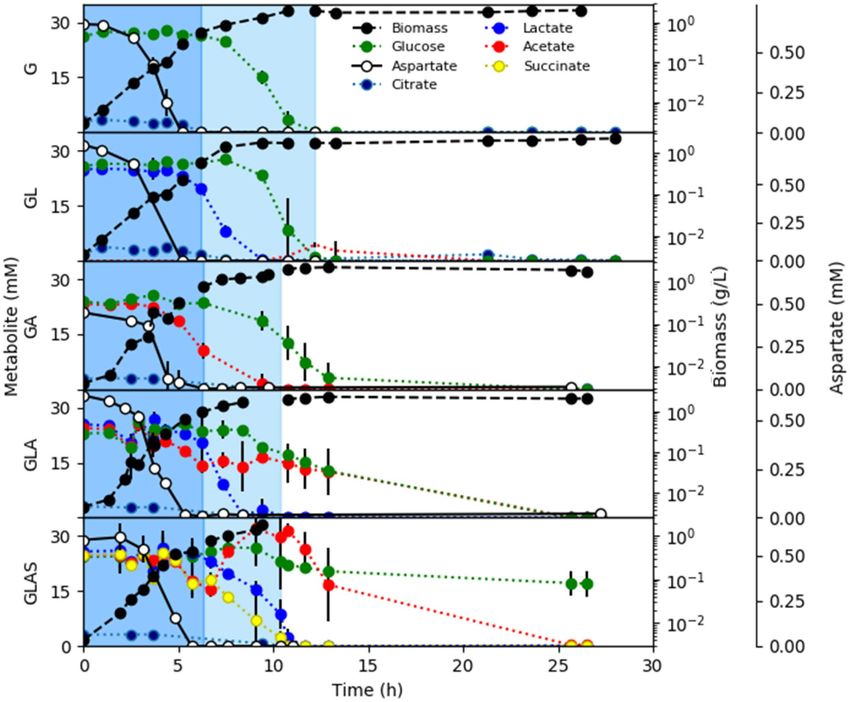
Figure 7. Theoretical consortial interactions including competition and cross feeding. (a) Consortium with
multiple populations competing for the same electron donor and same electron acceptor and both populations
utilizing an overflow metabolism producing inhibitor lactic acid. (b) Consortium of rCCR utilizing P. aeruginosa
(Pa) and cCCR utilizing S. aureus (Sa) where substrate preferences are partitioned between the two populations
and lactic acid is cross fed. (c) Cross feeding can lead to enhanced phenotypic properties, such as flux, for a
scarce nutrient pool like reduced carbon or nitrogen. Michaelis–Menten-like kinetics and the requirement to
invest resources into both enzyme and metabolite pools leads to a nonlinear relationship between invested
resources and enzyme flux. Higher fluxes require a smaller, relative resource investment. See Beck et al.67 for
parameter details.
fermentable carbon sources by preferring to catabolize secondary, byproducts of cCCR metabolism. Fast growth
may not be as central to fitness as the efficient extraction of energy from the lower energy substrates. Many rCCR
preferred organic acids are nonfermentable which precludes the rCCR metabolism from utilizing the tradeoffs
inherent to either high yield or high rate strategies, as commonly observed in cCCR o rganisms48.
Both rCCR and cCCR phenotypes are found in microorganisms described as generalists, e.g. P. aeruginosa
and E. coli. Both rCCR and cCCR phenotypes can be predicted using resource investment theories, albeit with
the rCCR organism expressing a respiration-centric phenotype and the cCCR organism expressing a glycolysis-
centric, overflow phenotype. Natural environments are often limited by anabolic nutrients including nitrogen18.
Division of labor, thru rCCR and cCCR based phenotypes, can theoretically enable higher consortia fluxes, from
a scarce nitrogen supply, based on the nonlinear relationship between enzyme flux and resource investment17,66
(Fig. 7c). This kinetic effect can translate into consortia having a better metabolic return on limiting nutrients,
leading to higher biomass accumulation and higher host b ioburden17,67–70. Additionally, the CCR-based, divi-
sion of labor could create a positive feedback mechanism by removing inhibitory organic acids and preventing
environmental acidification via both organic acid consumption and amino acid catabolism, ultimately increasing
consortia productivity by permitting a more complete depletion of s ubstrates71. Amino acid catabolism and the
release of ammonia can also function as an intercellular communication strategy where the small metabolite
influences phenotype, like antibiotic susceptibility, in distant populations72–74.
Most virulence mechanisms are nutrient acquisition strategies that are also effective in medical niches8. CCR
regulates a wide range of social behaviors and likely modulates division of labor which would facilitate substrate
acquisition by rCCR m icroorganisms17. P. aeruginosa preference for non-fermentable substrates like succinate
makes it a secondary resource specialist that requires terminal electron acceptors like O 2 or nitrate75. However, O 2
is often limiting in biofilms where cellular O2 consumption rates are faster than diffusion rates34,76. P. aeruginosa
possesses effective mechanisms to acquire scarce resources like O 270,77–80. For example, P. aeruginosa secretes a
59,81–84
cocktail of moieties such as pyocyanin, quinolones, and c yanide . Exposure to this cocktail can manipulate
the S. aureus cCCR phenotype, driving it toward overflow and fermentative m etabolisms70,85. Collectively, the
compounds enable a secondary consumer to influence the metabolism of neighboring cells directing their pheno-
types toward secreting preferred substrates including organic acids while reserving the O 2 for P. aeruginosa69,70,84.
Lactate has remarkable connections to P. aeruginosa substrate preference and medical niches including dia-
betic wounds. Elevated lactate levels found in diabetic wounds come from two sources. First, diabetic patients
can have higher levels of serum lactate due to diabetic ketoacidosis, and secondly, lactate is associated with
wound bed colonization by bacteria which produce it as a byproduct86–88. > 80% of chronic wounds are colo-
nized by P. aeruginosa89 while 90% of chronic leg ulcers are colonized by S. aureus78,90–93 which displays a cCCR
phenotype94,95. Not surprisingly, these bacteria are often co-isolated55,85,96. Wounds colonized by multispecies can
be more difficult to treat and can have more negative outcomes than wounds colonized by a single s pecies69,91,93.
Mutualistic interactions in consortia, based on complementary rCCR and cCCR metabolisms, could lead to
Scientific Reports | (2021) 11:1457 | https://doi.org/10.1038/s41598-020-80522-8 11
Vol.:(0123456789)www.nature.com/scientificreports/
emergent properties such as enhanced biomass productivity based on enhanced resource acquisition and better
metabolic return on investment of scarce nutrients, ultimately leading to greater virulence. Mitigating these
consortia, through rational countermeasures, will require quantitative knowledge of the metabolic organization
which forms the bases of all virulence mechanisms.
Materials and methods
Bacterial strain and cultivation. All experiments used P. aeruginosa str. 215, a clinical isolate obtained
from a chronic w ound33,97. Frozen stocks of P. aeruginosa 215 were prepared by growing cultures in 10 mL of
1/10 strength tryptone soy broth (TSB) at 37 °C with shaking (150 rpm), mixed with 3 mL of 20% glycerol, and
stored at − 80 °C.
Frozen stocks were plated on tryptic soy agar (TSA) at 37 °C for 12 h, five colonies were picked to inoculate
10 mL of Clostridium, Staphylococcus, Pseudomonas (CSP) medium in culture tubes. CSP is a chemically defined
medium developed to support the growth of P. aeruginosa, Staphylococcus aureus, and Clostridium perfringens
as monocultures or c onsortia34 (supplementary material S1). For CSP supplemented with one or more organic
acids, 22 mM of each organic acid specified was added.
A total of three culturing tubes containing 10 mL of CSP were each inoculated with about five colonies from
the TSA plates, incubated at 37 °C with shaking at 150 rpm (tubes were placed at a 45° angle in the shaker to
increase mixing) and grown until the cultures reach an O D600 of 0.5. 1 mL of each culture was then added to
49 mL of fresh CSP medium in 250 mL baffled flasks and an OD600 of 0.010. The baffled flasks were capped with
gas permeable foam lids and incubated at 37 °C with shaking at 150 rpm. Sampling occurred about every hour
during the first 12 h and less frequently afterwards.
Culture sampling. Samples were drawn from each flask for O D600, pH, amino acid, and carbon metabolite
measurements. An aliquot of 1.5 mL of culture was collected at each sampling, cells were separated from the
supernatant using centrifugation at 7000 rpm for 10 min (Eppendorf 5415D microcentrifuge). Supernatants
were then filtered using 0.22 µm syringe filters prior to being stored at − 20 °C.
At each sampling, a volume of culture was collected for O D600 measurement. OD600 readings were blanked
with fresh CSP and samples were diluted, if necessary, to keep OD600 measurements ≤ 0.30.
Organic acid and sugar analyses. HPLC analysis of select carbon metabolites including glucose and
organic acids was performed with an Agilent 1200 series HPLC equipped with a refractive index detector (RID)
and an Aminex HPX-87H ion exclusion column, 300 mm × 7.8 mm. A mobile phase of 5 mM H2SO4 was run at a
flow rate of 0.6 mL/min for 25 min/injection. A volume of 200 µL of sample was added to an HPLC vial with 200
µL of an internal standard of 1 g/L fucose dissolved in 10 mM H2SO4. Each sample was injected twice for a total
of two technical replicates for each of the three biological replicates for each time point. HPLC analysis of culture
supernatants were compared to NMR analysis (Chenomx library and an internal standard of DSS) as a verifica-
tion of metabolite identities and to ensure no major metabolites were being missed34. Supplementary material S3
includes a comparison of HPLC- and NMR-based analyses of select metabolites during batch growth.
Amino acid analysis. HPLC analysis of amino acids was performed with an Agilent 1100 series equipped
Å. This setup was used with the Agilent protocol for HPLC analysis of amino a cids98.
with a diode array detector (DAD) and a ZORBAX Eclipse XDB-C18 column, 4.6 mm ID × 250 mm (5 µm) 80
Cell dry weight measurement. A correlation curve between O
D600 and grams of cell dry weight (g CDW)
per liter was constructed. 5 mL aliquots of P. aeruginosa culture harvested in mid-exponential growth phase
diluted to a range of densities were dried at 80 °C for 24 h in aluminum drying pans and weighed. Correlation
equation was: (g CDW/L) = (OD600)*2.23−1.
Proteomics analyses. P. aeruginosa cultures (n = 3) were collected via centrifugation at 3600×g and washed
three times with phosphate buffered solution to remove residual media. Cells were resuspended in 1.25 mL radi-
oimmunoprecipitation assay buffer consisting of 12.5 μL of protease inhibitor (Halt Protease Cocktail Inhibitor,
Thermo Fisher Scientific, Rockford, IL) to prevent enzymatic degradation upon cell lysis, 0.1 mg/ml lysozyme
to solubilize the cell peptidoglycan layer, and 5 mM dithiothreitol (DTT) to cleave protein disulfide bonds. Cells
were lysed mechanically in a beadbeater (Mini-beadbeater-1, Biospec Products, Inc, Bartlesville, OK) at 4800
oscillations/min with the remainder of the vial filled with 0.1 mm diameter zirconia/silica beads for a total time
of 2.5 min (five cycles at a duration of 30 s each with chilling in an ice water bath between cycles).
Protein concentrations were determined by protein assay kit (DC Bradford Reagent, Thermo Fisher Scien-
tific). 15 µg of proteins were taken from all samples and transferred to centrifugal filter units (Microcon-30 kDa
Centrifugal Filter Unit with Ultracel-30 membrane, Millipore Sigma, Billerica, MA). The samples were then
processed following the filter aided sample preparation method99, in which proteins were reduced with DTT,
alkylated with iodoacetamide to prevent disulfide bond reformation, then enzymatically digested overnight
into peptides with trypsin at 1:50 enzyme:substrate (w:w) at 37 °C. The resulting peptides were desalted using a
C18 column (Macro SpinColumn, Harvard Apparatus, Holliston, MA), dried in a centrifugal evaporator, then
resuspended in 5% acetonitrile with 0.1% formic acid to a concentration of 0.2 μg/μL.
200 ng samples of peptides were separated in a HPLC system (1260 Infinity LC System, Agilent, Santa Clara,
CA) and a C18 column (3.5 μm particle size, 150 mm length × 75 μm internal diam, Zorbax 300SB, Agilent) using
a 60 min mobile phase gradient ranging from 5 to 85% organic (0.1% formic acid in water to 0.1% formic acid
Scientific Reports | (2021) 11:1457 | https://doi.org/10.1038/s41598-020-80522-8 12
Vol:.(1234567890)www.nature.com/scientificreports/
in acetonitrile) at 250 nL/min flow rate for a total run time of 75 min. Following LC separation, peptides were
ionized by nanoelectrospray with a spray voltage of 1.90 kV and 275 °C capillary temperature, then analyzed in a
high resolution Orbitrap mass spectrometer (Orbitrap Velos Pro purchased in 2007, Thermo Scientific, Waltham,
MA) with automatic gain control set at 1 06 ions and injection times of 1–200 ms. Full scan mass spectra from m/z
400 to 2000 at 30,000 mass resolution were collected in data-dependent acquisition mode. Ten precursor ions
were selected from each full mass scan for analysis by tandem mass spectrometry (MS/MS, using 30% energy
in HCD mode for fragmentation).
Raw mass spectra data files were processed for protein identification using the MaxQuant software (v.
1.5.3.30)100 with main search parameters of 4.5 ppm peptide tolerance, 20 ppm MS/MS match tolerance, 10 ppm
MS/MS de novo tolerance, seven minimum peptide length, carbamidomethyl as fixed modification, 0.01 FDR,
oxidation and acetylation variable modification, and enabled search for contaminants. Protein abundances were
further data processed and normalized with log transformation (base 2) for data visualization and statistical
analyses (ANOVA, p value < 0.05) using the Perseus software (v.1.5.4.0)101. The Search Tool for Retrieval of Inter-
acting Genes (STRING) database (v. 10.5)102 was used for protein–protein interactions amongst the statistically
significant proteins, set at medium confidence of 0.4 and protein annotation (functional enrichment analyses).
In silico analysis of metabolism and resource allocation. A genome-scale, stoichiometric model of
P. aeruginosa (iMO1086)40,41 was analyzed using flux balance analysis (FBA) via the COBRA Toolbox (https
://opencobra.github.io/cobratoolbox/stable/cite.html) in MATLAB using the Gurobi optimization program
(http://www.gurobi.com) (supplementary material S12,S20). Carbon and O 2 limitations were modeled by set-
ting the carbon (5 mmol/g/h) or O2 (20 mmol/g/h) uptake rates, respectively, for each of the examined carbon
sources and maximizing the production of biomass or cellular energy (i.e. quantified as the number of ATP
bonds hydrolyzed). Enzyme limitation was modeled by minimizing the number of participating reactions for
specified substrate uptake rates while producing biomass or cellular energy. Suboptimal solutions between the
minimal total flux and the maximum product yield (biomass or cellular energy) or the minimum proteome and
the maximum product yield (biomass or cellular energy) were identified by minimizing an aggregate objective
function. The aggregate objective function was the sum of either total flux or total proteome and a weighted flux
through the substrate transport reaction of interest. Optimization between proteome investment and product
yield was achieved by changing the weight of the flux through the carbon or oxygen transport reaction of inter-
est. The algorithms can be found in supplementary material S20.
Received: 3 September 2020; Accepted: 17 December 2020
References
1. Byrd, M. S. et al. Direct evaluation of Pseudomonas aeruginosa biofilm mediators in a chronic infection model. Infect. Immun.
79, 3087–3095. https://doi.org/10.1128/IAI.00057-11 (2011).
2. Behrends, V. et al. Metabolic adaptations of Pseudomonas aeruginosa during cystic fibrosis chronic lung infections. Environ.
Microbiol. 15, 398–408. https://doi.org/10.1111/j.1462-2920.2012.02840.x (2013).
3. Calhoun, J. H., Murray, C. K. & Manring, M. M. Multidrug-resistant organisms in military wounds from Iraq and Afghanistan.
Clin. Orthop. Relat. Res. 466, 1356–1362. https://doi.org/10.1007/s11999-008-0212-9 (2008).
4. Frykberg, R. G. & Banks, J. Challenges in the treatment of chronic wounds. Adv. Wound Care New Rochelle 4, 560–582. https://
doi.org/10.1089/wound.2015.0635 (2015).
5. Jarbrink, K. et al. The humanistic and economic burden of chronic wounds: A protocol for a systematic review. Syst. Rev. 6, 15.
https://doi.org/10.1186/s13643-016-0400-8 (2017).
6. Fife, C. E. & Carter, M. J. Wound care outcomes and associated cost among patients treated in US outpatient wound centers:
Data from the US wound registry. Wounds 24, 10–17 (2012).
7. Valot, B. et al. What it takes to be a Pseudomonas aeruginosa? The core genome of the opportunistic pathogen updated. PLoS
ONE 10, e0126468. https://doi.org/10.1371/journal.pone.0126468 (2015).
8. Rojo, F. Carbon catabolite repression in Pseudomonas: Optimizing metabolic versatility and interactions with the environment.
FEMS Microbiol. Rev. 34, 658–684. https://doi.org/10.1111/j.1574-6976.2010.00218.x (2010).
9. Görke, B. & Stülke, J. Carbon catabolite repression in bacteria: Many ways to make the most out of nutrients. Nat. Rev. Microbiol.
6, 613. https://doi.org/10.1038/nrmicro1932 (2008).
10. Collier, D. N., Hager, P. W. & Phibbs, P. V. Catabolite repression control in the Pseudomonads. Res. Microbiol. 147, 551–561.
https://doi.org/10.1016/0923-2508(96)84011-3 (1996).
11. Scitable by Nature EDUCATION 2005).
12. Pellett, S., Bigley, D. V. & Grimes, D. J. Distribution of Pseudomonas aeruginosa in a riverine ecosystem. Appl. Environ. Microb.
45, 328–332 (1983).
13. Döring, G. et al. Distribution and transmission of Pseudomonas aeruginosa andBurkholderia cepacia in a hospital ward. Pediatr.
Pulmonol. 21, 90–100. https://doi.org/10.1002/(sici)1099-0496(199602)21:2%3c90::Aid-ppul5%3e3.0.Co;2-t (1996).
14. Romling, U., Kader, A., Sriramulu, D. D., Simm, R. & Kronvall, G. Worldwide distribution of Pseudomonas aeruginosa clone
C strains in the aquatic environment and cystic fibrosis patients. Environ. Microbiol. 7, 1029–1038. https://doi.org/10.111
1/j.1462-2920.2005.00780.x (2005).
15. Hamilton, W. A., Dawes, E. & A. ,. A diauxic effect with Pseudomonas aeruginosa. Biochem. J. 71, 25P-26P (1959).
16. Liu, Y., Gokhale, C. S., Rainey, P. B. & Zhang, X. X. Unravelling the complexity and redundancy of carbon catabolic repression
in Pseudomonas fluorescens SBW25. Mol. Microbiol. 105, 589–605. https://doi.org/10.1111/mmi.13720 (2017).
17. Park, H., McGill, S. L., Arnold, A. D. & Carlson, R. P. Pseudomonad reverse carbon catabolite repression, interspecies metabolite
exchange, and consortial division of labor. Cell.Mol. Life Sci. https://doi.org/10.1007/s00018-019-03377-x (2019).
18. Sterner, R. W. & Elser, J. J. Ecological Stoichiometry: The Biology of Elements from Molecules to the Biosphere (Princeton University
Press, Princeton, 2002).
Scientific Reports | (2021) 11:1457 | https://doi.org/10.1038/s41598-020-80522-8 13
Vol.:(0123456789)www.nature.com/scientificreports/
19. Carlson, R. P. Metabolic systems cost-benefit analysis for interpreting network structure and regulation. Bioinformatics 23,
1258–1264. https://doi.org/10.1093/bioinformatics/btm082 (2007).
20. Carlson, R. P., Oshota, O. J. & Taffs, R. L. in Reprogramming Microbial Metabolic Pathways (eds Xiaoyuan Wang, Jian Chen, &
Peter Quinn) 139–157 (Springer, Netherlands, 2012).
21. Folsom, J. P. & Carlson, R. P. Physiological, biomass elemental composition and proteomic analyses of Escherichia coli ammo-
nium-limited chemostat growth, and comparison with iron- and glucose-limited chemostat growth. Microbiology 161, 1659–
1670. https://doi.org/10.1099/mic.0.000118 (2015).
22. Carlson, R. P. Decomposition of complex microbial behaviors into resource-based stress responses. Bioinformatics 25, 90–97
(2009).
23. Goelzer, A. & Fromion, V. Bacterial growth rate reflects a bottleneck in resource allocation. Biochim. Biophys. Acta 1810, 978–988.
https://doi.org/10.1016/j.bbagen.2011.05.014 (2011).
24. Goelzer, A. & Fromion, V. Resource allocation in living organisms. Biochem. Soc. Trans. 45, 945–952. https://doi.org/10.1042/
BST20160436 (2017).
25. Yang, L. et al. solveME: Fast and reliable solution of nonlinear ME models. BMC Bioinform. 17, 391. https://doi.org/10.1186/
s12859-016-1240-1 (2016).
26. Beg, Q. K. et al. Intracellular crowding defines the mode and sequence of substrate uptake by Escherichia coli and constrains its
metabolic activity. Proc. Natl. Acad. Sci. USA 104, 12663–12668. https://doi.org/10.1073/pnas.0609845104 (2007).
27. Vazquez, A. & Oltvai, Z. N. Macromolecular crowding explains overflow metabolism in cells. Sci. Rep. 6, 31007. https://doi.
org/10.1038/srep31007 (2016).
28. Zhuang, K., Vemuri, G. N. & Mahadevan, R. Economics of membrane occupancy and respiro-fermentation. Mol. Syst. Biol. 7,
500. https://doi.org/10.1038/msb.2011.34 (2011).
29. Szenk, M., Dill, K. A. & de Graff, A. M. R. Why do fast-growing bacteria enter overflow metabolism? Testing the membrane real
estate hypothesis. Cell Syst. 5, 95–104. https://doi.org/10.1016/j.cels.2017.06.005 (2017).
30. Basan, M. et al. Overflow metabolism in Escherichia coli results from efficient proteome allocation. Nature 528, 99–104. https
://doi.org/10.1038/nature15765 (2015).
31. Folsom, J. P., Parker, A. E. & Carlson, R. P. Physiological and proteomic analysis of Escherichia coli iron-limited chemostat growth.
J. Bacteriol. 196, 2748–2761. https://doi.org/10.1128/JB.01606-14 (2014).
32. Schuster, S., Boley, D., Moller, P., Stark, H. & Kaleta, C. Mathematical models for explaining the Warburg effect: A review focussed
on ATP and biomass production. Biochem. Soc. Trans. 43, 1187–1194. https://doi.org/10.1042/BST20150153 (2015).
33. Woods, J. et al. Development and application of a polymicrobial in vitro wound biofilm model. J. Appl. Microbiol. 112, 998–1006.
https://doi.org/10.1111/j.1365-2672.2012.05264.x (2012).
34. Yung, Y. P. et al. Reverse diauxie phenotype in Pseudomonas aeruginosa biofilm revealed by exometabolomics and label-free
proteomics. NPJ Biofilms Microbiomes 5, 31. https://doi.org/10.1038/s41522-019-0104-7 (2019).
35. Behrends, V., Ebbels, T. M., Williams, H. D. & Bundy, J. G. Time-resolved metabolic footprinting for nonlinear modeling of
bacterial substrate utilization. Appl. Environ. Microbiol. 75, 2453–2463. https://doi.org/10.1128/AEM.01742-08 (2009).
36. Berger, A. et al. Robustness and plasticity of metabolic pathway flux among uropathogenic isolates of Pseudomonas aeruginosa.
PLoS ONE 9, e88368. https://doi.org/10.1371/journal.pone.0088368 (2014).
37. Nouwens, A. S. et al. Complementing genomics with proteomics: The membrane subproteome ofPseudomonas aeruginosa PAO1.
Electrophoresis 21, 3797–3809. https://doi.org/10.1002/1522-2683(200011)21:17%3c3797::Aid-elps3797%3e3.0.Co;2-p (2000).
38. Penesyan, A. et al. Genetically and phenotypically distinct Pseudomonas aeruginosa cystic fibrosis isolates share a core proteomic
signature. PLoS ONE 10, e0138527. https://doi.org/10.1371/journal.pone.0138527 (2015).
39. Nikel, P. I., Chavarria, M., Fuhrer, T., Sauer, U. & de Lorenzo, V. Pseudomonas putida KT2440 strain metabolizes glucose through
a cycle formed by enzymes of the Entner-Doudoroff, Embden-Meyerhof-Parnas, and pentose phosphate pathways. J. Biol. Chem.
290, 25920–25932. https://doi.org/10.1074/jbc.M115.687749 (2015).
40. Phalak, P., Chen, J., Carlson, R. P. & Henson, M. A. Metabolic modeling of a chronic wound biofilm consortium predicts spatial
partitioning of bacterial species. BMC Syst. Biol. 10, 90. https://doi.org/10.1186/s12918-016-0334-8 (2016).
41. Oberhardt, M. A., Goldberg, J. B., Hogardt, M. & Papin, J. A. Metabolic network analysis of Pseudomonas aeruginosa during
chronic cystic fibrosis lung infection. J. Bacteriol. 192, 5534–5548. https://doi.org/10.1128/JB.00900-10 (2010).
42. Schuetz, R., Kuepfer, L. & Sauer, U. Systematic evaluation of objective functions for predicting intracellular fluxes in Escherichia
coli. Mol. Syst. Biol. 3, 119. https://doi.org/10.1038/msb4100162 (2007).
43. Schuster, S., Pfeiffer, T. & Fell, D. A. Is maximization of molar yield in metabolic networks favoured by evolution?. J. Theor. Biol.
252, 497–504. https://doi.org/10.1016/j.jtbi.2007.12.008 (2008).
44. Varma, A., Boesch, B. W. & Palsson, B. O. Stoichiometric interpretation of Escherichia coli glucose catabolism under various
oxygenation rates. Appl. Environ. Microbiol. 59, 2465–2473 (1993).
45. Varma, A. & Palsson, B. O. Stoichiometric flux balance models quantitatively predict growth and metabolic by-product secretion
in wild-type Escherichia coli W3110. Appl. Environ. Microb. 60, 3724–3731 (1994).
46. Bar-Even, A. et al. The moderately efficient enzyme: Evolutionary and physicochemical trends shaping enzyme parameters.
Biochemistry 50, 4402–4410. https://doi.org/10.1021/bi2002289 (2011).
47. Volkmer, B. & Heinemann, M. Condition-dependent cell volume and concentration of Escherichia coli to facilitate data conver-
sion for systems biology modeling. PLoS ONE 6, e23126. https://doi.org/10.1371/journal.pone.0023126 (2011).
48. Novak, M., Pfeiffer, T., Lenski, R. E., Sauer, U. & Bonhoeffer, S. Experimental tests for an evolutionary trade-off between growth
rate and yield in E. coli. Am. Nat. 168, 242–251. https://doi.org/10.1086/506527 (2006).
49. Hoffmann, S., Hoppe, A. & Holzhütter, H.-G. Composition of metabolic flux distributions by functionally interpretable minimal
flux modes (MinModes). Genome Inf. 17, 195–207 (2006).
50. Holzhutter, H. G. The principle of flux minimization and its application to estimate stationary fluxes in metabolic networks.
Eur. J. Biochem. 271, 2905–2922. https://doi.org/10.1111/j.1432-1033.2004.04213.x (2004).
51. Carlson, R. P. & Taffs, R. L. Molecular-level tradeoffs and metabolic adaptation to simultaneous stressors. Curr. Opin. Biotechnol.
21, 670–676 (2010).
52. Schuetz, R., Zamboni, N., Zampieri, M., Heinemann, M. & Sauer, U. Multidimensional optimality of microbial metabolism.
Science New York NY 336, 601–604. https://doi.org/10.1126/science.1216882 (2012).
53. Velayudhan, J., Jones, M. A., Barrow, P. A. & Kelly, D. J. l-Serine catabolism via an oxygen-labile l-serine dehydratase is essential
for colonization of the avian gut by Campylobacter jejuni. Infect. Immun. 72, 260–268. https://doi.org/10.1128/iai.72.1.260-
268.2004 (2004).
54. Frimmersdorf, E., Horatzek, S., Pelnikevich, A., Wiehlmann, L. & Schomburg, D. How Pseudomonas aeruginosa adapts to various
environments: a metabolomic approach. Environ. Microbiol. 12, 1734–1747. https://doi.org/10.1111/j.1462-2920.2010.02253.x
(2010).
55. Tiwari, N. & Campbell, J. Enzymatic control of the metabolic activity of Pseudomonas aeruginosa grown in glucose or succinate
media. Biochimica et Biophysica Acta BBA Gen. Subj. 192, 395–401. https://doi.org/10.1016/0304-4165(69)90388-2 (1969).
56. Trautwein, K. et al. Benzoate mediates repression of C(4)-dicarboxylate utilization in “Aromatoleum aromaticum” EbN1. J.
Bacteriol. 194, 518–528. https://doi.org/10.1128/JB.05072-11 (2012).
Scientific Reports | (2021) 11:1457 | https://doi.org/10.1038/s41598-020-80522-8 14
Vol:.(1234567890)You can also read