Measurement report: Altitudinal variation of cloud condensation nuclei activation across the Indo-Gangetic Plain prior to monsoon onset and during ...
←
→
Page content transcription
If your browser does not render page correctly, please read the page content below
Atmos. Chem. Phys., 21, 8979–8997, 2021
https://doi.org/10.5194/acp-21-8979-2021
© Author(s) 2021. This work is distributed under
the Creative Commons Attribution 4.0 License.

Measurement report: Altitudinal variation of cloud condensation
nuclei activation across the Indo-Gangetic Plain prior to monsoon
onset and during peak monsoon periods: results from the
SWAAMI field campaign
Mohanan R. Manoj1 , Sreedharan K. Satheesh1,2,5 , Krishnaswamy K. Moorthy2 , Jamie Trembath3 , and Hugh Coe4
1 Divecha  Centre for Climate Change, Indian Institute of Science, Bangalore, India
2 Centre for Atmospheric and Oceanic Sciences, Indian Institute of Science, Bangalore, India
3 FAAM Airborne Laboratory, Cranfield MK43 0AL, UK
4 Centre for Atmospheric Science, School of Earth and Environmental Sciences, University of Manchester,

Manchester, UK
5 DST-Centre of Excellence in Climate Change, Indian Institute of Science, Bangalore, India

Correspondence: Mohanan R. Manoj (manojshibika@gmail.com)

Received: 1 December 2020 – Discussion started: 29 December 2020
Revised: 23 April 2021 – Accepted: 8 May 2021 – Published: 14 June 2021

Abstract. Vertical distributions (altitude profiles) of conden-   during the active phase of the monsoon, indicating an in-
sation nuclei (CN) and cloud condensation nuclei (CCN)            crease in the hygroscopicity of aerosols following the mix-
and their spatial variations across the Indo-Gangetic Plain       ing of surface-based emissions with the advected marine air
(IGP) have been investigated based on airborne measure-           mass.
ments carried out during the SWAAMI field campaign (June
to July 2016) capturing the contrasting phases of the Indian
monsoon activity in 2016 just prior to its onset and during       1   Introduction
its active phase. Prior to the monsoon onset, high concen-
trations of CN and CCN prevailed across the IGP, and the          Spatio-temporal characteristics of aerosols and their inter-
profiles revealed frequent occurrence of elevated layers (in      actions with clouds respectively are key parameters deter-
the altitude range 1–3 km). Highest concentrations and ele-       mining the direct and indirect climate forcing by aerosols
vated peaks with high values occurred over the central IGP.       (Twomey, 1974; Albrecht, 1989; Stocker et al., 2013). Un-
The scenario changed dramatically during the active phase of      certainties associated with the spatial distribution and tem-
the monsoon, when the CN and CCN concentrations dropped           poral variations in the physical and chemical properties of
(CN by 20 % to 30 % and CCN by 6 % to 25 %) throughout            aerosols limit our ability to accurately quantify the climate
the IGP with more pronounced changes at altitudes higher          impact of aerosols. Extensive research in recent decades has
than 3 km where decreases as high as > 80 % were observed.        led to significant reduction in the uncertainties by improving
These reductions have an east-to-west decreasing gradient,        the characterization of aerosols, especially in the perspective
being most remarkable in the eastern IGP and very weak over       of interaction with radiation (Stocker et al., 2013; Bellouin
the western IGP where the CN concentrations above 3 km            et al., 2020). Nevertheless, the indirect effect of aerosols on
increased during the monsoon. The activation ratios (ARs)         climate through aerosol–cloud interactions remains largely
showed contrasting features, increasing with increase in al-      uncertain (Stocker et al., 2013; Rosenfeld et al., 2014; Fan et
titude, prior to the onset of monsoon, reversing the trend to     al., 2016). It is fairly well established that the radiative effects
decrease with increase in altitude during the active phase of     of aerosols on clouds mostly act to suppress precipitation
the monsoon. The supersaturation spectrum became flatter          through a decrease in the solar radiation reaching the surface

Published by Copernicus Publications on behalf of the European Geosciences Union.
8980                                                                     M. R. Manoj et al.: CCN activation across the IGP

(Trenberth et al., 2009). Aerosols reduce the heat available       variability due to changes in the size and chemical compo-
for evaporating water and energizing convective rain clouds        sition of aerosols (Patidar et al., 2012; Bhattu and Tripathi,
by scattering and absorbing radiation and by modifying cloud       2014) and the hygroscopic nature of aerosols (Bhattu et al.,
properties. Intrusion of a large number of fine aerosols into      2016), while Ram et al. (2014) showed the role of primary
clouds can inhibit precipitation by slowing down the conver-       and non-hygroscopic aerosols in the weakening of the diur-
sion of cloud drops into raindrops, which might prevent very       nal variations of the CCN activation despite large variations
shallow and short-lived clouds from precipitation (Rosenfeld       in the CN and CCN concentrations. Arub et al. (2020) char-
et al., 2008; Rosenfeld et al., 2014). The opposite scenario       acterized the chemical composition and size distributions of
of aerosol–cloud interactions leading to the invigoration of       aerosols in Delhi, situated in the central IGP, and showed the
clouds and vigorous precipitation has also been reported,          impacts of air masses coming from different locations on the
even over moderately polluted environments (Lebo and Se-           hygroscopicity and CCN activation. The seasonal variations
infeld, 2011; Altaratz et al., 2014; Koren et al., 2014).          of CCN properties revealed significant influence of aerosols
   Thus, activation of aerosol particles for inducing cloud for-   transported from the IGP in modulating the aerosol–cloud in-
mation remains a topic of intense investigation, as aerosols,      teractions over Nainital, located in the Himalayas (Dumka et
through their effects on clouds, can induce large changes in       al., 2015; Gogoi et al., 2015). Similar observations were also
precipitation patterns. Changes in precipitation patterns, in      reported from Darjeeling, a high-altitude site in the eastern
turn, would affect the regional water resources as well as         Himalayas (Roy et al., 2017), revealing the impact of aerosol
the regional and global circulation systems that constitute        transport from the IGP on the CCN properties. The obser-
the Earth’s climate (Song et al., 2014). As such, this knowl-      vations from a high-altitude site, Mahabaleshwar, located in
edge assumes a lot of interest and importance. The fractions       the southern part of India, revealed large seasonal variations
of the aerosols or condensation nuclei (CN) acting as nu-          of CCN and a significant role of organics in the CCN acti-
cleation sites for cloud droplets are known as cloud con-          vation (Leena et al., 2016; Singla et al., 2017). The obser-
densation nuclei (CCN). The variations in the CCN prop-            vations from Gadanki, in southern India (Shika et al., 2020),
erties are strongly influenced by the number size distribu-        revealed a shift in the regimes of CCN activation and cloud
tion and chemical composition of aerosols (Dusek et al.,           formation from the pre-monsoon to monsoon season, which
2006; Hudson, 2007; Gunthe et al., 2009; Rose et al., 2011).       has important implications for cloud droplet formation. Mea-
CCN activation depends on the critical diameter required           surements of CN and CCN over a rain shadow region, Sola-
for activation, which in turn depends on the hygroscopicity        pur in central India, carried out as part of the CAIPEEX cam-
of aerosols, determined by their chemical composition. De-         paign (Jayachandran et al., 2020a), revealed variations in the
spite concerted efforts to understand the aerosol–cloud inter-     CCN characteristics within the monsoon period. Jayachan-
actions and the associated feedback mechanisms in the at-          dran et al. (2017) characterized the CCN properties at Thiru-
mosphere, large uncertainties still exist (McFiggans et al.,       vananthapuram, a coastal location in southern India, while
2006; Andreae and Rosenfeld, 2008; Stevens and Feingold,           Jayachandran et al. (2018) reported contrasting characteris-
2009). This mainly arises from the region-specific and het-        tics of CCN properties over Ponmudi, a hill station in Thiru-
erogeneous nature of aerosols, their vertical mixing and ad-       vananthapuram in comparison to a nearby coastal location.
vection to long distances in the real atmosphere, and sparse-         In this context, improved knowledge of the vertical dis-
ness of in situ measurements of the vital parameters of CCN,       tribution of CCN properties is all the more important. How-
such as the vertical distribution of the CCN number concen-        ever, such measurements are not abundant globally and are
tration, CCN efficiency and its variation with supersaturation     sparse over the Indian region, though a few airborne direct
(SS) (Seinfeld et al., 2016).                                      and indirect measurements have been made in recent years.
   Over the Indian sub-continent, the columnar aerosol load-       Using airborne lidar measurements, Satheesh et al. (2008)
ing is increasing steadily (Babu et al., 2013), while changes      have shown the role of elevated aerosol layers over the In-
are also observed in the rainfall pattern, with significant        dian peninsula in producing large heating at 4 to 5 km alti-
decreasing trends in moderate rainfall events and increas-         tude, just above the low-level clouds during the pre-monsoon
ing trends in extreme rainfall events (Goswami et al., 2006;       season. During 2009, airborne atmospheric measurements of
Guhathakurta et al., 2015). Since aerosols modulate the mon-       vertical profiles of aerosols, clouds and meteorological pa-
soon circulation and rainfall distribution (Gautam et al.,         rameters extending up to 7 km above sea level (a.s.l.) were
2009), the observed changes in aerosol loading and precip-         carried out over different parts of India as part of Cloud
itation patterns are of utmost interest. Studies from different    Aerosol Interactions and Precipitation Enhancement EXperi-
parts of India tried to understand the properties of the re-       ment (CAIPEEX) (Prabha et al., 2011; Kulkarni et al., 2012;
gional aerosols, like their chemistry, CCN activity and hy-        Padmakumari et al., 2013). In situ measurements of CN and
groscopic properties. However, most of these studies were          CCN were also carried out during the Indian Tropical Con-
ground-based, focusing on case studies or long-term mea-           vergence Zone (ITCZ) campaign during the monsoon period
surements on seasonality. Studies from Kanpur, in the cen-         in 2009 (Srivastava et al., 2013). However, the majority of
tral Indo-Gangetic Plain (IGP), looked into inter-seasonal         these measurements remained confined to different phases of

Atmos. Chem. Phys., 21, 8979–8997, 2021                                             https://doi.org/10.5194/acp-21-8979-2021
M. R. Manoj et al.: CCN activation across the IGP                                                                           8981

the monsoon season in different years so that the changes in     21.14◦ N, 79.08◦ E; 310 m a.s.l.) during Phase 1 and Ahmed-
the CCN characteristics as the season transits from dry sum-     abad (AMD – 23.02◦ N, 75.57◦ E; 53 m a.s.l.) during Phase
mer to the wet monsoon season remained largely elusive.          3.
   The joint Indo-UK field experiment, SWAAMI, was for-             The Phase 1 measurements covered regions around Luc-
mulated in the above backdrop, aiming at filling the knowl-      know, making east–west transects across the IGP covering
edge gaps related to the properties of aerosols over the In-     Jaipur (west) and Bhubaneswar (east), and proceeded to the
dian region and its relation to the Indian summer monsoon        central Indian region, Nagpur. The third phase covered the
(ISM) by making in situ measurements of aerosol and cloud        above transect (except Nagpur) and made additional mea-
properties, immediately before monsoon onset and during          surements near Ahmedabad. During measurements the air-
its active phase using instrumented aircraft (Manoj et al.,      craft maintained a typical ascend rate of 5.5 m s−1 and de-
2019, and references therein). The campaign was executed         scend rate of 6.5 m s−1 , thereby providing data at a high verti-
jointly by the Ministry of Earth Sciences (MoES) of India,       cal resolution of ∼ 7 m. The horizontal velocity of the aircraft
the Indian Space Research Organisation (ISRO) and the Nat-       has been typically ∼ 100 m s−1 , which means that a typical
ural Environment Research Council (NERC) of the UK and           ascent of the aircraft from near the surface to ∼ 7 km cov-
employed UK’s BAe-146-301 Atmospheric Research Air-              ers a horizontal distance of roughly 130 km. The descriptive
craft. This was closely preceded by airborne measurements        statistics were performed after separating the data vertically
of aerosol properties across the IGP aboard an Indian aircraft   into 300 m blocks. During the campaign the aircraft made
up to an altitude of ∼ 3.5 km (Jayachandran et al., 2020a;       22 dedicated scientific flights spanning approximately 100 h
Vaishya et al., 2018). Our study provides altitude-resolved      in three phases: Phase-1: 11 to 13 June 2016 (three flights;
CCN properties at higher altitudes compared to Jayachan-         ∼ 12 h, just prior to onset of monsoon) and Phase-3: 2 July
dran et al. (2020a) and explores the impact of chemical com-     to 11 July 2016 (nine flights: ∼ 40 h, during the active phase
position reported by concurrent measurements (Brooks et          of the monsoon), while Phase 2 was meant for other objec-
al., 2019a) on the CCN properties. The campaign details          tives not related to aerosols. A list of the aerosol instruments
along with the measurement protocols are briefly stated be-      aboard, the parameters retrieved from the measurements, the
low (more details are available in Manoj et al., 2019), fol-     relevant reference to the principle of instrument and data de-
lowed by the results and discussions.                            duction details, general aircraft data and met data is provided
                                                                 in Manoj et al. (2019) and references therein. The detailed
                                                                 flight tracks are given in the Supplement (Figs. S1 and S2).
2   Data and methodology                                            The aerosols sampled in this study were collected using a
                                                                 Rosemount inlet. The CN concentration was estimated using
The airborne measurements of the SWAAMI campaign were            a modified water-filled Condensation Particle Counter (CPC)
carried out in three phases extending from 11 June to            TSI 3786. Operating at a flow rate of 0.6 L min−1 , it can
11 July 2016 (Brooks et al., 2019a; Manoj et al., 2019)          detect particles in the size range 2.5 nm to > 3 µm and can
aboard the BAe-146-301 atmospheric research aircraft op-         measure concentrations up to 105 particles cm−3 . The CCN
erated by Facility for Airborne Atmospheric Measurements         concentration was measured using a dual-column cloud con-
(FAAM) BAe-146 (Highwood et al., 2012; Johnson et al.,           densation nuclei counter (Droplet Measurement Technolo-
2012). During these, data were collected over an altitude        gies Inc. CCN-200), which is a continuous-flow stream-wise
range from very close to the surface to as high as 8 km. This    thermal gradient chamber (CFSTGC) instrument. The CCN
study reports the measurements carried out during Phase 1        counter operated at a flow rate of 1 L min−1 , and the flow
(just prior to the onset of the Indian summer monsoon (ISM),     is evenly split between the two columns. The sample-to-
hereinafter called “pre-onset”) and Phase 3 (during its active   sheath flow ratio is set to 1 : 10, which leaves 0.05 L min−1
phase) across the IGP covering its western, central and east-    for each column for sampling. The samples flowing to the
ern parts and capturing the transition of aerosol properties     CCN counter and CPC first pass through a Nafion dryer
from dry to wet climatic zones. The measurements also cov-       (Permapure MD-110-12S), which prevents condensation in
ered parts of central India. Details of the measurements are     the sample lines. The mean RH of the ambient and sam-
summarized in Table 1. The airborne measurements focused         ple lines during pre-onset were 49.7 % and 28.7 % and those
on three locations, Lucknow (LCK – 26.84◦ N, 80.94◦ E;           during monsoon measurements were 73.5 % and 54.4 % re-
126 m a.s.l.) in the central IGP and Jaipur/Jodhpur (JPR –       spectively for ambient and sample lines. To gain as much
26.91◦ N, 75.78◦ E; 431 m a.s.l.; JDR – 26.23◦ N, 73.02◦ E;      information as possible from a flight, the instrument was set
233 m a.s.l.) located at the southern tip of the western IGP     up to have one column scanning three different supersatu-
and Bhubaneswar (BBR – 20.29◦ N, 85.82◦ E; 58 m a.s.l.) lo-      rations (0.12 %, 0.23 % and 0.34 %), and the other was sta-
cated just south of the eastern boundary of the IGP along        ble (0.1 %), providing four different supersaturations every
the eastern coast of India, though the base station for all      15 min. More details are provided in the Supplement. De-
the measurements was Lucknow. Measurements were also             tails of the principle of operation of the CCN counter are
made around two locations in central India, Nagpur (NGP –        available elsewhere (Roberts and Nenes, 2005; Lance et al.,

https://doi.org/10.5194/acp-21-8979-2021                                          Atmos. Chem. Phys., 21, 8979–8997, 2021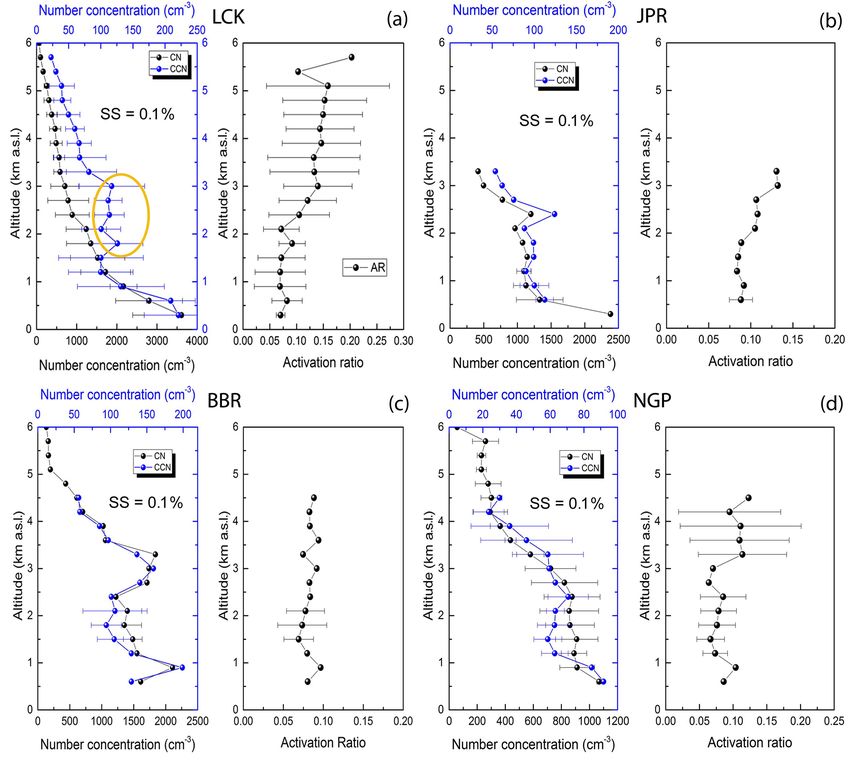
8982                                                                      M. R. Manoj et al.: CCN activation across the IGP

Table 1. Details of measurements.

         Sl. no.   Date      Phase   Flight code   Section   Region covered   Track                             Location
         1         11 June   1       B956          A         LCK to JPR       West of LCK          80.3 ± 0.3, 27.1 ± 0.2
                                                   B                          West of JPR          75.3 ± 0.0, 26.5 ± 0.1
                                                   C                          East-to-west JPR     76.9 ± 0.8, 27.6 ± 0.1
         2         12 June   1       B957          A         LCK to BBR       East of LCK          81.2 ± 0.3, 26.4 ± 0.2
                                                   B                          BBR                  85.6 ± 0.1, 20.4 ± 0.1
                                                   C                          North-west of BBR    83.8 ± 0.6, 22.9 ± 1.3
                                                   D                          East of LCK          83.0 ± 0.0, 25.0 ± 0.0
                                                   E                          East of LCK          81.1 ± 0.1, 26.5 ± 0.1
         3         13 June   1       B958          A         NGP to BLR       South of LCK         80.5 ± 0.1, 26.4 ± 0.2
                                                   B                          NGP                  78.8 ± 0.1, 20.6 ± 0.3
                                                   C                          South of NGP         79.2 ± 0.2, 20.2 ± 0.0
         4         2 July    3       B969          A         LCK to JPR       LCK                  80.5 ± 0.3, 27.1 ± 0.2
                                                   B                          JDR                  73.9 ± 0.7, 26.4 ± 0.1
                                                   C                          JDR to JPR           76.3 ± 1.5, 27.1 ± 0.4
                                                   E                          LCK                  80.8 ± 0.2, 26.7 ± 0.0
         5         3 July    3       B970          A         LCK to JPR       LCK                  80.3 ± 0.3, 27.1 ± 0.2
                                                   B                          JDR                  72.9 ± 0.0, 26.1 ± 0.0
                                                   C                          JDR to JPR           76.3 ± 1.8, 27.0 ± 0.5
                                                   D                          West of LCK          79.4 ± 0.2, 27.3 ± 0.0
                                                   E                          LCK                  80.7 ± 0.2, 26.8 ± 0.0
         6         4 July    3       B971          A         LCK to BBR       LCK                  81.3 ± 0.3, 26.4 ± 0.2
                                                   B                          BBR                  86.1 ± 0.1, 19.8 ± 0.1
                                                   C                          BBR to LCK           85.2 ± 0.7, 20.8 ± 0.7
                                                   D                          BBR to LCK           83.5 ± 0.2, 23.1 ± 0.7
                                                   E                          LCK                  81.2 ± 0.1, 26.5 ± 0.1
         7         5 July    3       B972          A         LCK to JPR       LCK                  80.3 ± 0.3, 27.2 ± 0.2
                                                   B                          JDR                  73.8 ± 0.8, 26.3 ± 0.2
                                                   C                          JDR to JPR           74.5 ± 0.8, 26.5 ± 0.1
                                                   D                          North of JPR         76.4 ± 0.3, 27.1 ± 0.2
                                                   E                          West of LCK          79.1 ± 0.6, 27.4 ± 0.2
                                                   F                          LCK                  80.5 ± 0.2, 26.8 ± 0.1
         8         6 July    3       B973          A         LCK to JPR       LCK                  80.3 ± 0.4, 27.2 ± 0.5
                                                   B                          JPR                  75.3 ± 0.0, 26.8 ± 0.2
                                                   C                          South of JPR         75.3 ± 0.0, 26.3 ± 0.3
                                                   D                          JPR                  75.4 ± 0.0, 25.9 ± 0.1
                                                   E                          East of JPR          76.4 ± 0.3, 26.9 ± 0.0
                                                   F                          West of LCK          79.5 ± 0.9, 27.0 ± 0.2
         9         7 July    3       B974          A         LCK to AMD       LCK                  80.7 ± 0.1, 26.2 ± 0.3
                                                   B                          SE of AMD            74.8 ± 0.3, 22.4 ± 0.1
                                                   C                          East of AMD          76.4 ± 0.3, 22.9 ± 0.1
                                                   D                          East of AMD          77.0 ± 0.1, 23.1 ± 0.0
                                                   F                          LCK                  80.7 ± 0.0, 26.6 ± 0.1

2006). More details on the inlet, the plumbing and working         3   Synoptic meteorology during the campaign
of the CPC and CCN counter are given in Trembath (2013).
                                                                   In 2016, the monsoon onset was delayed by a week; the on-
                                                                   set at the southern tip of the Indian peninsula occurred on
                                                                   8 June. The rainfall for the season however was near normal,
                                                                   about 97 % of the long-term average for the season (Purohit
                                                                   and Kaur, 2016). Consequent to this delayed onset, monsoon

Atmos. Chem. Phys., 21, 8979–8997, 2021                                               https://doi.org/10.5194/acp-21-8979-2021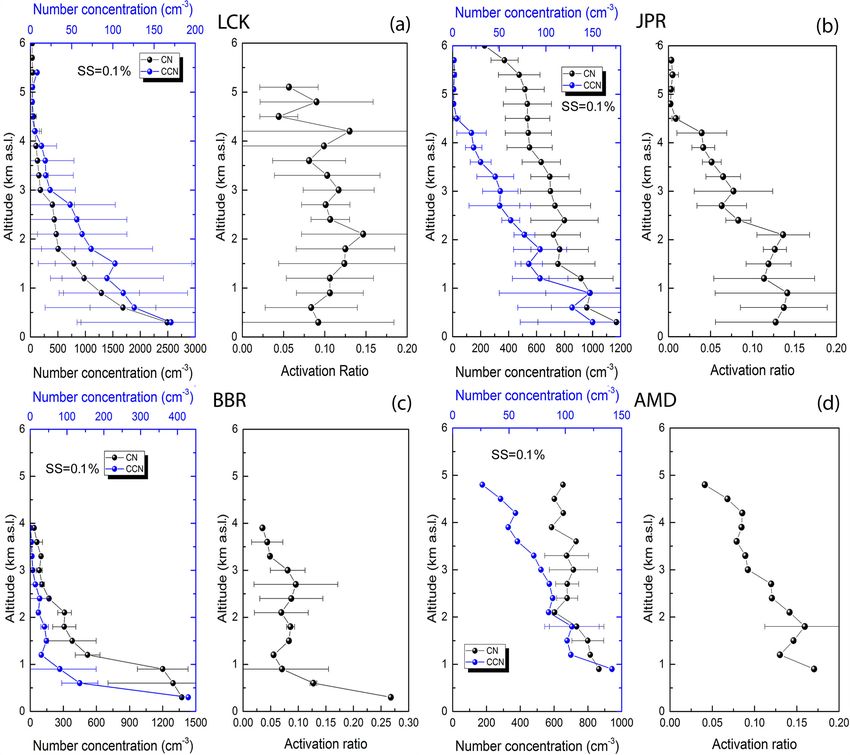
M. R. Manoj et al.: CCN activation across the IGP 8983
arrived at LCK only on 21 June and covered the entire In- ambient aerosols would be in the range 75–125 nm (Deng
dian region by 13 July (climatologically, this should occur et al., 2011). The CCN number-size distribution curve will
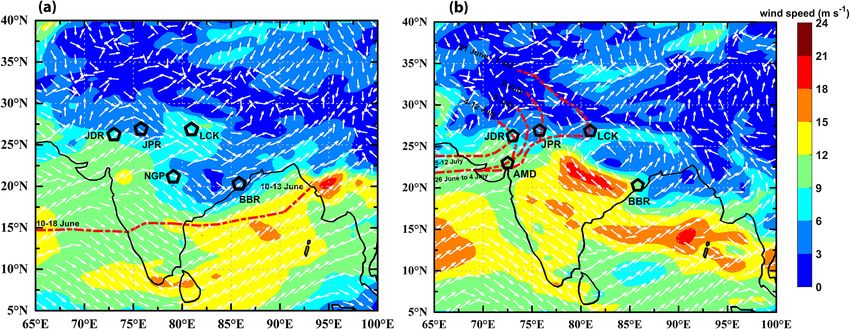
towards the end of June). The meteorological wind fields at peak above 200 nm with the maximum size of the CCN close
850 hPa from the ERA-Interim reanalysis of the European to 600 nm at SS = 0.1 % (Gunthe et al., 2009).
Centre for Medium Range Weather Forecasts (Dee et al., Being the centre of operations, measurements were made
2011) was used to show the advance of the south-western around LCK (representing the central IGP) on all three days
monsoon during the two phases of measurements (Fig. 1). (11, 12 and 13 June). As such, the mean profiles of CN,
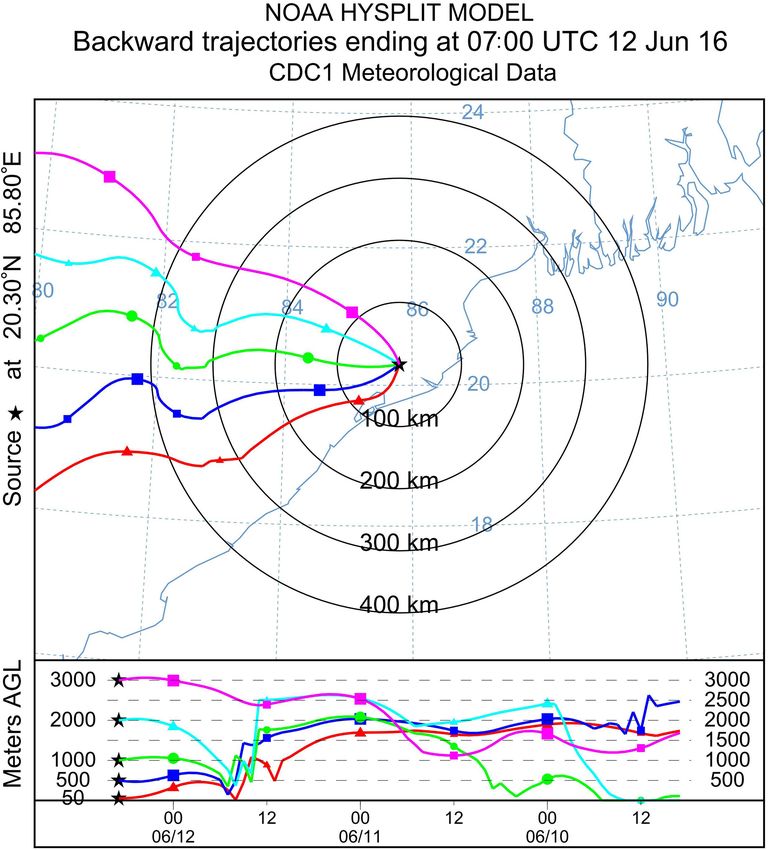
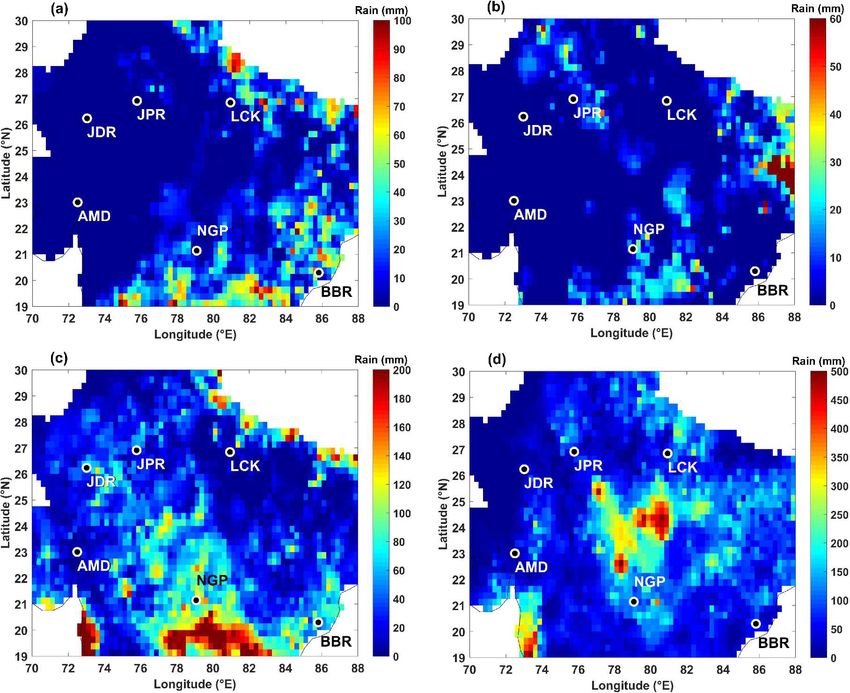
The spatial distributions of accumulated rainfall for the CCN and AR shown in Fig. 3a provide the best statisti-
respective phases as well as for the preceding 1 week are cal dataset (spatially and temporally averaged) for pre-onset
shown in Fig. 2, based on the high-resolution (0.25◦ × 0.25◦ ) conditions over the central IGP. The highest CN concentra-
rain data (Pai et al., 2014) provided by the Indian Meteo- tion (> 3500 cm−3 ) occurred near the surface and decreased
rological Department during the campaign period. The to- rather monotonically towards higher altitudes to reach val-
tal rainfall (in millimetres) received over the northern part of ues of ∼ 1800 and ∼ 100 cm−3 respectively at 1 and 6 km.
India (> 25◦ N) during 4–10 June (1 week before the com- Variations (represented by the standard deviations) are higher
mencement of Phase 1 of the SWAAMI campaign, Fig. 2a) closer to the surface. Vertical variation of CCN concentration
resulted from a few isolated rain events to the north of JPR (blue line) followed the pattern observed in CN up to an alti-
and LCK leaving central India and the majority of the IGP tude of 1.5 km, and above that CCN showed an increase with
without any rain. Some isolated rain events occurred in the a couple of peaks (marked by the ellipse in the figure) in the
vicinity of NGP, while BBR received moderate rainfall prior altitude range 1.5 to 3.5 km. At higher levels, the variation of
to the Phase 1 measurements. The accumulated rainfall dur- CCN again followed the pattern of CN. The activation ratio
ing Phase 1 measurements (11–13 June) is shown in Fig. 2b. was low (∼ 0.08) near the surface and remained steady until
Apart from the isolated rainfall in the vicinity of JPR and about 2 km, above which it increased rather sharply to reach
NGP, the other locations hardly received any rain. a value of ∼ 0.15 at 3 km and remained nearly steady towards
However, by the third phase of the campaign, the mon- higher altitudes. This sudden increase in the AR appears to
soon was established in the northern parts of India and the be responsible for the observed peaks in CCN concentration
IGP. The total rainfall received in the vicinity of the measure- (despite the decrease in CN) in the altitude range of 1.5 km
ment regions during the period 25 June to 1 July, i.e. 1 week to ∼ 2.5 km and is indicative of the presence of a different
before the Phase 3 measurements, is shown in Fig. 2c. JDR aerosol type prevailing above ∼ 1.5 to 2 km, which is more
and BBR received moderate rainfall during this period, while CCN-active in nature. CCN concentrations are more sensi-
LCK, JPR and AMD received much less rain. However, dur- tive to hygroscopicity in comparison to mixing state at low
ing the Phase 3 measurements the main regions under study SS (∼ 0.15 %) (Meng et al., 2014).
received weak/moderate rainfall (Fig. 2d). The nearly concurrent characteristics of CCN over the
semi-arid region of the western IGP are examined in Fig. 3b
based on the measurements around JPR on 11 June. While
4 Results and discussions the nature of the altitude variation of CN and CCN is similar
to that observed at LCK, the overall CN and CCN concen-
4.1 Observations during Phase 1 – pre-onset phase trations are lower, and the elevated peaks (occurring above
2 km) are sharper and seen on both CN and CCN concen-
As stated earlier, during this phase, the measurements were trations. Again, the activation ratio is slightly higher (∼ 0.1
made centred about LCK, JPR, BBR and NGP. Subsequently closer to the surface) and increases steadily with altitude,
to the delayed onset, monsoon did not advance even to the reaching around 0.15 at 3 km. However, here the data are lim-
southernmost of these locations (NGP) prior to Phase 1 ited up to about 3.2 km only.
(Fig. 1a). As such, Phase 1 measurements corresponded to Moving over to the eastern IGP, represented by BBR,
conditions just prior to onset of the monsoon (pre-onset) at Fig. 3c shows the altitude variations based on measure-
all the locations and across the IGP. The mean vertical pro- ments made on 12 June. Differing slightly from the pat-
files of CN and CCN concentrations were estimated using tern seen in the western and central IGP regions, the verti-
five profiles for LCK and two profiles each for the other three cal variations in AR are weaker in this region. In general,
locations. The altitude variations of the mean concentrations CN and CCN showed variations similar to those at LCK
of CN and size-integrated CCN at 0.1 % SS and the corre- and JPR, with higher values near the surface and lower val-
sponding activation ratio (AR) at 0.1 % SS for all four lo- ues at higher altitudes. The highest CN / CCN concentration
cations are shown in Fig. 3. The mean supersaturation was (2264/184 cm−3 ) was observed near the peak below to 1 km.
0.099 ± 0.005, with 95 % of the points within the interval Two elevated peaks (the first near 1 km and the second near
0.098 and 0.100. The activation curves for ambient aerosols 3 km) occur in the concentrations of both CN and CCN. The
will not follow that of ammonium sulfate particles if they second peak is much broader, extending from 2.5 to 3.5 km,
are externally mixed, and for SS = 0.1 % the dry diameter of with high CN and CCN concentrations of 1845 and 161 cm−3
https://doi.org/10.5194/acp-21-8979-2021 Atmos. Chem. Phys., 21, 8979–8997, 2021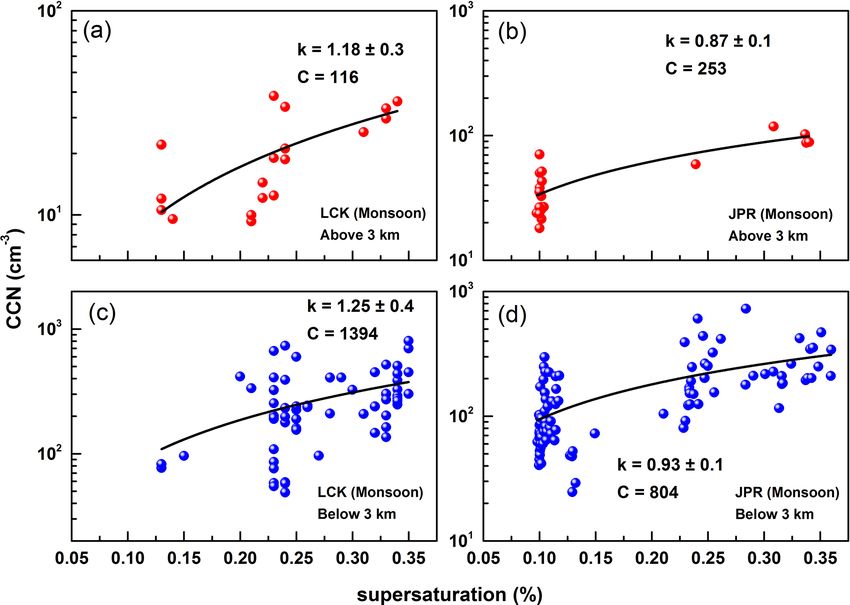
8984                                                                       M. R. Manoj et al.: CCN activation across the IGP

Figure 1. The advance of monsoon and the synoptic wind field at 850 hPa during (a) Phase 1 and (b) Phase 3 of the SWAAMI campaign.
The red dotted line indicates the northern limit of monsoon.

Figure 2. Accumulated rainfall for the periods (a) 4–10 June (1 week prior to Phase 1 measurements), (b) 11–13 June (during Phase 1
measurements), (c) 25 June to 1 July (1 week prior to Phase 3 measurements) and (d) 2–7 July (during Phase 3 measurements of the
SWAAMI campaign).

Atmos. Chem. Phys., 21, 8979–8997, 2021                                              https://doi.org/10.5194/acp-21-8979-2021
M. R. Manoj et al.: CCN activation across the IGP 8985
Figure 3. The number concentrations of the CN, CCN at 0.1 % supersaturation and AR over LCK, JPR, BBR and NGP are shown in (a), (b),
(c) and (d) respectively. The activation ratio gives the fraction of the total aerosols which can be converted to CCN at 0.1 % supersaturation.
respectively. The activation ratio at lower altitudes (∼ 0.1) is 4.1.1 Regional features of CCN during the pre-onset
higher than the corresponding values at LCK and closer to phase
those seen at JPR. However, there is little variation in the AR
up to an altitude of 4.5 km.
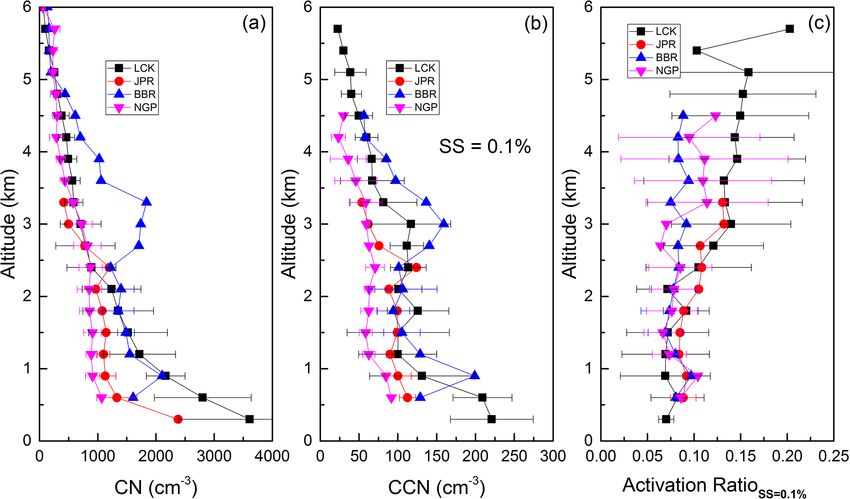
The regional picture of the altitude variations of the CN,
Altitude variations of the mean CN concentration, CCN
CCN (SS = 0.1 %) and AR (SS = 0.1 %) for the pre-onset
concentration and AR over the central Indian region, from
phase is shown in Fig. 4. The most striking feature is that
measurements around NGP, made on 13 June between 12:45
there is a steady increase in the AR with altitude in the west-
and 13:45 local time, are shown in Fig. 3d. The profiles show
ern and central IGP, and the altitude variations are much
a nearly steady CN concentration in the lower-altitude region
weaker in central India and almost absent in the eastern IGP,
of 500 to 2500 m and decrease thereafter, reaching low val-
indicating a difference in the aerosol properties across the
ues close to 200 cm−3 at ∼ 4.2 km and then remaining nearly
IGP. Below 2 km the CN concentrations are highest in the
steady up to 5.7 km. In the lower-altitude region, CCN de-
central IGP (where the anthropogenic emissions are higher),
creases with altitude, then reveals a peak around 2.5 km and
closely followed by the eastern IGP (BBR) and western IGP
then decreases monotonically. The activation ratio remained
(JPR), with the lowest values in central India (NGP). The
low (∼ 0.08) and nearly steady up to 2.5 km and then in-
CN concentrations above 2 km are comparable at all the sta-
creased to 0.15 above 3 km (somewhat similar to the obser-
tions except BBR, where the CN concentrations were high
vation over the IGP).
due to the presence of a thick elevated layer in the 2.5 to
3.5 km region. The main factor controlling the CCN activa-
https://doi.org/10.5194/acp-21-8979-2021 Atmos. Chem. Phys., 21, 8979–8997, 2021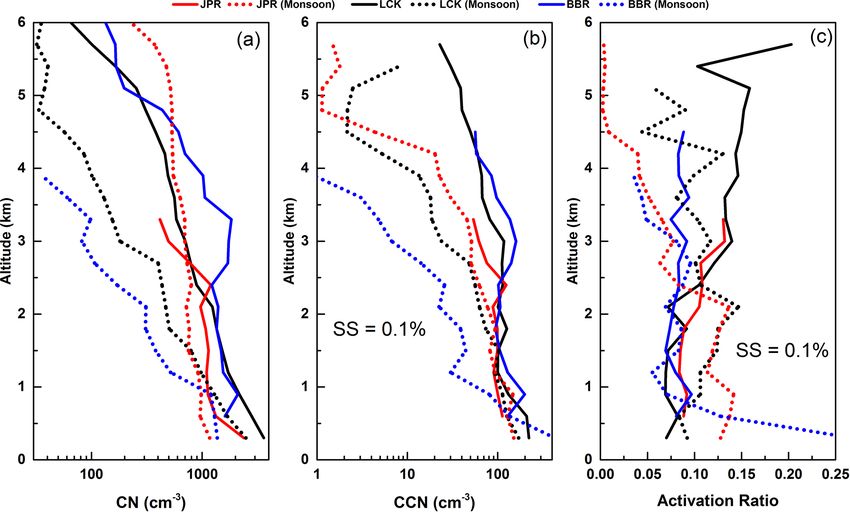
8986                                                                    M. R. Manoj et al.: CCN activation across the IGP

tion at low SS (∼ 0.1 %) is the hygroscopicity of the parti-      IGP, with the CCN concentrations (at 0.4 % supersaturation)
cles (Meng et al., 2014), which is determined by its chemical     below 1 km being comparable to that in the central IGP, while
composition. Gunthe et al. (2009) found that particles with       in the 1 to 3 km range the CCN concentrations were higher
diameters ∼ 50 and ∼ 200 nm respectively had hygroscopic-         compared to the central IGP. The complex interplay of dif-
ity parameters 0.1 and 0.2 respectively.                          ferent advected species appear to be responsible for this, at
   The altitude variations of CCN concentrations are not as       least partly. The results by Jayachandran et al. (2020a) are
well defined as those of CN. Below 1.5 km the CCN con-            however limited to the changes happening within the bound-
centrations were highest in the eastern IGP (except for a         ary layer and fail to completely capture the elevated aerosol
sharp drop in the concentrations near 0.5 km), followed by        layers which we found to exist even above 3 km.
LCK, JPR and NGP. CCN concentrations increase in the 1.5             It is well known that the CCN concentration strongly de-
to 2.5 km range in all data except those from NGP. Above          pends on the number size distribution and chemical compo-
2.5 km, the magnitudes of CCN at various locations dif-           sition of aerosols, while the supersaturation spectra depend
fer widely (though with an overall decreasing trend with          on the aerosol number size distribution (Fitzgerald, 1973). If
altitude), with the highest concentrations at BBR followed        ammonium sulfate and adipic acid with a size of 100 nm are
by LCK. The lowest concentrations were observed at NGP,           considered, the former can be activated at 0.15 % SS, while
where the values were comparable to JPR in the 3 to 3.2 km        the latter can only be activated at 0.27 % SS (Hings et al.,
altitude range; measurements above 3.2 km are not available       2008; Zhang et al., 2012). As such, we examined the changes
for JPR.                                                          in the chemical composition of aerosols at BBR, from con-
   The AR (at SS = 0.1 %) clearly indicates two features:         current measurements by other investigators aboard the same
(a) the presence of more CCN-active aerosols at higher al-        flight (Brooks et al., 2019a), who have reported a sharp in-
titudes in the western and central IGP as well as central         crease in the concentration of organics near 1 km (Brooks et
peninsula, which is not seen over the eastern IGP (b) over        al., 2019a; Fig. 11c; B957 PM), where our observations show
the most anthropogenically impacted central IGP, two differ-      a sharp increase in CCN concentration and a weak increase
ent aerosol types with a less CCN-active layer below ∼ 2 km,      in AR, which otherwise remained featureless (nearly steady
and a more CCN-active layer above leading to a change in the      at ∼ 0.08) in the entire altitude region. Moving to higher al-
CCN / CN ratio in the altitude region 2 to 3 km. The vertical     titudes, measurements by Brooks et al. (2019a, same figure)
distribution of the concentrations and the AR of aerosols had     have shown a large increase in the concentration of sulfates,
more distinct regionally varying patterns above 3 km. The         NH4, organics and BC in the altitude region of 2.5 to 3 km,
increase in the activation ratio above 3 km observed in our       where our observations show a broad peak in CN and CCN
study has not been reported earlier. The regional variations      concentration but with no perceptible impact on AR. Res-
in the CCN concentrations above 3 km were found to have           idential sectors are the main source of organics in the re-
an east-to-west gradient, with the highest values in the east.    gion, while brick kilns (which use coal and lignite) emit large
To understand the peculiar behaviour of AR over the eastern       amounts of sulfates (Pandey et al., 2014). We hypothesize
IGP with two elevated peaks in the CN and CCN (near 1 and         that though the increase in the concentrations of sulfates and
3 km) and a nearly steady and low value of AR, we exam-           organics in this region was favourable for an increase in AR,
ined the air-mass back trajectories in Fig. 5. These clearly      the simultaneous increase in BC (hydrophobic) prevented
reveal that the altitude region of 1.5 to 3 km was under the      any conspicuous impact on AR. This is also supported by the
influence of distinct advection pathways. One path favours        observations by Jayachandran et al. (2020a) of low CCN ef-
the advection of more hygroscopic particles (as evidenced         ficiency associated with high concentrations of BC based on
by Fig. 3a and b) from the north-western region (magenta          independent measurements made a week prior to our mea-
colour in Fig. 5), at around 3 km altitude, while the other en-   surements. While Jayachandran et al. (2020a) showed that
counters less CCN-active aerosols being lofted from close to      the presence of BC can reduce the activation efficiency of
the ground, from sources in the south-west (central IGP), as      aerosols in the boundary layer, we found that this also hap-
it approached BBR (red line in Fig. 5). The presence of less      pens at higher altitudes. Consequently, though CN and CCN
hygroscopic particles (probably freshly emitted BC) in the        increase in line with the increase in the concentration of
lower altitudes < 1 km is seen from Fig. 3a and d (around         precursor gases (Brooks et al., 2019a), AR remains nearly
the central IGP and central peninsula). The mixing of these       unaffected. This did not happen for the peak around 1 km,
two types of particles in the altitude region of 1.5 to 2.5 km    because of the lower concentration of BC at that altitude
seems to contribute to the elevated peaks in CN and CCN as        (Brooks et al., 2019a). Extending the above role of chem-
well as the near-steady value of AR in this region, in contrast   istry to the central and western IGP regions, we recall that
to the increase seen at other locations. From an independent      Brooks et al. (2019a) showed that within the boundary layer,
airborne measurement of CCN characteristics (again as a part      the concentration of organics (43 %) exceeded the concen-
of SWAAMI, using an Indian aircraft) during the first week        tration of sulfates (29 %) in the submicron mass over the
of June, a week prior to our measurements, Jayachandran et        central IGP, whereas in the western (JPR/JDR) and eastern
al. (2020a) observed almost similar features in the eastern       (BBR) IGP, sulfate was the dominant species, contributing

Atmos. Chem. Phys., 21, 8979–8997, 2021                                            https://doi.org/10.5194/acp-21-8979-2021
M. R. Manoj et al.: CCN activation across the IGP                                                                              8987

Figure 4. Comparison of CN, CCN and AR values at the different locations during Phase 1 of the campaign. The CCN and AR corresponding
to 0.1 % supersaturation are shown.

                                                                     the western and central IGP seen in Figs. 3a and b and 4c.
                                                                     The low activation within the boundary layer, in the central
                                                                     IGP, appears to be at least partly associated with the high
                                                                     concentrations of BC (which is hydrophobic in nature when
                                                                     freshly emitted), emitted by the local sources. Similar obser-
                                                                     vations are also reported by Jayachandran et al. (2020a) from
                                                                     near-concurrent measurements at Varanasi in the central IGP
                                                                     (close to LCK) aboard another aircraft about 1 week prior to
                                                                     our measurements. Thus, we see that along with advection,
                                                                     the changes in the chemistry (concentration of precursors)
                                                                     also have a significant role in producing the observed spatial
                                                                     variation of the altitude profile of CCN characteristics and
                                                                     AR across the IGP prior to onset of monsoon.
                                                                        During the pre-monsoon period, the entire IGP is ex-
                                                                     tremely hot, with temperatures routinely above 40 ◦ C, go-
                                                                     ing as high as 48 ◦ C during the peak. The resulting strong
                                                                     convective mixing distributes local surface-based emissions
                                                                     deep into the planetary boundary layer (PBL), which itself
                                                                     is deep (going to 2 km or more). Above the PBL, however,
                                                                     long-range transport has a strong influence on the altitudi-
                                                                     nal distribution. We examined the 3 d back trajectories of
                                                                     the air mass reaching LCK (central IGP) and JPR (western
                                                                     IGP) in Figs. S3 to S6. The figures clearly show that while
Figure 5. Three-day back trajectories of the air mass arriving at    long-range transport had a negligible role below 1 km, it in-
BBR at altitudes 50 m, 500 m and 1, 2 and 3 km during our mea-       fluenced significantly above 2 km. This lends further support
surements.
                                                                     to our inference that in the central IGP the local emission of
                                                                     fresh hydrophobic particles (like BC) is responsible for the
                                                                     low AR within the PBL (< 2 km), and the long-range trans-
44 %, followed by organics (30 %). However, this distinction
                                                                     ported aerosols including dust, discussed in more detail be-
was confined within the boundary layer, above which sul-
                                                                     low, lead to the increase in AR and a subsequent increase in
fates dominated throughout the IGP region. This implies that
                                                                     CCN (despite the decrease in CN) above 2 km. Jayachandran
in the central IGP, local emissions contributed significantly
                                                                     et al. (2020a) do not cover the transport of aerosols above the
at the lower altitudes. This, at least partly, accounts for the
                                                                     boundary layer, which we found were more hygroscopic and
increase in the AR above the boundary layer seen in both

https://doi.org/10.5194/acp-21-8979-2021                                              Atmos. Chem. Phys., 21, 8979–8997, 2021
8988 M. R. Manoj et al.: CCN activation across the IGP
more amenable to CCN activation compared to the boundary – The eastern and central IGP had higher concentrations
layer aerosols. of CN compared to the western IGP. Below 1 km the
Examining the size distributions, it is well known that dur- concentrations of aerosols were higher in the central
ing the pre-monsoon, accumulation-mode and coarse-mode IGP compared to the eastern IGP, while above 2 km,
particles dominate the aerosol volume size distribution re- there was a reversal in the pattern. This is associated
spectively within and above the PBL in the central IGP, with the transport of aerosols over BBR, which includes
due to the influence of the prevailing wind, flowing from dust from western Asia and anthropogenic emissions
the arid, dusty regions in the north-west of India (Gau- from the central IGP. The high wind speeds in the re-
tam et al., 2011). The accumulation-mode number concen- gion, during this period, are ideal for transport of pollu-
tration was greatest within the boundary layer, coinciding tants.
with high organic aerosol loading. However, in the west-
ern IGP, coarse-mode (dust) aerosols (emitted locally) pre- – The altitude distribution of CCN somewhat differed
vailed at all heights. Concurrent measurements by Brooks from that of CN. In the altitude range 1.5 to 2.5 km,
et al. (2019b) have shown that the BC within the bound- sharp changes are observed in the CCN concentrations
ary layer was not coated thickly (rather freshly emitted), but throughout the IGP. However, above 3 km an overall de-
above the boundary layer the BC had thick coating (aged creasing trend is observed, with distinct regional varia-
BC) in both the central and western IGP (LCK and JPR). tions giving rise to a large westward (decreasing) gradi-
The relatively larger particles above the boundary layer are ent across the IGP. The complex interplay of local emis-
better amenable for activation compared to the smaller par- sions and advection of aerosols, along with the PBL
ticles within the boundary layer. Observations from the cen- dynamics and chemistry involving pre-cursor gases, is
tral Himalayan site, Nainital, located 1958 m above sea level found to be responsible for the observed spatial vari-
(Dumka et al., 2015, 2021), revealed that aged and coated ation of the altitude profiles of CCN characteristics
BC aerosols (consequently bigger in size), transported to this across the IGP, as discussed above.
location from the IGP, were more hygroscopic compared to
freshly emitted BC aerosols. In the western IGP the CN and – The AR values along the IGP and central peninsula are
CCN variations go hand in hand with a high correlation co- comparable below 2 km, and the altitude variations fol-
efficient of 0.94. The AR is high and comparable to the val- low a similar pattern. However, above 2 km, two distinct
ues in the central IGP. The increase in AR with altitude is patterns are observed: (1) AR increasing with altitude in
also observed in the dust-dominated western IGP, similar to the central and western IGP and (2) AR remaining al-
the central IGP. Though freshly emitted dust is hydropho- most steady in the eastern IGP. This shows the presence
bic, they become CCN-active when mixed with other species of more hygroscopic aerosols at higher altitudes in the
like sulfates and nitrates (Kelly et al., 2007). It may also be western and central IGP as well as the central peninsula
noted that the air mass arriving at this region has consider- but not in the eastern IGP.
able overpass above the Arabian Sea, gathering moisture and
allowing the aerosols to mix with marine aerosols, thus en- – In the eastern IGP, concurrent variations of AR and
hancing their hygroscopicity (Fig. S3). The relation of the chemical composition revealed that the presence of or-
observed changes in AR with the chemical composition, BC ganics and sulfates favoured the activation of CCN at
mixing state and size distribution changes are further investi- lower altitudes. It was also observed that, despite having
gated in the coming sections also for the observations during high concentrations of organics and sulfates at higher
monsoon. The low values of CN and CCN near NGP (cen- altitudes, the activation of CCN was reduced by an in-
tral peninsula) might have been partly due to the rain in the crease in the concentration of (hydrophobic) BC.
vicinity prior to our measurements. The AR has a weak alti-
tudinal variation with values increasing above 3 km, indicat- 4.1.2 CCN characteristics during the active phase of
ing a different type of aerosol, but other measurements are the monsoon
not available to further investigate the observed changes.
Summarize the pre-onset scenario. The above characteristics of CCN are re-examined during the
active phase of monsoon, based on the FAAM data collected
during Phase 3 of the campaign, covering the different sub-
– Elevated aerosol layers are present throughout the IGP regions of the IGP (east, central and west – BBR, LCK, and
region, above 2 km, and are identified by large increases JPR) and AMD during 2–7 July. By this date the monsoon is
in the number concentrations of CN and CCN. How- established over the entire Indian region (Figs. 1 and 2). The
ever, the AR in these elevated layers did not show sharp mean profiles of CN and CCN concentrations were estimated
changes, implying that the sources are more or less ho- using 14 profiles for LCK, 11 profiles for JPR and 2 profiles
mogeneous, at all altitudes within a region, except per- each for the other two stations as detailed in Table 1. The
haps in the central IGP. variation of the mean CN concentration, CCN concentration
Atmos. Chem. Phys., 21, 8979–8997, 2021 https://doi.org/10.5194/acp-21-8979-2021M. R. Manoj et al.: CCN activation across the IGP 8989
and the AR for all the above four locations are presented in altitude (5 km), somewhat resembling the pattern seen in the
Fig. 6a–d following the same methodology as in Fig. 3. western IGP but with a stronger altitudinal variation of AR.
The changes from prior to onset of monsoon to the active While the CN concentrations are almost the same in the
phase of monsoon are clearly depicted in Fig. 7, where all western stations (JPR and AMD) at all altitudes, the CCN
three parameters are compared. The most conspicuous fea- concentrations are higher in AMD (Fig. 6b and d), indicating
tures revealed by Figs. 6 and 7 are the following. a more CCN-active aerosol. This is attributed to the stronger
advection of marine aerosols from the Arabian Sea, bringing
1. Very large reduction in the concentrations of CN and in more hygroscopic aerosols to AMD (Fig. S7).
CCN during the active phase (from the values which
prevailed prior to the onset) at all altitudes and across 4.1.3 CCN spectra
the entire IGP, with concentrations of CCN dropping
more dramatically than the CN. With a view to furthering the above understanding of the
spatial and vertical variation in CCN characteristics and the
2. The effects are most prominent over the eastern IGP, fol- changes with respect to the monsoon activity, we have ex-
lowed by the central IGP, while over the western IGP, it amined the CCN spectra (variation of CCN concentration
is rather weak and is significant only at higher altitudes as a function of supersaturation) using the measured data.
(Fig. 7). It is well established that the ability of an aerosol to be
CCN is a function of both the hygroscopicity and size dis-
3. Reduction in concentrations during the active monsoon tribution of aerosols (Twomey and Wojciechowski, 1969;
phase increases with increasing altitude, from nearly Hegg et al., 1991; Khain, 2009; Jefferson, 2010). Following
30 % reduction near the surface to as much as 90 % Twomey (1959) and Cohard et al. (1998), we have parame-
at around 4 km altitude (from the corresponding values terized the CCN spectra using a power-law relation.
prior to the onset of monsoon), with the spatial features
described in point no. 2 above. NCCN = CSSk , (1)
4. In the semi-arid western IGP, which experiences much where NCCN is the number concentration of CCN at a par-
less rainfall, the reduction (from the values prior to the ticular supersaturation (SS), and C and k are empirical co-
onset of monsoon) in CN and CCN is marginal and efficients. Lower values of k imply quick activation of CN
is seen only below ∼ 3 km. The average accumulated even at low SS and are generally associated with more hygro-
rainfall over a week prior to the measurements in a scopic and coarse-mode aerosols (such as sea spray). On the
2◦ × 2◦ grid surrounding JPR was merely 28 mm. At other hand, higher values of k mean more activation only at
higher altitudes, the concentrations are comparable to higher SS, typical of less hygroscopic and fine-mode anthro-
or even higher than those that existed prior to the onset pogenic aerosols (Hegg et al., 1991; Jefferson, 2010). The al-
of monsoon, indicating the strong prevalence of long- titude variation of k will have implications for aerosol–cloud
range transported dust over that region. interaction through hygroscopicity and size distribution of
aerosols (for example, Raga and Jonas, 1995).
5. Examining Fig. 7c, it is clearly seen that, at the lower The CCN spectra are shown in Fig. 8, where the panels
altitudes (below 2 km), the activation ratios are, in gen- from left to right show the spectra across the IGP from west
eral, higher than their corresponding values prior to on- to east; in each case panels a, b and c represent the condi-
set of monsoon across the entire IGP. Above 2 km, there tions just prior to the onset of the monsoon (Phase 1 of the
is a reversal in the activation ratio pattern, whereby the campaign) and panels d, e and f represent the active mon-
increasing trend prior to monsoon is replaced by a de- soon (Phase 3) conditions. The spectra are limited only up
creasing trend during the active phase. There are, of to SS = 0.4, as the SS range during measurements was re-
course, sub-regional differences with nearly steady val- stricted in the range 0.1 % to 0.4 %, which makes it possible
ues in the central IGP up to about 4 km, whereas AR to make high-resolution measurements even at higher alti-
decreases conspicuously in the eastern and western IGP tudes. The lines are regression fits to Eq. (1). The figure re-
regions. The very high values of AR close to the surface veals the following.
at BBR are due to the advection of marine aerosols by
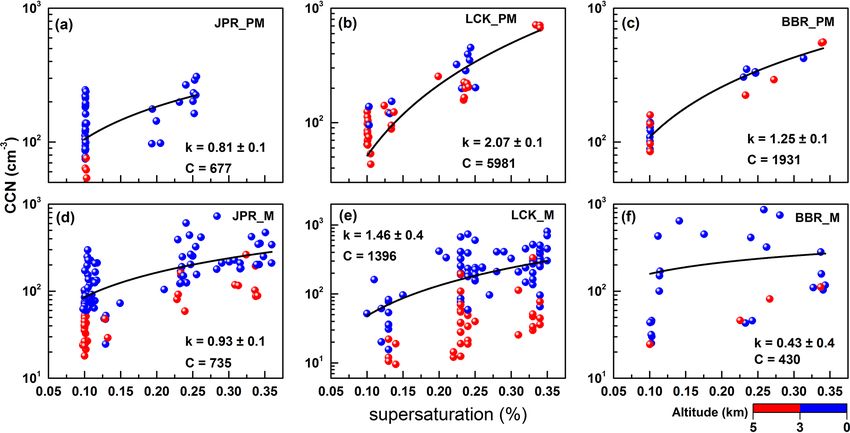
the monsoon winds. 1. In general, irrespective of the phase of the monsoon,
k values are highest in the central IGP (LCK), though
During Phase 3, there was an additional profiling on 7 July the values during the active phase of the monsoon are
in western India, over AMD, south of the western IGP. The lower than the values just prior to the onset of the
mean features, shown in Fig. 6d, are (a) a decrease in CN monsoon. This confirms the prevalence of submicron
concentrations up to about 2 km and a nearly steady profile aerosols with lower hygroscopicity over the central IGP
above up to about 5 km and (b) a monotonic decrease in CCN and is also in line with the high concentration of an-
concentration and AR from close to the surface to the highest thropogenic aerosols in that region (denser sources of
https://doi.org/10.5194/acp-21-8979-2021 Atmos. Chem. Phys., 21, 8979–8997, 20218990 M. R. Manoj et al.: CCN activation across the IGP
Figure 6. The number concentrations of the CN, CCN and AR over LCK, JPR, BBR and AMD are shown in (a), (b), (c) and (d) respectively.
The activation ratio represents the fraction of total aerosols which can be converted to CCN at 0.1 % supersaturation.
emissions). This is also supported by the high values of soon winds) also contributes to the reduction in k and
BC (∼ 2 µg m−3 ) that prevailed over this region, as has increase in hygroscopicity (Pringle et al., 2010) in the
been reported by Brooks et al. (2019a) from concurrent lower-altitude regions. However, the less hygroscopic
measurements and long-term observations from Naini- aerosols, advected by the continental air mass, prevailed
tal (Dumka et al., 2021). As the CCN concentrations at the higher altitudes (> 3 km), leading to a decrease in
at higher supersaturations are mainly attributed to accu- the activation efficiency and increase in k values, even
mulation and fine-mode particles (Lance et al., 2013), during the active phase of the monsoon.
the higher values of k over the central IGP clearly sug-
gest prevalence of an aerosol system dominated by fine- 3. Over the eastern and western IGP regions where, in gen-
mode particles during both phases of the monsoon. eral, coarser particles exist (mineral dust over the west-
ern IGP and marine aerosols over the eastern IGP), k
2. The significant reduction in k value over the central IGP values are in general lower than those seen in the central
during the active phase of the monsoon from its value IGP during both the phases of the monsoon activity, im-
prior to onset of monsoon is indicative of a change in plying that the aerosols over these regions are amenable
the aerosol composition brought about by wet removal to easier activation to CCN compared to those over the
(including BC, the concentration of which dropped to central IGP.
half its value during the pre-onset phase; Brooks et al.,
2019b). The advected moist marine air mass (from the 4. However, the responses of k to the distinct phases of
Bay of Bengal and Arabian Sea by the favourable mon- monsoon activity provide a contrasting picture over the
Atmos. Chem. Phys., 21, 8979–8997, 2021 https://doi.org/10.5194/acp-21-8979-2021M. R. Manoj et al.: CCN activation across the IGP 8991
Figure 7. The changes in the altitude variations of (a) CN concentrations, (b) CCN concentrations and (c) activation ratios during the
SWAAMI campaign. The solid lines represent the values during Phase 1 and the dotted lines show the values during Phase 3.
Figure 8. Spatial variation of CCN spectra across the IGP for the western (JPR), central (LCK) and eastern (BBR) IGP regions; (a), (b)
and (c) represent the scenarios prior to the onset of monsoon, while (d), (e) and (f) correspond to the active monsoon phase. The points are
individual measurements; blue colour stands for lower altitudes (< 3 km) and red colour represents the free tropospheric measurements (3 to
5 km altitudes). The lines are regression fit to Eq. (1).
western and eastern IGP regions. While there is a dra- to decrease in the size of the particles and increase in
matic reduction in k (from 1.25 to 0.43) in the eastern the fine-mode organic aerosols have been reported by
region, brought in by an increased abundance of marine Gunthe et al. (2009). It may be recalled that from inde-
aerosols here (advection from the Bay of Bengal, due pendent measurements, Jayachandran et al. (2020b) re-
east off BBR), over the semi-arid regions of the west- ported variations in the k values associated with changes
ern IGP, k has increased (though weakly) to 0.93 from in the size distribution of particles. However, this needs
its value (0.81) during the pre-onset phase. A change to be verified by more independent measurements.
in the aerosol size distribution is a plausible reason, the
coarser particles being removed by the precipitation in The FAAM measurements provided an opportunity to ex-
the active phase. Decreases in the hygroscopicity related amine the changes occurring in CCN characteristics in the
https://doi.org/10.5194/acp-21-8979-2021 Atmos. Chem. Phys., 21, 8979–8997, 20218992 M. R. Manoj et al.: CCN activation across the IGP Figure 9. Vertical variation of CCN spectra during the active phase of the monsoon. Panels (a) and (b) show the features in the free troposphere (3 to 5 km) and (c) and (d) represent the lower-altitude region (below 3 km). Panels on (a) and (c) represent the central IGP and panels (b) and (d) represent the western IGP. The measurements over BBR were carried out only on a single day, and the concentrations of CN and CCN sharply dropped above 3 km, limiting the availability of data above this altitude. Hence the change in k above and below 3 km is not included in the discussion. vertical across the IGP during the contrasting phases of the across the IGP. In both phases of the monsoon, the central monsoon. As such, we examined the CCN spectra for the free IGP with significant anthropogenic activities and associated troposphere (3 to 5 km altitude) separately from the spec- emissions (from industries, thermal power plants, automo- tra for the lower altitudes (less than 3 km). This also facil- biles, etc.) is less CCN-active, with k values lying in the itates examination of the lower-altitude features with those range (2.07 prior to onset of monsoon and 1.46 during the derived from the measurements aboard the Indian aircraft in active phase), while aerosols in the western and eastern IGP the pre-monsoon period, about a week to 10 d prior to Phase are more easily activated. Similar spatial distinctiveness has 1 of FAAM (Jayachandran et al., 2020a), which was confined also been reported by Jayachandran et al. (2020a) during the only to the lower atmosphere. The panels in Fig. 9 show the pre-monsoon period. results during the active phase of the monsoon, when there Another important finding emerging from our study is the was a clear difference in the k values in the upper atmo- decrease in k values with altitude during the active phase sphere from those in the lower regions. It clearly emerges of the monsoon, showing prevalence of more hygroscopic that over both the locations, aerosols in the upper atmosphere aerosols in the free troposphere. This is in sharp contrast (free troposphere) are more hygroscopic (with lower k val- to the results reported for the pre-monsoon period by Jay- ues) than those in the boundary layer, where the influence of achandran et al. (2020a), who found a significant increase in local emissions would be felt more. k values with altitude across the entire IGP, indicating a de- Vertical variations in the values of k have been examined crease in the hygroscopicity and/or increasing dominance of over the Indian region based on a few aircraft measurements fine and accumulation aerosols at higher altitudes. Low val- in recent years under different campaigns (e.g. Varghese et ues of k at higher altitudes as seen in our study are also in line al., 2016; Jayachandran et al., 2020a). However, our study with the low values reported by Dumka et al. (2015) from a is the first one focusing on the transformation of CCN char- Himalayan station at 2 km altitude based on measurements acteristics across the phase of the monsoon from prior to its during the RAWEX–GVAX campaign. Similar low values onset to the active phase that followed immediately. One im- of k were also reported by Roy et al. (2017) over the high- portant finding is the significant decrease in the k values (in- altitude (2.2 km) site Darjeeling located in the eastern part of crease in the CCN activity) of aerosols across the IGP during Himalayas in India. In the central peninsula, Jayachandran the active phase of the monsoon, from its values just prior to et al. (2020b) reported smaller k values for the continental the onset. Despite this feature, there is spatial distinctiveness air mass compared to marine air mass due to the presence Atmos. Chem. Phys., 21, 8979–8997, 2021 https://doi.org/10.5194/acp-21-8979-2021
M. R. Manoj et al.: CCN activation across the IGP                                                                               8993

of coarser particles in the continental air mass. The near-flat         east–west gradient (decreasing towards west) of mon-
CCN spectra around BBR are a consistent feature (Jayachan-              soon rainfall across the IGP, with the eastern and cen-
dran et al., 2020a) and appear to be typical of coastal regions,        tral IGP (and the surrounding regions) receiving much
where highly hygroscopic and coarse-mode marine aerosols                higher rainfall during the active period than the western
are available in large numbers (Jayachandran et al., 2017).             IGP, as can be seen from Fig. 2c and d. The higher CN
However, it should be kept in mind that the k values depend             concentration at higher altitudes over the western IGP
on the supersaturation range used for its estimation, and in            with values comparable to or even higher than those
our study it was limited to only 0.4 % in order to extend               existing prior to the onset of monsoon indicates the
the measurements to higher altitudes. Similar differences be-           strong prevalence of long-range transported dust from
tween the near-surface and below-cloud values of k were also            the west, aided by the synoptic circulation, even during
reported by Varghese et al. (2016) during the CAIPEEX, who              the active phase of the monsoon.
found higher k values (0.72) associated with polluted condi-
tions and low k values (0.25) during clean conditions.               – During the active phase of the monsoon, the boundary
                                                                       layer aerosols became more hygroscopic, while the hy-
                                                                       groscopicity of the aerosols above 3 km decreased. This
5    Summary and conclusion                                            appears to be caused by the change in the aerosol type
                                                                       after the monsoon has established. The strong mon-
Our study has brought out, perhaps for the first time over the         soonal winds replaced the continental air mass that pre-
Indian region, the contrasting features of CCN characteristics         vailed prior to the onset with moist marine air mass
over the IGP across the pre-onset phase to the active phase of         (Fig. 2a and b) at the lower altitudes (below 2 to 3 km).
the monsoon in the altitude region from near the surface to            These changes can be seen in the synoptic wind at
nearly 6 km. The salient features are the following.                   850 hPa. The more hygroscopic aerosols present in the
                                                                       marine air mass increased the activation efficiency and
    – Prior to the onset, elevated aerosol layers prevailed            reduced the spectral index k at the lower altitudes as
      throughout the IGP region, mostly above 2 km, where              seen in Fig. 9c and d as they changed the mixing state
      large increases in the number concentrations of CN and           of aerosols, as was observed by Brooks et al. (2019b).
      CCN were observed, though such sharp changes were                At higher altitudes, however, the mineral dust transport
      not seen in the AR, except in the central IGP. The               from the western arid regions persisted. These led to
      steeper aerosol spectra here with higher k values over           higher values of k at higher altitudes > ∼ 3 km during
      this region suggest the prevalence of the presence of            the active phase.
      submicron aerosols with lower hygroscopicity over the
                                                                     – Consequently, the supersaturation spectrum became
      central IGP. The highest CN concentrations above the
                                                                       flatter during the active phase of the monsoon, implying
      boundary layer were observed in the eastern IGP. The
                                                                       that aerosol will be activated at lower supersaturations.
      high wind speeds during the period provided ideal con-
                                                                       Though the local surface-based emissions (with lesser
      ditions for the transport of dust from the west and an-
                                                                       hygroscopic aerosols as seen prior to the onset of mon-
      thropogenic aerosols from the central IGP (lofted by
                                                                       soon) are still active, these get mixed with the marine air
      intense thermal convections) towards the eastern IGP.
                                                                       mass at lower altitudes, leading to increased hygroscop-
      There existed a west-to-east increasing gradient in CCN
                                                                       icity during the active phase. Vertical lofting of surface
      concentration even above the boundary layer prior to the
                                                                       emissions is weakened due to the weakening of the local
      onset of monsoon. The lower k values over the west-
                                                                       thermal convection with the advent of monsoon and fall
      ern IGP indicate the presence of coarser aerosols which
                                                                       in temperature (by more than 10◦ C on average across
      are more susceptible to CCN activation. In the central
                                                                       the IGP). As a result, the dust at higher altitudes is purer
      peninsula, the values of CCN remained lower than those
                                                                       in nature and retains its less hygroscopic nature.
      in the IGP at all altitudes. These observations resulted
      from the complex interplay of emission and advection
      of aerosols along with the ABL dynamics and chemistry        Data availability. Processed data can be downloaded from
      involving the precursor gases. There is an increase in the   https://doi.org/10.6084/m9.figshare.14744046 (Manoj et al., 2021).
      AR with altitude above 2 km. Compared to the freshly
      emitted aerosols in the boundary layer, the transported
      aerosols appear to be more hygroscopic.                      Supplement. The supplement related to this article is available on-
                                                                   line at: https://doi.org/10.5194/acp-21-8979-2021-supplement.
    – Strong reduction in the concentrations of CN and CCN
      throughout the IGP with an east-to-west decreasing gra-
      dient, being most remarkable in the eastern IGP and          Author contributions. SKS, KKM and HC together conceived of
      very weak over the western IGP. This is attributed to the    the experiment; MRM, JT and HC participated in the field cam-

https://doi.org/10.5194/acp-21-8979-2021                                             Atmos. Chem. Phys., 21, 8979–8997, 2021
You can also read