Diurnal regulation of photosynthetic light absorption, electron transport and carbon fixation in two contrasting oceanic environments - Biogeosciences
←
→
Page content transcription
If your browser does not render page correctly, please read the page content below
Biogeosciences, 16, 1381–1399, 2019
https://doi.org/10.5194/bg-16-1381-2019
© Author(s) 2019. This work is distributed under
the Creative Commons Attribution 4.0 License.

Diurnal regulation of photosynthetic light absorption,
electron transport and carbon fixation in two contrasting
oceanic environments
Nina Schuback1,2 and Philippe D. Tortell2,3
1 Swiss Polar Institute, École Polytechnique Fédérale de Lausanne, Lausanne, Switzerland
2 Department  of Earth, Ocean, and Atmospheric Sciences, University of British Columbia, Vancouver, Canada
3 Department of Botany, University of British Columbia, Vancouver, Canada

Correspondence: Nina Schuback (schuback.nina@gmail.com)

Received: 21 December 2018 – Discussion started: 17 January 2019
Revised: 4 March 2019 – Accepted: 20 March 2019 – Published: 4 April 2019

Abstract. Understanding the dynamics of marine phyto-              and decreased quantum efficiency (8C ) of carbon fixation
plankton productivity requires mechanistic insight into the        at the iron-limited station. In both coastal and offshore wa-
non-linear coupling of light absorption, photosynthetic elec-      ters, 8e,C and 8C correlated strongly to NPQ, albeit with
tron transport and carbon fixation in response to environmen-      a significantly different slope. We discuss the implications
tal variability. In the present study, we examined the variabil-   of our results for the interpretation of bio-optical data and
ity of phytoplankton light absorption characteristics, light-      the parameterization of numerical productivity models, both
dependent electron transport and 14 C-uptake rates over a 48 h     of which are vital tools in monitoring marine photosynthesis
period in the coastal subarctic north-east (NE) Pacific. We        over large temporal and spatial scales.
observed an intricately coordinated response of the differ-
ent components of the photosynthetic process to diurnal ir-
radiance cycles, which acted to maximize carbon fixation,
while simultaneously preventing damage by excess absorbed          1   Introduction
light energy. In particular, we found diurnal adjustments in
pigment ratios, excitation energy transfer to reaction cen-        It is well known that photosynthetic performance and light-
tre II (RCII), the capacity for non-photochemical quench-          harvesting characteristics of phytoplankton vary widely
ing (NPQ), and the light efficiency (α) and maximum rates          across environmental conditions and seasonal cycles (e.g.
(Pmax ) of RCII electron transport (ETRRCII ) and 14 C uptake.     Falkowski and Raven, 2007; Geider et al., 2001; Harris,
Comparison of these results from coastal waters to previ-          1986; Kirk, 1994). On physiological scales, these changes
ous observations in offshore waters of the subarctic NE Pa-        can be observed as rapid metabolic adjustments occurring
cific provides insight into the effects of iron limitation on      over seconds to hours, while on ecological scales (days to
the optimization of photosynthesis. Under iron-limited, low-       months) they are manifested as phytoplankton species suc-
biomass conditions, there was a significant reduction of iron-     cession. These physiological and ecological responses are ul-
rich photosynthetic units per chlorophyll a, which was partly      timately driven by the integrated growth environment expe-
offset by higher light absorption and electron transport per       rienced by phytoplankton and the need to optimize the con-
photosystem II (PSII). Iron deficiency limited the capacity        version of light energy to carbon biomass, while preventing
of phytoplankton to utilize peak midday irradiance for car-        damage from supersaturating light. The present study was
bon fixation and caused an upregulation of photoprotective         designed to improve the mechanistic understanding of the
mechanisms, including NPQ, and the decoupling of light ab-         entire photosynthetic process in marine phytoplankton and
sorption, electron transport and carbon fixation. Such decou-      its capacity to respond to environmental variability. Such in-
pling resulted in an increased electron requirement (8e,C )        formation is necessary to understand and predict ongoing

Published by Copernicus Publications on behalf of the European Geosciences Union.

1382                                   N. Schuback and P. D. Tortell: Diurnal regulation of photosynthetic light absorption

climate impacts associated with changes in nutrient supply,
temperature and irradiance levels on marine photosynthetic
carbon fixation (e.g. Behrenfeld et al., 2006, 2016; Hoegh-
Guldberg and Bruno, 2010; Taucher and Oschlies, 2011).
   The photosynthetic process comprises a chain of diverse
reactions, leading from light absorption via electron transport
to photosynthate (ATP and NADPH) production and carbon
fixation (Fig. 1). These reactions, operating on vastly differ-
ent timescales (e.g. Huner et al., 1998), are ultimately pow-
ered by solar energy and depend critically on nutrient avail-
ability. Variability in surface ocean nutrient concentrations
results from physical mixing and biological consumption act-
ing on scales of days to months. By comparison, variability
in light intensity occurs over a broader range of timescales,
with rapid transients induced by atmospheric variability (e.g.
cloud cover) and fine-scale mixing, superimposed on diel and
seasonal cycles. Importantly, while light energy is an abso-
lute requirement for the photosynthetic process, excess irra-
diance, even on short timescales, can lead to photodamage
and photoinhibition (Powles, 1984).
   To compensate for fluctuations in light availability, marine
phytoplankton have evolved extreme photo-physiological
plasticity, allowing cells to maximize light-harvesting capac-
ity at low irradiance, while minimizing photodamage under
high light levels. A better mechanistic understanding of the
scope and limits of such coordinated regulation within the          Figure 1. Schematic diagram of the photosynthetic process, high-
photosynthetic process is essential for the accurate modelling      lighting rates, variables and conversion factors measured or de-
of bottom-up controls on marine primary productivity and            rived during this study. (1) Light absorption: photosynthetically
its response to environmental change. Furthermore, mech-            available radiation (PAR, 400–700 nm) is absorbed by phytoplank-
anistic insight into environmental controls on the light use        ton (a ∗phy , m−2 mg Chl a −1 ). Total absorption by phytoplank-
                                                                    ton can be subdivided into absorption by photosynthetic pigments
efficiency of carbon fixation is crucial for the development
                                                                    (a ∗psp , m−2 mg Chl a −1 ) and photoprotective carotenoids (a ∗ppc ,
of algorithms estimating primary productivity from remotely
acquired optical data (Lee et al., 2015; Silsbe et al., 2016;       m−2 mg Chl a −1 ). The parameter a ∗psp , if specific for PSII (pho-
                                                                    tosystem II) only, can be further decomposed into values of the
Zoffoli et al., 2018).
                                                                    functional absorption cross section of each RCII (reaction centre
   In the present study, we examined diurnal variability in         II) in the dark-regulated state, i.e. not affected by NPQ (σPSII ,
the capacity of phytoplankton to use light energy for biomass       Å2 RCII−1 ) and the number of functional RCII per Chl a (nPSII ,
production in a productive coastal upwelling regime. High-          RCII Chl a −1 ). Both σPSII and nPSII can be adjusted to regulate
temporal-resolution measurements, conducted over a 48 h             the amount of excitation energy reaching RCII. The light energy
period, revealed coordinated changes in light absorption, en-       absorbed by the pigments of PSII can have three fates: photochem-
ergy dissipation, photosynthetic electron transport and 14 C        istry (ETRRCII ), dissipation as heat (including the upregulation of
uptake. Our results demonstrate strong variability in the sto-      NPQ) and re-emission as fluorescence (ChlF). Changes in ChlF can
ichiometry of various components of the photosynthetic pro-         be used to infer changes in the other two pathways. (2) Initial charge
cess, providing insight into phytoplankton metabolic accli-         separation in RCII (ETRRCII , mol e− mol RCII−1 s−1 ). (3) Elec-
mation potential in response to environmental fluctuation in        tron transport after initial charge separation in RCII ultimately leads
                                                                    to the generation of “photosynthate” ((4) ATP and NADPH), which
coastal waters. Comparison of these new results with pre-
                                                                    in turn can be used for carbon fixation ((5) C fixation, here mea-
vious observations in the iron-limited subarctic north-east         sured as 14 C uptake). The electron requirement of carbon fixation
(NE) Pacific (Schuback et al., 2016) allowed us to identify         8e,C (mol e− mol RCII−1 ) is the ratio of electrons displaced by the
distinct diurnal patterns in these contrasting environments,        initial charge separation in RCII to 14 C uptake. The photosynthetic
yielding insight into the effects of iron limitation on various     efficiency, 8C (mol C mol quanta−1 ), is the amount of 14 C fixed per
components of the photosynthetic process and their coupling         quanta absorbed. Under conditions when the rate of light absorption
over diurnal irradiance cycles. Most significantly, our data        and delivery to RCII surpasses the potential for carbon fixation or
demonstrate a limited capacity of iron-limited phytoplank-          reductant formation, both 8e,C and NPQ will increase to prevent
ton to buffer fluctuations in light availability, resulting in an   over-reduction of RCII. The magnitude of 8C , in turn, is dependent
increased need for photoprotection. This enhanced photopro-         on how much initially absorbed energy is dissipated as fluorescence
tection is achieved through alterations in pigment ratios and       (ChlF) and heat (including NPQ) as well as through processes de-
                                                                    coupling ETRRCII from 14 C uptake (reflected in 8e,C ).

Biogeosciences, 16, 1381–1399, 2019                                                        www.biogeosciences.net/16/1381/2019/
N. Schuback and P. D. Tortell: Diurnal regulation of photosynthetic light absorption 1383
phy) and particulate light absorption (4 h intervals). Sample
collection, handling and experimental protocols were iden-
tical to the methods used in Schuback et al. (2016). In the
following, we provide only brief details about sample anal-
ysis and rate measurements, with emphasis on approaches
that extend beyond the analysis of Schuback et al. (2016).
All measured variables and derived parameters are summa-
rized in Table 1.
In addition to the discrete sample measurements described
above, we acquired a number of additional datasets from var-
ious sensors connected to the ship’s underway water sup-
ply. All measurements and sensors used on board the R/V
Oceanus are summarized in Table S1.1 in the Supplement
(OCE17 data set). Seawater surface temperature and salin-
Figure 2. Map of the subarctic NE Pacific showing location of ity were measured by a thermosalinograph (SBE 45 and
OSP14, in offshore iron-limited waters, and OCE17, a coastal up- SBE 38 for salinity and temperature, respectively), while sur-
welling region. face PAR (400–700 nm) was continuously logged using a
Satlantic PAR sensor mounted on the ship’s superstructure.
We used a Soliense fast repetition rate fluorometer to con-
light absorption characteristics, an increased potential for tinuously measure photo-physiological parameters derived
heat dissipation of excess energy (NPQ) and decoupling of from single-turnover induction protocols (see Sect. 3.5). In
the different components of the photosynthetic process, lead- addition, we used the WetLabs ac-s to quantify light attenu-
ing to reduced light use efficiency. Based on our results, we ation and absorption (400–750 nm), following the protocols
discuss the correlation between photosynthetic light use effi- described in Burt et al. (2018).
ciency and NPQ, an optical signal amiable to high-resolution
acquisition by autonomous sensors. 2.2 Dataset 2
In a previous study (Schuback et al., 2016), we assessed vari-
2 Methods
ability and coupling of different components of the photosyn-
In the present study, we examined light-dependent diurnal thetic process in an iron-limited phytoplankton assemblage
variability in different components of the photosynthetic pro- at Ocean Station Papa in the subarctic north-east Pacific
cess in marine phytoplankton. We present new results from (50◦ N, 145◦ W, Fig. 2). During this earlier study, conducted
a 2017 research expedition in high-productivity coastal up- in June 2014, and hereafter referred to as OSP14, seawater
welling waters and compare these data to recently published samples collected from the vessel’s underway water supply
observations from the iron-limited waters of the subarctic Pa- (intake depth approx. 5 m) were used for photo-physiological
cific Ocean (Schuback et al., 2016). We first introduce the measurements by FRRF (3 h intervals), 14 C-uptake experi-
two datasets and then briefly describe the methods used to as- ments (3 h intervals), pigment analysis by HPLC (6 h inter-
sess each component of the photosynthetic process (Fig. 1), vals) and particulate light absorption (3 h intervals). All mea-
from light absorption to carbon fixation. surements taken are summarized in Table S1.2, and full de-
tails of sample handling, experimental protocols and instru-
2.1 Dataset 1 mentation can be found in Schuback et al. (2016). In several
instances, the dataset presented in Schuback et al. (2016) was
New field data were collected during a 48 h period from 19 reanalyzed, as described below.
to 21 August 2017 on board the R/V Oceanus in the subarctic
NE Pacific. During this period, the research vessel followed a 2.3 Absorption spectra
Lagrangian drifter equipped with a drogue sock at 5 m depth
in order to track mean surface layer flow. The drifter was Phytoplankton absorption spectra (aphy (λ)) were determined
deployed approximately 25 nautical miles off the coast of following the quantitative filter technique (QFT) of Mitchell
Oregon, USA (44.3◦ N, 124.4◦ W; Fig. 2). More information et al. (2000) with path length amplification estimates follow-
on the drifter study is available in Herr et al. (2019). ing Bricaud and Stramski (1990), as described in detail in
Seawater samples were collected from the ship’s underway Schuback et al. (2017). All absorption spectra were corrected
water supply (intake depth approx. 5 m) and used for photo- for an overestimation of absorption at short wavelengths fol-
physiological measurements by fast repetition rate fluorome- lowing the approach suggested by Letelier et al. (2017) and
try (FRRF; 2 h intervals) 14 C-uptake experiments, pigment described in Supplement S2. To determine chlorophyll a-
analysis by HPLC (high-performance liquid chromatogra- ∗ (λ), m2 mg Chl a −1 ), ab-
specific absorption spectra (aphy
www.biogeosciences.net/16/1381/2019/ Biogeosciences, 16, 1381–1399, 20191384 N. Schuback and P. D. Tortell: Diurnal regulation of photosynthetic light absorption
Table 1. List of parameters derived and discussed in the text.
Parameter Units Method
∗
aphy-QFT (λ) Phytoplankton absorption spectra m2 mg Chl a −1 QFT with correction following Letelier et al. (2017).
∗
axx-HPLC (λ) Absorption spectra (xx specifies phytoplank- m2 mg Chl a −1 HPLC spectral reconstruction with packaging correction.
ton, photosynthetic pigments or photoprotective
carotenoids)
∗
âxx Absorption coefficient m2 mg Chl a −1 Mean absorption 400–700 nm specific to flat white excitation
light.
a ∗xx Weighted absorption coefficient m2 mg Chl a −1 Mean absorption 400–700 nm weighted to spectral distribution
of in situ light.
σPSII Functional absorption cross section Å2 RCII−1 FRRF ST protocol during dark-regulated state, value specific to
λ of excitation source.
σPSII-IS Functional absorption cross section Å2 RCII−1 As above, value corrected to be specific to in situ light spectrum.
0
σPSII-IS Functional absorption cross section Å2 RCII−1 FRRF ST protocol during light-regulated state, value corrected
to in situ light spectrum.
Fv /Fm Quantum efficiency of initial charge separation No units FRRF ST protocol during dark-regulated state; (Fm − Fo )/Fm .
Fq0 /Fv0 (500) Fraction of RCII which remains open (QA oxi- No units 0 −
FRRF ST protocol during light-regulated state; (Fm
dized) at a background irradiance F 0 )/(Fm
0 − F 0 ).
o
of 500 µmol quanta m−2 s−1
NPQNSV Non-photochemical quenching at in situ light No units FRRF ST protocol during light-regulated state; Fo0 /(Fm
0 − F 0 ).
o
intensity at the time and depth of sampling
NPQNSV (500) Non-photochemical quenching for a reference No units As above.
light intensity of 500 µmol quanta m−2 s−1
1/nPSII Photosynthetic unit size of PSII mol Chl a mol RCII−1 Estimated from a ∗psp and σPSII-IS .
ETRRCII Rate of initial charge separation in RCII mol e− mol RCII−1 s−1 Calculated from FRRF ST protocol derived parameters as E ·
0
σPSII-IS · Fq0 /Fv0 .
ETRRCII − Pmax Maximum light-saturated rate mol e− mol RCII−1 s−1 As above, but maximum rate of ETR achieved during
light-response curve.
ETRRCII − α Light efficiency under light limitation mol e− mol RCII−1 s−1 As above, but initial slope of light-response ETR curve.
(µmol quanta m−2 s−1 )−1
14 C uptake Rate of carbon fixation mol C mol Chl a −1 s−1 2 h 14 C-uptake light-response curves measured at each time
point.
14 C-P Maximum light-saturated rate mol C mol Chl a −1 s−1 As above, but maximum rate of 14 C uptake achieved during
max
light-response curve.
14 C-α Light efficiency under light limitation mol C mol Chl a −1 s−1 As above, but initial slope of 14 C-uptake light-response curve.
(µmol quanta m−2 s−1 )−1
Ek Light saturation parameter µmol quanta m−2 s−1 Point of saturation during light-response curve (Pmax /α) of
ETR or 14 C uptake.
8e,C Electron requirement for carbon fixation mol e− mol C−1 Calculated from ETR and 14 C-uptake rates.
8C Quantum efficiency of carbon fixation mol C mol quanta−1 Calculated from light absorption and 14 C-uptake rates.
sorption values were normalized to corresponding HPLC- for reconstruction of phytoplankton light absorption spectra
derived [TChl a]. The Chl a-specific phytoplankton absorp- ∗ (λ)). This approach estimates absorption spectra spe-
(aphy
tion coefficient (400–700 nm) was calculated for a flat white cific to photosynthetic pigments (apsp ∗ (λ)) and photoprotec-
∗ ) and weighted to the spectrum of available
spectrum (âphy ∗
tive carotenoids (appc (λ)). Following the approach described
light in situ (a ∗phy ) as described in Babin et al. (1996). in Le et al. (2009) and Letelier et al. (2017), absorption spec-
tra were further corrected for pigment packaging effects us-
2.4 Pigment analysis and spectral reconstruction ing a wavelength-specific estimate of packaging developed
by Morel and Bricaud (1981), with a size parameter calcu-
Collection and analysis of HPLC pigment samples was per- lated from an empirical relationship to chlorophyll a con-
formed following the method of Pinckney (2013), as de- centration ([Chl a]) (Woźniak et al., 1999). As described in
scribed in detail in Schuback et al. (2016). Pigment concen- the Supplement (S2), we found good agreement between re-
trations determined by HPLC and weight-specific absorp-
tion spectra provided by Bidigare et al. (1990) were used
Biogeosciences, 16, 1381–1399, 2019 www.biogeosciences.net/16/1381/2019/N. Schuback and P. D. Tortell: Diurnal regulation of photosynthetic light absorption 1385
sults from the spectral reconstruction and QFT approaches 1/nPSII is obtained from FRRF-derived dark-regulated σPSII
(R 2 = 0.95, n = 20). (Å2 RCII−1 ) and photosynthetic pigment absorption spectra,
∗ (m2 mg Chl a −1 ), estimated using the pigment recon-
apsp
2.5 FRRF-derived photo-physiology struction approach.
σPSII
Single-turnover induction curves of Chl a fluorescence 1/nPSII = · 0.013453 (1)
(ChlF) yields were measured on a bench-top FRRF instru- a ∗psp
ment (Soliense Instruments), after acclimation of samples to
low light intensities (< 10 µmol quanta m−2 s−1 ) for 20 min. Here, both σPSII and a ∗psp are specific to the spectral distribu-
Blank correction, derivation of ChlF yields and parame- tion of the FRRF excitation LED. The factor 0.013453 con-
ters, estimation of electron transport in reaction centre II verts milligrams of Chl a to mol Chl a, Å2 to m2 , and RCII
(ETRRCII , mol e− mol RCII s−1 ) and fitting of ETRRCII light- to mol RCII, and it is assumed that 50 % of absorbed photons
response curves were performed as described in Schuback et go to PSII (e.g. Kromkamp and Forster, 2003). The error in-
al. (2016, 2017). We derived values of the maximum light- troduced by this assumption is difficult to assess, though it
saturated capacity of ETRRCII (ETRRCII − Pmax ), the light- should be dependent on species composition, and is unlikely
dependent increase in ETRRCII (ETRRCII − α), and rates for to be greater than 20 % (Suggett et al., 2004).
the in situ light intensity at the time and depth of sampling 14 C
2.7 uptake
(Table 1).
We derived values of the minimum and maximum ChlF Rates of 14 C uptake were measured using small volume
yields in the dark-regulated state (Fo , Fm ) and in each light- (20 mL), 2 h light-response curves in a custom-built photo-
regulated state of the light-response curve (F 0 , Fm0 ). The pa- synthetron. Full details of the experimental procedure, cal-
rameter Fo0 , which represents the minimum ChlF yield in the culation of rates and fitting of light-response curves can be
absence of photochemical quenching but presence of non- found in Schuback et al. (2016, 2017). As for light-response
photochemical quenching, was estimated following Oxbor- curves of ETRRCII , we derived values of the maximum light-
ough and Baker (1997). Chl a fluorescence yields were used saturated capacity of 14 C uptake (14 C-Pmax ) and the light-
to estimate the ChlF parameter Fv /Fm (= [Fm − Fo ]/Fm ); dependent increase in 14 C uptake (14 C-α). From these two
the maximum efficiency of absorbed light used for photo- parameters, we were able to derive 14 C-uptake rates for the
chemistry, Fq0 /Fm0 (= [Fm0 −F 0 ]/Fm0 ); the effective efficiency in situ light intensity at the time and depth of sampling (Ta-
of absorbed light being used for photochemistry; and Fq0 /Fv0 ble 1), using the exponential model of Webb et al. (1974).
(= [Fm0 − F 0 ]/[Fm0 − Fo0 ]), an estimate of the fraction of RCII Multiple studies have demonstrated that short-term 14 C-
in the ‘open’ state (Table 1). The functional absorption cross uptake experiments, as employed here, measure an interme-
section of RCII was derived in the dark-regulated (σPSII , diate quantity between gross and net production (Halsey and
Å RCII−1 ) and light-regulated state (σPSII 0 , Å RCII−1 ) and
Jones, 2015; Milligan et al., 2015; Pei and Laws, 2013). For
spectrally corrected to the spectral quality of in situ light fast-growing, nutrient-replete phytoplankton (OCE17 in this
(σPSII-IS ), as described below. Non-photochemical quench- study), a larger fraction of the initially fixed 14 C will be re-
ing was estimated as normalized Stern–Volmer quenching, tained in a transient C pool for longer, such that the measured
NPQNSV (= Fo0 /Fv0 ), for each light level of the light-response rate will be closer to gross productivity. For slow-growing,
curves (McKew et al., 2013). nutrient-limited phytoplankton (OSP14 in this study) the
We note that the bio-physical model we used to derive turnover time of this transient C pool is very fast, such that
photo-physiological parameters from FRRF measurements more of the initially fixed 14 C will be respired, and short
(Kolber and Falkowski, 1993; Kolber et al., 1998) is not incubation times will estimate rates closer to net productiv-
likely to be equally accurate for all phytoplankton species ity. It is therefore likely that our derived 14 C-uptake rates at
within mixed in situ assemblages. Similarly, the fully dark- OSP14 are underestimated (closer to a net rate) relative to
regulated state, necessary for the calculation of most ChlF OCE17 (closer to a gross rate). This complicates the com-
parameters, is difficult to achieve in mixed assemblages con- parison of absolute 14 C-uptake rates between the sites in the
sisting of species of varying NPQ mechanisms and capaci- present study but does not significantly change our conclu-
ties. As a result, the derived parameters represent best-guess sions regarding differences in the diel cycle of photosynthetic
average values for taxonomically diverse phytoplankton as- processes.
semblages.
2.8 Spectral correction and derivation of
2.6 Photosynthetic unit size of PSII stoichiometries
We estimated absolute values of the photosynthetic unit size The spectral distribution of light at 5 m depth (Eis (λ)) was
of PSII (1/nPSII , mol Chl a mol RCII−1 ) following the ap- estimated as described in Schuback et al. (2016, 2017). Prior
proach suggested by Suggett et al. (2004). In this approach, to curve fitting, absolute values of light intensity used for
www.biogeosciences.net/16/1381/2019/ Biogeosciences, 16, 1381–1399, 20191386 N. Schuback and P. D. Tortell: Diurnal regulation of photosynthetic light absorption
light-response curves of 14 C uptake and ETRRCII (ELED (λ)) region (OSP14). Based on this comparative analysis, we dis-
were corrected relative to the phytoplankton light absorption cuss the environmental controls on the regulation of the pho-
spectrum. tosynthetic process, the magnitude and variability of the elec-
P700 P700 tron requirement and quantum efficiency of carbon fixation
400 aphy (λ) ELED (λ) · 400 EIS (λ) (8e,C and 8C , respectively), and the potential to use NPQ
EIS = ELED · P700 P700 (2)
400 aphy (λ) EIS (λ) · 400 ELED (λ)
measurements as a proxy for these important parameters.
Here, aphy (λ) is the phytoplankton absorption spectrum de- 3.1 Photosynthetic components and their diurnal
rived from the QFT approach. Values of σPSII , which are spe- periodicity during OCE17
cific to the spectral distribution of excitation and background
light in the FRRF instrument (ELED (λ)), were corrected to Light absorption characteristics and PSII photo-physiology
the in situ spectral light distribution at the time and depth of for the 48 h diurnal cycle at OCE17 are summarized in Ta-
sampling (EIS (λ)) using the same approach. ble 2. During our intensive sampling period, Chl a biomass,
The electron requirement for carbon fixation derived from ac-s 676 nm absorption light height calibrated
(8e,C , mol e− mol C−1 , Fig. 1) was calculated by to HPLC [TChl a], remained relatively constant (1.08 ±
deriving Chl a-specific rates of electron transport 0.15 µg L−1 ). Derived values of 1/nPSII ranged from 284 to
from ETRRCII (mol e− mol RCII−1 s−1 ) and 1/nPSII 446 mol Chl a mol RCII−1 , which is within the range of val-
(mol Chl a mol RCII−1 ) and dividing these rates by Chl a- ues measured in nutrient-replete cultures and field assem-
specific rates of 14 C uptake (mol C mol Chl a −1 s−1 ). blages using the oxygen flash yield approach (e.g. Table 2
in Suggett et al., 2010). We observed no diurnal periodicity
ETRRCII /nPSII
8e,C = (3) in the derived values of 1/nPSII , indicating that the number
14 C uptake
of functional RCII was not reduced by severe photodamage
The minimum value of 8e,C , encountered during light during high midday irradiances (Table 2).
limitation, was calculated using α values of each rate. Phytoplankton absorption coefficients derived from QFT
∗ ) ranged from 0.012 to 0.017 m2 mg Chl a −1 . Weigh-
(âphy
The quantum efficiency of carbon fixation (8C , mol C mol
photon absorbed−1 , Fig. 1) was calculated from 14 C up- ing these estimates to the spectral distribution of in situ light
take (mg C mg Chl a −1 h−1 ) and the product of aphy ∗ (λ) (a ∗phy ) increased values by approximately 25 %. No clear di-
(m2 mg Chl a −1 ) and EIS (λ) (µmol quanta m−2 s−1 ) as urnal trend was observed in a ∗phy .
The use of HPLC-derived absorption spectra allowed us to
14 C uptake examine the contribution of photosynthetic and photoprotec-
8C = P700 · 0.023129. (4) tive pigments to total light absorption. The Chl a-specific ab-
∗
400 aphy (λ) EIS (λ) ∗ ) ranged
sorption coefficient of photosynthetic pigments (âpsp
The maximum photosynthetic efficiency, 8C-max , from 0.009 to 0.011 m2 mg Chl a −1 , accounting for approx-
which is achieved under light-limiting conditions, imately 75 % of total phytoplankton absorption. By compar-
was calculated from 14 C-α (mg C mg Chl a −1 h−1 ison, Chl a-specific absorption coefficients for photoprotec-
[µmol quanta m−2 s−1 ]−1 ) and a ∗phy (m2 mg Chl a −1 ) tive pigments, âppc∗ , were lower (approximately 25 % of total
14 C − α
absorption), ranging from 0.0024 to 0.0046 m2 mg Chl a −1 .
Both âpsp ∗ and â ∗ increased by approximately 20 % when
8C-max = ∗ · 0.023129. (5) ppc
aphy weighted to in situ light (a ∗psp and a ∗ppc ). We observed diurnal
variability in the relative contribution of these two pigment
The conversion factor converts hours to seconds, µmol to
classes to total absorption, with the relative contribution of
mol, and mg C to mol C.
photoprotective carotenoids increasing during daylight hours
Note that 8C represents the quantum efficiency of car-
(Fig. 3b).
bon fixation (mol C mol photon−1 ), while 8e,C is gener-
In addition to the observed changes in pigment ratios, we
ally defined as the electron requirement of carbon fixation
observed a notable diel cycle in the functional absorption
(mol e− mol C−1 ). 0
cross section, σPSII-IS , and non-photochemical quenching,
NPQNSV , derived for in situ light intensities (Table 2, Fig. 3c,
3 Results and discussion d). Diurnal variability in these two parameters reflects regu-
lation in the transfer of absorbed energy to RCII. The func-
In the following, we first describe the diurnal variability of tional absorption cross section exhibited a rapid decline fol-
the photosynthetic process during the OCE17 experiment, lowing the onset of daylight, reaching minimum values at
from light absorption, via electron transport to carbon fixa- noon before increasing back to night-time maxima (Fig. 3c).
tion (Fig. 1). We then compare the observed values and diur- NPQNSV showed the opposite trend, with maximum values
nal trends from this coastal upwelling regime to results ob- observed during midday, coincident with the minimum in
tained from a similar study in an iron-limited low-biomass 0
σPSII-IS (Fig. 3d). The strong inverse correlation (Pearson’s
Biogeosciences, 16, 1381–1399, 2019 www.biogeosciences.net/16/1381/2019/N. Schuback and P. D. Tortell: Diurnal regulation of photosynthetic light absorption 1387
Table 2. Light absorption characteristics and PSII photo-physiology (process 1 in Fig. 1) for the 48 h diurnal cycle at OCE17. Surface
PAR (400–700 nm, µmol quanta m−2 s−1 ) during each sampling point. Chlorophyll a-specific absorption coefficients for phytoplankton
(a ∗phy , m2 mg Chl a −1 ) and photosynthetic pigment (a ∗psp , m2 mg Chl a −1 ), estimated using the HPLC pigment reconstruction approach and
weighted to the spectral quality of in situ light. The functional absorption cross section of PSII, derived for the dark-regulated state (σPSII-IS ,
Å2 RCII−1 ) and specific to in situ light quantity at each sampling point (σPSII-IS
0 , Å2 RCII−1 ), both corrected to the spectral quality of in
situ light. Estimates of the photosynthetic unit size of PSII (1/nPSII , mol Chl a mol RCII−1 ). Fv /Fm , the maximum quantum efficiency of
charge separation in RCII. Fq0 /Fv0 (500), an estimate of the fraction of “open” reaction centres (QA oxidized) at a reference irradiance of
500 µmol quanta m−2 s−1 . NPQNSV , normalized Stern–Volmer quenching derived for in situ light intensity at the time and depth of sampling.
NPQNSV , normalized Stern–Volmer quenching derived at a reference irradiance of 500 µmol quanta m−2 s−1 . See methods section and table
1 for details on derivation of these parameters.
Local time Surface PAR a ∗phy a ∗psp σPSII-IS 0
σPSII-IS 1/nPSII Fv /Fm Fq0 /Fv0 (500) NPQNSV NPQNSV (500)
04:00 0 0.018 0.013 326 326 380 0.59 0.29 0.71 1.53
06:00 0 303 303 0.57 0.41 0.76 1.60
08:00 175 0.017 0.014 300 263 313 0.57 0.45 0.82 1.74
10:00 188 317 279 0.54 0.52 0.92 1.82
12:00 1054 0.019 0.01 325 223 446 0.49 0.57 1.5 1.89
14:00 1033 326 235 0.43 0.64 1.89 2.47
16:00 1125 0.021 0.012 318 228 399 0.4 0.67 2.2 2.77
18:00 1163 316 221 0.48 0.5 1.83 2.22
20:00 24 0.019 0.014 314 297 337 0.51 0.35 0.98 2.26
22:00 0 297 297 0.52 0.3 0.93 2.39
00:00 0 0.018 0.013 303 303 338 0.52 0.3 0.93 2.36
02:00 0 306 306 0.52 0.36 0.92 2.35
04:00 0 0.019 0.013 298 298 330 0.51 0.34 0.94 2.16
06:00 0 290 290 0.5 0.39 1.02 2.29
08:00 270 0.017 0.013 338
10:00 1107 322 216 0.47 0.67 1.73 2.19
12:00 1255 0.022 0.012 271 216 341 0.43 0.65 2.26 2.57
14:00 1431 271 195 0.35 0.73 2.63 2.87
16:00 1085 0.019 0.013 302 221 348 0.38 0.73 2.18 2.87
18:00 347 314 292 0.45 0.58 1.56 2.69
20:00 24 0.015 0.011 272 270 382 0.41 0.48 1.55 2.23
22:00 0
00:00 0 0.015 0.014 268 268 284 0.54 0.27 0.86 2.06
02:00 0 277 277 0.5 0.35 0.99 2.68
ρ = 0.87, p1388 N. Schuback and P. D. Tortell: Diurnal regulation of photosynthetic light absorption
Table 3. Light-response curve fit parameters for rates of charge separation in RCII (ETRRCII ) and 14 C uptake for the 48 h diurnal cycle at
OCE17. Units of ETRRCII are mol e− mol RCII−1 s−1 and units of 14 C uptake are g C g Chl a −1 h−1 . Pmax is the maximum rate at light
saturation, α is light efficiency of each rate under light limitation and Ek is the light saturation parameter (µmol quanta m−2 s−1 ). The errors
given are the 95 % confidence intervals for the fit parameter Pmax and α, as well as the propagated error for Ek . In situ (IS) represents
realized rates derived for in situ light intensities for the time and depth of sampling. 8e,C is the electron requirement for carbon fixation
(mol e− mol C−1 ), and 8C is the quantum efficiency of carbon fixation (mol C mol photon absorbed−1 ). The minimum value of 8e,C and
maximum value of 8C at each time point are theoretical values describing the acclimation state of the entire photosynthetic process. In situ
(IS) values are realized values of 8e,C and 8C derived for in situ light intensities at the time and depth of sampling.
Local time ETRRCII 14 C uptake 8e,C 8C
Pmax α Ek IS Pmax α Ek IS min IS max IS
04:00 295 ± 8 1.49 ± 0.01 198 ± 13 0 1.7 ± 1.1 0.06 ± 0.14 29 ± 70 0.0 3±8 0 0.08
06:00 412 ± 13 1.62 ± 0.01 253 ± 16 0
08:00 426 ± 17 1.79 ± 0.14 238 ± 21 120 2.2 ± 0.6 0.08 ± 0.09 27 ± 31 2.0 4±4 9 0.11 0.03
10:00 532 ± 12 1.94 ± 0.07 274 ± 12 142
12:00 623 ± 20 2.26 ± 0.13 276 ± 18 512 3.0 ± 0.3 0.08 ± 0.03 39 ± 16 3.0 3±1 19 0.09 0.01
14:00 725 ± 15 2.42 ± 0.08 299 ± 11 572
16:00 729 ± 16 2.35 ± 0.08 311 ± 12 585 3.5 ± 0.4 0.06 ± 0.02 62 ± 20 3.5 5±1 20 0.06 0.01
18:00 489 ± 12 2.07 ± 0.11 237 ± 13 435
20:00 340 ± 10 1.66 ± 0.09 204 ± 14 18 2.5 ± 0.3 0.06 ± 0.03 38 ± 18 0.6 4±2 4 0.08 0.07
22:00 237 ± 13 1.47 ± 0.19 162 ± 24 0
00:00 261 ± 13 1.29 ± 0.14 203 ± 24 0 1.2 ± 0.1 0.04 ± 0.02 29 ± 13 0.0 5±2 0 0.05
02:00 331 ± 23 1.24 ± 0.15 266 ± 38 0
04:00 321 ± 13 1.37 ± 0.11 235 ± 20 0 1.7 ± 0.2 0.08 ± 0.03 23 ± 10 0.0 3±1 0 0.09
06:00 345 ± 29 1.48 ± 0.24 234 ± 42 0
08:00 2.0 ± 0.4 0.06 ± 0.05 36 ± 29 1.9 0.08 0.02
10:00 807 ± 35 2.14 ± 0.12 378 ± 27 591
12:00 602 ± 21 1.75 ± 0.09 344 ± 21 485 3.2 ± 0.4 0.06 ± 0.03 51 ± 23 3.2 4±2 21 0.07 0.01
14:00 784 ± 23 2.14 ± 0.09 366 ± 18 649
16:00 884 ± 42 2.16 ± 0.13 410 ± 31 615 3.0 ± 0.3 0.04 ± 0.01 68 ± 20 3.0 7±2 28 0.05 0.01
18:00 579 ± 14 2.02 ± 0.08 286 ± 13 243
20:00 305 ± 15 1.39 ± 0.14 219 ± 24 15 2.0 ± 0.2 0.03 ± 0.01 72 ± 22 0.3 6±2 7 0.04 0.03
22:00
00:00 220 ± 8 1.37 ± 0.12 160 ± 15 0 1.2 ± 0.6 0.05 ± 0.08 27 ± 52 0.0 5±9 0 0.07
02:00 284 ± 21 1.30 ± 0.19 220 ± 36 0
imum values during high-irradiance midday periods. In situ meaning that 14 C uptake saturated at light intensities at which
light availability at the time and depth of sampling exceeded ETRRCII remained light-dependent (Fig. 4c, d; note different
the Ek for most of the day, meaning that ETRRCII at 5 m scales on the panels).
depth was not light-limited during a substantial portion of An increase in the electron requirement for carbon fixa-
the day (Fig. 4a, g; note different scales on the panels). tion (8e,C , mol e− mol C−1 ) is expected when 14 C uptake,
Maximum rates of 14 C uptake ranged from 1.17 to 3.54 but not ETR, is light-saturated. Under such conditions, addi-
with a mean of 2.27 g C g Chl a −1 h−1 . Based on the high- tional electrons from charge separation in RCII must be used
nutrient and biomass conditions at OCE17, we assume that for processes other than 14 C uptake (Fig. 1). As expected,
phytoplankton growth rate was relatively high, such that values of 8e,C derived for in situ light availability (Table 3,
these 2 h 14 C-uptake experiments estimated a rate close to Fig. 5b) showed a clear diurnal trend, closely following the
gross primary productivity (e.g. Halsey and Jones, 2015; Mil- diurnal change in light availability. Increased decoupling of
ligan et al., 2015). Values of the light-dependent increase in 14 C uptake and ETR
RCII under excess light (e.g. Corno et al.,
14 C uptake (α) ranged from 0.03 to 0.08 g C g Chl a −1 h−1 2006; Fujiki et al., 2007; Schuback et al., 2017; Zhu et al.,
(µmol quanta m−2 s−1 ), while the light-saturation parameter 2017) can be attributed to an upregulation of alternative elec-
Ek varied between 23 and 72 µmol quanta m−2 s−1 (Table 3, tron sinks necessary to alleviate backpressure along the elec-
Fig. 4d, f, h). Clear diurnal trends were apparent in the Pmax tron transport chain, once carbon fixation is light-saturated
of 14 C uptake (Fig. 4d); however, this trend was not observed (e.g. Niyogi, 2000).
for α, which decreased throughout each day (Fig. 4f). Values Figure 5 also shows diurnal trends in the quantum effi-
of Ek of ETRRCII were always higher than Ek of 14 C uptake, ciency of carbon fixation, 8C . This variable is influenced by
Biogeosciences, 16, 1381–1399, 2019 www.biogeosciences.net/16/1381/2019/N. Schuback and P. D. Tortell: Diurnal regulation of photosynthetic light absorption 1389
3.2 Comparison between OCE17 and OSP14
The light-dependent photosynthetic response is strongly
modified by environmental factors including temperature,
nutrient availability, average light intensity and light history
(e.g. Sakshaug et al., 1997). Micronutrient limitation, most
notably iron, has also been shown to exert a significant ef-
fect on light-dependent photosynthetic responses (Greene et
al., 1991, 1992; Roncel et al., 2016; Schuback et al., 2015).
Here, we examine potential iron-dependent effects by com-
paring absolute values and diurnal periodicity of components
of the photosynthetic process between the high-productivity
coastal waters of OCE17 and the iron-limited NE subarctic
Pacific (OSP14, Schuback et al., 2016). Such a comparison is
necessarily complicated by uncontrolled variability in a num-
ber of environmental and ecological factors, in addition to the
iron status of resident phytoplankton assemblages. Nonethe-
less, we argue below that a clear signature of iron-limited
physiology emerges from this comparison.
3.2.1 Comparison between environmental and
ecological conditions between sampling sites
Table 4 summarizes hydrographic and biological properties
of the two study sites. Temperature and salinity within the up-
per mixed layer were similar in both environments (11.5 ◦ C
and 32.6 PSU at OCE17, 10.4 ◦ C and 32.4 PSU at OSP14),
and the sites had well-defined mixed layers, with a depth of
∼ 11 m at OCE17 and ∼ 33 m at OSP14. Excess macronu-
trient concentrations were observed within the mixed layer
of both stations (Table 4). However, micronutrients, most
Figure 3. Diurnal variability in light absorption and energy transfer notably iron, were likely limiting phytoplankton growth at
in the light-harvesting antenna of PSII (Fig. 1, process 1) at the OSP14, thus accounting for the significantly lower [Chl a] at
OCE17 site. (a) PAR estimated for 5 m sampling depth. (b) Ratio this site (0.18 µg L−1 , as compared to 1.04 µg L−1 at OCE17,
of absorption by photoprotective carotenoids (a ∗ppc ) to absorption Table 4).
by photosynthetic pigment (a ∗psp ), where both values are derived As expected, iron limitation also affected the phytoplank-
from spectral reconstruction of HPLC pigment data. (b) Values of ton community structure. We derived an estimate of phy-
0
σPSII-IS , spectrally corrected to in situ spectral light quality, derived toplankton community structure using pigment-based size
from FRRF light-response curves at light levels corresponding to
classes (Claustre, 1994; Uitz et al., 2006; Vidussi et al.,
in situ light intensity. (c) Values of NPQNSV derived from FRRF
light-response curves at light levels corresponding to in situ light
2001). These estimates revealed that OCE17 was dominated
intensity at the time and depth of sampling. (d) Values of Fq0 /Fv0 by microphytoplakton (> 20 µm, ∼ 67 %), with ∼ 33 % of
derived from FRRF light-response curves at a reference background the phytoplankton assemblage attributable to the picophyto-
irradiance of 500 µmol quanta m−2 s−1 . plankton size class (0.2–2 µm). Based on the high concen-
tration of the pigment fucoxanthin, we assume that diatoms
dominated the microphytoplankton size class in this region.
the decoupling of electron transport and carbon fixation (i.e. Characteristic pigments for the nanophytoplankton size class
8e,C , Fig. 1) and additionally by variations in the fraction of (2–20 µm, e.g. cryptophytes, chromophytes and nanoflagel-
absorbed light energy allocated to photochemistry (Fig. 1). lates) were present in very low concentrations at the OCE17
Both the decoupling of electron transport from carbon fix- site, indicating a negligible contribution of this size to the
ation (8e,C , Fig. 5a) and the quantum efficiency of carbon phytoplankton assemblage. In contrast to the OCE17 site,
fixation (8C , Fig. 5b) showed a clear dependence on diurnal the phytoplankton assemblage at OSP14 was dominated by
variation in light availability. picophytoplankton (∼ 46 %), with an estimated contribution
of ∼ 29 % and ∼ 25 % for the nano and micro size classes,
respectively. The high concentration of zeaxanthin found
at OSP14 suggests a high proportion of cyanobacteria in
www.biogeosciences.net/16/1381/2019/ Biogeosciences, 16, 1381–1399, 20191390 N. Schuback and P. D. Tortell: Diurnal regulation of photosynthetic light absorption
Figure 4. Diurnal variability in light-response curve fit parameters for ETRRCII (left) and 14 C uptake (right) for the OCE17 site.(a) and
(b) show PAR at 5 m sampling depths. (c) and (d) show the maximum light-saturated capacity Pmax of each rate. (e) and (f) show the light
efficiency of each rate under light limitation, α. (g) and (h) show the light saturation parameter Ek of each rate. Note different scales on (a),
(b), (g) and (h).
Table 4. Comparison of environmental conditions at the offshore, iron-limited site OSP14 (17 June 2014) and the coastal, nutrient-rich site
OCE17 (21 August 2017). See text for details on derivation of each variable.
OSP14 OCE17
Lat ◦N 50.1 144.9
Long ◦W 44.3 124.4
sunrise (PDT) hh:mm 06:27 06:26
sunset (PDT) hh:mm 22:49 20:12
day length hh:mm 16:22 13:46
kd m−1 0.07 0.16
E0 mol quanta m−2 d−1 31.94 36.21
EmL mean mol quanta m−2 d−1 12.45 17.03
EmL median mol quanta m−2 d−2 10.1 15.0
E5 m mol quanta m−2 d−1 21.4 16.24
E5 m mean µmol quanta m−2 s−1 281 313
E5 m max µmol quanta m−2 s−1 802 661
temp ◦C 10.4 11.5
salinity PSU 32.4 32.6
MLD m 33 11
[NO3 + NO2 ] µM 9.1 8.6
[P] µM 0.98 0.8
[Si] µM 14.5 9.8
[TChl a] µg L−1 0.18 1.04
f_micro % 67 25
f_nano % 0 29
f_pico % 33 46
Biogeosciences, 16, 1381–1399, 2019 www.biogeosciences.net/16/1381/2019/N. Schuback and P. D. Tortell: Diurnal regulation of photosynthetic light absorption 1391
fect on the abundance and stoichiometry of its components
(e.g. Davey and Geider, 2001; Ivanov et al., 2000; Strzepek
and Harrison, 2004). Our data also clearly demonstrate this
effect. The mean Chl a-specific phytoplankton absorption
coefficient, a ∗phy (m2 mg Chl a −1 ), was 1.9-fold higher at
OSP14 (Fig. 6a). This result can be explained by the smaller
cell size and lower cellular [Chl a] expected in iron-limited
phytoplankton, both of which reduce the packaging effect
(Bricaud et al., 1995; Morel and Bricaud, 1981). We also ob-
served a greater contribution of photoprotective pigments to
light absorption at OSP14 (31 %) relative to OCE17 (22 %)
(Fig. 6a). As discussed below, this result can be explained
by the increased requirement for photoprotection under iron-
limited growth conditions.
We found that the number of (iron-rich) PSII per Chl a
(nPSII , mol RCII mol Chl a −1 ) at OSP14 was approximately
half of that observed at OCE17 (Fig. 6b). To partly compen-
sate for this reduction in RCII, the dark-regulated functional
absorption cross section (σPSII-IS , Å2 RCII−1 ) at OSP14 was
almost 3 times higher than at OCE17 (Fig. 6c). This physi-
Figure 5. The realized electron and photon requirements of carbon ological response to iron limitation has been frequently ob-
fixation over a 48 h diurnal cycle at the OCE17 site. Values of 8e,C served in previous studies (Boyd et al., 2000; Kolber et al.,
and 1/8C correspond to light conditions at the time and depth of 1994; Moore et al., 2007; Strzepek et al., 2012; Vassiliev et
sampling. Note that we present the photon requirement for carbon al., 1995).
fixation, 1/8C , instead of the photon efficiency of carbon fixation Increased light absorption and charge separation per RCII
(8C ), to facilitate better comparability with 8e,C . observed at OSP14 creates the potential for oversaturation
of the reaction centres and resulting photoinhibition. This,
in turn, increases the requirement for active energy dissipa-
the smallest size class, while the relatively high values of tion mechanisms. Indeed, we observed strong diurnal adjust-
0
190 BF and 190 HF are characteristic for prymnesiophytes and ments in σPSII-IS (Fig. 6e) and NPQNSV (Fig. 6f), caused by
pelagophytes. A summary of the HPLC pigment data is pro- active light-dependent regulation of excitation energy within
vided in Supplement S3. the pigment antenna. Importantly, the dynamic range of light-
0
regulated σPSII-IS and NPQNSV regulation over a diurnal cy-
Daylight hours at OSP14 were slightly longer than at
OCE17 (∼ 16 vs. 14 h, respectively), while daily integrated cle was significantly larger at OSP14 than at OCE17 (3-fold
incident photon dose (E0 ) was higher at OCE17 (36.21 vs. 1.5-fold at OCE17), despite similar light intensities at the
vs. 31.94 mol quanta m−2 ). However, given the greater water two sites (Fig. 6d–f). Our data therefore suggest an increased
column light extinction coefficient (kd , m−1 ) at the OCE17 need for active regulation of energy dissipation in response
site (1.6 m−1 ; vs. 0.7 m−1 ), light availability calculated for to daily irradiance cycles in iron-limited waters.
the 5 m sampling depth was similar for the two sites (Table 4, Iron limitation comprises the plasticity of the photosyn-
Fig. 6d). In our analysis, we used instantaneous in situ light thetic process and its ability to utilize high light intensities
intensities to derive photo-physiological parameters and 14 C- for carbon fixation. However, this does not lead to the re-
uptake rates from light-response curves. This approach is jus- duction in light absorption, as one might expect of a system
tified for a direct comparison of rates and diurnal patterns at less capable of processing light energy and more susceptible
a fixed depth. We note, however, that the deeper mixed layer to damage by excess absorbed light. Rather, we observed an
at OSP14 likely affected the photo-acclimation status of the increased capacity for dissipation of excess absorbed energy
phytoplankton assemblage, as a result of stronger variabil- through enhanced NPQ. Such a regulatory mechanism allows
ity in light, as well as lower mean and median mixed layer phytoplankton to maximize photosynthesis under low-light
irradiance levels. conditions, while preventing damage at high irradiances. Our
results support previous observations showing high levels of
3.2.2 Effects of iron limitation on photo-physiology and NPQ in a variety of iron-limited phytoplankton in laboratory
diurnal regulation of photosynthesis and field studies (e.g. Alderkamp et al., 2012; Allen et al.,
2008; Hoppe et al., 2013; Petrou et al., 2014; Schallenberg et
The photosynthetic electron transport chain has a high re- al., 2019; Schuback et al., 2015; Terauchi et al., 2010; Vas-
quirement for iron (Raven et al., 1999; Yruela, 2013), and siliev et al., 1995). A high NPQ signature may thus hold po-
iron limitation has been shown to exert a significant ef- tential as an optical indicator for phytoplankton physiology
www.biogeosciences.net/16/1381/2019/ Biogeosciences, 16, 1381–1399, 20191392 N. Schuback and P. D. Tortell: Diurnal regulation of photosynthetic light absorption
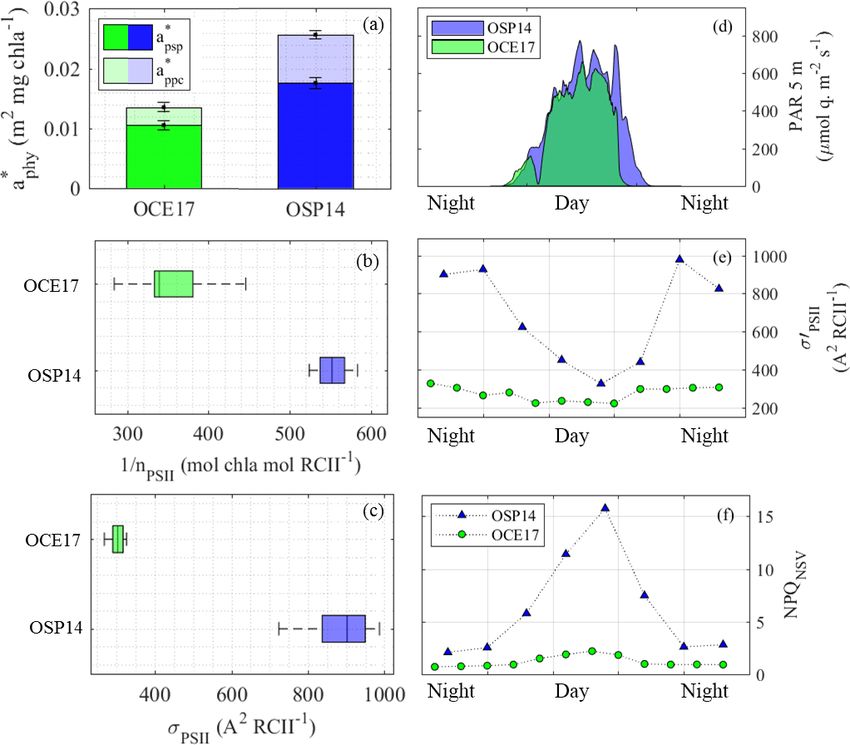
Figure 6. Comparison of light absorption characteristics at the OSP14 and OCE17 sampling sites. (a) The mean (400–700 nm) Chl a-specific
∗ , m2 mg Chl a −1 ), showing contribution of absorption by photosynthetic pigment (â ∗ ) and
absorption coefficient of phytoplankton (âphy psp
∗ ). (b) Photosynthetic unit size of PSII, 1/n −1
photoprotective carotenoids (âppc PSII (mol Chl a mol RCII ). (c) The functional absorption cross
2 −1
section of PSII, σPSII (Å RCII ), derived for the dark-regulated state at each time point. In (b) and (c) the central mark in each box is
the median, the edges of the box are the 25th and 75th percentiles, and the whiskers extend to the range of all data. No clear diurnal trend
in 1/nPSII or σPSII was detected at either station. (d) Values of PAR (400–700 nm, µmol quanta m−2 s−1 ) at 5 m sampling depth. (e) The
0
functional absorption cross section of PSII, σPSII (Å2 RCII−1 ), measured at the light-regulated state corresponding to in situ light intensity
at each time point. (f) Non-photochemical quenching, measured at the light-regulated state corresponding to in situ light intensity at each
time point.
and iron-nutrition status in the oceans (Schallenberg et al., ues of 8e,C at OSP14 may be even higher than those pre-
2019). sented in Fig. 7d.
Further evidence of active regulation of excitation en- As expected, values of 1/8C followed a pattern very simi-
ergy at the level of RCII can be seen in the high values lar to 8e,C , with high values observed under supersaturating
and strong light-dependent increase in ETRRCII observed light intensities, and this light-dependent effect enhanced un-
at OSP14 (Fig. 7b). The high midday rates of ETRRCII at der iron limitation (Fig. 7c).
OSP14 were not balanced by increased 14 C uptake (Fig. 7c)
and exceeded the maximum theoretical value for linear elec- 3.3 NPQ as optical signal
tron transport. As described by Schuback et al. (2015, 2016),
upregulation of alternative electron sinks, cyclic electron Our simultaneous measurements of light absorption, ETRPSII
transport, and charge recombination may all act to dissipate and 14 C uptake allowed us to calculate conversion factors be-
excess electrons and thereby prevent over-reduction of RCII. tween these rates and observe variability in the electron re-
These mechanisms are manifested in an increase in ETRRCII quirement, 8e,C (mol e− mol C−1 ), and quantum efficiency,
and can account for the diurnal variation in the electron re- 8C (mol C mol quanta absorbed−1 ), of carbon fixation. Es-
quirement of carbon fixation (8e,C , Fig. 7d), with peak val- timates of 8e,C are crucial to derive high-spatial-resolution
ues observed in the mid-afternoon. Given that our 14 C-uptake carbon-based productivity estimates from FRRF measure-
rates for OSP14 likely represent a lower bound (correspond- ments (e.g. Hughes et al., 2018b; Lawrenz et al., 2013), while
ing to NPP, as opposed to GPP for OCE17), the absolute val- the quantum efficiency of carbon fixation is a key param-
Biogeosciences, 16, 1381–1399, 2019 www.biogeosciences.net/16/1381/2019/N. Schuback and P. D. Tortell: Diurnal regulation of photosynthetic light absorption 1393
is an optical signal amiable to high-resolution acquisition by
autonomous sensors or remote sensing, which integrates the
effects of multiple interacting environmental variables influ-
encing photosynthetic energy conversion. As discussed in the
following section, this parameter may hold unexploited po-
tential to improve marine primary productivity estimates.
3.3.1 The electron requirement for carbon fixation,
8e,C
Numerous studies have aimed to quantify variability in 8e,C
in order to derive high-resolution, FRRF-based estimates of
phytoplankton productivity in carbon units (reviewed by e.g.
Hughes et al., 2018b; Lawrenz et al., 2013). These studies
have shown that 8e,C can vary widely, due to physiologi-
cal regulation on short timescales and taxonomic shifts on
longer temporal or larger spatial scales. In general, higher
values of 8e,C are found under conditions of high excitation
pressure at the level of RCII (high light and/or low nutrients).
Indeed, for both OCE17 and OSP14, maximum 8e,C was ob-
served during high-irradiance periods in the afternoon, and
8e,C , derived for in situ light availability, followed PAR lev-
els over the diurnal cycle (Fig. 7d). However, the diurnal
range of 8e,C differed between OCE17 andOSP14, with a
significantly larger range and midday maximum in 8e,C in
the iron-limited waters of OPS14 (Fig. 7d). This result sug-
gests an enhanced need to dissipate excess electron pressure
under iron-limiting conditions.
High excitation pressure also triggers the upregulation of
heat dissipation mechanisms in the pigment antenna (here es-
timated as NPQNSV ), and several studies have reported a cor-
relation between 8e,C and NPQNSV (Hughes et al., 2018a;
Schuback et al., 2015, 2016b, 2017a; Zhu et al., 2017). We
observed such a correlation at both of our sampling sites
(Fig. 8a), but the slope of the NPQNSV : 8e,C correlation
differed between the two sites (12.2 for OCE17 vs. 2.34
for OSP14; Fig. 8a). Several recent studies have similarly
documented variability in the relationship between 8e,C and
Figure 7. Comparison of diurnal trends observed at the OSP14 and
NPQNSV . For example, Hughes et al. (2018a) reported sea-
OCE17 sampling sites. (a) PAR estimated for 5 m depth. (b) Rates
of initial charge separation in individual RCII (ETRRCII ). (c) Rates
sonally dependent slopes between NPQNSV and 8e,C at a
of 14 C uptake. (d) The electron requirement for carbon fixation sampling site off the coast of Australia. In a previous study
(8e,C ). (e) The quantum requirement for carbon fixation (1/8C ). (Schuback et al., 2017), we observed a strong correlation be-
All rates and efficiencies correspond to in situ light availability at tween NPQNSV and 8e,C /nPSII in the upper mixed layer of
the time and depth of sampling. the Arctic Ocean but only very weak NPQNSV and no appar-
ent correlation with 8e,C /nPSII below the mixed layer.
Differences in experimental procedures and data analy-
eter in absorption-based phytoplankton primary productiv- sis make it impossible to directly compare the slopes of
ity models (Marra et al., 2007; Silsbe et al., 2016; Zoffoli NPQNSV − 8e,C /nPSII relationships between the different
et al., 2018). Determination of these parameters in the field studies. Nonetheless, some general patterns do emerge. A
is labour intensive, and it is therefore desirable to identify strong correlation between NPQNSV and 8e,C is likely to
proxies that can be autonomously monitored at high resolu- exist in all environments where phytoplankton must adapt
tion. Our results suggest that estimates of NPQ, here derived to fluctuations in excitation pressure at the level of RCII.
from FRRF measurements, may provide useful information Such conditions result, for example, from high and fluctu-
on both 8e,C and 8C . We argue, based on our results and ating light intensities, nutrient limitation and cold tempera-
previous work (Schuback et al., 2014, 2015, 2017), that NPQ tures. However, the substantial taxonomic variability in phy-
www.biogeosciences.net/16/1381/2019/ Biogeosciences, 16, 1381–1399, 2019You can also read


