Macroscale patterns of oceanic zooplankton composition and size structure
←
→
Page content transcription
If your browser does not render page correctly, please read the page content below
www.nature.com/scientificreports
OPEN Macroscale patterns of oceanic
zooplankton composition and size
structure
Manoela C. Brandão1,2,33*, Fabio Benedetti3,33*, Séverine Martini4,
Yawouvi Dodji Soviadan1, Jean‑Olivier Irisson1, Jean‑Baptiste Romagnan5, Amanda Elineau1,
Corinne Desnos1, Laëtitia Jalabert1, Andrea S. Freire6, Marc Picheral1, Lionel Guidi1,
Gabriel Gorsky1, Chris Bowler7,8, Lee Karp‑Boss9, Nicolas Henry8,10, Colomban de Vargas8,10,
Matthew B. Sullivan11, Tara Oceans Consortium Coordinators*, Lars Stemmann1,8 &
Fabien Lombard1,8,12
Ocean plankton comprise organisms from viruses to fish larvae that are fundamental to ecosystem
functioning and the provision of marine services such as fisheries and CO2 sequestration. The latter
services are partly governed by variations in plankton community composition and the expression of
traits such as body size at community-level. While community assembly has been thoroughly studied
for the smaller end of the plankton size spectrum, the larger end comprises ectotherms that are often
studied at the species, or group-level, rather than as communities. The body size of marine ectotherms
decreases with temperature, but controls on community-level traits remain elusive, hindering the
predictability of marine services provision. Here, we leverage Tara Oceans datasets to determine
how zooplankton community composition and size structure varies with latitude, temperature and
productivity-related covariates in the global surface ocean. Zooplankton abundance and median
size decreased towards warmer and less productive environments, as a result of changes in copepod
composition. However, some clades displayed the opposite relationships, which may be ascribed to
alternative feeding strategies. Given that climate models predict increasingly warmed and stratified
oceans, our findings suggest that zooplankton communities will shift towards smaller organisms
which might weaken their contribution to the biological carbon pump.
Body size has been defined as a “master trait” for plankton as it is a morphological characteristic shared by organ-
isms across taxonomy and that characterizes the functions performed by organisms in ecosystems1,2. It has a
paramount effect on growth, reproduction, feeding strategies and m ortality3. One of the oldest manifestations of
the biogeography of traits was proposed over 170 years ago, namely Bergmann’s rule, in which field observations
showed that larger species tend to be found at higher, colder latitudes4.
In the oceans, size is critical in determining trophic links in planktonic ecosystems and is thus a critical fac-
tor in regulating the efficiency of the biological carbon pump5. Body size is sensitive to changes in temperature
due to the thermal dependence of physiological processes6. The plankton is mainly composed of ectotherms
which are organisms that do not generate sufficient metabolic heat to elevate their body temperature, so their
metabolic processes depends on external t emperature7. Consequently, ectotherms grow more slowly and reach
1
Sorbonne Université, CNRS, Laboratoire d’Océanographie de Villefranche, 06230 Villefranche‑sur‑mer,
France. 2Ifremer, Centre Bretagne, Unité Dynamiques des Ecosystèmes Côtiers, 29280 Plouzané, France. 3ETH
Zürich, Institute of Biogeochemistry and Pollutant Dynamics, 8092 Zürich, Switzerland. 4Aix Marseille Univ.,
Université de Toulon, CNRS, IRD, MIO UM 110, 13288 Marseille, France. 5Ifremer, Centre Atlantique, Unité Ecologie
et Modèles Pour l’Halieutique, 44311 Nantes, France. 6Departamento de Ecologia e Zoologia, Universidade Federal
de Santa Catarina, Florianópolis 88010970, Brazil. 7Institut de Biologie de l’École Normale Supérieure (IBENS),
CNRS, INSERM, PSL Université Paris, 75005 Paris, France. 8Research Federation for the Study of Global Ocean
Systems Ecology and Evolution, FR2022/Tara Oceans GOSEE, 75016 Paris, France. 9School of Marine Sciences,
University of Maine, Orono 04469, USA. 10Sorbonne Université, CNRS, Station Biologique de Roscoff, AD2M, UMR
7144, 29680 Roscoff, France. 11Department of Microbiology and Civil, Environmental, and Geodetic Engineering,
The Ohio State University, Columbus 43214, USA. 12Institut Universitaire de France, 75231 Paris, France. 33These
authors contributed equally: Manoela C. Brandão and Fabio Benedetti. *List of authors and their affiliations appear
at the end of the paper. *email: manoelacb1@gmail.com; fabio.benedetti@usys.ethz.ch
Scientific Reports | (2021) 11:15714 | https://doi.org/10.1038/s41598-021-94615-5 1
Vol.:(0123456789)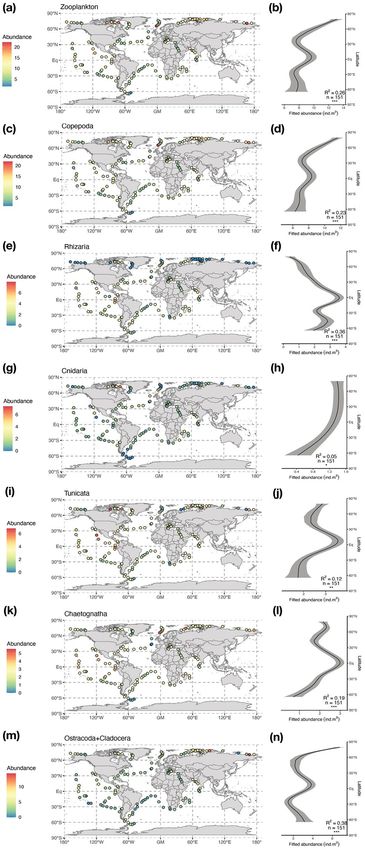
www.nature.com/scientificreports/
maturity at a larger body size in colder environments, which has long puzzled biologists because classic theories
of life-history evolution predict smaller adult sizes in environments delaying g rowth8. This pattern of body size
variation, known as the temperature-size rule ( TSR9), has been observed for a wide range of ectotherms, includ-
ing single-celled and multicellular species, invertebrates and v ertebrates8,10.
The processes underlying the inverse relationship between body size and temperature remain to be identified8.
Despite temperature playing a major role in shaping latitudinal variations in organism size, these patterns may
also rely on complex interactions between physical, chemical and biological factors. For instance, oxygen supply
plays a central role in determining the magnitude of ectothermic temperature-size responses, but it is hard to
disentangle the relative effects of oxygen and temperature from field data because these two variables are often
cean11,12.
strongly inter-related in the surface o
The major drivers of community-level plankton size structure (i.e. distribution of individual body size in
a given community) must be identified to effectively perform the ecological predictions that are progressively
requested in a context of climate change13. Global patterns of phytoplankton biomass, size and community
composition have been extensively studied thanks to satellite sensors that can detect phytoplankton pigments
from space. Satellite observations showed that larger phytoplankton dominate in upwelling regions and at high
latitudes where seasonal mixing regimes elicit higher macronutrients a vailability14,15. In contrast, zooplankton
size structure and composition remain challenging to study in situ and remain poorly constrained by observa-
tions. Body size variations of planktonic copepods have been derived from literature-based relationships and
have been found to display latitudinal patterns driven by variations in temperature and primary p roduction16.
Previous studies showed that temperature, rather than food availability, is the dominant variable in explaining
variations in copepod body s ize17. Body size can be altered experimentally in the l aboratory18,19. However, how
these species-specific-based and/or laboratory-based observations can be transferred to the size structure of
natural communities remains unclear. Knowing how size structure and abundance scale with changing abiotic
conditions at the community level is critical because these factors determine the production and the functioning
of the entire e cosystem20.
Here, we use plankton samples homogeneously collected at a macroscale during the Tara Oceans expeditions
(2009–2013) that were analyzed with the ZooScan imaging s ystem21 to document how zooplankton composition
(i.e., the abundance of different groups) and size structure at the community level varies with latitude, tempera-
ture, oxygen, macronutrient concentrations, phytoplankton biomass and other ecosystem properties. We develop
multivariate regression models to identify the underlying drivers of the global gradients of abundance and size
structure for more than 30 zooplankton clades.
Results
Latitudinal patterns of zooplankton abundance and composition. Based on the Zooscan analysis
of the WP2 (200 µm mesh), Bongo (300 µm mesh) and Régent (680 µm mesh) net samples, we found that most
of the 36 zooplankton groups retained displayed significant latitudinal patterns of abundance (Fig. 1). Here, we
focused on the significant patterns observed for total zooplankton and those broad groups displaying the high-
est contributions to total abundance (i.e., Copepoda, Rhizaria, Cnidaria, Tunicata, Chaetognatha and Ostracoda
plus Cladocera) based on WP2 net samples, as this net showed the broadest spatial coverage (Supplementary
Fig. S1). The spatial patterns were nonetheless consistent across all three nets and for all other groups (Sup-
plementary Fig. S2). Total zooplankton and its main constituting groups displayed non-monotonic gradients of
abundance with peaks in the Arctic and/or near the equator, and depressions in the tropical gyres. Zooplankton
abundance was highest in the Arctic (Fig. 1a,b), north of 60°N, and decreased progressively towards the equator.
A secondary peak was visible near the equator because of the relatively higher abundance in the eastern tropical
Pacific Ocean. Zooplankton abundance decreased towards the Southern Ocean, whose few sampled stations
displayed the lowest abundances.
Gradients in zooplankton abundance were clearly driven by copepods (Fig. 1c,d) as those dominated com-
munity composition (74% of total abundance in WP2 samples, 73% and 82% in the Bongo and Régent samples,
respectively; Supplementary Doc. S3). Copepods displayed the same abundance pattern as total zooplankton
but showed a slightly weaker tropical peak. The latter was actually more marked for other groups, especially the
Rhizaria (Fig. 1e,f) that showed very low abundances towards the poles. Gelatinous groups displayed contrasted
patterns. Latitudinal gradients were more marked for Tunicata (Fig. 1i,j) and Chaetognatha (Fig. 1k,l) than for
total zooplankton as their abundance levels observed in tropical upwelling regions compete with those observed
in the Arctic Ocean. Carnivorous jellyfishes (Cnidaria; Fig. 1g,h) displayed a weakly significant latitudinal pattern
that was driven by higher abundances in the western Arctic Ocean. Eumalacostraca (i.e., macrozooplankton such
as euphausiids, amphipods and decapods) also showed strong bimodal gradient but only in the Régent data, and
pteropods showed no distinguishable latitudinal abundance pattern (Supplementary Fig. S2).
Considering the dominance of copepods in terms of abundances in the communities sampled, we examined
the underlying latitudinal gradients in copepod order and family composition (Fig. 2). All nets (Fig. 2a–c) showed
an increase in the relative contribution of calanoid families, and especially the large-bodied Calanidae, to the
detriment of Cyclopoida (Oithonidae) and Poecilostomatoida (Oncaeidae, Corycaeidae and Sapphirinidae). The
relative abundances of copepod families were more evenly distributed in the tropics than in the poles, reflecting
gradients of decreasing copepod diversity with latitude (already documented by Ibarbalz et al.22). The variations
in copepod abundance were driven by the increase in calanoids (mainly Calanidae) and oithonids towards the
Arctic Ocean (Supplementary Fig. S2). Conversely, the following families showed clear abundance peaks in tropi-
cal regions (gyres or upwelling): Augaptilidae, Candaciidae, Corycaeidae, Eucalanidae, Euchaetidae, Oncaeidae,
Paracalanidae, Sapphirinidae and Temoridae. The WP2 data showed less marked variations (Fig. 2a) as this
net better samples the smaller Poecilostomatoida and Cyclopoida. The Régent net captured a lower quantity of
Scientific Reports | (2021) 11:15714 | https://doi.org/10.1038/s41598-021-94615-5 2
Vol:.(1234567890)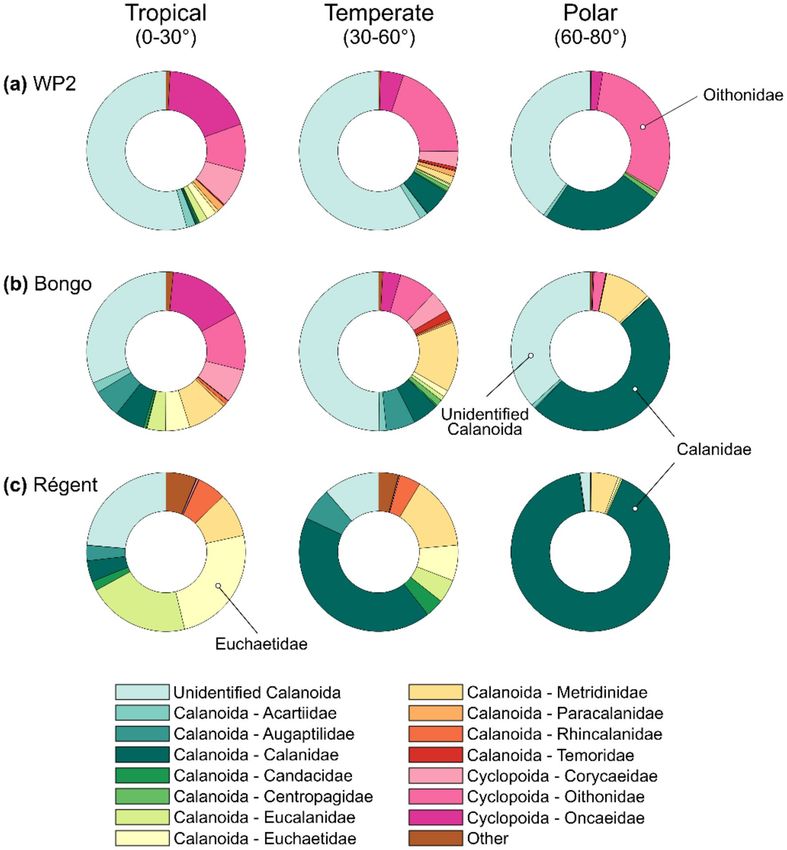
www.nature.com/scientificreports/
Figure 1. Maps and latitudinal patterns of the abundance (cubic-transformed ind m3) of (a,b) Total
zooplankton, (c,d) Copepoda, (e,f) Rhizaria, (g,h) Cnidaria, (i,j) Tunicata, (k,l) Chaetognatha, and (m,n)
Ostracoda + Cladocera observed in samples collected by the WP2 net. The solid curves on the right-hand side
plots illustrate the prediction from the Generalized Additive Model (GAM) fitting abundance against latitude.
The explanatory power of the GAM (adjusted R 2), the number of samples used and the significance of the
smooth term (p < 0.001 = ***, p < 0.01 = ***, p < 0.05 = *, p > 0.05 = ns) are reported on the plots. The grey ribbon
illustrates the standard error of the GAM prediction.
unidentified Calanoida (Fig. 2c) as the WP2 and Bongo nets (Fig. 2b) as the relatively coarse mesh of this net
is not able to retain smaller organisms, a pattern that was found across all zooplankton groups (Supplementary
Scientific Reports | (2021) 11:15714 | https://doi.org/10.1038/s41598-021-94615-5 3
Vol.:(0123456789)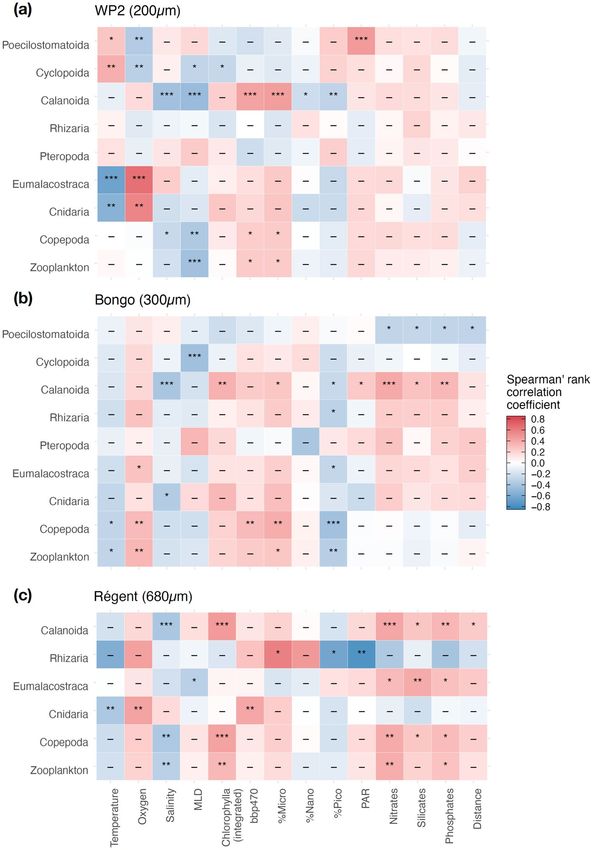
www.nature.com/scientificreports/
Figure 2. Variations in Copepoda community composition across the tropical (0–30°), temperate (30°–60°)
and polar (> 60°) latitudinal bands, depicted through the changes in relative abundances of the copepod Orders
(Calanoida, Cyclopoida and Poecilostomatoida) and Families sampled by the (a) Bongo net, (b) WP2 net, and
(c) Régent net. Taxa with lower than 1% are not shown. Unidentified categories correspond to those organisms
that could be assigned to an Order but not to a Family because of the limited resolution of the imaging system.
Doc. S4). The Bongo net showed lower zooplankton abundances than the WP2 net because of its coarser mesh
(1.5 times coarser), yet the global patterns in abundances between these two nets showed relatively high positive
correlations (rho > 0.4) for several of the main zooplankton groups (e.g. Total zooplankton, Copepoda, Rhizaria,
Eumalacostraca, and Ostracoda + Cladocera; Supplementary Doc. S4). Differences between the WP2 samples and
the Régent samples were more marked as the latter was equipped with a mesh 3.4 times larger than the former.
Only the abundances of total zooplankton, Cnidaria and Eumalacostraca showed relatively high correlations
to the WP2 data.
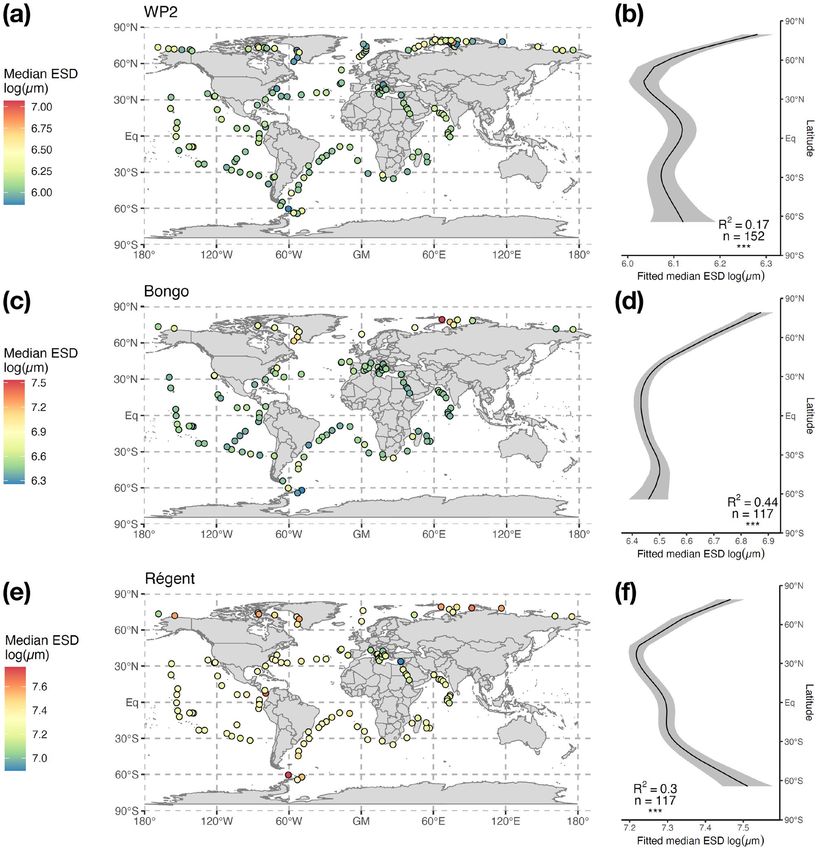
Latitudinal patterns of zooplankton size structure. Variations in median Equivalent Spherical
Diameter (ESD) were explored to examine latitudinal patterns in zooplankton size structure. The most con-
sistent cross-net patterns of median ESD were found for the total zooplankton community, which was driven
by the median ESD of calanoid copepods (Fig. 3; see Supplementary Fig. S5 for the other groups). The most
prominent feature of the copepod median ESD pattern was a sharp decline from the Arctic to the equator, which
was more marked in the Bongo (Fig. 3b) and Régent data (Fig. 3c) than in the WP2 (Fig. 3a). In the southern
hemisphere, patterns differed across nets: copepod median ESD sharply increased towards the Southern Ocean
Scientific Reports | (2021) 11:15714 | https://doi.org/10.1038/s41598-021-94615-5 4
Vol:.(1234567890)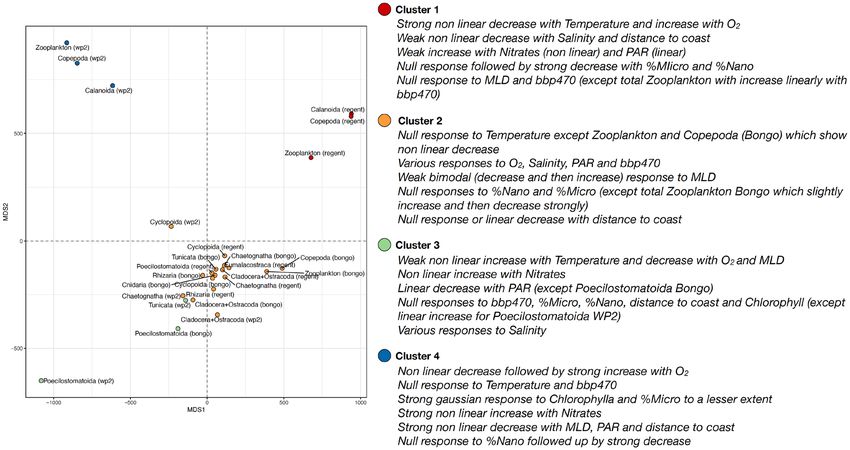
www.nature.com/scientificreports/

                                  Figure 3.  Maps and latitudinal patterns of the logged median Equivalent Spherical Diameter (ESD, µm)
                                  observed for Copepoda based on (a,b) WP2 samples (200 µm mesh), (c,d) Bongo samples (300 µm mesh) and
                                  (e,f) Régent samples (680 µm mesh). The major and minor axes of the best fitting ellipses were measured for
                                  each organism to estimate their ESD. Community-level size structure was determined through the median
                                  value of the ESD distribution at individual-level. The solid curves in the right-hand side plots illustrate the
                                  prediction from the Generalized Additive Model (GAM) fitting median ESD as a function of latitude. The
                                  explanatory power of the GAM (adjusted R2), the number of samples used and the significance of the smooth
                                  term (p < 0.001 = ***, p < 0.01 = ***, p < 0.05 = *, p > 0.05 = ns) are reported on the plots. The grey ribbon illustrates
                                  the standard error of the prediction. Only the stations where ESD was measured for at least 20 individuals were
                                  considered.

                                  according to the Régent net, whereas it showed no variations or a slight decrease according to the WP2 and
                                  Bongo samples, respectively. Considering the relatively poor coverage of the Southern Ocean by Tara Oceans,
                                  these latter patterns should be interpreted with caution. According to the WP2, the net that best sampled the
                                  smaller Poecilostomatoida, the latter showed median ESD patterns that were opposite to the Calanoida: their

Scientific Reports |   (2021) 11:15714 |                https://doi.org/10.1038/s41598-021-94615-5                                                         5

                                                                                                                                                     Vol.:(0123456789)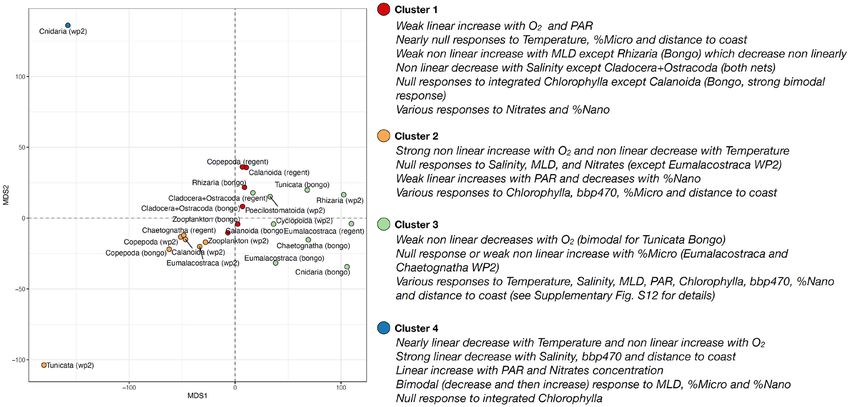
www.nature.com/scientificreports/
median ESD clearly increased from the poles to the tropics and peaked in the southern hemisphere around 30°S
(Supplementary Fig. S5).
Contrary to abundances, a secondary tropical peak in median ESD was not observed for zooplankton (Sup-
plementary Fig. S5). Abundance and median ESD were significantly positively correlated for total zooplankton
in the WP2 and Régent data, and for the Copepoda and Calanoida in all nets (Supplementary Table S6).
Among non-copepod groups, the Cnidaria also showed a sharp decrease in median ESD from the Arctic
Ocean to the equator in both WP2 and Régent samples (Supplementary Fig. S5). The median ESD of Rhizaria
followed the opposite pattern according to the WP2 and Bongo samples as it peaked around 40°N and decreased
towards lower latitudes. Our approach did not detect clear latitudinal gradients in median ESD for most of the
other zooplankton groups (Supplementary Table S7), either because of insufficient observations or because
median ESD is not controlled by factors that vary latitudinally. Therefore, we examined the potential environ-
mental drivers of median ESD variations to help us explain why size structure estimates display less marked
latitudinal patterns.
Relationships with environmental covariates. The strength of the linear covariance between the
groups’ abundance, median ESD and environmental covariates was examined through non parametric cor-
relation coefficients (Fig. 4; Supplementary Fig. S8). The median ESD of most zooplankton groups displayed
similar significant correlation patterns across nets: the median ESD of total zooplankton, Copepoda, Cala-
noida, Cnidaria and Eumalacostraca decreased with temperature, salinity and picophytoplankton (%Pico), but
increased weakly with oxygen, chlorophyll a, macronutrient concentrations, microphytoplankton (%Micro) and
the intensity of particles backscattering (bbp470). Total zooplankton median ESD decreased significantly with
Mixed Layer Depth (MLD) only in the WP2 samples (Fig. 4a), a pattern driven by the Calanoida. The median
ESD of the Poecilostomatoida increased with temperature, salinity, %Pico and Photosynthetically Active Radia-
tion (PAR). We also found PAR to be the main covariate associated with a lower median ESD of Rhizaria accord-
ing to the Régent data (Fig. 4c). The Rhizaria showed less significant correlations but differed from the main
pattern as their median ESD slightly increased with %Micro and decreases with %Pico and PAR. The only groups
displaying a similar pattern were the Tunicata and to a lesser extent the Chaetognatha (Supplementary Fig. S8).
Zooplankton abundances displayed stronger correlation patterns than median ESD (Supplementary Fig. S8)
and seem to be more strongly linked to productivity-related covariates (i.e. chlorophyll a, bbp470, %Micro,
%Pico and macronutrient concentrations) than physical ones (i.e. temperature and oxygen). The abundance of
most groups increased significantly with chlorophyll a, macronutrient concentrations, %Micro and bbp47, but
decreased with %Pico. The abundance of some groups presented correlation patterns that departed from the
abovementioned trend as they increased with temperature and decreased with oxygen (Supplementary Fig. S8):
Rhizaria (WP2 and Régent), Eumalacostraca (Régent mainly), Chaetognatha and Poecilostomatoida (WP2 only).
Nonlinear relationships between median ESD estimates and a subset of environmental covariates were
explored through Generalized Additive Models (GAMs, see “Methods”) to identify and rank the drivers of
size structure of zooplankton groups (Table 1). In total, 102 GAMs were fitted to median ESD estimates (n = 40
for the WP2 and Bongo data, n = 22 for the Régent; Supplementary Table S7). These GAMs showed reasonable
to good fit as the median (± IQR) %Dev was 53.6% (± 33.4%). The GAMs based on the Régent observations
displayed significantly higher %Dev (57.9% ± 24.7%) than those based on the WP2 (55.4% ± 31.3%) and Bongo
(48.7% ± 34.9%) (Kruskal–Wallis test, C hi2 = 143.6, p < 2.2 × 10⁻¹⁶). The GAMs including temperature did not
show higher %Dev than those including oxygen except with the Régent data but the difference was found to be
marginal (Chi2 = 19.1, p = 1.3 × 10⁻⁵). Substantial variations in smooth term rankings were visible across nets
and zooplankton groups (Table 1; Supplementary Fig. S9). Oxygen and temperature were the two top-ranking
significant covariates, while the remaining eight covariates displayed lower median ranks (Supplementary Fig. S9)
though some (e.g., salinity, MLD, chlorophyll a or %Micro) emerged as key covariates for modelling the median
ESD of some groups (Table 1).
The smoothing curves of the GAMs displaying a %Dev > 50% were extracted to cluster the groups based on
the shape of these curves along with each covariate (see Methods). This way, we were able to identify clusters of
zooplankton groups displaying similar functional responses to the covariates selected (i.e. zooplankton groups
sharing similar drivers of global median ESD), and we could project their similarities in a two dimensional
metric dimensional scaling (MDS) space to summarize the main trends. Four clusters were identified (Table 1
and Fig. 5). Cluster 1 comprised six models with a mix of Bongo and Régent observations: the median ESD of
total zooplankton and the Calanoida (Bongo), Copepoda and Calanoida (Régent) and Cladocera + Ostracoda
(Bongo). This cluster gathered groups whose median ESD showed linear increases with oxygen and PAR and
no response to temperature (Supplementary Fig. S10). The smoothing curves modelled for the other covariates
were either non-significant or highly variable between groups (Fig. 5; Supplementary Fig. S10). The smoothing
curves of the zooplankton WP2 data and its main driving group (i.e. calanoid copepods) were clustered with
the Tunicata and Eumalacostraca (WP2), the Copepoda (Bongo) and the Chaetognatha (Régent). Contrary to
cluster 1, these groups displayed non linear decreases in median ESD with temperature and relatively strong
non liner increases with oxygen. Cluster 3 was the largest as it comprised nine models from various groups and
nets: Cyclopoida, Poecilostomatoida and the Rhizaria (all WP2), the Eumalacostraca (Bongo and Régent), the
Cladocera + Ostracoda (Régent) and the gelatinous zooplankton (Cnidaria, Tunicata and Chaetognatha) sam-
pled with the Bongo net. Because of the cluster’s larger size, the response curves modelled for these groups were
diverse. The main trend was an overall non linear decrease in median ESD with oxygen concentration. Finally,
Cluster 4 gathered a single model (Cnidaria, WP2) meaning it displayed an original combination of modelled
response curves. The median ESD of the Cnidaria (WP2) decreased linearly with temperature and increased non
Scientific Reports | (2021) 11:15714 | https://doi.org/10.1038/s41598-021-94615-5 6
Vol:.(1234567890)www.nature.com/scientificreports/
Figure 4. Heatmaps of the Spearman’s rank correlation coefficients computed between the size structure
(i.e., logged median Equivalent Spherical Diameter; ESD) of the main zooplankton groups and the selected
14 covariates depicting the environmental conditions in the global surface ocean as sampled by (a) WP2 net
(200 µm mesh), (b) Bongo net (300 µm mesh) and (c) Régent net (680 µm). The significance of the Spearman’s
rank correlation tests are reported in the tiles (p < 0.001 = ***, p < 0.01 = ***, p < 0.05 = *, p > 0.05 = ns). Only the
zooplankton groups displaying significant correlation coefficients for more than one environmental covariate
in at least one net parameter are shown (see Supplementary Fig. S8 for all groups). Only the stations where ESD
was measured for at least 20 individuals of a group were considered when computing the correlation coefficients.
Distance stands for distance to coast (in km).
Scientific Reports | (2021) 11:15714 | https://doi.org/10.1038/s41598-021-94615-5 7
Vol.:(0123456789)www.nature.com/scientificreports/
Cluster (PAM based on DTW)—only for
Group (median ESD) Net First term Deviance explained (%) Significant smooth terms (p < 0.05) models with Deviance > 40%
Oxygen 0.59 Oxygen, %Micro, %Nano
WP2 2
Temperature 0.54 Temperature, %Micro, %Nano
Oxygen 0.71 Oxygen, Nitrates, bbp470, %Nano
Zooplankton Bongo Temperature, Salinity, Nitrates, bbp470, %Micro, 1
Temperature 0.72
%Nano
Oxygen 0.23 Salinity, bbp470 –
Régent
Temperature 0.23 Salinity, bbp470, %Micro –
Oxygen 0.68 Oxygen, PAR, %Micro
WP2 2
Temperature 0.64 Temperature %Micro
Oxygen 0.89 Oxygen, %Micro, %Nano, Distance to coast
Copepoda Bongo 2
Temperature 0.88 Temperature, %Micro, %Nano, Distance to coast
Oxygen 0.59 Oxygen, Salinity, MLD, PAR
Régent 1
Temperature 0.57 Temperature, Salinity, MLD, PAR
Oxygen, Salinity, MLD, PAR, Nitrates, bbp470,
Oxygen 0.76
Chlorophylla, %Nano
WP2 3
Temperature, Salinity, MLD, PAR, Nitrates,
Rhizaria Temperature 0.77
bbp470, Chlorophylla, %Nano
Oxygen 0.47 Oxygen, Salinity
Bongo 1
Temperature 0.51 Temperature, Salinity
Oxygen, Salinity, MLD, PAR, bbp470, %Micro,
Oxygen 0.98
%Nano, Distance to coast
WP2 4
Temperature, MLD, Nitrates, %Micro, Distance
Temperature 0.96
to coast
PAR, Nitrates, Chlorophylla, %Nano, Distance
Cnidaria Oxygen 0.77
to coast
Bongo 3
PAR, Nitrates, Chlorophylla, %Nano, Distance
Temperature 0.78
to coast
Oxygen 0.22 Oxygen –
Régent
Temperature 0.20 – –
Oxygen 0.64 Oxygen, %Micro, %Nano
WP2 2
Temperature 0.59 Temperature, %Micro, %Nano
Tunicata
Oxygen 0.71 Oxygen, Salinity, MLD, PAR, %Nano
Bongo 3
Temperature 0.70 Temperature, PAR, %Nano
Oxygen 0.79 Oxygen, Nitrates
WP2 Temperature, Nitrates, bbp470, Chlorophylla, 2
Temperature 0.87
%Nano, Distance to coast
Oxygen 0.54 PAR, Nitrates, %Micro, %Nano
Eumalacostraca Bongo 3
Temperature 0.53 Temperature, PAR, Nitrates, %Nano
Oxygen 0.71 Oxygen, MLD, PAR, Chlorophylla, %Nano
Régent Temperature, MLD, PAR, bbp470, Chlorophylla, 3
Temperature 0.75
%Nano
Oxygen 0.33 Nitrates, bbp470 –
Pteropoda WP2
Temperature 0.33 Nitrates, bbp470 –
Oxygen 0.32 PAR, Chlorophylla –
WP2
Temperature 0.32 PAR, Chlorophylla –
Oxygen 0.68 Salinity, bbp470, %Micro, %Nano
Chaetognatha Bongo 3
Temperature 0.68 Salinity, bbp470, %Micro, %Nano
Oxygen 0.54 Oxygen, Chlorophylla
Régent 2
Temperature 0.60 Temperature, Chlorophylla
Oxygen 0.73 Oxygen, PAR, Chlorophylla, %Micro
WP2 2
Temperature 0.73 Temperature, %Micro
Oxygen 0.50 Oxygen, Nitrates, Chlorophylla
Calanoida Bongo 1
Temperature 0.39 Temperature, Salinity, PAR
Oxygen 0.60 Oxygen, Salinity, MLD, PAR, Nitrates
Régent 1
Temperature 0.58 Temperature, Salinity, MLD, PAR
Oxygen 0.51 MLD, PAR, Distance to coast
WP2 3
Temperature 0.51 MLD, PAR, Distance to coast
Poecilostomatoida
Oxygen 0.39 Oxygen, %Micro, Distance to coast –
Bongo
Temperature 0.35 Temperature, %Micro, Distance to coast –
Continued
Scientific Reports | (2021) 11:15714 | https://doi.org/10.1038/s41598-021-94615-5 8
Vol:.(1234567890)www.nature.com/scientificreports/
Cluster (PAM based on DTW)—only for
Group (median ESD) Net First term Deviance explained (%) Significant smooth terms (p < 0.05) models with Deviance > 40%
Oxygen 0.41 Oxygen, MLD
WP2 3
Temperature 0.41 Temperature, MLD
Cyclopoida
Oxygen 0.32 MLD –
Bongo
Temperature 0.32 MLD –
Table 1. Summary of the explanatory power (i.e. % of deviance explained) of the Generalized Additive
Models (GAMs) fit to model the global gradients log-transformed Equivalent Spherical Diameter (ESD, µm)
as a function of the ten environmental covariates selected, measured for the zooplankton groups and for the
plankton nets that sampled enough stations (> 30) and enough individuals (> 20) per group. The significant
covariates (p < 0.05) were ranked based on their relative F statistic and are shown. The GAMs displaying a % of
deviance explained > 40% were clustered into four groups based on the shape of the smoothing curves of each
covariate (Fig. S10).
Figure 5. Two dimensional metric dimensional scaling (MDS) plot illustrating the similarity between the
responses of the groups’ median ESD to the environmental covariates selected. The smoothing curves from the
Generalized Additive Models (GAMs) modelling the global gradients in log-transformed median Equivalent
Spherical Diameter (ESD, µm) of the zooplankton groups (estimated for various plankton nets) as a function of
ten environmental covariates and displaying a deviance explained > 40%. The smoothing curves were combined
into a multivariate data series to compute Dynamic Time Warping (DTW) distances and perform partitioning
around medoids (PAM) clustering. This way the GAMs were clustered into four clusters representing
combinations of zooplankton groups and plankton nets that exhibit similar median ESD-covariate relationships.
linearly with oxygen, and it departed from the other groups because of its strong linear decreases with salinity,
particles backscattering and distance to coast (Supplementary Fig. S10).
The same approach was applied to investigate the drivers of global abundance patterns (Table 2; Supple-
mentary Table S7). The median ESD-based GAMs display higher %Dev than the abundance-based GAMs
(40.7% ± 27.3%; Chi2 = 1697.3.6, p < 2.2 × 10⁻¹⁶) whatever the net, despite the higher number of observations
available for modelling abundances (i.e. 200 GAMs were fitted based on the transformed abundance data). The
WP2-based GAMs presented slightly higher %Dev (Chi2 = 62.9, p = 2.2 × 10⁻¹⁴) than the ones based on the Régent
and Bongo observations. The GAMs including temperature displayed a lower %Dev than those including oxy-
gen (37.9 ± 25.8 versus 42.5 ± 27.2; Chi2 = 144.1, p < 2.2 × 10⁻¹⁶). Contrary to median ESD-GAMs, the inclusion
of oxygen instead of temperature substantially increased the %Dev for total zooplankton and Calanoida, and
Cyclopoida (Table 2), implying that oxygen could be a stronger driver than temperature for zooplankton abun-
dances. Again, the smooth terms associated with temperature and oxygen emerged as the two most significant
terms (Table 2; Supplementary Fig. S9). Substantial variations in smooth terms rankings were observed across
nets and groups again (Table 2). However, NO2NO3 concentrations, chlorophyll a and MLD showed higher
significance rankings than in the ESD-based GAMs (Table 2), implying these covariates were more critical to
include when modelling zooplankton abundance than size structure.
Again, the smooth curves of the GAMs displaying a %Dev > 40% were extracted to cluster the zooplankton
groups based on the similarity of their responses to the covariates. Four clusters could be identified and these are
Scientific Reports | (2021) 11:15714 | https://doi.org/10.1038/s41598-021-94615-5 9
Vol.:(0123456789)www.nature.com/scientificreports/
Cluster (PAM based on DTW)—only for
Group (abundance) Net First term Deviance explained (%) Significant smooth terms (p < 0.05) models with Deviance > 40%
Oxygen 0.67 Oxygen, MLD, Nitrates, Chlorophylla, %Nano
WP2 4
Temperature 0.26 Salinity, MLD, Chlorophylla
Oxygen 0.40 Oxygen, bbp470, %Micro
Bongo 2
Zooplankton Temperature 0.38 Temperature, bbp470, %Micro
Oxygen, PAR, Nitrates, Chlorophylla, %Nano,
Oxygen 0.87
Régent Distance to coast 1
Temperature 0.81 Temperature, Nitrates, %Micro, %Nano
Oxygen 0.67 Oxygen, MLD, Nitrates, Chlorophylla, %Nano
WP2 4
Temperature 0.30 MLD, Chlorophylla
Oxygen 0.41 Oxygen, bbp470, %Micro
Bongo 2
Copepoda Temperature 0.38 Temperature, bbp470, %Micro
Oxygen, Nitrates, Chlorophylla, %Micro, %Nano,
Oxygen 0.88
Distance to coast
Régent 1
Temperature, Nitrates, %Micro, %Nano, Distance
Temperature 0.86
to coast
Oxygen 0.32 Oxygen, Salinity, Nitrates –
WP2
Temperature 0.32 Temperature, Salinity, Nitrates –
Oxygen 0.49 Oxygen, Nitrates
Rhizaria Bongo 2
Temperature 0.48 Nitrates
Oxygen 0.44 Oxygen, MLD, PAR, bbp470, %Micro
Régent 2
Temperature 0.44 Temperature, PAR, bbp470, %Micro
Oxygen 0.35 Nitrates, Chlorophylla –
WP2
Temperature 0.35 Nitrates, Chlorophylla –
Oxygen 0.41 Salinity, MLD, Nitrates
Cnidaria Bongo 2
Temperature 0.39 Salinity, MLD, Nitrates
Oxygen 0.21 Distance to coast –
Régent
Temperature 0.18 Distance to coast –
Oxygen 0.40 Oxygen, MLD, Nitrates
WP2 3
Temperature 0.38 Temperature, Nitrates
Oxygen 0.57 MLD, Nitrates, Chlorophylla
Tunicata Bongo 2
Temperature 0.57 MLD, Nitrates, Chlorophylla
Oxygen 0.22 – –
Régent
Temperature 0.22 – –
Oxygen 0.16 Salinity –
WP2
Temperature 0.16 Salinity –
Oxygen 0.24 Nitrates –
Eumalacostraca Bongo
Temperature 0.24 Nitrates –
Oxygen 0.42 Chlorophylla, %Micro, Distance to coast
Régent 2
Temperature 0.41 Temperature, Chlorophylla
Oxygen 0.33 Oxygen, Nitrates, Chlorophylla, Distance to coast –
WP2 Temperature, Nitrates, Chlorophylla, Distance
Temperature 0.32 –
to coast
Pteropoda Oxygen 0.29 Oxygen, Chlorophylla –
Bongo
Temperature 0.28 Temperature, Chlorophylla –
Oxygen 0.29 %Micro –
Régent
Temperature 0.27 %Micro –
Oxygen 0.52 Oxygen, PAR, Chlorophylla, %Nano
WP2 2
Temperature 0.19 Nitrates, %Nano
Oxygen 0.46 Oxygen, Nitrates, bbp470
Bongo 2
Chaetognatha Temperature 0.27 bbp470, Chlorophylla
Nitrates, bbp470, Chlorophylla, %Micro, Distance
Oxygen 0.43
to coast
Régent 2
Nitrates, bbp470, Chlorophylla, %Micro, Distance
Temperature 0.44
to coast
Continued
Scientific Reports | (2021) 11:15714 | https://doi.org/10.1038/s41598-021-94615-5 10
Vol:.(1234567890)www.nature.com/scientificreports/
Cluster (PAM based on DTW)—only for
Group (abundance) Net First term Deviance explained (%) Significant smooth terms (p < 0.05) models with Deviance > 40%
Oxygen 0.69 Oxygen, MLD, Chlorophylla, %Micro, %Nano
WP2 4
Temperature 0.35 MLD, Chlorophylla, %Micro
Oxygen 0.38 Oxygen, bbp470, %Micro –
Bongo
Calanoida Temperature 0.37 Temperature, bbp470, %Micro –
Oxygen, Nitrates, Chlorophylla, %Micro, %Nano,
Oxygen 0.88
Régent Distance to coast 1
Temperature 0.86 Temperature, Nitrates, %Micro, %Nano
Oxygen 0.53 Oxygen, MLD, Nitrates, Chlorophylla
WP2 3
Temperature 0.51 Temperature, MLD, PAR, Nitrates, Chlorophylla
Oxygen 0.65 Oxygen, Salinity, MLD, Nitrates
Poecilostomatoida Bongo 3
Temperature 0.66 Temperature, Salinity, MLD, Nitrates
Oxygen 0.60 Oxygen, PAR, Distance to coast
Régent 2
Temperature 0.65 Temperature, Salinity, PAR, Distance to coast
Oxygen, MLD, PAR, bbp470, Chlorophylla,
Oxygen 0.64
WP2 %Nano 2
Temperature 0.49 MLD, PAR
Cyclopoida Oxygen 0.45 Salinity, Nitrates, %Nano
Bongo 2
Temperature 0.64 Salinity, Nitrates, bbp470, %Nano
Oxygen 0.62 Oxygen, PAR, %Micro
Régent 2
Temperature 0.31 bbp470
Table 2. Summary of the explanatory power (i.e. % of deviance explained) of the Generalized Additive
Models (GAMs) fit to model the global gradients cubic-transformed abundance (ind m 3) as a function of
the ten environmental covariates selected, measured for the zooplankton groups and for the plankton nets
that sampled enough stations (> 30) and enough individuals (> 20) per group. The significant covariates
(p < 0.05) were ranked based on their relative F statistic and are shown. The GAMs displaying a % of deviance
explained > 40% were clustered into five groups based on the shape of the smoothing curves of each covariate
(Fig. S11).
more clearly delineated than those based on the median ESD response curves as evidenced by the relatively more
scaterred positions of the groups in MDS space (Fig. 6; Supplementary Fig. S11). Cluster 1 gathered the smooth
curves modelled for total zooplankton, Copepoda and Calanoida based on the Régent data. Their abundances
showed: (i) a strong nonlinear decrease with temperature and increase with oxygen concentration, (ii) non linear
decreases with salinity and distance to coast, and (iii) slight increases with PAR and NO2NO3 concentrations.
Cluster 2 was the largest clusters as it gathered the responses of diverse range of 17 different models based on
various groups and nets. This implies that a relative broad ranges of abundances responses within this cluster
(Supplementary Fig. S11), which is why it holds a relatively neutral central position in the MDS space (Fig. 6). Yet,
nearly all groups showed null responses in abundances to temperature, except total zooplankton and Copepoda
(Bongo data) which showed non linear decreases. Cluster 3 was also a smaller cluster composed of three models
only: the Poecilostomatoida (both WP2 and Bongo) and the Tunicata (WP2 only). Contrary to clusters 1 and 2,
these were characterized by non linear increases in abundance with temperature and NO2NO3 concentrations
but decreases with oxygen and MLD. This is why these groups are positioned on the negative side of MDS2.
Finally, cluster 4 also comprised the same groups as cluster 1 but based on the WP2 abundance estimates instead
of the Régent ones. Contrary to the latter, total zooplankton and calanoid copepods here showed null response to
temperature. Yet, similar to cluster 1, they also showed strong abundances increase with oxygen concentrations,
which explains why both clusters are positioned on the positive side of MDS2 (Fig. 6). This cluster also displayed
original strong gaussian responses to chlorophyll a and particles backscattering.
Discussion
Here, we provide a homogeneous dataset of zooplankton composition and size structure based on individual
measurements of body size and document the shape of the relationships between community-level size structure
and key environmental drivers on a macroecological scale. We find that zooplankton communities exhibit larger
median size and abundance towards the poles and towards the tropical upwelling regions sampled (Supplemen-
tary Doc. S12), a pattern that is largely driven by copepods. The higher contributions of the large-bodied grazing
Calanidae relative to the smaller omnivorous-carnivorous Cyclopoida and Poecilostomatoida (i.e. Oithonidae,
Oncaeidae and Corycaeidae) drives the latitudinal increase in median size towards the poles, in addition to
the observed negative scaling of body length with temperature which is in line with the T SR9,17. Indeed, our
inspection of size structure-environment relationships show that zooplankton size decreases with temperature,
salinity, MLD and the contribution of the smallest phytoplankton cells to phytoplankton biomass. Conversely, it
increases with concentrations of oxygen, macronutrients, phytoplankton biomass and the contribution of large
phytoplankton (e.g. diatoms) to said biomass. Using species body size estimates from the literature, Brun et al.16
also found copepod mean body size to increase towards the poles, a pattern driven by a negative temperature-size
Scientific Reports | (2021) 11:15714 | https://doi.org/10.1038/s41598-021-94615-5 11
Vol.:(0123456789)www.nature.com/scientificreports/
Figure 6. Two dimensional metric dimensional scaling (MDS) plot illustrating the similarity between the
responses of the groups’ abundances to the environmental covariates selected. The smoothing curves from
the Generalized Additive Models (GAMs) modelling the global gradients in cubic-transformed abundances
(ind m3) of the zooplankton groups (estimated for various plankton nets) as a function of ten environmental
covariates and displaying a deviance explained > 40%. Smoothing curves span a 1–100 scale spanning the
range of the covariates measured values. The smoothing curves were combined into a multivariate data series
to compute Dynamic Time Warping (DTW) distances and perform partitioning around medoids (PAM)
clustering. This way the GAMs were clustered into four clusters that represent combinations of zooplankton
groups and plankton nets that exhibit similar abundance-covariate relationships.
relationship and a positive relationship between phytoplankton size and zooplankton size. Several explanations
for increased body size towards the poles have been proposed, varying from the stimulating effects of temperature
on ectotherm metabolism, the synergetic effects of the presence of larger prey, and the availability of oxygen
as a function of temperature2,23. For metazoan ectotherms, the effects of temperature on somatic and gonad
growth seem to be the most robust e xplanation24. The negative correlation between community-level size and
temperature might stem from the positive effect of temperature on growth rates. At low latitudes, metabolic
rates are higher and life cycles become shorter for the various species composing the community. Consequently
community-level median size decreases because of warmer temperatures, and the body surface area to body
volume ratio increases25. Despite decades of research, it is still uncertain whether the temperature-size rule is an
adaptive response to temperature‐related physiological processes (i.e. enzyme activity) or ecological constraints
(e.g. food availability, predation and other mortality causes), or a response to biological constraints operating at
cellular level such as oxygen supply12. Arthropods and rotifers have been shown to reach smaller body sizes in
poorly oxygenated w aters23,26. The potential role of oxygen concentration on the onset of maturation and on size
variations remains unclear and is mostly masked by its strong collinearity with surface t emperature12.
In contrast to the decrease in zooplankton median size and abundance observed towards oligotrophic sub-
tropical gyres, an increase was observed near the equatorial regions where the upwelling regime creates colder
and more productive conditions. We found the main groups of the zooplankton communities sampled in the
eastern boundary upwellings (EBUS) to display significantly higher abundances relative to communities sampled
at comparable latitudes (Supplementary Doc. S12). However, the EBUS do not strongly affect the modelled lati-
tudinal patterns of zooplankton abundance (Supplementary Doc. S12). Yet, the effects of the upwelling regime
are more marked for abundances than for size structure. This could be linked to the way we estimated median
ESD (e.g. aggregated distributions of body size estimated from particles images) compared to the more direct and
less uncertain counting of abundance, or to the fact that fewer stations are available when studying size structure
gradients (see “Methods”). Overall, abundances showed correlation patterns with the environmental covariates
that are quite similar to median size for the total zooplankton community and its major constituting groups
(Calanoida, but also Tunicata, Chaetognatha and Cnidaria). This suggests that zooplankton size structure and
abundance respond similarly to environmental drivers. Temperature and/or oxygen concentration were found to
be the two main covariates in explaining the quasi-global variations of both size structure and abundance. How-
ever, we found productivity-related covariates (i.e. Chlorophyll a, NO2NO3 concentration, bbp470 and %Micro)
to be of higher importance for modelling zooplankton groups abundance. This is an important factor to consider
when defining the key parameters to model either zooplankton size or biomass. Our results support the view
Scientific Reports | (2021) 11:15714 | https://doi.org/10.1038/s41598-021-94615-5 12
Vol:.(1234567890)www.nature.com/scientificreports/
that temperature and oxygen are more important parameters than the available biomass of photoautotrophs in
driving zooplankton community-level and individual-level body size variations12,17 and therefore in controlling
the expression of physiological traits that scale allometrically (e.g., growth, respiration).
Yet, the abundance of some zooplankton groups (Poecilostomatoida, Rhizaria and Chaetognatha, and Pter-
opoda to a lesser extent) show correlation patterns that are opposite to the general copepod-driven trend:
their abundance actually increases with temperature, PAR and the contribution of small phytoplankton. These
groups rely on feeding strategies that are very different from the filter-feeding C alanoida16,27,28. For instance, the
Poecilostomatoida are cruise-feeding and ambush-feeding copepods displaying a broad omnivorous-carnivorous
diet27–29. Similarly, chaetognaths are carnivorous ambush-feeders and many pteropods deploy mucus nets for
uxes27. Therefore, these groups are able to thrive in large phytoplankton-depleted
feeding passively on particles fl
conditions where mortality-risks and competition for food are more pronounced than in phytoplankton-replete
conditions thanks to their alternative feeding strategies. If their growth and reproduction are less dependent
on phytoplankton biomass while still promoted in warmer conditions, then spatial patterns driven by positive
temperature-abundance relationships can emerge. Our results further support the view that zooplankton is not
a homogeneous category whose size structure and biomass dynamics can be adequately modelled through a
few size c lasses1,30.
We found the median ESD of large protists (i.e. Rhizaria, which mainly comprise Foraminifera and Radiolaria)
to increase linearly with %Micro but to decrease with %Pico, PAR, and chlorophyll a to a lesser extent. Contrary
to Copepoda, temperature and oxygen did not show clear effect on the size structure of those large protists as their
median ESD shows contrasted responses to these two covariates across nets. Large protists abundance increased
significantly with temperature, macronutrients concentrations, bbp470 and decreased significantly with oxygen.
Therefore, the drivers underlying the patterns of Rhizaria abundance and size structure seem distinct, or even
opposite, to those that govern copepod size structure and abundance patterns. Again, this could be ascribed
to their notable difference in life strategies. Numerous species of Rhizaria are large single-celled mixotrophic
protists that host obligate intracellular microalgal symbionts (photosymbionts31). Spinose foraminifera show
higher contents of chlorophyll a than the shorter non-spinose species32. The efficient photosynthesis performed
by photosymbionts, promoted in conditions of higher irradiance and macronutrient concentrations, can lead
to oxygen concentrations reaching nearly 200% of the oxygen saturation levels33,34, and potentially even more
within their cytoplasm. Such high oxygen availability in the protist cells may weaken the usual temperature- and
oxygen-driven constraints on their body size. High oxygen concentrations promote the formation of reactive
oxygen species (ROS), which could significantly damage cell structures through the oxidation of DNA, cell mem-
branes or proteins. Overproduction of ROS driven by temperature increase is suspected to trigger coral bleaching,
either by symbiont expulsion or digestion35. Similar reactions may occur within protists36. We hypothesize that
large protists attempt to prevent ROS accumulation by optimizing the distance between the photosymbionts and
themselves. Indeed, most symbiont-bearing Foraminifera tend to display large spinose formation, as a support for
the symbiont swarms located further away from the central shell33,34,37, but also enhance prey encounter rates38.
Keeping larger sizes to enhance prey capture and avoid ROS could explain the observed stability in median size
and abundance of these organisms in the warmer tropical conditions.
The heterogeneity of sampling strategies between surveys usually hinders global scale plankton studies that
require the combination of data from multiple oceanographic cruises. The data collected from the Tara Oceans
expeditions allow us to examine the in situ properties of plankton communities at a very large spatial scale,
thanks to the uniform sampling strategy. However, it should be reminded that the one-time nature of such
sampling impedes us from addressing the temporal variations of plankton community size structure across the
different provinces studied. In addition, it is also worth to point out that the distribution of the sampling stations
are unequal across latitudes (Supplementary Fig. S1). Notwithstanding, the latitudinal patterns we observe for
copepod size structure are consistent with those of previous studies that resolved seasonal variations16,17, therefore
providing some support for the temporal consistency of our results. The correlations we report between abun-
dance, size structure and the environmental variables do not ascertain the ecological and biological processes
through which the observed latitudinal patterns emerge. Nonetheless, correlative studies such as ours are key
for identifying the major drivers of biological changes and pinpoint further studies to be performed under more
controlled conditions that will seek to identify and test the precise biological processes underlying the patterns.
While the level of taxonomic identification of the ZooScan imaging system remains suitable for a size-based
community-level study, it does not enable us to depict finer variations in species composition that could be
important to further understand the assembly of plankton communities in response to environmental gradients.
However, it allowed us to observe large scale patterns and to identify the shape of the relationships between
environmental drivers and size structure that would have taken years to depict through non-automated methods.
The observed latitudinal patterns in abundance and size structure are relatively consistent across the three nets
used but some discrepancies were found (e.g., unidentified Copepoda, Cyclopoida, or Pteropoda; Supplementary
Fig. S2). These were likely due to the relative coarse mesh of the Bongo and Régent nets, which underestimated
the abundances of most groups (Supplementary Doc. S4). Therefore, these nets could have underestimated the
strength of some latitudinal abundance and size structure patterns and their relationships to environmental
covariates. Discrepancies between the WP2 data and the two other nets could also stem from differences in
sampling depth and net tow, which are known to affect plankton community estimates. The potential effects of
these sampling parameters remain difficult to describe here, as only the effects of the mesh size could be evaluated
(Supplementary Doc. S4). While the WP2 net was towed vertically from 100 m depth to the surface while the
Bongo and Régent nets were towed obliquely from 500 m to the surface. Although these to nets were equipped
with coarser meshes, they were towed deeper so they could have captured the deeper living community better39.
Nonetheless, considering that most of the zooplankton organisms are concentrated in the 0–200 m layer39, we are
Scientific Reports | (2021) 11:15714 | https://doi.org/10.1038/s41598-021-94615-5 13
Vol.:(0123456789)www.nature.com/scientificreports/
confident that the sampling design of the present Tara expeditions adequately captured the macroscale patterns
of zooplankton community composition.
Our study follows a trait-based approach to examine the distribution of a “master trait” (i.e. body size) to
better investigate how community composition relates to ecosystem f unctioning1. We report quasi-global size-
latitude relationships in the size structure of major marine zooplankton groups, as well as their scaling with
environmental covariates at the community-level. Larger zooplankton are known to enhance energy fluxes to
higher trophic levels and to promote carbon export towards deeper layers40,41. Therefore, our observations bring
further support to the view that ongoing global climate warming will elicit a decrease in zooplankton size and
lower their contribution to the biological carbon pump41 as well as to overall metabolic rates3. However, fully
understanding and predicting such anticipated changes requires a precise parameterization of how environmental
conditions impact marine organisms in marine ecosystem models. The representation of plankton diversity in
mechanistic marine ecosystem models is improving as the latter may now include from t en42 to hundreds of
plankton functional types in the case of self-assembling traits-based models43,44. Yet vast inter-model discrepan-
arametrization45. Models often aim to validate their parameterization using emergent
cies exist in terms of their p
46,47
constraints . The relationships observed between zooplankton community size structure and environmental
covariates, or community biomass per size classes and environmental covariates provide such constraints for
model validation and evaluation45–47 but also shows that one single parametrization is not sufficient to fully cap-
ture the variety of the responses observed among plankton organisms. Therefore, our study allows a more precise
parametrization of such models, and thus a more precise estimation of future climatic impact on zooplankton
organisms abundance, size and by extension effect on the biological carbon pump. We call for closer collabora-
tions between the fields of macroecology, biology, experimental physiology and adaptation to disentangle the
roles of multiple drivers in shaping individual traits and the community-level response of marine ecosystems to
current and future cumulative effects of stressors, through cell-to-ecosystem s tudies48.
Methods
Sample collection. Zooplankton samples and environmental data were collected at 168 stations across all
major oceanic provinces during the Tara Oceans expeditions (2009–2013) (Supplementary Fig. S1). Zooplank-
ton was collected with three different types of nets to cover the 200–680 µm size range, encompassing most of the
organisms constituting the mesozooplankton. A WP2 net of 200 μm mesh size and 0.57 m 2 opening was towed
vertically or obliquely from 100 m depth to the surface. A Bongo net and a Régent net, of 300 and 680 μm mesh
size (0.57 and 1.12 m 2 opening), respectively, were towed obliquely from 500 m depth to the surface. Samples
were preserved with buffered formaldehyde (4%) for later digitization and morphological analyses. The Tara
Oceans expeditions sampling strategy and methodologies are fully described in Pesant et al.49.
Measurements of environmental covariates. To describe the abiotic habitat associated with each
plankton sample, vertical profiles of physical and biogeochemical variables (thereinafter called environmental
covariates) were measured by a conductivity temperature depth sensor/rosette (CTD) and Niskin bottles follow-
ing a published sampling package50. A detailed description of each method used as well as all metadata used are
available on PANGAEA51–54.
Temperature (°C), salinity (psu) and oxygen concentration (µmol kg−1) were measured at 10 m depth. Mixed
Layer Depth (MLD, m) was estimated based on the 0.03 kg m−3 sigma differential density relative to the density
epth55. Chlorophyll a concentration was estimated from vertical CTD casts. The values derived from the
at 10 m d
fluorescence composite profiles were integrated from 0 to 200 m (or 100 m depending on seafloor depth), using
the trapezoidal method. Nutrients concentrations [nitrite/nitrate (NO2NO3, µmol l−1), phosphate (PO4, µmol l−1)
and silicate ( SiO2, µmol l−1)] were determined using segmented flow a nalysis56. For nutrient concentrations, the
average of the median values corresponding to each integrated nets samples53 was used as it is a better indicator
of the overall conditions over the course of a sampling station.
The contribution of the three main phytoplankton size classes to total phytoplankton biomass, %Pico (< 2 µm),
%Nano (2–20 µm), and %Micro (> 20 µm) were estimated based on HPLC a nalysis57. The measurements were
integrated over the 0–200 water column.
Surface Photosynthetically Active Radiation (PAR, mol quanta m −2 day−1) was calculated from in situ sensor
data, calibrated using factory settings. Surface backscattering coefficient of particles at 470 nm (bbp470, m−1)
was calculated from in situ sensor data, corrected with in situ measurements in dark conditions. For both PAR
and bbp470, we used the median value around the sampling date and location51–54.
Among all the contextual metadata provided by the TARA consortium51–54, the above-mentioned covariates
were selected because: (i) they were the most complete across most sampling stations; (ii) presented the most
normal-like distribution and because they were collinear with their alternative versions. Finally, distance to coast
(km) was added a posteriori to the suite of covariates to help disentangling coastal samples from the open ocean
ones and include this geographical effects in our statistical models. Distance to coast was computed as the short-
est Haversine distance to 0 m isobath, on a 15 min resolution. The bathymetric data from the ETOPO1 database
(https://ngdc.noaa.gov/mgg/global/global.html) were used and obtained through the marmap R package58.
Zooplankton abundance and size estimates. Zooplankton samples were analyzed using the ZooScan
imaging system21. Zooplankton images classification was performed using an automatic recognition algorithm
and validated into taxonomic groups by a posteriori expert inspection. Organisms were classified into coarse
taxonomic groups on Ecotaxa59, generally at the class or order-level except for copepods which were identified
down to the family level whenever possible. For our spatial analyses (see below), 36 taxonomic groups were
retained, including total zooplankton, Copepoda, Chaetognatha, Cnidaria, Tunicata (mainly appendicularians,
Scientific Reports | (2021) 11:15714 | https://doi.org/10.1038/s41598-021-94615-5 14
Vol:.(1234567890)You can also read