Controls on fault zone structure and brittle fracturing in the foliated hanging wall of the Alpine Fault - Solid Earth
←
→
Page content transcription
If your browser does not render page correctly, please read the page content below
Solid Earth, 9, 469–489, 2018
https://doi.org/10.5194/se-9-469-2018
© Author(s) 2018. This work is distributed under
the Creative Commons Attribution 4.0 License.

Controls on fault zone structure and brittle fracturing in the foliated
hanging wall of the Alpine Fault
Jack N. Williams1,a , Virginia G. Toy1 , Cécile Massiot2,3 , David D. McNamara3,4 , Steven A. F. Smith1 , and Steven Mills5
1 Department  of Geology, University of Otago, P.O. Box 56, Dunedin 9054, New Zealand
2 School of Geography, Environment, and Earth Sciences, Victoria University of Wellington,
P.O. Box 600, Wellington 6012, New Zealand
3 GNS Science, P.O. Box 30-368, Lower Hutt 5040, New Zealand
4 Department of Earth and Ocean Sciences, NUI Galway, University Road, Galway, Ireland
5 Department of Computer Science, University of Otago, P.O. Box 56, Dunedin 9054, New Zealand
a now at: School of Earth and Ocean Sciences, Cardiff University, Cardiff, CF10 3AT, UK

Correspondence: Jack Williams (williamsj132@cardiff.ac.uk)

Received: 4 October 2017 – Discussion started: 10 October 2017
Revised: 18 March 2018 – Accepted: 19 March 2018 – Published: 23 April 2018

Abstract. Three datasets are used to quantify fracture den-        filled fractures constitutes an “inner damage zone.” This zone
sity, orientation, and fill in the foliated hanging wall of the    is interpreted to extend towards the base of the seismogenic
Alpine Fault: (1) X-ray computed tomography (CT) images            crust given that its width is comparable to (1) the Alpine
of drill core collected within 25 m of its principal slip zones    Fault low-velocity zone detected by fault zone guided waves
(PSZs) during the first phase of the Deep Fault Drilling           and (2) damage zones reported from other exhumed large-
Project that were reoriented with respect to borehole tele-        displacement faults. In summary, a narrow zone of fracturing
viewer images, (2) field measurements from creek sections          at the base of the Alpine Fault’s hanging-wall seismogenic
up to 500 m from the PSZs, and (3) CT images of oriented           crust is anticipated to widen at shallow depths, which is con-
drill core collected during the Amethyst Hydro Project at          sistent with fault zone flower structure models.
distances of ∼ 0.7–2 km from the PSZs. Results show that
within 160 m of the PSZs in foliated cataclasites and ultra-
mylonites, gouge-filled fractures exhibit a wide range of ori-
entations. At these distances, fractures are interpreted to have   1   Introduction
formed at relatively high confining pressures and/or in rocks
that had a weak mechanical anisotropy. Conversely, at dis-         Conceptual models of fault zone structure in the upper crust
tances greater than 160 m from the PSZs, fractures are typi-       often invoke a relatively narrow “fault core” that accommo-
cally open and subparallel to the mylonitic or schistose fo-       dates most displacement, surrounded by a halo of heavily
liation, implying that fracturing occurred at low confining        fractured rock termed the “damage zone” (Caine et al., 1996;
pressures and/or in rocks that were mechanically anisotropic.      Chester et al., 1993; Chester and Logan, 1986; Faulkner
Fracture density is similar across the ∼ 500 m width of the        et al., 2010). These models have been successfully applied
field transects. By combining our datasets with measure-           in a variety of tectonic settings and for a wide range of
ments of permeability and seismic velocity around the Alpine       fault displacements and exhumation depths (e.g. Choi et al.,
Fault, we further develop the hierarchical model for hanging-      2016; Faulkner et al., 2010; Kim et al., 2004; Mitchell and
wall damage structure that was proposed by Townend et              Faulkner, 2009; Savage and Brodsky, 2011). However, the
al. (2017). The wider zone of foliation-parallel fractures rep-    term “damage zone” has been applied by geologists and geo-
resents an “outer damage zone” that forms at shallow depths.       physicists to describe a variety of fault-related features, such
The distinct < 160 m wide interval of widely oriented gouge-       as fractures and faults at stepovers and bends (Chester and
                                                                   Chester, 2000; Kim et al., 2004; Mitchell and Faulkner, 2009;

Published by Copernicus Publications on behalf of the European Geosciences Union.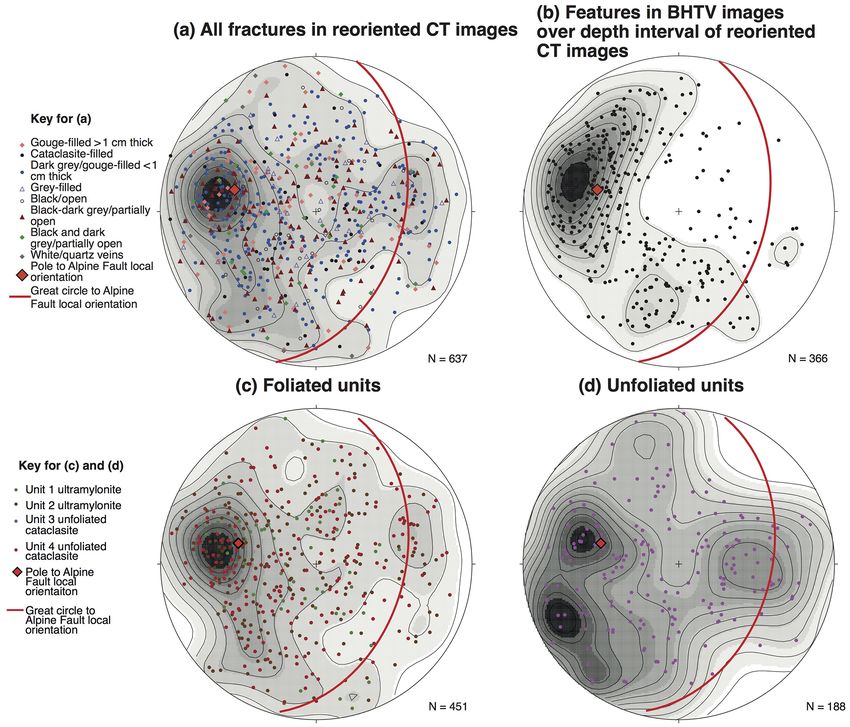
470                                                                J. Williams et al.: Alpine Fault fractures and fault structure

Figure 1. (a) Location map for Alpine Fault (red line) and Marlborough faults (black line) in the South Island of New Zealand. Box shows
extent of (b) a location map for the first phase of the Deep Fault Drilling Project (DFDP-1) and Amethyst Hydro Project (AHP) boreholes,
and field transects. The generalised underlying geology is derived from the GNS Science 1 : 250 000 QMAP project (Rattenbury and Isaac,
2012) and has been draped over a digital elevation model (Columbus et al., 2011).

Wilson et al., 2003), the volume of inelastic deformation that        icantly affect the orientation and density of brittle fractures.
is induced by dynamic stresses during earthquake rupture              Despite this, “fault core–damage zone” models are based
propagation (Andrews, 2005; Cowie and Scholz, 1992; Rice              largely on field observations from relatively isotropic host
et al., 2005; Templeton et al., 2008; Vermilye and Scholz,            rocks, and there have been comparatively few field studies (a
1998), and the volume of rock in which earthquake swarms              notable exception being Bistacchi et al., 2010) that document
or foreshock and aftershock sequences are localised (Kim              the influence of mechanical anisotropy on patterns of brittle
and Sanderson, 2008; Savage et al., 2017; Sibson, 1989;               fracture damage in large-displacement faults.
Yukutake et al., 2011). Furthermore, though damage zones                 In this contribution, multiple datasets across a range of
are typically reported to be < 1 km wide (Faulkner et al.,            scales were used to analyse fracture densities, orientations,
2011; Savage and Brodsky, 2011), co-seismic ground shak-              and mineral fills across the hanging wall of the Alpine
ing can modify fracture permeability many hundreds of kilo-           Fault’s central section. Measurements from within 25 m of
metres away from the fault source (Cox et al., 2015; Muir-            the Alpine Fault principal slip zones (PSZs) were made
Wood and King, 1993; O’Brien et al., 2016).                           from shallow (depths < 130 m) drill cores and wireline logs
   Brittle faults often develop in mylonite sequences or other        obtained during the first phase of the Deep Fault Drilling
(e.g. jointed) rocks that contain compositional and mechani-          Project (DFDP-1). These are combined with field studies at
cal anisotropies (Bistacchi et al., 2012; Chester and Fletcher,       distances < 500 m from the PSZs and analyses of drill core
1997; Massironi et al., 2011). Evidence from field stud-              recovered at 0.7–2 km from the PSZs during the Amethyst
ies (Bistacchi et al., 2010; Peacock and Sanderson, 1992),            Hydro Project (AHP). Results are then compared to mea-
experiments (Donath, 1961; Misra et al., 2015; Paterson               surements of hydraulic conductivity (Cox et al., 2015; Tow-
and Wong, 2005), and numerical modelling (Chester and                 nend et al., 2017) and geophysical studies (Boese et al., 2012;
Fletcher, 1997) demonstrates that such anisotropy can signif-         Chamberlain et al., 2017; Eccles et al., 2015) around the

Solid Earth, 9, 469–489, 2018                                                                      www.solid-earth.net/9/469/2018/
J. Williams et al.: Alpine Fault fractures and fault structure                                                                      471

Alpine Fault. In doing so, we critically assess the application
of “damage zone” models to an active plate-boundary-scale
structure. Furthermore, the Alpine Fault rapidly exhumes
ductile-to-brittle fault rock sequences from depths of up to
35 km (Little et al., 2005; Norris and Toy, 2014). Fracturing
in its hanging wall therefore overprints a 1–2 km wide my-
lonite sequence containing a pervasive foliation (Cooper and
Norris, 1994; Norris and Cooper, 1997, 2007; Toy, 2008),
and so can provide new insights into the relationships be-
tween fracturing and mechanical anisotropy.                          Figure 2. (a) Quartzofeldspathic Alpine Fault ultramylonite that
                                                                     gradually grades to mylonite at the base of the image from
                                                                     Gaunt Creek (43◦ 190 00.6200 S, 170◦ 190 32.7900 E). A foliation de-
2   Tectonic setting of the Alpine Fault                             fined by alternating white quartzofeldspathic bands and dark grey
                                                                     mica bands is hard to distinguish in the ultramylonite but is
The Alpine Fault is a crustal-scale (along-strike extent             more apparent in the mylonite. (b) The well-foliated Alpine Fault
∼ 850 km, depth ∼ 35 km) transpressive discontinuity ac-             protomylonite–mylonite transition at Gaunt Creek (43◦ 190 05.1100 S,
commodating ∼ 70 % of Pacific–Australian plate motion in             170◦ 190 46.1600 E). Compass is 5 cm wide. Both images were previ-
                                                                     ously presented in Toy (2008).
the South Island of New Zealand (DeMets et al., 1994; Norris
and Cooper, 2001, Fig. 1a). This study focuses on the central
section between the Toaroha and Martyr rivers (Barth et al.,
                                                                     2005; Toy et al., 2017). At scales of 1–10 km, perturbations
2013) where it currently accommodates dextral strike slip at a
                                                                     in the stress field induced by hanging-wall topography re-
rate of 27 ± 5 mm yr−1 and dip slip at a rate of 6–10 mm yr−1
                                                                     sults in segmentation of the Alpine Fault. Segmentation is
(Little et al., 2005; Norris and Cooper, 2001).
                                                                     rooted to depths of 0.5–4 km and comprises kilometre-long,
   In the central section at depths greater than 8–12 km, the
                                                                     approximately E–W-striking and steeply dipping strike-slip
Alpine Fault accommodates motion via viscous creep across
                                                                     fault strands, which adjoin NE–SW-striking, gently dipping
a > 1 km wide ductile shear zone in which the hanging-wall
                                                                     (∼ 30◦ ) thrust segments (Barth et al., 2012; Langridge et al.,
“Alpine Schist” protolith is progressively mylonitised (Nor-
                                                                     2014; Norris and Cooper, 1995, 2007; Simpson et al., 1994;
ris and Cooper, 2007; Toy et al., 2010). Shear strains increase
                                                                     Upton et al., 2017).
with proximity to the Alpine Fault and are recorded by pro-
tomylonites, mylonites, and ultramylonites, which occur in
spatial sequence towards the fault (Fig. 2; Norris and Cooper,       3     Methods
2003; Reed, 1964; Toy et al., 2008). Foliation in the mylonite
sequence is mainly defined by alternating quartzofeldspathic         3.1    Fracture orientations from DFDP-1 drill core
and mica-rich layers (Fig. 2). Bottle-green hornblende-rich
metabasic mylonites and purple-dark grey mylonites that are          Hanging-wall fracture orientations immediately adjacent to
comparatively mica rich are also present. Their presence re-         the Alpine Fault’s PSZ were assessed through analysis of
flects variations in protolith lithology (Cooper and Norris,         datasets arising from the first phase of the DFDP-1 (http:
2011; Norris and Cooper, 2007; Sibson et al., 1981; Toy,             //alpine.icdp-online.org, last access: 18 April 2018). DFDP-
2008). As the mylonites in the hanging wall are exhumed to           1 successfully sampled the Alpine Fault in two boreholes
depths of less than 8–12 km, temperatures drop below those           (DFDP-1A and DFDP-1B, Fig. 3) at depths of less than
at which quartz plasticity occurs and brittle structures start to    150 m at Gaunt Creek (Fig. 1b, Sutherland et al., 2012).
overprint the mylonitic shear zone (Norris and Cooper, 2007;         The geophysical properties of the DFDP-1 boreholes were
Toy et al., 2010, 2015). This brittle overprint is reflected in      characterised by a full suite of wireline logs (Townend et
the formation of a ∼ 20 m thick layer of green, indurated, and       al., 2013). These were combined with visual descriptions of
often foliated cataclasite (Allen et al., 2017; Toy et al., 2015),   ∼ 70 m of core recovered across the two boreholes to con-
and a 10–50 cm thick clay-rich PSZ that is preserved adjacent        struct a lithological classification scheme for DFDP-1 drill
to the currently active fault trace (Boulton et al., 2017, 2012;     core (Fig. 3, Toy et al., 2015).
Ikari et al., 2014; Mitchell and Toy, 2014).                            Abundant fractures were observed in X-ray computed to-
   To the first order (i.e. at scales > 10 km), the trace of the     mography (CT) scans of DFDP-1 drill core (Williams et
Alpine Fault is remarkably linear, with an average strike of         al., 2016). The true orientations of these fracture were ob-
055◦ (Norris and Cooper, 2007). On the basis of geophysi-            tained by generating “unrolled” CT images of individual
cal imaging and measurements of the mylonitic foliation –            core sections (Mills and Williams, 2017), which are directly
which is thought to parallel the fault – it is estimated to dip      analogous to geographically referenced – but lower resolu-
at ∼ 45◦ in its central section (Sibson et al., 1981; Stern et       tion – borehole televiewer (BHTV) images. Where fractures
al., 2007), though this may locally exceed 60◦ (Little et al.,       could be matched between the two images, a rotation could

www.solid-earth.net/9/469/2018/                                                                       Solid Earth, 9, 469–489, 2018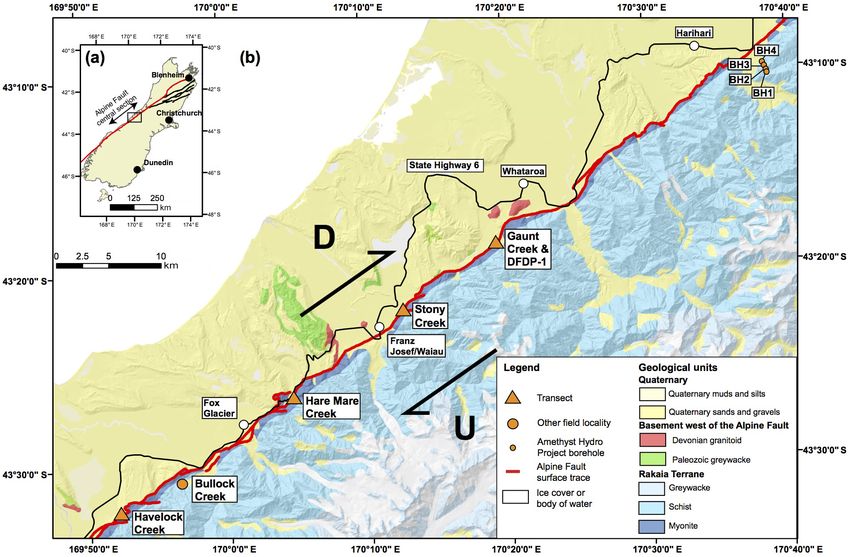
472                                                                   J. Williams et al.: Alpine Fault fractures and fault structure

                                                                         Alpine Fault at Bullock Creek (Fig. 1b). Each creek tran-
                                                                         sect cuts across a thrust segment of the Alpine Fault, so the
                                                                         orthogonal distance between the measuring stations and the
                                                                         PSZs was calculated assuming a fault dip of 30◦ (Norris and
                                                                         Cooper, 1995, 1997). The mylonite lithology for each station
                                                                         was classified using the scheme presented by Toy (2008).
                                                                            The outcrops encountered along these transects are typ-
                                                                         ically subvertical and may be covered by debris except at
                                                                         their bases where they are frequently cleaned by flood events
                                                                         (Fig. S2 in the Supplement). They are therefore poorly suited
                                                                         for fracture density analysis using circular scanlines (e.g.
                                                                         Mauldon et al., 2001). Instead, the fracture density was cal-
                                                                         culated from the number and orientation of fractures that
                                                                         intersected a linear transect along the base of each outcrop
                                                                         (Priest, 1993; Schulz and Evans, 2000). This technique has
                                                                         the tendency to under-sample fractures oriented at low angles
                                                                         to the scanline. Therefore, a weighting (w) factor calculated
                                                                         using a modified version of the Terzaghi correction (Massiot
Figure 3. Cross section through the DFDP-1 boreholes, showing
                                                                         et al., 2015; Terzaghi, 1965) was applied to each fracture, and
interval where reoriented drill core is located. Boxes with diag-
onal lines depict intervals in the borehole with no core recovery;       results are shown as “corrected” fracture density.
grey lines represent mylonitic foliation. Modified from Sutherland
et al. (2012), with lithological units previously defined by Toy et      3.3   Fracture orientations in the Amethyst Hydro
al. (2015).                                                                    Project boreholes

                                                                         The AHP was developed to divert water from the Amethyst
                                                                         Ravine down a 1040 m long tunnel to a powerhouse on the
be derived to transform all fracture orientations in the CT
                                                                         floodplain of the Wanganui River. Prior to the main phase
scans from a local core reference frame to their true geo-
                                                                         of tunnelling, four exploratory boreholes (BH1–4; Figs. 1b
graphic orientation (Fig. 4). Depending on the number of
                                                                         and S3) were completed between 2005 and 2006, resulting in
fractures matched, the core was rotated with a high, mod-
                                                                         the recovery of ∼ 890 m of drill core at depths of 50–200 m.
erate, or low degree of confidence. In DFDP-1A, the quality
                                                                         The boreholes are situated 1–2 km southeast of a thrust seg-
of BHTV imaging was insufficient to attempt matching frac-
                                                                         ment of the Alpine Fault, where it may conceivably dip at a
tures, whereas in the Alpine Fault’s relatively intact footwall
                                                                         range of 30–60◦ (Norris and Cooper, 1995; Toy et al., 2017).
(Townend et al., 2013), too few fractures (less than one frac-
                                                                         The drill cores are therefore at orthogonal distances of ∼ 0.7–
ture per core section) could be imaged to attempt core reori-
                                                                         2.0 km from the PSZs.
entation. Therefore, the true orientation of fractures was only
                                                                            To provide a dataset analogous to the DFDP-1 CT scans,
determined for the depth interval 94–126 m in the DFDP-1B
                                                                         a total of 31.9 m of drill core from the AHP boreholes was
borehole (Fig. 3). Given the orientation of the PSZ-1 (which
                                                                         CT scanned at the Southern Cross Hospital in Wellington,
separates hanging-wall and footwall cataclasite) sampled in
                                                                         New Zealand. Initial descriptions of the drill core found that
DFDP-1 (015/43 E; Townend et al., 2013), this spans an or-
                                                                         the rock quality designation (RQD, the percent of intact core
thogonal distance of ∼ 25 m. A full methodology is provided
                                                                         lengths > 100 mm per 1 m of drill core) varied considerably
in Appendix A, the rotations applied to DFDP-1 core sections
                                                                         due to intense fracturing adjacent to the Tarpot Fault and
are listed in Table S1 in the Supplement, and a complete CT-
                                                                         other minor faults that intersect the AHP boreholes (McC-
BHTV image comparison is given in Williams et al. (2017b).
                                                                         ahon, 2006; Savage, 2013). However, for practical reasons,
3.2   Field observations of fracture orientations and                    scanning was focused on intervals of high RQD (Fig. S3).
      densities                                                          The CT scanner was operated at 100 mA and an X-ray tube
                                                                         voltage of 120 kVp. Slice spacing was 1.25 mm, field of view
At orthogonal distances of up to 150–250 m from the PSZs,                was 250 mm, and the image size was 512×512 pixels. There-
fracture orientations and densities were measured in four                fore, the size of one voxel is 0.488 × 0.488 × 1.25 mm in
creeks (Gaunt Creek, Stony Creek, Hare Mare Creek, and                   the x, y, and z directions, respectively. Reconstruction of
Havelock Creek; Fig. 1b) that cut across the hanging-wall se-            two-dimensional CT slices into three-dimensional images of
quence approximately perpendicular to the main fault trace               the drill core was performed using OsiriX Imaging Software
(Fig. S1). Along each creek, fracture orientations and den-              (http://www.osirix-viewer.com/, last access: 18 April 2018).
sities were measured at three or four stations. This infor-
mation was also gathered at approximately 500 m from the

Solid Earth, 9, 469–489, 2018                                                                       www.solid-earth.net/9/469/2018/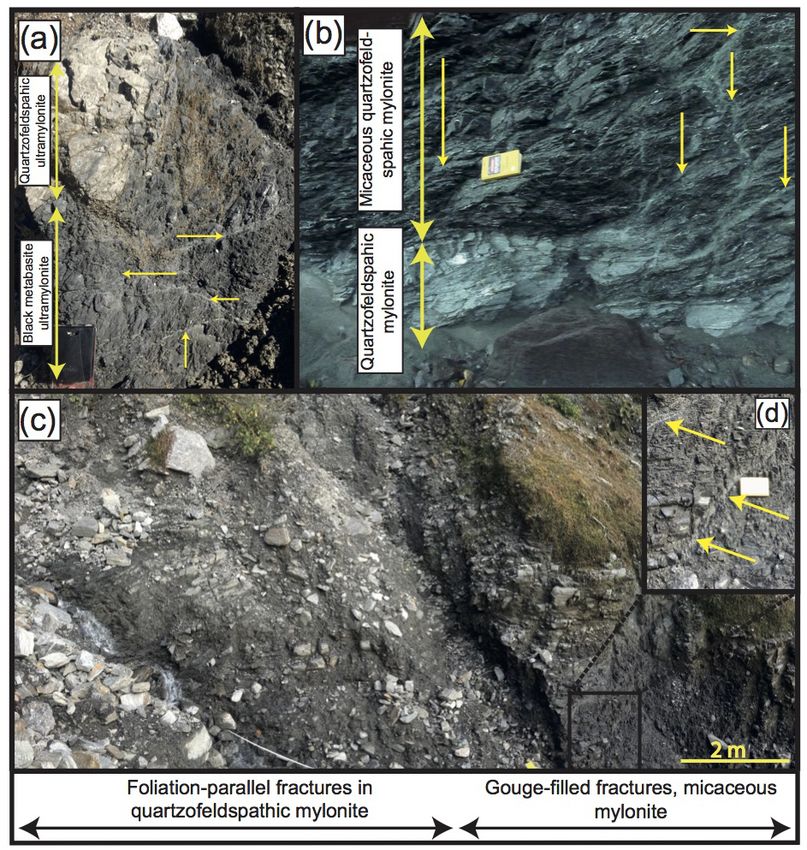
J. Williams et al.: Alpine Fault fractures and fault structure                                                                      473

Figure 4. Examples of matching structures between BHTV images and unrolled CT images. In each image, the first two columns are the
BHTV amplitude image, without and with interpretations, respectively, whilst the third and fourth columns depict the unrolled CT image
over the same interval, also without and with interpretations. Fractures that have been traced in red indicate those that were matched to
re-orientated core.

   AHP drill core was not oriented. However, the orientation           4     Results
of the schistosity is noted in the drill-core logs to an accu-
racy of ±5◦ (McCahon, 2006), where it is consistent with               4.1    Fracture orientations in DFDP-1 drill core within
the schistosity orientation measured in the Amethyst Tun-                     25 m of the Alpine Fault
nel itself (Savage, 2013). It can thus be used as a reference
to reorient drill-core CT scans back into a geographic ref-            In the DFDP-1 CT images, a total of 637 fractures were ro-
erence frame. For BH2 and BH3 drill cores, which are ver-              tated into their true geographic orientation where they show a
tical, this required only a single transformation. For the in-         weak cluster about the orientation of the foliation and Alpine
clined BH1 and BH4 drill cores, this required first rotating           Fault PSZs at Gaunt Creek (015/43 E, Fig. 5a, Appendix B;
the core with respect to the foliation. These orientations were        Townend et al., 2013). Features in DFDP-1B BHTV images
then corrected for the inclination of the drill core using the         are also aligned about this orientation but with a higher clus-
Planes from Oriented and Navigated Drillcore (POND) Ex-                ter intensity than fractures noted in the CT images (Fig. 5b,
cel spreadsheet (Stanley and Hooper, 2003).                            Table 1). This may reflect (1) features observed at the resolu-
                                                                       tion of the BHTV are more likely to be aligned subparallel to
3.4   Statistical analysis of fracture orientations                    the fault plane and foliation than those visible in CT, and/or
                                                                       (2) some of the planar features identified from the BHTV
The clustering intensity of fracture orientations was quan-            images were the mylonitic foliation itself. The clustering of
tified using the resultant vector method of Priest (1993),             fractures hosted in foliated ultramylonites and cataclasites
where the vector for each fracture was weighted by the Terza-          (units 1, 2, and 4 of Toy et al., 2015) is the same as frac-
ghi correction for misorientation bias (Massiot et al., 2015;          tures hosted in relatively homogenous unfoliated cataclasites
Terzaghi, 1965). This analysis was performed only for the              (unit 3 of Toy et al., 2015; Fig. 5c and d, Table 1). We also
DFDP-1 and AHP datasets, which sampled a large popula-                 observed no clear relationships between fracture fill (Table 1
tion (> 100) of fractures. Field-measuring stations sampled            of Williams et al., 2016) and fracture orientation (Fig. 5a).
too few (< 30) fractures to reliably perform this analysis, and
so their clustering is described in a qualitative sense only.          4.2    Fracture orientations, densities, and fill in field
                                                                              transects within 500 m of the Alpine Fault

                                                                       The orientations and densities of fractures observed in the
                                                                       four field transects are summarised in Fig. 7. In these tran-
                                                                       sects, similar fractures to those observed in the CT scans of
                                                                       DFDP-1 core are identified (Fig. 8). Total fracture density

www.solid-earth.net/9/469/2018/                                                                        Solid Earth, 9, 469–489, 2018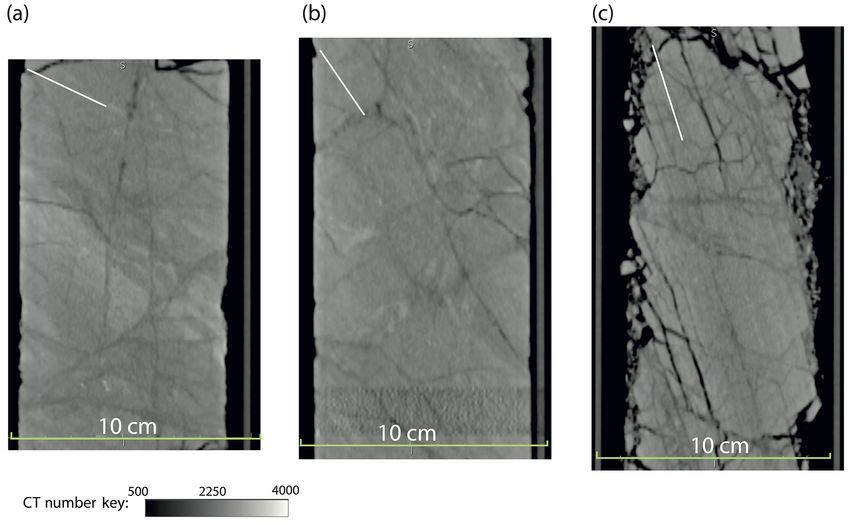
474 J. Williams et al.: Alpine Fault fractures and fault structure
Figure 5. Lower hemisphere equal area stereoplots depicting orientation of fractures in DFDP-1. Contouring on stereoplots was applied to
poles that are weighted depending on their orientation correction w (see Sect. 3.2) and that are rounded to the nearest whole number. Contours
were then generated for the weighted poles using a probability distribution calculated by a Kernel function in the RFOC package for R (Lees,
2014). Great circle represents orientation of Alpine Fault plane and foliation at DFDP-1 site (Townend et al., 2013). (a) Orientation of all
fractures that were reoriented by matching structures between unrolled CT images and BHTV images, sorted by fracture type (Williams et
al., 2016). (b) Orientation of features recognised in the BHTV images over the interval of reoriented core (94–126 m in DFDP-1B). Fracture
orientations extracted from reoriented DFDP-1 CT images in (c) foliated units and (d) unfoliated units, using the DFDP-1 lithological
classification scheme (Toy et al., 2015).
Table 1. Clustering analysis of the different fracture datasets documented in this study, using the resultant vector methodology outlined
by Priest (1993). DFDP-1 foliated units comprise ultramylonites and foliated cataclasites (units 1, 2, and 4 of Toy et al., 2015). DFDP-1
unfoliated units comprise unfoliated cataclasites (unit 3 of Toy et al., 2015). The resultant vector orientation for each dataset, which has been
converted to spherical coordinates, is also reported. See text for full details. The term “s.f.” indicates significant figures.
Number of Resultant plane Resultant Resultant vector length
fractures dip direction plane dip (cluster intensity, 2 s.f.)
All reoriented DFDP-1 CT fractures 637 80 58 0.58
Reoriented DFDP-1 CT fractures, foliated units 451 87 58 0.58
Reoriented DFDP-1 CT fractures, unfoliated units 188 71 61 0.58
DFDP-1B BHTV features (depth interval 94–126 m) 365 103 47 0.72
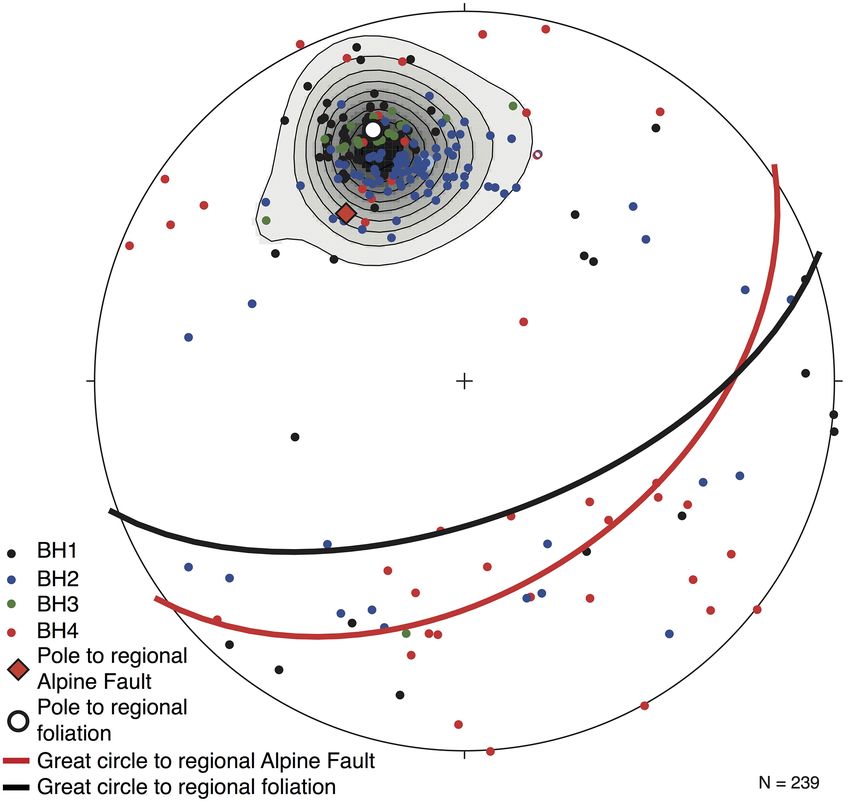
AHP fractures 239 164 58 0.76
Solid Earth, 9, 469–489, 2018 www.solid-earth.net/9/469/2018/
J. Williams et al.: Alpine Fault fractures and fault structure 475
Figure 6. The relationship between foliation and fracture orientations in Alpine Fault ultramylonite, as observed in 2-D CT image slices
of DFDP-1 drill core. Intervals are (borehole, core section and run, depth interval) (a) DFDP-1A 55-1 75.45–75.62 m, (b) DFDP-1B 35-
1 102.49–102.64 m, and (c) DFDP-1B 25-2, 44.80–45.20 m. In panels (a) and (b), fractures tend to cross-cut the ultramylonitic foliation
(orientation represented by white line in the top left corner of each image). (c) Fractures show a greater preference to be aligned parallel to
the foliation. Note that panel (c) was previously shown in Williams et al. (2016) and is not included in the reorientation analysis in Fig. 5, as
there was no BHTV imagery for this interval.
in the transects varies between 3 and 30 fractures m−1 , and schistosity in agreement with the findings during initial drill-
there is no clear decrease in fracture density with increas- core descriptions and observations within the Amethyst Tun-
ing distance from the Alpine Fault in any of the transects nel itself (Fig. 11; McCahon, 2006; Savage, 2013). The clus-
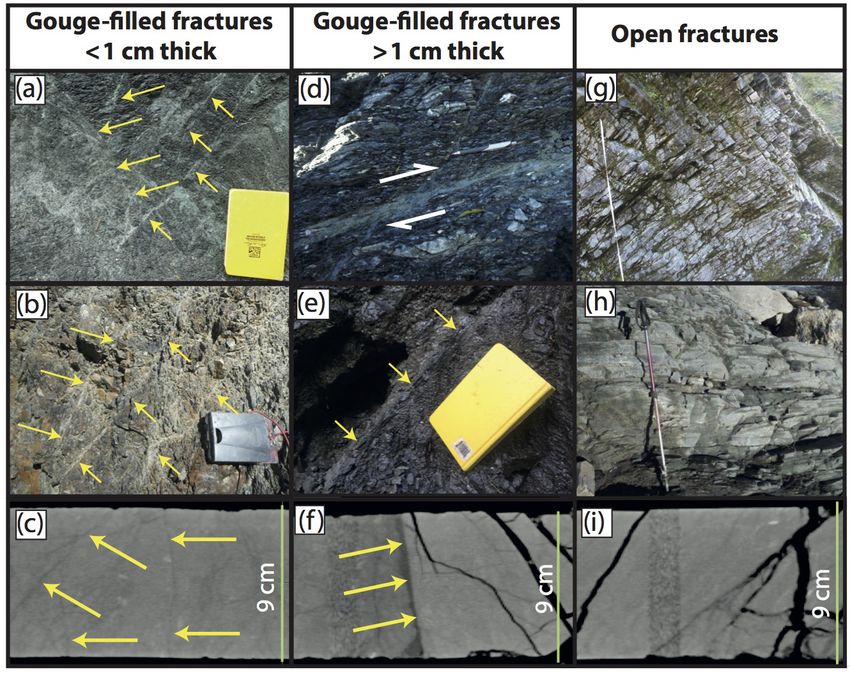
(Fig. 7a). Gouge-filled fractures (Fig. 8a–c) are observed at tering of these fracture orientations is stronger than in the
all distances from the Alpine Fault but are relatively abundant DFDP-1 datasets (Table 1). Fractures that cut across the
(> 1 fracture m−1 , Fig. 7a, Table S2) within 100–160 m of the schistosity are most frequent in BH4 (Figs. 10d and 11).
PSZs (Fig. 7a). The thicker gouge-filled fractures (> 1 cm) Though fractures are predominantly open, it is conceivable
commonly juxtapose different lithologies or offset markers that the original fill may have been lost during the subsequent
(Fig. 8d–f). Thinner gouge-filled fractures (< 1 cm) are lo- core handling processes. This means that standard schemes
calised to within 160 m of the Alpine Fault. Open fractures to differentiate between natural and induced fractures (Ku-
(Fig. 8g–i) are present at all stations, though are most preva- lander et al., 1990; Williams et al., 2016) cannot be applied
lent at those furthest from the fault (Fig. 7b). to this dataset. Nevertheless, some open fractures must be
The composition of the mylonites can also affect fracture natural as they show alteration haloes (Fig. 10a) implying
density. When they are juxtaposed together, micaceous my- that they were once conduits for fluid flow. Furthermore,
lonites and ultramylonites are observed to contain relatively packer tests conducted in these boreholes indicate hydraulic
high densities of gouge-filled fractures compared to quart- conductivities of ∼ 10−6 –10−5 ms−1 , which is equivalent to
zofeldspathic mylonites and ultramylonites (Fig. 9). Local- permeabilities of 10−13 –10−12 m2 (Cox et al., 2015; McCa-
ities that showed the widest range in fracture orientations hon, 2006). No permeability measurements have been made
tend to be less than 160 m from the PSZs within the ultramy- in the schist protolith at greater distances from Alpine Fault;
lonites (Fig. 7b). Within mylonite units, fracture orientations however, these measurements are orders of magnitude higher
tend to be more aligned to the foliation (Fig. 7b), although than what has been reported in other metamorphic rock ter-
gouge-filled fractures can sometimes cut across it (e.g. Bul- ranes (∼ 10−20 –10−17 m2 ; Manning and Ingebritsen, 1999)
lock Creek). and for typical continental crust (∼ 10−17 m2 ; Townend and
Zoback, 2000).
4.3 Fractures in AHP drill core, 0.7–2.0 km from the
Alpine Fault
The AHP sampled grey, well-foliated Alpine Schist (Fig. 10),
a subgroup of the Haast Schist (textural zones III–IV, Turn-
bull et al., 2001; Cox and Barrell, 2007). Fracture orien-
tations are clustered about the orientation of the host rock
www.solid-earth.net/9/469/2018/ Solid Earth, 9, 469–489, 2018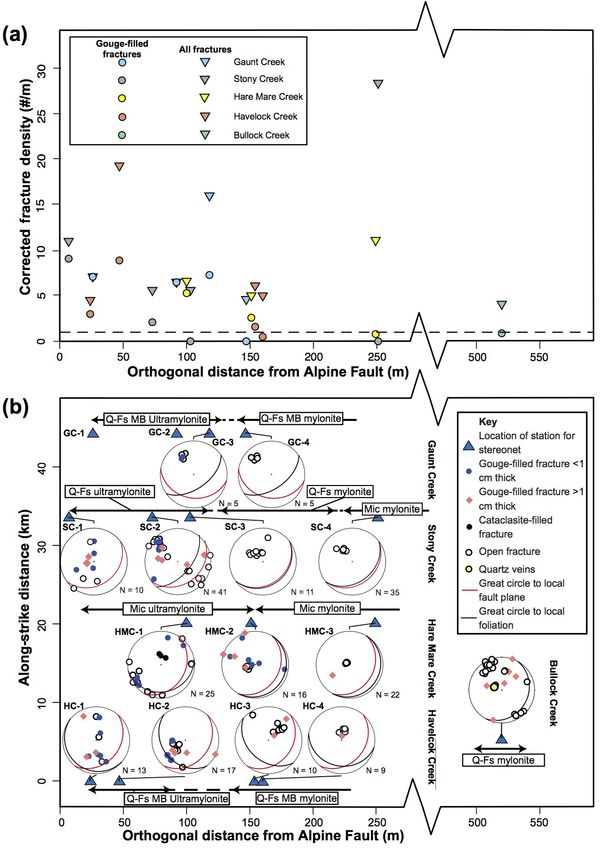
476                                                                    J. Williams et al.: Alpine Fault fractures and fault structure

Figure 7. (a) Corrected fracture density at all stations for gouge-filled fractures and all fractures. The dashed line indicates a corrected
fracture density of 1 fracture m−1 . No orientation data were collected at Gaunt Creek stations 1 and 2, so fracture density is calculated from
the two perpendicular transects. (b) Compilation of stereoplots for fracture orientations at each field station. Stations have been plotted as a
function of distance from the fault and distance along strike (with respect to Havelock Creek) along within fault rock lithologies (Toy, 2008).
Dashed lines indicate gradational or obscured lithological boundaries. Qf:, quartzofeldspathic; MB: metabasic; Mic: micaceous. For field
cross sections and location of stations, see Fig. S1 and Table S2.

Solid Earth, 9, 469–489, 2018                                                                           www.solid-earth.net/9/469/2018/
J. Williams et al.: Alpine Fault fractures and fault structure                                                                               477

Figure 8. Examples of the three main types of fractures observed in the field around the Alpine Fault, and correlative fractures in DFDP-1
CT scans. (a–c) Thin gouge-filled fractures (yellow arrows) have a range of orientations and are found exclusively within 160 m from the
fault. They are equivalent to type iii fractures from Williams et al. (2016). (d–f) Thicker gouge- and cataclasite-filled fractures are equivalent
to type i and ii fractures of Williams et al. (2016) and may be observed at all distances from the Alpine Fault. Offset markers can be observed
across these fractures (e.g. the vein indicated by the pen and white arrows in panel d). (g–i) Open fractures are mainly foliation parallel.
Equivalent to type v fractures of Williams et al. (2016). Location of field photos: (a) Waikukupa thrust (43◦ 260 34.700 S, 170◦ 040 10.900 E),
(b) Stony Creek 2, (d) Havelock Creek 2, (e) Bullock Creek, (g) Stony Creek (43◦ 220 23.9200 S, 170◦ 120 53.6300 E), (h) Havelock Creek 4.
Compass clinometer is 8 cm and yellow notebook is 20 cm in length. Measuring tape in panel (e) is 1.1 m long; walking pole in panel (g)
is 1 m in length. DFDP-1 CT scan intervals: (c) DFDP-1B 56-2 125.35–125.49 m, (f) DFDP-1B 35-1 102.00–102.15 m, (i) DFDP-1B 33-2
99.45–99.60 m.

5     Discussion                                                           a gouge fill, whilst foliation-parallel fractures further from
                                                                           the fault tend to be open (Figs. 7 and 8).
5.1    Fracture orientations in anisotropic wall rocks in                     Experimental studies on foliated rocks demonstrate that
       the Alpine Fault hanging wall                                       mechanical anisotropy will exert the greatest control on rock
                                                                           failure when (1) the angle between the maximum principal
                                                                           stress (σ1 ) and the anisotropy (α) is ∼ 30◦ , (2) confining
Two styles of fracturing are evident in the foliated Alpine
                                                                           pressure is low (< 35 MPa), and (3) the mechanical “strength”
Fault cataclasite, mylonite, and schist sequence (Fig. 12).
                                                                           of the anisotropy is high (Donath, 1961; Misra et al., 2015;
Within DFDP-1 drill core, fractures are predominantly
                                                                           Nasseri et al., 2003; Paterson and Wong, 2005). The first fac-
gouge-filled and exhibit a range of orientations (Figs. 5 and
                                                                           tor can be approximated for the Alpine Fault given the my-
6) with only a small proportion (11 %) of fractures in foli-
                                                                           lonite’s average orientation of 055/45SE (Norris and Cooper,
ated cataclasites and ultramylonites clearly foliation parallel
                                                                           2007) and the stress tensor orientation within the surround-
(Williams et al., 2016). However, in schists sampled by the
                                                                           ing crust, determined from focal mechanisms of microseis-
AHP drill core, the fractures are more clustered about the fo-
                                                                           micity in the fault’s hanging wall (Boese et al., 2012). This
liation than in DFDP-1 drill core (Fig. 11, Table 1). The dif-
                                                                           yields a value of α of approximately 44◦ , when measured in
ference in fracture clustering between the DFDP-1 and AHP
                                                                           the plane containing the maximum and minimum principal
drill cores is qualitatively replicated by the field transects,
                                                                           stresses. This can be considered an intermediate value of α,
where fractures show variable orientations immediately ad-
                                                                           since in deformation experiments fractures may form parallel
jacent to the Alpine Fault but are typically foliation paral-
                                                                           or non-parallel to the foliation depending on the combination
lel at the sites furthest from the fault (Fig. 7). Furthermore,
field transects show that the variably oriented fractures have

www.solid-earth.net/9/469/2018/                                                                               Solid Earth, 9, 469–489, 2018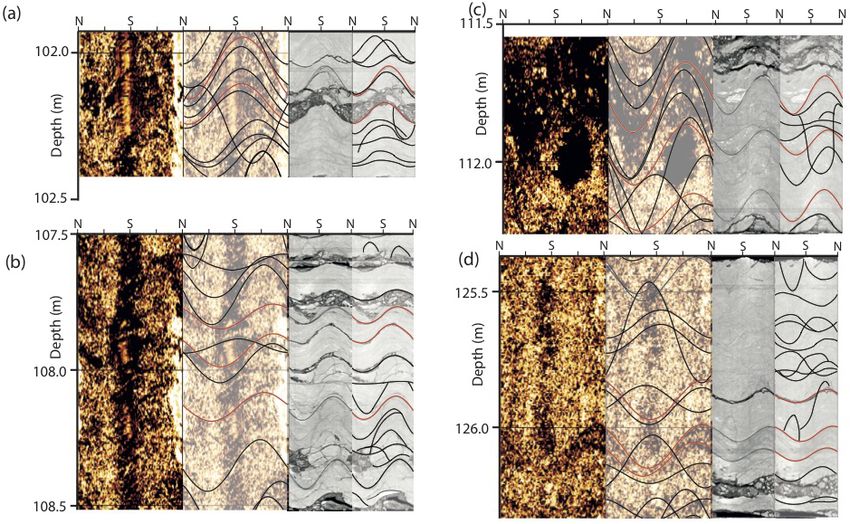
478                                                                 J. Williams et al.: Alpine Fault fractures and fault structure

Figure 9. Field observations of changes in fracture density at lithological contacts. (a, b) Intervals of micaceous and metabasite mylonite
containing a relatively high proportion of gouge-filled fractures (denoted by yellow arrows) compared to interlayered quartzofeldspathic
mylonite. (c) Transition from micaceous mylonite to quartzofeldspathic mylonite coincides with furthest extent of intensive gouge-filled
fractures, as shown by yellow arrows in panel (d). Taken at (a) Gaunt Creek 1, (b) Havelock Creek 2, (c, and d) Hare Mare Creek 3. Compass
clinometer is 8 cm and yellow notebook is 20 cm in length.

of confining pressure and lithology (Donath, 1961; Nasseri et           tures (Fig. 9). These observations highlight that fracturing
al., 2003; Paterson and Wong, 2005).                                    in the upper crust may be influenced by lithological varia-
   Foliation-parallel fractures are least common in the ultra-          tions developed within an underlying linked, and synkine-
mylonites and foliated cataclasites. Indeed, in the DFDP-1              matic, shear zone. However, at other localities (e.g. Stony
datasets, there is no difference in fracture clustering between         Creek, Fig. 7), variations in dominant fracture characteristics
foliated and unfoliated units (Table 1). Lithology may con-             are confined within units of similar composition and texture.
trol mechanical anisotropy depending on mineralogy, poros-              This suggests that variations in confining pressure may also
ity, grain size, and the nature of the foliation surfaces (Do-          be important in controlling the relationship between fractures
nath, 1961; Nasseri et al., 2003). It is notable that phase mix-        and foliation, as discussed in the next section.
ing and grain size reduction in the ultramylonites reduces the
intensity of the foliation, compared to the relatively coarse-          5.2   Fracture damage around the Alpine Fault
grained schists, protomylonites, and mylonites (Fig. 2; Nor-
ris and Cooper, 2007; Toy et al., 2010, 2008). These data
                                                                        Field transects across the Alpine Fault’s hanging wall
suggest that this lithological change could have a marked
                                                                        show that fracture density remains roughly constant
effect on the orientation of fractures. Compositional vari-
                                                                        (> 3.5 fractures m−1 , corrected for orientation bias) for at
ations between relatively quartzofeldspathic and relatively
                                                                        least 500 m from the fault (Fig. 7a). Furthermore, the AHP
micaceous mylonites can also influence the density of frac-
                                                                        (Cox et al., 2015) and DFDP-2B boreholes (Sutherland et

Solid Earth, 9, 469–489, 2018                                                                        www.solid-earth.net/9/469/2018/
J. Williams et al.: Alpine Fault fractures and fault structure 479
Figure 11. Equal area lower hemisphere projection of fracture ori-
entations recognised in CT scans of AHP drill core separated by a
borehole. Contours are plotted with weighted poles (see Fig. 5).
Nevertheless, within the field transects we also note a
distinct interval adjacent to the Alpine Fault’s PSZs that
contains a relatively high density of gouge-filled fractures
Figure 10. Fractures in the AHP drill core. Unrolled images of AHP (> 1 fracture m−1 , Fig. 7a). The width of this interval is
drill core (BH1 45-2, 124.3–124.9 m) taken by (a) DMT core scan- < 147 m (i.e. station 4) from the PSZs at Gaunt Creek,
ner and (b) generated from a CT image. (1) Identifies fracture cut- < 103 m at Stony Creek (i.e. station 3), < 151 m at Hare Mare
ting across foliation, (2) foliation-parallel fracture with alteration Creek (at station 2, Fig. 8c), and < 160 m at Havelock Creek
halo, (3) foliation defined by quartzofeldspathic bands that have (i.e. station 4). These width estimates are based on assump-
low CT numbers. (c, d) Core-axial parallel CT image slices of AHP tion that the Alpine Fault dips at 30◦ below the measur-
drill core. In panel (c), white arrows point to a “crush zone” sub- ing stations (see the methods section). However, the fault
parallel to foliation (BH2 75-2, 155.92–156.04 m). Panel (d) shows
dip may locally vary (for example, the fault dip sampled by
more variable fracture orientations identified in BH4 (section 70-4,
196.62–196.80 m).
DFDP-1 was 43◦ ; Townend et al., 2013), and there is also
uncertainty in the depth extent of its near-surface segmen-
tation (Barth et al., 2012; Norris and Cooper, 1995; Upton
al., 2017; Townend et al., 2017) demonstrate an interval of et al., 2017). Nevertheless, even if the fault dipped at 45◦
enhanced permeability (10−16 –10−13 m2 ) that extends for at (Norris and Cooper, 2007) beneath the measuring stations,
least 2 km into the Alpine Fault’s hanging wall. Permeability the zone of higher-density gouge-filled fractures would be
in this rock mass is controlled by open fractures (Cox et al., < 205 m wide (Table S3) and so is still appreciably closer to
2015; Sutherland et al., 2017; Townend et al., 2017) that are the Alpine Fault than the intervals sampled by the AHP and
generally foliation parallel (Massiot, 2017), and so directly DFDP-2 boreholes.
analogous to the fractures sampled in the field (Fig. 8g–i) and It is this ∼ 100–160 m wide interval with a high den-
in AHP drill core (Fig. 10). Conventional definitions of fault sity of gouge-filled fractures that Norris and Cooper (1997,
structure, that use fracture density and permeability as crite- 2007) interpreted as the extent Alpine Fault’s central section
ria for damage zone width (e.g. Berg and Skar, 2005; Caine et hanging-wall damage zone. Furthermore, the width of this
al., 1996; Faulkner et al., 2010; Savage and Brodsky, 2011; zone is comparable to damage zone widths estimated else-
Schulz and Evans, 2000), would therefore suggest that the where on the Alpine Fault (e.g. Barth et al., 2013, along
Alpine Fault’s damage zone extends for at least 500 m, and the southern section; Wright, 1998, at the northern end of
possibly 2 km, into its hanging wall. the central section, Fig. 13a) and to other crustal-scale fault
zones that have accommodated hundreds of kilometres of
www.solid-earth.net/9/469/2018/ Solid Earth, 9, 469–489, 2018480 J. Williams et al.: Alpine Fault fractures and fault structure
Figure 12. Schematic cross sections through the Alpine Fault illustrating its hanging-wall structure. (a) Crustal-scale cross section illustrating
the flower-shaped geometry of the outer damage zone (after Townend et al., 2017). (b) A thrust section within the central section of the
Alpine Fault, depicting fracture network, its relationship to foliation, and the distribution of subsidiary faults. Respective position of DFDP-1
boreholes is also shown. Constructed from cross sections previously presented in Norris and Cooper (2007) and Sutherland et al. (2012).
displacement (Fig. 13b; Faulkner et al., 2011; Savage and damage zone” (Fig. 12; Townend et al. 2017). Microstruc-
Brodsky, 2011). tural and compositional analysis of these fractures indicates
Interpretations of damage zone width within the Alpine that they formed in response to wear and shearing of the wall
Fault’s hanging wall may therefore differ by an order of mag- rock and were subsequently mineralised due to circulation
nitude depending on what criteria are used. To reconcile this, of hydrothermal fluids (Warr and Cox, 2001; Williams et al.,
Townend et al. (2017) suggested that the ∼ 2 km wide inter- 2017a). Offset markers across gouge-filled fractures (particu-
val of enhanced permeability and foliation-parallel fractur- larly those < 1 cm thick) are rarely observed in DFDP-1 core
ing can be considered as an “outer damage zone” (Fig. 12). and field transects, but where they are present, reverse off-
Fractures within this zone may have formed by co-seismic set is most frequently noted (Fig. 8d; Norris and Cooper,
shaking and slip on critically stressed fractures (Cox et al., 1997; Toy et al., 2015). “Gouge-filled shears” that accommo-
2015; Townend et al., 2017), or by the release of confining dated strike slip (Norris and Cooper, 1997), normal dip slip
pressure (Engelder, 1985; Price, 1959; Zangerl et al., 2006) (Cooper and Norris, 1994), or a combination of both (Barth
during rapid exhumation (6–9 mm yr−1 ) of the hanging wall et al., 2012) have also been observed.
(Little et al., 2005; Tippett and Kamp, 1995). Rare gouge- Cooper and Norris (1994) interpreted that dip-slip frac-
filled fractures (< 1 fracture m−1 ) in this interval (e.g. Fig. 8e) tures facilitated imbrication, tectonic thickening, and rota-
may also be the structures accommodating the diffuse, low tion of Alpine Fault thrust sheets as they moved across the
to moderate magnitude (MW < 6) seismicity that has been irregular topography of the footwall gravels. Dextral shears
recorded in a ∼ 5 km wide zone within the Alpine Fault’s are interpreted to reflect the partitioning of strike-slip move-
hanging wall (Boese et al., 2012; Chamberlain et al., 2017; ment away from shallowly dipping PSZs (Barth et al., 2012).
Eberhart-Phillips, 1995). The diverse range of fracture orientations and shear senses
Conversely, the < 160 m wide zone with a relatively high in gouge-filled fractures therefore indicates complex internal
density of gouge-filled fractures defines a narrower “inner deformation of Alpine Fault thrust sheets at shallow depths
Solid Earth, 9, 469–489, 2018 www.solid-earth.net/9/469/2018/J. Williams et al.: Alpine Fault fractures and fault structure 481
Figure 13. (a) Compilation of estimates of the inner damage zone width on the Pacific Plate side of the Alpine Fault (red line) from four
creek sections in this study (Gaunt Creek, Stony Creek, Hare Mare Creek, and Havelock Creek). This is combined with other along-strike
estimates of damage zone thickness for the Pacific Plate side of the Alpine Fault: McKenzie Creek and Martyr River (Barth et al., 2013) and
Kaka Creek (Wright, 1998). (b) Log–log plot of fault zone thickness as a function of fault displacement previously presented in Savage and
Brodsky (2011), combined with estimates made for the Alpine Fault assuming footwall damage is no more extensive than in the hanging
wall. Displacement for the Alpine Fault is 480 km (Norris and Cooper, 2007; Wellman, 1953). However, convergence along the Alpine
Fault’s central section requires that it erodes its own fault rocks so these points are plotted to reflect only the brittle displacement the rocks
themselves have accommodated as they are exhumed through the seismogenic zone (22 km, Barth et al., 2012). Error bars reflect uncertainty
in constraining fault zone width (for example, footwall damage is largely unknown), not necessarily variability in fault zone thickness.
(< 500 m), as they facilitate transpressional motion under the Alpine Fault hanging wall. If this is true, it implies that the
influence of kilometre-scale along-strike variations in stress inner damage zone extends to depths of ∼ 8 km, consistent
induced by the topography (Norris and Cooper, 1995; Upton with the relatively high-temperature (< 400 ◦ C) mineralising
et al., 2017). phases (calcite and chlorite) present in the gouge-filled frac-
Fractures may have also formed due to dynamic off- tures (Williams et al., 2017a).
fault stresses (Ma, 2009; Rice et al., 2005) during MW > 7.5 Though the boundary between the mylonites and ultramy-
Alpine Fault earthquake ruptures (Sutherland et al., 2007). lonites is also ∼ 100 m from the Alpine Fault (Norris and
The relatively thin seismogenic crust in the Alpine Fault’s Cooper, 2003; Toy et al., 2008), these two units have roughly
hanging wall (10 ± 2 km, Boese et al., 2012) will limit the similar seismic velocities (Adam et al., 2016; Allen et al.,
generation of dynamic co-seismic damage to within ∼ 100– 2017; Christensen and Okaya, 2007) and so are unlikely to
200 m of the fault (Ampuero and Mao, 2017). To the first channel FZGWs. We also note that since FZGWs are an in-
order, this is comparable to the width of the inner damage dicator of total fault zone width, our interpretation implies
zone reported here. that most of the Alpine Fault’s LVZ is located in its hang-
ing wall. Western province basement rocks to the west of the
5.3 Comparison to geophysical data Alpine Fault are rarely exposed (Lund Snee et al., 2014; Nor-
ris and Cooper, 2007), and so it remains unknown if its foot-
A 60–200 m wide low-velocity zone (LVZ) that extends to wall damage zone is indeed relatively narrow.
depths of ∼ 8 km has been documented around the Alpine That the FZGWs are not being channelled by the mar-
Fault from the detection and character of fault zone guided gins of the ∼ 2 km wide outer damage zone leads us to con-
waves (FZGWs; Eccles et al., 2015). FZGWs are commonly clude that this is a near-surface feature only (i.e. fractures
regarded as an in situ indicator of fault damage zone width are not kept open at depth by pressurised fluids). If cor-
(Ben-Zion and Sammis, 2003; Eberhart-Phillips et al., 1995; rect, this model of the Alpine Fault’s hanging-wall structure
Ellsworth and Malin, 2011; Li et al., 2014). Given the com- conforms to the expectations of fault zone flower structure
parable widths of the Alpine Fault LVZ (60–200 m) and the models, which predict a narrow inner damage zone that ex-
inner damage zone described here (100–160 m), we spec- tends through the seismogenic crust, surrounded by a wider
ulate that the inner damage zone may trap FZGWs in the
www.solid-earth.net/9/469/2018/ Solid Earth, 9, 469–489, 2018482 J. Williams et al.: Alpine Fault fractures and fault structure
zone of fractures at shallow depths at low confining pressures Code availability. The code to generate “unrolled” circumferential
(∼ < 3 km, Fig. 12; e.g. Finzi et al., 2009; Sylvester, 1988). CT images is available from the GFZ data service (https://doi.org/
10.5880/ICDP.5052.005, last access: 18 April 2018).
6 Conclusions
Data availability. In the Supplement, we include detailed field
Fracture orientations and densities in the foliated hanging maps and cross sections (Fig. S1), photos of outcrops used for
wall of the Alpine Fault’s central section were quantified quantifying fracture density (Fig. S2), a cross section through
in drill core from the DFDP-1, field transects in four creek the Amethyst Tunnel and location of boreholes (Fig. S3), and an
sections, and drill core recovered from the Amethyst Hydro example of AHP CT scans (Fig. S4). The following tables are
Project. At distances greater than approximately 160 m from also provided: a list of rotations applied to DFDP-1B core (Ta-
the Alpine Fault PSZs, open and foliation-parallel fractures ble S1), a summary of field transects including coordinates of
dominate. These are interpreted to form at low confining the field-measuring stations (Table S2), and estimates of the dis-
tance of field-measuring stations from the Alpine Fault for differ-
pressures in mechanically anisotropic schist and mylonites.
ent fault dips (Table S3). Lithological distribution and Alpine Fault
At distances less than ∼ 160 m from the PSZs, gouge-filled location are as per the University of Otago fault zone mapping
fractures with a wide range of orientations predominate. program, which is available at http://www.otago.ac.nz/geology/
Fracture density and orientation are locally influenced by research/structural-geology/alpine-fault/af-maps.html (last access:
changes in host rock lithology, but overall fracture density 18 April 2018). DFDP-1 and AHP CT scan “core logs” and CT-
is approximately constant at distances of up to ∼ 500 m from BHTV image comparison are available on the GFZ data ser-
the PSZs (Fig. 12). vice (https://doi.org/10.5880/ICDP.5052.004, last access: 18 April
Following Townend et al. (2017), we interpret that the 2018).
∼ 2 km wide zone of open foliation-parallel fractures within
the hanging wall represents an outer damage zone that forms
at low confining pressures and relatively shallow depths.
Conversely, the 160 m wide zone of gouge-filled fractures
represents an inner damage zone. The width of this zone
is similar to estimates for the LVZ around the Alpine Fault
made by fault zone guided waves. We therefore interpret that
the inner damage zone is the geological manifestation of the
LVZ, which, if true, implies that the inner damage zone also
extends to depths of ∼ 8 km. Overall, our interpretations are
compatible with a flower structure model for damage in the
Alpine Fault’s hanging wall, with a relatively narrow zone of
damage extending towards the base of the seismogenic crust,
which broadens upwards towards the surface.
Solid Earth, 9, 469–489, 2018 www.solid-earth.net/9/469/2018/J. Williams et al.: Alpine Fault fractures and fault structure 483
Appendix A: DFDP-1B core rotation methodology gether that spanned intervals of 5–30 m, prior to the match-
ing with BHTV imagery. This meant that only a single ro-
The technique employed to reorient core DFDP-1 here is tation was necessary for all core sections across the entire
similar to that described in Jarrard et al. (2001), Paulsen stitched interval, which could be based on identifying ∼ 20–
et al. (2002), and Shigematsu et al. (2014); however, in- 30 matching structures between the BHTV and unrolled core
stead of comparing DFDP-1 BHTV data to DMT CoreScan images.
system® unrolled core scans, we compare BHTV images to In DFDP-1, it was not possible to stitch unrolled CT
“unrolled” CT core images. The acquisition and interpreta- images of core section together as no prominent reference
tion of the DFDP-1 BHTV logs have been previously de- markers across different sections were identified. Conse-
scribed by Townend et al. (2013) and McNamara (2015). quently, each < 1 m long core section had to be reoriented in-
DFDP-1 CT scans consist of a stack of core-axial perpendic- dividually, within which we never identified more than three
ular image slices with a pixel size of 0.244 mm and a spac- matching structures. Therefore, compared to the methodol-
ing of 1 mm. The CT stack for each core section was loaded ogy described by Jarrard et al. (2001), the degree of confi-
into Fiji (http://fiji.sc/Fiji, last access: 18 April 2018) and a dence on the applied reorientation was strongly dependent
circle was manually defined around the irregular boundary on the quality of individual matches for each core section
of drill core in a core axial-perpendicular image slice using and the range of rotations that they indicated. We recorded
the code available at Mills and Williams (2017). This circle this qualitatively for each core section using the scheme out-
was then used to define the path of the image in all other lined below.
slices. Generation of the unrolled images accounts for the
fact that the spacing between individual CT slices (1 mm, i.e. – High degree of confidence: images matched with one
the core-axial parallel pixel size) is greater than the pixel size very prominent structure (e.g. Fig. 4d) or with two or
within the slices (0.244 mm). Drill core outer surface images more structures whose ranges of suggested rotations are
and BHTV images are reflections of each other. Therefore, within 10◦ of each other (Fig. 4b and c).
the drill core images were reflected about the borehole axis
– Moderate degree of confidence: images matched with
so that the two images are directly comparable. This tech-
one prominent feature, two features that indicate rota-
nique has benefits over methods using the DMT CoreScan
tions that range 10–19◦ (e.g. Fig. 4a), or three features
system® , since drill core does not have to be physically ro-
whose ranges of suggested rotations are within 20–30◦
tated and so can be used without the risk of damaging fragile
of each other.
core sections.
Unrolled CT images were imported into the composite log – Low degree of confidence: images matched with one
viewing software WellCAD® (https://www.alt.lu/software. feature or two features whose ranges of suggested ro-
htm, last access: 18 April 2018) along with the BHTV im- tations are within 20–30◦ of each other.
ages, where they are placed side by side to allow matching
of structures (Fig. 4; see also Williams et al., 2017b). When In this scheme, a core reorientation is deemed unreliable
correlating the two datasets, it was first necessary to account if the range of rotations suggested by different structures
for possible depth shifts between recorded drill-core depths is ≥ 30◦ , i.e. equivalent to the cumulative effect of possi-
and BHTV imagery due to factors such as stretching of the ble errors listed above. For those core sections where more
logging cable and intervals from which no drill core was re- than one matching structure was identified, the rotation that
covered (Haggas et al., 2001; Jarrard et al., 2001). In this was applied was derived from the average of that required
study, a depth shift of no more than ±30 cm was allowed. for each match. If one of the matched structures was more
The orientation of fractures in the DFDP-1 CT images had prominent, then the applied rotation was biased towards that
previously been measured within a local core reference frame structure.
(see Fig. 4 in Williams et al., 2016). Since the DFDP-1 bore-
holes were vertical, corrections to reorient the drill core back
into a geographic reference frame required only a single rota-
tion about the core axis to correct for the dip direction. When
correlating structures, errors may be introduced by (1) the
internal BHTV magnetometer (±2◦ ), (2) the manual picking
of sinusoidal curves on BHTV and unrolled CT images that
can be ±10◦ for shallowly dipping (< 30◦ ) structures (Jar-
rard et al., 2001), and (3) the fact that the DFDP-1B BHTV
data imaged the open borehole, which has a larger diameter
(127 mm) than the drill core (85 mm). To mitigate against
the cumulative effect of these errors, Jarrard et al. (2001)
stitched unrolled images of many different core sections to-
www.solid-earth.net/9/469/2018/ Solid Earth, 9, 469–489, 2018484 J. Williams et al.: Alpine Fault fractures and fault structure
Appendix B: DFDP-1B core rotation validity The recognition of fractures in unrolled CT images that are
not observed in BHTV can be readily explained by the higher
Based on the criteria presented in Appendix A, of the 40 resolution of the CT images. However, structures are also
core sections from DFDP-1B in which there was suitable observed in the BHTV logs but not interpreted as fractures
quality of unrolled CT and BHTV images to attempt reori- in the CT images (Fig. 4). This may represent noise in the
entation (Fig. 3), 31 were reoriented (Table S1). Prior to re- BHTV images, or in the case of foliation-parallel structures,
orientation, fractures in these sections exhibit no clustering the ultramylonitic foliation itself since it can be difficult to
(Fig. B1a); however, a weak one does develop after reori- differentiate these structures. The subordinate north-dipping
entation (Fig. 5a). Since fractures in nature typically exhibit set of fractures in the BHTV images (Fig. 5b) is not recog-
non-random orientations, this is evidence that the reorienta- nised in the orientations gathered from CT images (Fig. 5a).
tion of the CT scans was successful (Kulander et al., 1990; A similar north-dipping fracture set was also recognised in
Paulsen et al., 2002). In addition, fractures within some indi- DFDP-2B BHTV images (Massiot, 2017), and their causa-
vidual core sections (Fig. B1b) and fractures rotated based on tion and relevance are the focus of ongoing work.
a high degree of confidence (Fig. B1c) contain a wide range
of orientations.
Figure B1. Stereoplots to tests the confidence in reorientations applied to rotate DFDP-1 CT scan fracture orientations into geographic
coordinates. Red great circle and diamond in each plot represent the plane and pole to the Alpine Fault orientation measured in DFDP-
1B. Plotted with Kamb contours with intervals of 2 standard deviations. (a) Orientation of fractures shown in Fig. 5a before rotation, (b)
orientation of reoriented fractures within a single core section (DFDP-1B 56-2), and (c) orientation of fractures in CT images from core
sections that were oriented with a high degree of confidence with BHTV images.
Solid Earth, 9, 469–489, 2018 www.solid-earth.net/9/469/2018/J. Williams et al.: Alpine Fault fractures and fault structure 485
The Supplement related to this article is available online Ben-Zion, Y. and Sammis, C. G.: Characterization of
at https://doi.org/10.5194/se-9-469-2018-supplement. Fault Zones, Pure Appl. Geophys., 160, 677–715,
https://doi.org/10.1007/PL00012554, 2003.
Berg, S. S. and Skar, T.: Controls on damage zone asymme-
try of a normal fault zone: Outcrop analyses of a segment
of the Moab fault, SE Utah, J. Struct. Geol., 27, 1803–1822,
Competing interests. The authors declare that they have no conflict https://doi.org/10.1016/j.jsg.2005.04.012, 2005.
of interest. Bistacchi, A., Massironi, M., and Menegon, L.: Three-dimensional
characterization of a crustal-scale fault zone: The Pusteria and
Sprechenstein fault system (Eastern Alps), J. Struct. Geol., 32,
Acknowledgements. DFDP-1 was funded by GNS Science; 2022–2041, https://doi.org/10.1016/j.jsg.2010.06.003, 2010.
Victoria University of Wellington; the University of Otago; the Bistacchi, A., Massironi, M., Menegon, L., Bolognesi, F., and
University of Auckland; the University of Canterbury; Deutsche Donghi, V.: On the nucleation of non-Andersonian faults along
Forschungsgemeinschaft and the University of Bremen; Natu- phyllosilicate-rich mylonite belts, Geol. Soc. London, Spec.
ral Environment Research Council grants NE/J024449/1, NE/ Publ., 367, 185–199, https://doi.org/10.1144/sp367.13, 2012.
G524160/1 and NE/H012486/1 and the University of Liverpool; Boese, C. M. M., Townend, J., Smith, E., and Stern, T.: Micro-
and the Marsden Fund of the Royal Society of New Zealand. seismicity and stress in the vicinity of the Alpine Fault, cen-
The International Continental Scientific Drilling Program, ICDP tral Southern Alps, New Zealand, J. Geophys.-Res.-Sol. Ea., 117,
(www.icdp-online.org) provided extensive support. Jack N. B02302, https://doi.org/10.1029/2011JB008460, 2012.
Williams was supported by a University of Otago Doctoral Boulton, C., Yao, L., Faulkner, D. R., Townend, J., Toy, V.
Scholarship. We thank Matthew Parris at the Oncology Department G., Sutherland, R., Ma, S., and Shimamoto, T.: High-
at Dunedin Hospital, and Darren Tod at the Southern Cross velocity frictional properties of Alpine Fault rocks: Me-
Hospital, Wellington, for support in collecting CT scans of DFDP-1 chanical data, microstructural analysis, and implications
Amethyst Hydro Project drill core, respectively. Katrina Sauer, Ben for rupture propagation, J. Struct. Geol., 97, 71–92,
Melosh, and Astrid Vetrhus provided field assistance. Comments https://doi.org/10.1016/j.jsg.2017.02.003, 2017.
by Tim Little and Tom Blenkinsop, and by two anonymous re- Boulton, C. J., Carpenter, B. M., Toy, V., and Marone, C.: Physi-
viewers on an earlier version of the manuscript, improved this paper. cal properties of surface outcrop cataclastic fault rocks, Alpine
Fault, New Zealand, Geochem., Geophy. Geosy., 13, Q01018,
Edited by: Bernhard Grasemann https://doi.org/10.1029/2011GC003872, 2012.
Reviewed by: Tim Little and Thomas Blenkinsop Caine, J. S., Evans, J. P., and Forster, C. B.: Fault zone architecture
and permeability structure, Geology, 24, 1025–1028, 1996.
Chamberlain, C. J., Boese, C. M., and Townend, J.: Cross-
correlation-based detection and characterisation of microseis-
References micity adjacent to the locked, late-interseismic Alpine Fault,
South Westland, New Zealand, Earth Planet. Sci. Lett., 457, 63–
Adam, L., Toy, V., and Boulton, C.: Mylonites as shales? Experi- 72, https://doi.org/10.1016/j.epsl.2016.09.061, 2017.
mental observations of P-wave anisotropy dependence on miner- Chester, F. M. and Chester, J. S.: Stress and deformation
alogy, layering and scale, in: SEG Technical Program Expanded along wavy frictional faults, J. Geophys. Res., 105, 23421,
Abstracts 2016, 3169–3173, Society of Exploration Geophysi- https://doi.org/10.1029/2000JB900241, 2000.
cists, 2016. Chester, F. M. and Logan, J. M.: Implications for mechanical prop-
Allen, M. J., Tatham, D., Faulkner, D. R., Mariani, E., and Boul- erties of brittle faults from observations of the Punchbowl fault
ton, C.: Permeability and seismic velocity and their anisotropy zone, California, Pure Appl. Geophys. PAGEOPH, 124, 79–106,
across the Alpine Fault, New Zealand: An insight from labora- https://doi.org/10.1007/BF00875720, 1986.
tory measurements on core from the Deep Fault Drilling Project Chester, F. M., Evans, J. P., and Biegel, R. L.: Internal structure and
phase 1 (DFDP-1), J. Geophys.-Res.-Sol. Ea., 122, 6160–6179, weakening mechanisms of the San Andreas Fault, J. Geophys.
https://doi.org/10.1002/2017JB014355, 2017. Res., 98, 771, https://doi.org/10.1029/92JB01866, 1993.
Ampuero, J. P. and Mao, X.: Upper limit on damage zone thickness Chester, J. S. and Fletcher, R. C.: Stress distribution and failure in
controlled by seismogenic depth, Fault Zo. Dyn. Process. Evol. anisotropic rock near a bend on a weak fault, J. Geophys. Res.-
Fault Prop. Dur. Seism. Rupture, 227, 243–253, 2017. Earth, 102, 693–708, https://doi.org/10.1029/96JB02791, 1997.
Andrews, D. J.: Rupture dynamics with energy loss out- Choi, J. H., Edwards, P., Ko, K., and Kim, Y. S.: Definition
side the slip zone, J. Geophys.-Res.-Sol. Ea., 110, 1–14, and classification of fault damage zones: A review and a
https://doi.org/10.1029/2004JB003191, 2005. new methodological approach, Earth-Science Rev., 152, 70–87,
Barth, N. C., Toy, V. G., Langridge, R. M., and Norris, R. J.: Scale https://doi.org/10.1016/j.earscirev.2015.11.006, 2016.
dependence of oblique plate-boundary partitioning: New insights Christensen, N. I. and Okaya, D. A.: Compressional and shear wave
from LiDAR, central Alpine fault, New Zealand, Lithosphere, 4, velocities in South Island, New Zealand rocks and their appli-
435–448, https://doi.org/10.1130/L201.1, 2012. cation to the interpretation of seismological models of the New
Barth, N. C., Boulton, C., Carpenter, B. M., Batt, G. E., and Toy, V. Zealand crust, A Cont. Plate Bound. Tectonics South Island, New
G.: Slip localization on the southern Alpine Fault New Zealand, Zeal., 123–155, 2007.
Tectonics, 32, 620–640, https://doi.org/10.1002/tect.20041,
2013.
www.solid-earth.net/9/469/2018/ Solid Earth, 9, 469–489, 2018You can also read


