Coral-reef-derived dimethyl sulfide and the climatic impact of the loss of coral reefs
←
→
Page content transcription
If your browser does not render page correctly, please read the page content below
Atmos. Chem. Phys., 21, 5883–5903, 2021
https://doi.org/10.5194/acp-21-5883-2021
© Author(s) 2021. This work is distributed under
the Creative Commons Attribution 4.0 License.
Coral-reef-derived dimethyl sulfide and the climatic
impact of the loss of coral reefs
Sonya L. Fiddes1,2,3,a , Matthew T. Woodhouse3 , Todd P. Lane4 , and Robyn Schofield4
1 Australian-German Climate and Energy College, University of Melbourne, Parkville, Australia
2 ARC Centre of Excellence for Climate System Science, School of Earth Sciences,
University of Melbourne, Parkville, Australia
3 Climate Science Centre, Oceans and Atmosphere, Commonwealth Scientific and Industrial
Research Organisation, Aspendale, Australia
4 ARC Centre of Excellence for Climate Extremes, School of Earth Sciences,
University of Melbourne, Parkville, Australia
a now at: Australian Antarctic Program Partnership, Institute of Marine and Antarctic Studies,
University of Tasmania, Hobart, Australia
Correspondence: Sonya L. Fiddes (sonya.fiddes@utas.edu.au)
Received: 9 October 2020 – Discussion started: 27 October 2020
Revised: 3 March 2021 – Accepted: 17 March 2021 – Published: 20 April 2021
Abstract. Dimethyl sulfide (DMS) is a naturally occurring sponses are found to have no robust effect on regional climate
aerosol precursor gas which plays an important role in the via direct and indirect aerosol effects. This work emphasises
global sulfur budget, aerosol formation and climate. While the complexities of the aerosol–climate system, and the limi-
DMS is produced predominantly by phytoplankton, recent tations of current modelling capabilities are highlighted, in
observational literature has suggested that corals and their particular surrounding convective responses to changes in
symbionts produce a comparable amount of DMS, which aerosol. In conclusion, we find no robust evidence that coral-
is unaccounted for in models. It has further been hypothe- reef-derived DMS influences global and regional climate.
sised that the coral reef source of DMS may modulate re-
gional climate. This hypothesis presents a particular concern
given the current threat to coral reefs under anthropogenic
climate change. In this paper, a global climate model with 1 Introduction
online chemistry and aerosol is used to explore the influence
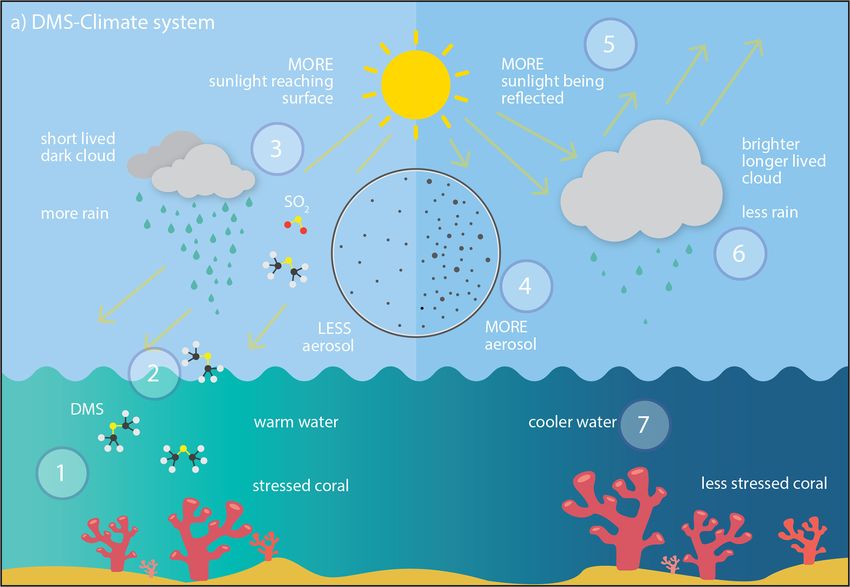
of coral-reef-derived DMS on atmospheric composition and Marine organisms (phytoplankton, algae) are known to pro-
climate. A simple representation of coral-reef-derived DMS duce the chemical dimethyl sulfoniopropionate (DMSP). In
is developed and added to a common DMS surface water cli- the ocean, DMSP experiences enzymatic cleavage, forming
matology, resulting in an additional flux of 0.3 Tg yr−1 S, or dimethyl sulfide (DMS; Yoch, 2002; see Fig. 1, point 1),
1.7 % of the global sulfur flux from DMS. By comparing the which can then be released into the atmosphere (2). At-
differences between both nudged and free-running ensem- mospheric DMS (DMSa ) can undergo a series of chemical
ble simulations with and without coral-reef-derived DMS, reactions to become a sulfate aerosol (3). When in suffi-
the influence of coral-reef-derived DMS on regional climate ciently large abundance (4), these sulfate aerosols can im-
is quantified. In the Maritime Continent–Australian region, pact aerosol loading and cloud properties, altering the ra-
where the highest density of coral reefs exists, a small de- diation budget directly (5) and indirectly (6) and having a
crease in nucleation- and Aitken-mode aerosol number con- cooling effect (7). This effect has been hypothesised to form
centration and mass is found when coral reef DMS emis- a short-term bioregulatory negative feedback system, known
sions are removed from the system. However, these small re- as the CLAW (Charlson, Lovelock, Andreae and Warren) hy-
pothesis (Charlson et al., 1987), whereby marine organisms
Published by Copernicus Publications on behalf of the European Geosciences Union.
5884                                                                    S. L. Fiddes et al.: Influence of coral reefs on climate

can alter their environment when stressed. This hypothesis          (Swan et al., 2012; Fischer and Jones, 2012; Hopkins et al.,
remains unproven, and arguments against it cite the com-            2016; Swan et al., 2017). Of interest to this study are the
plexity and non-linearity of the DMS–climate system (Quinn          findings from Hopkins et al. (2016), where the effect of tidal
and Bates, 2011; Green and Hatton, 2014). Nevertheless, at          exposure on three Indo-Pacific coral species was studied in
longer timescales, global modelling studies have shown that         laboratory experiments. From their results, Hopkins et al.
marine-derived DMS plays an important role in maintaining           (2016) extrapolate a fluxDMS of 9–35 µmol m−2 d−1 over
the current large-scale climate (Thomas et al., 2010; Wood-         coral reefs from Acropora cf. horrida, while an additional 5
house et al., 2010; Gabric et al., 2013; Mahajan et al., 2015),     and 8 µmol m−2 d−1 can be estimated from two other species
providing global cooling via direct and indirect aerosol ef-        in their experiments (P. cylindrica and S. hystrix.). These es-
fects of up to 0.45 ◦ C (Fiddes et al., 2018) when compared         timates are equivalent to a total of 709–1548 µg m−2 d−1 of
to a world in which no marine DMS exists. Our previous              sulfur (if all species are present) and in this work is further
paper (Fiddes et al., 2018) describes these studies, DMS sur-       extrapolated to global coral reef coverage (approximately
face water climatologies and flux parameterisations in more         284 300 km2 ), giving 0.074–0.16 Tg yr−1 of sulfur. Whilst
detail.                                                             these extrapolations are highly speculative in terms of arti-
   Many global DMS–climate modelling studies have also              ficial laboratory experiments, estimated exposure time and
considered DMS under future scenarios (Bopp et al., 2004;           coverage of coral reefs, and they account for just three Indo-
Gabric et al., 2004; Kloster et al., 2007; Cameron-Smith            Pacific species of coral and only DMS produced during tidal
et al., 2011; Six et al., 2013; Grandey and Wang, 2015;             stress, the Hopkins et al. (2016) estimations were the first to
Schwinger et al., 2017). However, considering our under-            attempt to quantify the large-scale flux of coral-reef-derived
standing of DMS in the current climate remains uncertain,           DMS.
the aforementioned studies do not provide a clear consen-              Following these observed results, numerous studies have
sus on how DMS production may respond to a warming cli-             made links to coral DMS, aerosol formation, cloud cover
mate. With this in mind, better knowledge of current sources        and/or sea surface temperatures (SSTs) (Modini et al., 2009;
of DMS is important to further our understanding of DMS–            Deschaseaux et al., 2012; Leahy et al., 2013; Swan et al.,
climate interaction now and into the future.                        2017; Jones et al., 2017; Cropp et al., 2018; Jackson et al.,
   One such source of DMS that is currently unaccounted             2018, 2020b). Jones (2013), Jones et al. (2017) and Cropp
for in climate modelling is coral reefs. Recent studies have        et al. (2018) further suggest that coral reefs participate in
shown that corals, coral symbionts, and coral by-products           bioregulatory feedback as suggested by the CLAW hypothe-
(e.g. mucus) produce large amounts of DMSP (Broad-                  ses. Most of these studies do not explicitly account for the
bent et al., 2002; Broadbent and Jones, 2004; Jones and             complexity of the DMS–climate system and its significant
Trevena, 2005; Jones et al., 2007; Burdett et al., 2015;            non-linearities (see Thomas et al., 2011; Quinn and Bates,
Jackson et al., 2020a). Of note for this work, Jones et al.         2011; Green and Hatton, 2014; Fiddes et al., 2018). In addi-
(2018) have summarised reports of fluxDMS values of 0–              tion, deducing a climatic impact of one aerosol species using
4906 µg m−2 d−1 and a mean of 205 µg m−2 d−1 in summer              observations alone is fraught with co-varying and confound-
and 0.6–481 µg m−2 d−1 with a mean of 77 µg m−2 d−1 over            ing influences from other aerosol species. These complexities
winter over the Great Barrier Reef (GBR). Jones et al. (2018)       can only be addressed through modelling studies; however
also suggest that total emissions from the GBR are equivalent       no modelling study has included coral-reef-derived DMS as
to 0.02 Tg yr−1 of sulfur, noting that total global sulfur flux     a source of sulfur to date.
from DMS is estimated to be between 9–35 Tg yr−1 (Belviso              To add urgency to this problem, coral reef ecosystems
et al., 2004; Elliott, 2009; Woodhouse et al., 2010; Tesdal         globally are facing dire risk due to anthropogenic climate
et al., 2016; Fiddes et al., 2018) and that DMS makes up            change (Hughes et al., 2017, 2018). The IPCC special re-
approximately one-fifth of the global sulfur budget (Sheng          port on climate change (IPCC, 2018) states that under 1.5 ◦ C
et al., 2015). The Jones et al. (2018) coral reef flux estimation   warming, 70 %–90 % of coral reefs will be extinct. The risk
has been made from measurements both over coral reefs and           to coral reefs is twofold; increasing sea surface tempera-
in the GBR lagoon and also includes an estimate of the addi-        tures are causing more frequent mass coral bleaching events
tional flux from tropical cyclones. The tropical cyclone emis-      (Hughes et al., 2017; King et al., 2017), whilst increas-
sion has been calculated (not observed) using the Liss and          ing ocean acidification is causing reduced calcification and
Merlivat (1986) flux parameterisation, taking into account          growth of coral species (Hoegh-Guldberg et al., 2017; Mag-
average wind speeds of tropical cyclones and accounting for         nan et al., 2016). Whilst the death of global coral reefs due
approximately five cyclone days per year in the region. How-        to anthropogenic climate change will have clear impacts on
ever, we note that many parameterisations overestimate the          the ecosystems (Plaisance et al., 2011) and economies (De-
DMS flux (fluxDMS ) at high wind speeds.                            loitte Access Economics, 2017; Spalding et al., 2017) they
   In addition, recent work has shown a sensitivity of DMS          support, a lesser known, and as of yet unquantified, impact is
production by corals when stressed due to tidal exposure,           on the climate itself.
warming temperatures, rainfall events and light exposure

Atmos. Chem. Phys., 21, 5883–5903, 2021                                              https://doi.org/10.5194/acp-21-5883-2021
S. L. Fiddes et al.: Influence of coral reefs on climate                                                                           5885

Figure 1. Schematic diagram describing the DMS–climate system. The numbers are described in detail in the text. Graphics designed by
Georgina Harmer.

   In light of these recent studies and the current threat to       Table 1. The four modal size distributions used by GLOMAP-
coral reefs, we raise the following questions: what is the in-      mode.
fluence of coral-reef-derived DMS on climate, including its
influence on aerosol production and cloud formation, and                  Mode                             Particle dry diameter
what implications does mass coral extinction have for the cli-                                                        range (nm)
mate? To address these questions, we use a global climate–                Nucleation (soluble)                              500
global and regional climate.

                                                                    (Aitken) (Mann et al., 2010, 2012). The size distributions of
2     Methods                                                       these modes are shown in Table 1.
                                                                       GLOMAP-mode simulates coagulation (Seinfeld and Pan-
2.1    ACCESS-UKCA description                                      dis, 1998; Spracklen et al., 2005), condensation of H2 SO4
                                                                    and secondary organics (Fuchs and Sutugin, 1971), new par-
The coupled climate–chemistry model ACCESS-UKCA                     ticle formation of sulfate aerosol in the free troposphere via
(Australian Community Climate and Earth System                      binary homogeneous nucleation (Kulmala et al., 1998) and
Simulator–United Kingdom Chemistry and Aerosol) is                  organic-mediated boundary layer nucleation (Metzger et al.,
used in this work to quantify the importance of global              2010). Aqueous chemistry calculates the dissolution of SO2
coral-reef-derived sulfur. The ACCESS-UKCA physical                 and H2 O2 into cloud droplets within the soluble accumu-
atmospheric model is based on the Global Atmosphere 4.0             lation and coarse modes (Mann et al., 2010), and aerosol
configuration of the Unified Model at Version 8.4 (Walters          dry deposition is calculated following Slinn (1982), Zhang
et al., 2014), and the UKCA model includes the state-of-the-        (2001) and Binkowski and Shankar (1995). GLOMAP-mode
art GLObal Model of Aerosol Processes (GLOMAP)-mode                 includes particle compositions of sulfate, sea salt and ele-
scheme (Mann et al., 2010, 2012). GLOMAP-mode is a                  mental and organic carbon (Mann et al., 2010).
two-moment microphysical aerosol scheme that simulates                 The Lana et al. (2011) DMS surface water concentra-
aerosol mass and number distributions across four soluble           tion (DMSw ) climatology is used in this work. Lana et al.
modes (corresponding to nucleation, Aitken, accumulation            (2011) (and before that Kettle et al., 1999; Kettle and An-
and coarse modes) and, in this work, one insoluble mode             dreae, 2000) used a global database of observations (Kettle

https://doi.org/10.5194/acp-21-5883-2021                                             Atmos. Chem. Phys., 21, 5883–5903, 2021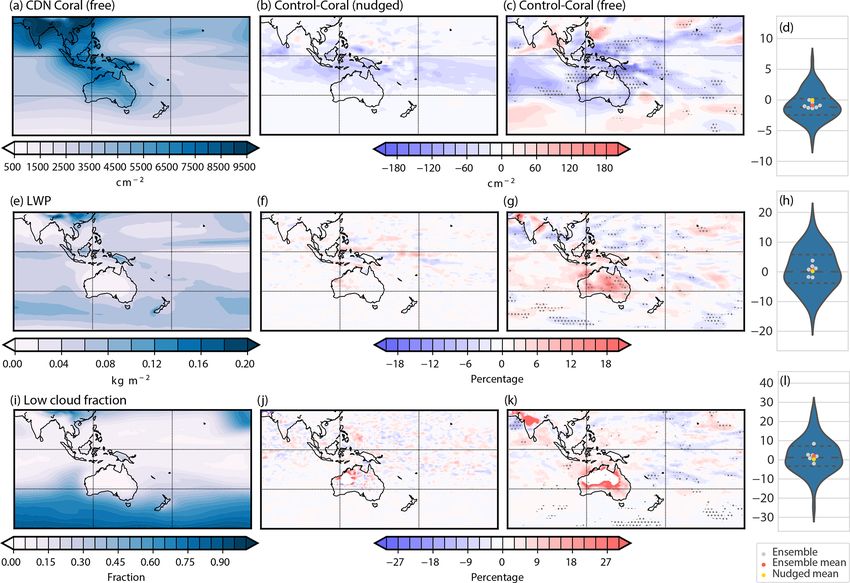
5886                                                                   S. L. Fiddes et al.: Influence of coral reefs on climate

Table 2. The oxidative pathways relevant to DMS in ACCESS-
UKCA as defined in Pham et al. (1995).

       DMS + OH → SO2 + CH3 O2 + HCHO
       DMS + OH → 0.6SO2 + 0.4DMSO + CH3 O2
       DMS + NO3 → SO2 + HNO3 + CH3 O2 + HCHO
       DMSO + OH → 0.6SO2 + 0.4MSA
       SO2 + OH → H2 SO4 + HO2

et al., 1999) to derive a gridded global DMSw climatology
via a piecewise cubic Hermite interpolation technique over
54 well-defined biogeographic ocean provinces. This clima-
tology is the standard for most global climate modelling stud-
                                                                 Figure 2. The areal fraction of each ACCESS-UKCA grid box cov-
ies and is discussed in more detail in Fiddes et al. (2018).     ered by warm water coral reefs as indicated by UNEP-WCMC et al.
   In this work, as in Fiddes et al. (2018), the Liss and Mer-   (2010).
livat (1986) fluxDMS parameterisation is used, and a full de-
scription of this scheme can be found in Fiddes et al. (2018).
Detailed discussion about fluxDMS parameterisation choices       2.2    DMS climatologies
and sensitivities can also be found in Fiddes et al. (2018).
In short, the Liss and Merlivat (1986) scheme calculates the     We have developed a DMS surface water concentration
fluxDMS under three wind-induced sea states representing         (DMSw ) climatology based on Lana et al. (2011), in which
smooth (10 m wind speeds less than 3.6 m s−1 ) and rough         additional DMSw over coral reef regions is included. To de-
(10 m wind speeds between 3.6 and 13 m s−1 ) gas transfer as     termine the amount of DMSw to be added to the Lana et al.
well as wave breaking and bubble bursting (10 m wind speeds      (2011) climatology, we first needed to know where coral
greater than 13 m s−1 ). Liss and Merlivat (1986) is consid-     reefs were located globally. The UNEP-WCMC et al. (2010)
ered a conservative parameterisation and was chosen for this     global coral reef distribution database was used to calculate
work based on recommendations by Vlahos and Monahan              the fraction of each ACCESS-UKCA grid box covered by
(2009) and Bell et al. (2017) that suggest many parameteri-      coral reefs. The UNEP-WCMC et al. (2010) database is the
sation overestimate the fluxDMS .                                most comprehensive global database of warm water coral
   With online chemistry, ACCESS-UKCA includes four key          reefs, 85 % of which was drawn from the Millennium Coral
oxidative pathways to convert DMS into SO2 , which are           Reef Mapping Project, a remote sensing project at spatial res-
shown in Table 2. SO2 can then be further oxidised into          olutions of up to 30 m.
H2 SO4 (Table 2), after which it can contribute to aerosol          The gridded areal distribution drawn from the coral reef
growth or new particle formation. Description of these pro-      database, shown in Fig. 2, was then used to weight a fixed
cesses can be found in Mann et al. (2010).                       concentration of DMSw to be added to the Lana et al. (2011)
   Anthropogenic emissions, pre- and post-2000 respectively,     DMSw climatology. For example, the maximum fraction in
are provided by Lamarque et al. (2010) and van Vuuren et al.     any grid box found in Fig. 2 is 15.6 % in the northern GBR.
(2011) and biomass emissions by van der Werf et al. (2017).      In this study, we used 50 nM as the fixed concentration (a
Emissions of other species (biogenic, primary aerosol) are       number of different DMSw concentrations were tested, from
described in Woodhouse et al. (2015). SSTs and sea ice are       10 to 500 nM). Therefore, at this grid box, with the high-
prescribed following the Atmospheric Model Intercompari-         est density of coral reefs, the amount of DMSw added to
son Project (AMIP) method (Taylor et al., 2015). The UKCA        the Lana et al. (2011) climatology as a coral reef source is
is coupled to the ACCESS model via the radiation scheme          0.156 × 50 = 7.8 nM. The choice of 50 nM was somewhat
and the large-scale cloud and precipitation schemes; both the    subjective, in part due to the relatively few estimations of
direct and indirect aerosol forcing are modelled. ACCESS-        large-scale coral reef production of DMSw , as described in
UKCA has a resolution of 1.25◦ latitude × 1.875◦ longitude       Sect. 1. Nevertheless, below we describe how this choice
with 85 vertical levels. Where the model is nudged, ERA-         aligns with observations found in the literature. In addition,
Interim (Dee et al., 2011) is used at 6-hourly intervals (via    we made a conscious choice to create a climatology that rep-
horizontal wind components and potential temperature; see        resents a plausible maximum DMSw in an attempt to ensure
Sect. 2.3 for more details). Further model details and evalua-   a response to this perturbation. We note that at this initial
tion are available in Fiddes et al. (2018).                      stage, the DMSw climatology developed here does not vary
                                                                 in time beyond that of the monthly Lana et al. (2011) dataset.
                                                                    The weighted addition of 50 nM of DMSw caused a global
                                                                 mean increase of 0.03 nM and an additional fluxDMS of

Atmos. Chem. Phys., 21, 5883–5903, 2021                                            https://doi.org/10.5194/acp-21-5883-2021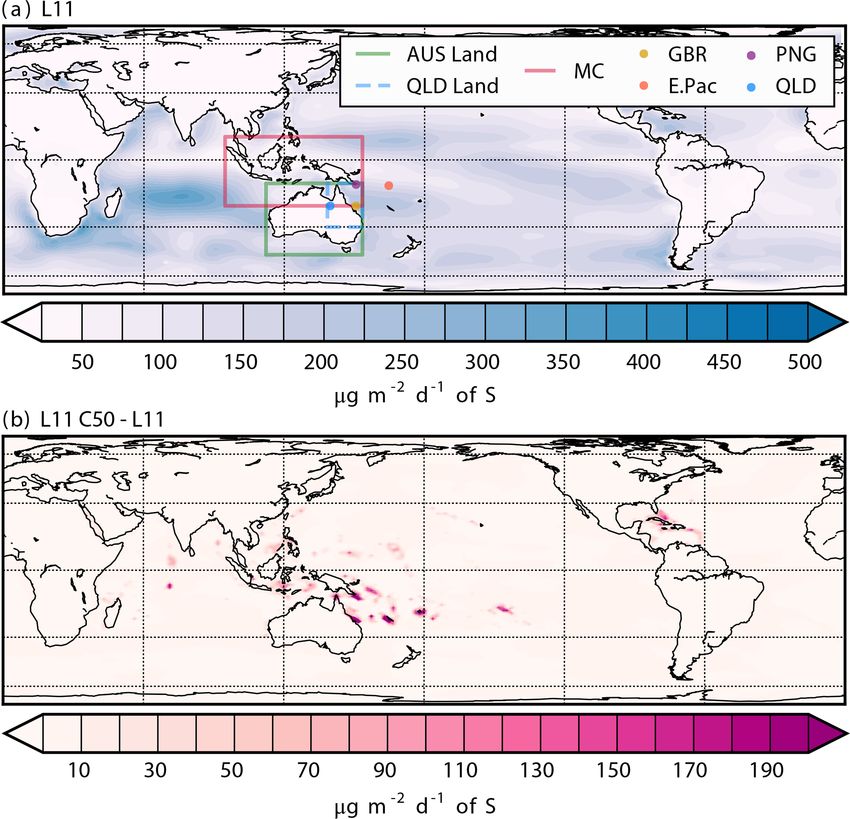
S. L. Fiddes et al.: Influence of coral reefs on climate                                                                          5887

                                                                      in the atmosphere were found, it would not be because the
                                                                      additional coral reef DMS was too small.

                                                                      2.3   Experiment set-up

                                                                      To study the impact of coral-reef-derived DMS in ACCESS-
                                                                      UKCA, two sets of simulations were performed: nudged and
                                                                      free-running. In both sets of simulations, a control (using
                                                                      the Lana et al., 2011, climatology, referred to as L11) and
                                                                      experimental simulation (using the Lana et al., 2011, clima-
                                                                      tology with additional coral and hereafter referred to as the
                                                                      L11C50 simulation) were completed. The nudged simula-
                                                                      tions follow the methods described by Fiddes et al. (2018),
                                                                      in which the control and coral simulations were nudged to
                                                                      the ERA-Interim dataset (Dee et al., 2011) in the free tropo-
                                                                      sphere at 6-hourly intervals using horizontal winds and po-
                                                                      tential temperature. We note that by nudging the model, we
                                                                      limit the model’s ability to respond to the DMS flux perturba-
                                                                      tions. However, nudged simulations, by restricting meteoro-
                                                                      logical feedbacks, give us an indication as to which responses
Figure 3. (a) The fluxDMS (in µg m−2 d−1 S) based on the Lana         are purely dynamical as opposed to those that may in fact be
et al. (2011) DMSw climatology and (b) the additional fluxDMS in      caused directly by DMS perturbations.
the climatology with added coral-reef-derived DMSw . In panel (a)        In the second set-up, the model was allowed to freely run,
the Maritime Continent–Australian region is shown by a red box,       with no nudging applied. In both sets of simulations, SSTs
the Australian land-only region by a green box and the Queensland
                                                                      are prescribed. Without nudging, feedbacks from the mete-
(QLD) land-only region by a blue box. Additionally, four single
points used for analysis are shown over the Great Barrier Reef (GBR
                                                                      orology, such as changes in wind fields, are able to mani-
– yellow), Papua New Guinea (PNG – pink), the eastern Pacific         fest within the model. In the free-running simulations, much
(E.Pac – orange) and QLD (blue).                                      greater model variability manifested, and differentiating be-
                                                                      tween a true signal from the perturbed DMS field and internal
                                                                      model variability was difficult. For this reason, seven simula-
                                                                      tions (for both the L11 and L11C50), each of 10 years, were
0.3 Tg yr−1 S. The fluxDMS of the Lana et al. (2011) clima-
                                                                      performed with the free-running set-up to provide an ensem-
tology and the additional coral reef fluxDMS are shown in
                                                                      ble. Each set of simulations used different atmospheric ini-
Fig. 3. These increases do not impact the global sulfur bud-
                                                                      tial conditions from a previous nudged simulation, taken at
get, contributing only 1.7 % of additional sulfur to the global
                                                                      00:00 UTC on 1 January for 1996, 1998, 1999, 2000, 2001,
fluxDMS . The 50 nM climatology adds a mean of 0.74 nM
                                                                      2002 and 2003 (noting that 1997 was excluded as it was a
and a maximum of 7.8 nM to coral reef regions, values that
                                                                      strong El Niño year). Whilst this exercise was computation-
are within those found in the literature. The additional daily
                                                                      ally expensive, it was able to provide sufficient data to per-
fluxDMS simulated by ACCESS-UKCA over coral reefs,
                                                                      form statistical analyses.
shown in Fig. 3b (maximum of 621.9 µg m−2 d−1 S), is simi-
lar to that of the Hopkins et al. (2016) estimations of fluxDMS
due to three coral species in response to tidal stress (708.9–        2.4   Statistical analysis
1547.6 µg m−2 d−1 S). Furthermore, Jones et al. (2018) sug-
gest that the total fluxDMS from the GBR and surround-                The following regions were defined for statistical analy-
ing lagoon is approximately 0.002 Tg yr−1 S. If this number           sis: the Maritime Continent–Australian (MC-Aus) region
is extrapolated to global coral reef regions, then an annual          from 17.4◦ S to 10◦ N, 95.625 to 153.75◦ E; the Queens-
fluxDMS of 0.12 Tg yr−1 S is estimated. The values from the           land (QLD) land-only region from 30 to 10◦ S, 138.75 to
Hopkins et al. (2016) and Jones et al. (2018) estimations both        153.75◦ E; and the Australian land-only region from 45 to
suggest that the amount of DMSw attributed to coral reefs             10◦ S, 112.5 to 153.75◦ E. Four grid points were selected for
in this study is within the high end of what is currently ob-         analysis of aerosol size distribution: a location off the coast of
served.                                                               Papua New Guinea (PNG) at 10.5◦ S, 151◦ E; a point in the
   However, it is noted that the values stated here are averages      East Pacific (E.Pac) at 10.5◦ S, 165◦ E; a location over the
over large grid boxes and so likely overestimate the extent           GBR at 20◦ S, 151◦ E; and a point in inland QLD at 20◦ S,
of coral reef influence. Nevertheless, the 50 nM perturbation         140◦ E. These regions and points are shown in Fig. 3a. In ad-
was chosen in part to ensure that if no significant changes           dition the boundary of the South Pacific convergence zone

https://doi.org/10.5194/acp-21-5883-2021                                               Atmos. Chem. Phys., 21, 5883–5903, 2021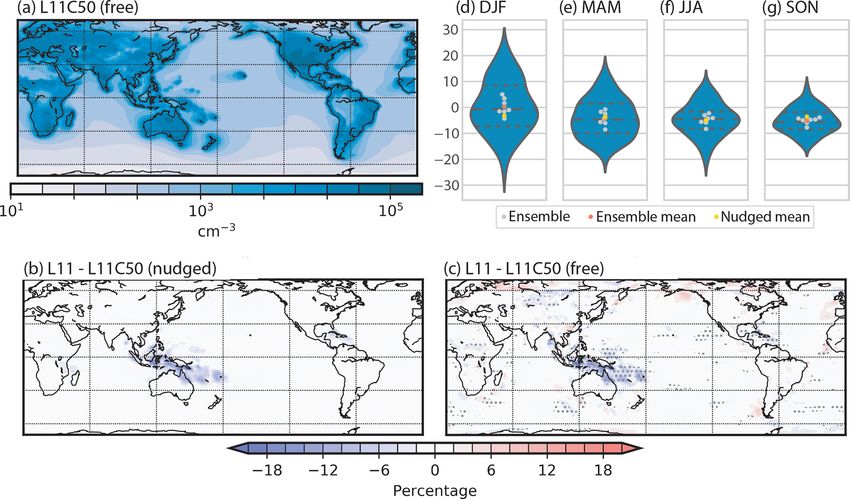
5888                                                                     S. L. Fiddes et al.: Influence of coral reefs on climate

(SPCZ) is defined as the area within the 6 mm d−1 or greater       implies that these areas of lower reef density are unlikely
precipitation threshold (Vincent et al., 2011).                    to have a significant impact on regional climate. In terms of
   To test the significance of differences in a given field, the   seasonality, Table 3 and Fig. 5d–g indicate less SO2 vari-
two-tailed Student T test (Wilks, 2011) and the respective         ability compared to DMSa throughout the year for both the
field significance (Wilks, 2011) are used. Both of these meth-     free and nudged simulations. MAM (March, April, May) has
ods have been evaluated at confidence levels of the 95th per-      the smallest, statistically insignificant change (−0.9 % and
centile (p < 0.05) unless otherwise stated. In addition to this,   −1.3 % for the free and nudged simulations respectively),
ensemble agreement, where at least five out of the seven en-       while DJF (December, January, February) and JJA (June,
semble members agree on the change in sign, has been shown         July, August) show larger changes over the MC-Aus region
as stippling as a further indicator of confidence.                 of −3.2 % and −3.8 % (p < 0.05) in the free ensemble and
                                                                   −2.7 % and −2.2 % (p > 0.1) for the nudged runs. The vi-
                                                                   olin plots indicate there is a similar degree of variability for
3     Impacts of coral-reef-derived DMS over the MC-Aus            each of these seasons (compared to DMSa ), and the influence
      region                                                       of free-running meteorology is again noted where changes in
                                                                   SO2 are found outside of coral reef regions.
3.1    DMS and sulfur dioxide
                                                                   3.2    Nucleation- and Aitken-mode aerosol
This section describes the changes in atmospheric DMS
(DMSa ) when coral reefs are removed (L11 minus L11C50),           The removal of coral-reef-derived DMS leads to a signifi-
noting that the results are presented this way in order to         cant (p < 0.05) decline in nucleation-mode aerosol number
demonstrate what the impact of the loss of coral reefs may         concentration of −5.1 %, −6.0 % and −6.2 % for MAM, JJA
be on the climate system. The annual differences in DMSa           and SON respectively in the free ensemble over the MC-Aus
(with respect to the L11C50 simulation, shown in Fig. 4a)          region (see Table 3). In the nudged simulations, nucleation-
for the nudged simulations (Fig. 4b) and the free-running          mode number concentration decreases by 4.6 % (p < 0.05)
ensemble (Fig. 4c) are spatially very similar to each other        in SON and by 4.4 % (p < 0.1) in MAM. Although not statis-
and to the respective change in fluxDMS (shown in Fig. 1b).        tically significant, JJA continues to show the largest changes
Good agreement across the ensemble is found with the free-         (−6.1 %) and DJF the smallest (−3.8 %) in the nudged runs.
running simulations over reef regions. Figure 4d–g show, for       The changes in nucleation-mode number concentration are
both the free and nudged simulations, a strong seasonal sig-       strongly reflected in the number concentrations of particles
nal over the MC-Aus region in terms of both mean value and         greater than 3 nm dry diameter (N3 ) which are shown annu-
the range of values. A seasonal signal is found in both the        ally in Fig. 6. The violin plots in Fig. 6d–g show a large range
DMSa and fluxDMS (see Table 3) and is in part due to the           in the response in DJF while a much smaller range in SON,
variation of the L11 DMSw climatology. In DJF, the range           with many of the individual free-running pairs agreeing on
of results from the ensemble is larger than that of any other      the magnitude of the change.
season, and it appears that the free-running meteorology is           These small aerosols (nucleation-mode-sized) show a
actually dampening the response of DMSa compared to the            greater response to changes in DMS than the larger aerosol
nudged runs. This damped response is not surprising as sur-        sizes (see Table 3) in both the free and nudged simulations,
face wind speeds were found to be stronger in this region          aligning with the results of Fiddes et al. (2018). This re-
at this time in the free ensemble (not shown). Increased wind      sult indicates that fewer homogeneous nucleation events are
speeds in the free ensemble cause an increased fluxDMS , lead-     occurring in the free troposphere as a result of removing
ing to a smaller decrease in fluxDMS and DMSa than in the          coral-reef-derived DMS. Hence, fewer particles are being en-
nudged run. Such examples of wind-driven DMS responses             trained back into the boundary layer. This process is con-
are also found in other locations (and in other seasons), in-      firmed by the vertical profile of N3 showing a decrease in the
cluding over the Southern Ocean at around 60◦ E and 60◦ W          upper levels of the atmosphere (not shown).
(see annual plots in Fig. 4c). These responses highlight the          The size distributions shown in Fig. 7 at four grid points
complexity of the DMS–climate system. In addition, wind-           also show the larger decreases are occurring in the nucle-
driven responses in other aerosol sources are found in regions     ation mode and the Aitken mode. The range of locations
around the globe (e.g. from sea salt and dust) but are not dis-    shown by the size distribution, including directly over coral
cussed further here.                                               reefs (GBR and PNG) and remotely from coral reefs (East
   Figure 5 shows changes in SO2 that are spatially similar        Pacific and QLD), demonstrates that the effect of coral-reef-
to those of DMSa . However the reductions around smaller           derived DMS loss is not restricted to directly over coral reef
coral reefs, such as those in the central Pacific, Indian or       regions. This is shown notably at the QLD location for JJA
Caribbean oceans, are of lesser magnitude than those of the        in both the nucleation and Aitken modes and SON for the
coral reefs in the MC-Aus region. This is true for both the        Aitken mode. Over the MC-Aus region, decreases in the sol-
nudged (Fig. 5b) and the free simulations (Fig. 5c), which         uble Aitken aerosol number occur in MAM and JJA of 1.9 %

Atmos. Chem. Phys., 21, 5883–5903, 2021                                              https://doi.org/10.5194/acp-21-5883-2021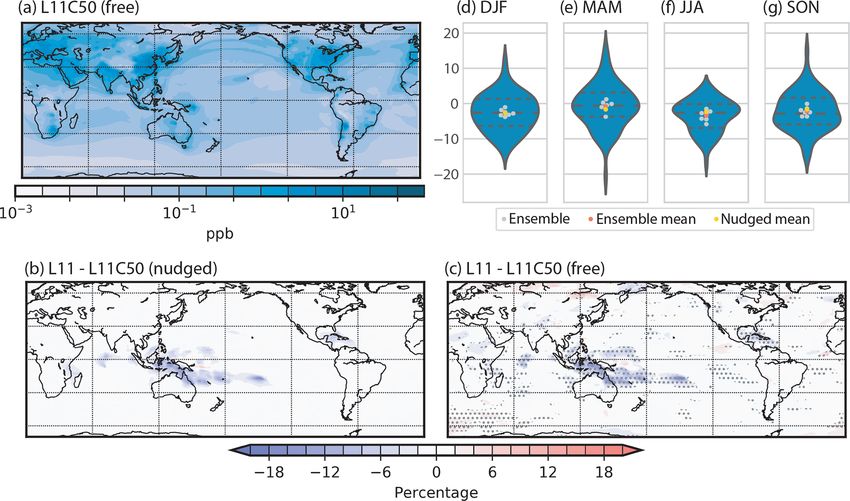
S. L. Fiddes et al.: Influence of coral reefs on climate                                                                       5889

Table 3. Seasonal changes over the Maritime Continent–Australian region as a percent (except for SW↓Surf,CS , SW↑TOA,CS and SW↓Surf
which are an absolute change in W m−2 and w in cm s−1 ) for both the free-running ensemble (F) and the nudged simulations (N). Number
density is abbreviated to ND and mass to MS for each of the four aerosol modes (nucleation, Aitken, accumulation and coarse).

                                Field             Run        DJF      MAM           JJA        SON
                                FluxDMS           F       −5.195    −13.795     −19.295     −13.595
                                (%)               N       −8.895    −12.295     −18.695     −11.495
                                DMSa              F       −6.195    −14.295     −22.395     −14.395
                                (%)               N       −8.995    −12.695     −20.695     −13.395
                                SO2               F       −3.295       −0.9      −3.895      −2.495
                                (%)               N        −2.7        −1.3       −2.2        −1.5
                                N3                F         −0.1     −4.695      −5.295      −5.395
                                (%)               N         −3.3     −3.890       −5.1       −3.690
                                Nuc. ND           F         −0.2     −5.295      −6.095      −6.295
                                (%)               N         −3.8     −4.490       −6.1       −4.695
                                Nuc. MS           F         −1.4     −6.495      −6.595      −6.695
                                (%)               N         −4.3     −5.895       −5.5       −4.395
                                Ait. ND           F          0.0     −1.995      −2.195        −1.5
                                (%)               N         −1.3      −1.2       −2.395        −1.1
                                Ait. MS           F         −1.6        0.0      −3.195        −2.0
                                (%)               N         −2.4       −1.2       −1.3         −1.2
                                Acc. ND           F         −1.4        0.1        −1.8        −1.3
                                (%)               N         −0.5       −0.8        −0.7        −0.7
                                Acc. MS           F       −4.390        1.1      −4.395        −2.0
                                (%)               N        −1.9        −1.5       −1.1         −0.6
                                Coa. ND           F          1.8       −1.3          0.0       −1.9
                                (%)               N         −0.4        0.2          0.2       −0.4
                                Coa. MS           F       −2.395       −0.7      −3.195      −3.495
                                (%)               N        −0.9        −1.8       −0.4        −0.7
                                CCN70             F         −0.7        0.3      −1.490        −1.4
                                (%)               N         −0.6       −0.8       −0.9         −0.9
                                AOD               F         −1.4        0.0      −1.690        −1.7
                                (%)               N         −1.1       −1.1       −0.6         −0.6
                                SW↑TOA,CS         F        −0.04       0.00    −0.06 90    −0.11 90
                                (W m−2 )          N        −0.05      −0.04      −0.03       −0.04
                                SW↓Surf,CS        F         0.12        0.00        0.11        0.03
                                (W m−2 )          N         0.07        0.06        0.01        0.05
                                CDN               F         −0.6        0.1      −0.990        −0.9
                                (%)               N         −0.4       −0.6       −0.4         −0.6
                                LWP               F          0.3       −0.8          0.4         0.4
                                (%)               N         −0.1       −0.2          0.3         0.2
                                Water vapour      F         −1.0         0.0       −0.1         1.0
                                (%)               N          0.1         0.1       −0.1        −0.1
                                Low cloud frac.   F           0.7      −0.6         0.9          1.7
                                (%)               N           0.1      −0.1        −0.4          0.2

https://doi.org/10.5194/acp-21-5883-2021                                              Atmos. Chem. Phys., 21, 5883–5903, 2021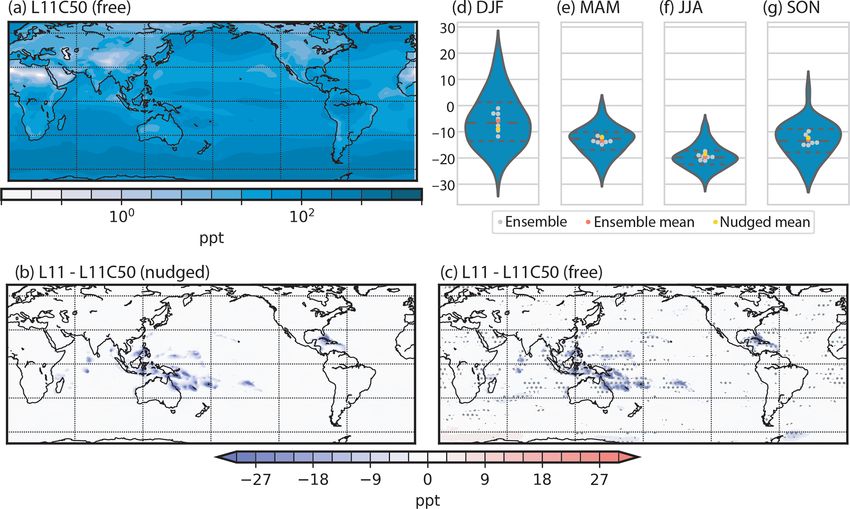
5890                                                                                          S. L. Fiddes et al.: Influence of coral reefs on climate

Table 3. Continued.

                                   Field                          Run           DJF          MAM            JJA     SON
                                   High cloud frac.               F            −1.0           −0.6         0.5     −0.1
                                   (%)                            N            −0.1            0.0        −0.1     −0.1
                                   Precip.                        F            −0.3           −0.4          0.2      0.8
                                   (%)                            N            −0.2           −0.2          0.4      0.2
                                   Large-scale precip.            F             0.9           −0.7        −0.8       1.0
                                   (%)                            N            −0.2            0.6         0.6       0.1
                                   Convective precip.             F            −0.4           −0.3          0.3      0.8
                                   (%)                            N            −0.2           −0.3          0.4      0.2
                                   w500 hPa                       F         −0.009         −0.004        −0.001    0.015
                                   (cm s−1 )                      N         −0.001         −0.001         0.003   −0.001
                                   SW↓Surf                        F             0.56              0.23     0.01   −0.14
                                   (W m−2 )                       N             0.11              0.25     0.01    0.09
                                 95 Statistically significant at the 95th percentile, p < 0.05.
                                 90 Statistically significant at the 90th percentile, p < 0.1.

Figure 4. The annual surface DMSa concentration (ppt) for the L11C50 simulation (a) and the L11–L11C50 difference for the nudged
simulations (b) and free-running ensemble (c). In panel (c) the model agreement, where at least five of the seven ensemble pairs agree in the
sign of the difference, is shown by stippling. Panels (d)–(g) show violin plots of the average seasonal difference (L11–L11C50) in DMSa
over the MC-Aus region as a percentage, where all years in the ensemble are shown by the distribution, the dashed lines represent the 25, 50
and 75th percentiles, the grey dots show each pair of models mean difference, red represents the ensemble average and yellow represents the
nudged average.

and 2.1 % respectively (p < 0.05). The changes in both the                             3.3        Accumulation- and coarse-mode aerosol
nucleation- and Aitken-mode number concentrations are ac-
companied by similar changes in aerosol mass at this size
(see Table 3).                                                                         At the larger sizes (soluble accumulation and coarse modes)
                                                                                       little change in aerosol number is found on average over the
                                                                                       MC-Aus region. However, significant (p < 0.05) decreases
                                                                                       in aerosol mass are found in the coarse mode during DJF, JJA
                                                                                       and SON and in the accumulation mode in DJF (p < 0.1) and

Atmos. Chem. Phys., 21, 5883–5903, 2021                                                                     https://doi.org/10.5194/acp-21-5883-2021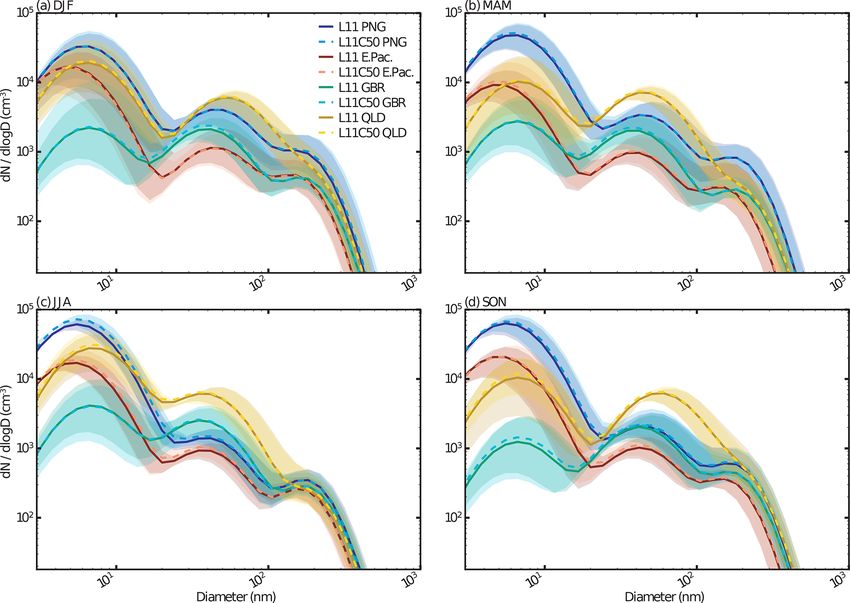
S. L. Fiddes et al.: Influence of coral reefs on climate                                                                           5891

Figure 5. As for Fig. 4 but for SO2 in parts per billion (ppb) (a) and percent (b–g).

Figure 6. As for Fig. 4 but for N3 in number per cubic centimetre (cm−3 ) (a) and percent (b–g).

JJA (p < 0.05) for the free-running ensemble (see Table 3).               by a larger increase in the aerosol mass. This increase is more
Declines of smaller magnitude (p > 0.1) are found for the                 evident in the nudged runs.
nudged runs. For the free ensemble, the larger change in mass                So far we show that the largest response in aerosol due
instead of number suggests a reduction in aerosol growth at               to loss of coral-reef-derived DMS occurs over the MC-Aus
these sizes as the larger aerosol sizes rely on condensational            region. For this reason, all subsequent plots focus on the
growth and cloud processing to interact with DMS-derived                  MC-Aus region. It is noted that there are impacts on aerosol
sulfate. One exception to the observed change in mass in-                 from the free-running meteorology outside of this domain,
stead of number is the region east of PNG, which varies                   but these can mostly be explained by changes in surface wind
by season (not shown). In this region, a small increase in                speeds due to variability in the free-running ensemble (not
accumulation-mode aerosol number is found, accompanied                    shown). In addition, the influence of the free-running mete-

https://doi.org/10.5194/acp-21-5883-2021                                                   Atmos. Chem. Phys., 21, 5883–5903, 2021
5892                                                                             S. L. Fiddes et al.: Influence of coral reefs on climate

Figure 7. Aerosol dry diameter in nanometres (nm, x axis) and number concentration (as a function of number over the log of the diameter)
in cubic centimetres (cm−3 , y axis), both in log scales, for four regions: off the coast of PNG (blues), in the East Pacific (reds/oranges), over
the GBR (green/turquoise) and inland QLD (yellow/brown), for the L11C50 (dashed lines) and L11 simulations (solid lines) (see Fig. 1b for
regions), for four seasons: DJF (a), MAM (b), JJA (c) and SON (d). The lines show the ensemble mean for the free-running simulations, and
the shaded regions show the range of results from all years in the ensemble.

orology is found to have a larger impact on the results in                 CCN70 -sized aerosols (see Fig. 8a) and also few coral reefs.
subsequent analysis, with greater seasonal variation.                      This lack of direct aerosol source suggests that changes in
                                                                           aerosol from other regions are affecting this region via trans-
3.4    Cloud condensation nuclei                                           port along the SPCZ.
                                                                              For the free ensemble, in Fig. 8c, g, k and o, the SPCZ re-
Despite the removal of coral-reef-derived aerosol having the               gion again stands out in MAM, JJA and SON, with decreases
largest impact on the nucleation-mode aerosol, these small                 in CCN70 of 2.8 %, 2.2 % and 1.9 % for each season respec-
aerosols do not interact with model radiation via direct or                tively (MAM and SON, p < 0.1, and JJA, p < 0.05). In this
indirect aerosol effects. While the changes are small in the               region, little change in surface wind speeds is found, sug-
larger sized aerosol number and mass, a cumulative response                gesting that the changes found here are also likely due to loss
to the loss of coral-reef-derived sulfur has some interest-                of aerosol from coral reefs and their subsequent transport, as
ing impacts. Figure 8 shows the column-integrated seasonal                 seen in the nudged runs.
cloud condensation nuclei with a dry diameter greater than                    Over the MC-Aus region in the free-running ensemble,
70 nm (CCN70 ) response to removal of coral-reef-derived                   JJA and SON have decreases in CCN70 of −1.4 % (p < 0.1
DMS. For the nudged simulations in Fig. 8b, f, j and n, a                  and p > 0.1 respectively). The violin plots in the far right
consistent, yet small and insignificant reduction in CCN70 is              column of Fig. 8 indicate large model spread in the CCN70
found over the MC-Aus region (between 0.6 % and 0.9 %).                    changes. SON (Fig. 8o) has the most ensemble agreement
Interestingly, over the SPCZ region, decreases of 1.0 %,                   over the MC-Aus region, while little agreement is observed
0.3 %, 1.9 % and 1.1 % are also found in the nudged sim-                   in other seasons. For this reason (and because the subsequent
ulations for each season (DJF, MAM, JJA and SON) re-                       dynamical results to be discussed in Sect. 3.5 onwards were
spectively. The SPCZ is a relatively clean region, with few

Atmos. Chem. Phys., 21, 5883–5903, 2021                                                        https://doi.org/10.5194/acp-21-5883-2021
S. L. Fiddes et al.: Influence of coral reefs on climate 5893
Figure 8. The seasonal (DJF – first row, MAM – second row, JJA – third row and SON – fourth row) total-column CCN70 concentration (in
cm−2 ) over the broad MC-Aus region for the free L11C50 simulation (first column); the L11–L11C50 difference for the nudged simulations
(second column); and the L11–L11C50 difference for the free-running ensemble (third column) with the model agreement shown by stippling,
where at least five of the seven ensemble pairs agree in the sign of the difference. The fourth column shows violin plots of the average seasonal
difference (L11–L11C50) in total-column CCN70 over the MC-Aus region as a percentage, where all years in the ensemble are shown by
the distribution, the dashed lines represent the 25, 50 and 75th percentiles, the grey dots show the mean of each pair of models, the red dots
show the ensemble average and the yellow dots show the nudged average.
the largest in this season), the SON results will be shown and aerosol direct effects. In Fig. 9, the SON aerosol optical depth
discussed from this point only (although the statistics for all (AOD), clear-sky outgoing shortwave radiation at the top of
seasons can be found in the continuation of Table 3). the atmosphere (abbreviated to SW↑TOA,CS ) and clear-sky
Whilst the changes in aerosol discussed in this section are incoming shortwave radiation at the surface (SW↓Surf,CS )
small, it is worth noting that in Fiddes et al. (2018), where all are shown. The clear-sky radiation fields are examined in
marine DMSw was removed, a global decrease of 8 % of all this section to allow for the detection of direct effects from
N3 (17 % for Australia) was found. For CCN70 , a decrease aerosol without the influence of clouds. Changes in the all
of just 5 % was found globally (8 % for Australia). It is clear sky fields are dominated by the convective cloud response,
from the perturbation of total marine DMS that global DMS which will be discussed in Sect. 4.
contributes only a small amount to the total aerosol number. The spatial response of AOD to changes in aerosol in the
Hence local differences from coral-reef-derived DMS found nudged simulations (Fig. 9b) is broadly similar to the CCN70
in this study could be considered to be relatively large. changes (Fig. 8n). Decreasing AOD is found over most of the
MC-Aus region, while the area to the east of PNG experi-
3.5 Direct aerosol radiative effects ences an increase. The seemingly amplified aerosol response
in the PNG region is due to the increased accumulation-mode
Aerosols in the Aitken, accumulation and coarse modes are sulfate mass. This increase is not believed to be associated
used by the ACCESS-UKCA radiation scheme to calculate with coral-reef-derived DMS removal but a function of com-
https://doi.org/10.5194/acp-21-5883-2021 Atmos. Chem. Phys., 21, 5883–5903, 20215894 S. L. Fiddes et al.: Influence of coral reefs on climate Figure 9. SON averages over the MC-Aus region for first row: the AOD (unitless and changes in percentage); second row: SW↑TOA,CS (W m−2 ); third row: SW↓Surf,CS (W m−2 ); and fourth row: column-average specific humidity (g kg−1 and percent). The first column shows the free L11C50 simulation; the second column shows the L11–L11C50 difference for the nudged simulations; the third column shows the L11–L11C50 difference for the free-running ensemble with the model agreement shown by stippling, where at least five of the seven ensemble pairs agree in the sign of the difference; and the fourth column shows violin plots of the average seasonal differences (L11–L11C50) as a percentage for AOD and specific humidity and in watts per square metre (W m−2 ) for SW↑TOA,CS and SW↓Surf,CS , where all years in the ensemble are shown by the distribution; the dashed lines represent the 25, 50 and 75th percentiles; the grey dots show each pair of models mean, the red dots the ensemble average and the yellow dots the nudged average. plex non-linearities and model sensitivities. This anomaly is is broadly true, as shown by the SW↓Surf,CS in Fig. 9j. These likely to be dampening the area averages over the MC-Aus results indicate that when no interaction with meteorology region. is allowed, a weak, statistically insignificant direct aerosol In Fig. 9f, the change in nudged SW↑TOA,CS is consis- effect is associated with certain regions over the MC under tent with the change seen in AOD, indicating that there is clear-sky conditions in austral spring. a weak reduction in the amount of shortwave radiation be- For the free-running ensemble, however, the result is far ing reflected out to space at the top of the atmosphere over less clear, primarily due to interactions with meteorology. significant coral reef regions. This decrease in SW↑TOA,CS The AOD response (Fig. 9c) is again broadly consistent with suggests more shortwave radiation is passing through the at- the changes in CCN70 (Fig. 8o), where over the MC-Aus re- mosphere and reaching the surface. For the nudged runs, this gion a decrease of 1.7 % (p < 0.1) is found. The SW↑TOA,CS Atmos. Chem. Phys., 21, 5883–5903, 2021 https://doi.org/10.5194/acp-21-5883-2021
S. L. Fiddes et al.: Influence of coral reefs on climate                                                                      5895

responds as expected with a decrease of 0.11 W m−2 over              wave radiation passing through the atmospheric column, re-
the MC-Aus region (p < 0.1, with considerable model                  sulting in warming, which may cause increased evaporation,
agreement). However, the subsequent SW↓Surf,CS response              vertical transport and convective activity and subsequently
(Fig. 9k) is not as clear. While the SON MC-Aus average              increased water vapour. Despite many of the responses de-
suggests a weak, insignificant increase in shortwave radia-          scribed above having good ensemble agreement, low confi-
tion reaching the surface, the spatial patterns are inconsistent     dence is attributed to this hypothesis for three reasons:
with the AOD, aerosol fields or the SW↑TOA,CS .
                                                                       – The top-of-the atmosphere direct radiative effect that
   In ACCESS-UKCA, the shortwave (defined as wave-
                                                                         is proposed to initiate these responses is small. Fur-
lengths between 0.2 and 5 µm) radiative transfer scheme con-
                                                                         thermore, the changes in aerosol and AOD that have
siders not just the scattering and absorption of energy by
                                                                         caused the radiative effect are also small and insignif-
aerosol and cloud droplets, but also the absorption of en-
                                                                         icant. Hence it is unreasonable to suggest such small
ergy by water vapour (Edwards et al., 2013). Water vapour
                                                                         changes in aerosol could be causing a direct radiative
has an effect at wavelengths greater than 0.7 µm. In Fig. 9o,
                                                                         effect.
the mean change in water vapour throughout the column
is shown, which is more spatially consistent with the free-            – Over the MC-Aus region as a whole, little statistical
running SW↓Surf,CS response than that of the AOD or                      significance is found in these responses, and ensemble
SW↑TOA,CS . This consistency is particularly clear over the              agreement can be found in regions that are seemingly
Australian region. An increase in water vapour in the column             not associated with coral-reef-derived DMS. Thus, in-
would suggest more absorption of radiation throughout the                ternal model variability cannot be ruled out as the cause
column, and hence less energy is received at the surface, as             for these meteorological responses.
found in the SW↓Surf,CS results (Fig. 9k). Upper level warm-
ing over the tropics (not shown) is also found, and we note            – In Fiddes et al. (2018), where all marine DMS-derived
that changes in temperatures nearer the surface are limited              aerosol was removed from the system, decreases in
due to the prescribed SSTs. It is emphasised that this inter-            convective activity were found over the tropics, de-
action of energy with water vapour is only found in the free             spite those simulations being nudged (nudging allows
ensemble, when meteorology is allowed to vary.                           small differences in meteorology if the forcing is large
   The cause of the change in water vapour is difficult to de-           enough). The change in convective activity induced by
termine as it is intricately linked to both local- and large-scale       removing all DMS is of the opposite sign to that found
climate processes. For example, meteorological effects found             here.
in this study that could explain the water vapour increase in-          Therefore, despite a weak yet significant (p < 0.1) decline
clude the following:                                                 in SW↑TOA,CS , it is concluded that over the MC-Aus region,
  – warming at upper levels (15–20 km) of the atmosphere             no robust impact on climate via the direct radiative effect can
    over the tropics (not shown), indicating more water              be confidently detected. This result may be due to averaging
    vapour can be held in the atmosphere, but could also             over a large area, as the same processes are found over QLD
    be a result of increased water vapour;                           with generally greater statistical significance and ensemble
                                                                     agreement. This is discussed further in Sect. 4.
  – increased latent heat flux at the surface over the Aus-
    tralian region (not shown), suggesting increased evapo-          3.6   Indirect aerosol radiative effects in the large-scale
    ration;                                                                cloud and precipitation scheme
  – a general increase in vertical motion found for the              Indirect aerosol effects, such as cloud brightening or life-
    Southern Hemisphere tropics–mid-latitudes (Fig. 10b),            time effects, take place as CCN particles activate and be-
    aligning neatly with the regions of increased wa-                come cloud droplets. In ACCESS-UKCA, aerosol activation
    ter vapour (Fig. 10d), and accompanied by decreased              depends on the size and composition of aerosol as well as
    southwards transport at upper levels and decreased               the atmospheric supersaturation, which is influenced by the
    northwards transport at the surface (Fig. 10f), suggest-         vertical velocity. Thus, the significant increase in smaller
    ing a weakening of the southern branch of the Hadley             size aerosol found in Sect. 3.2 may have some influence
    cell;                                                            over indirect aerosol effects in certain conditions, although
                                                                     it is noted that larger aerosols have a much greater ability
  – increased high-level cloud and convective precipitation
                                                                     to influence indirect effects. Figure 11 shows the responses
    found over the MC-Aus region, causing increased high
                                                                     of cloud droplet number (CDN), cloud liquid water path
    cloud cover, an overall decrease in SW↓Surf and in-
                                                                     (LWP) and low cloud fraction (noting that only the cloud mi-
    creased convective precipitation.
                                                                     crophysics scheme can respond to change in CDN, not the
  It is hypothesised that the small reduction in aerosol result-     convective scheme). For both the nudged and free simula-
ing from decreased DMSa has caused an increase in short-             tions, the changes found in CDN are consistent with, though

https://doi.org/10.5194/acp-21-5883-2021                                              Atmos. Chem. Phys., 21, 5883–5903, 2021
5896 S. L. Fiddes et al.: Influence of coral reefs on climate Figure 10. The zonal mean vertical profiles over the MC-Aus longitudinal region for vertical velocity (w, a, b) in centimetres per second (cm s−1 ), water vapour (c, d) in grams per kilogram (g kg−1 ) and the v component of wind (e, f) in metres per second (m s−1 ) for the free-running L11C50 simulation (a, c, e) and the difference in L11-L11C50 the free ensemble (b, d, f), with the model agreement shown by stippling where at least five of the seven ensemble pairs agree in the sign of the difference. For panels (a)–(b) and (e)–(f), the dashed black lines in all plots represent the zero contour of the L11C50 field, while in panels (b) and (f) the solid grey line indicates the zero contour of the L11 field. weaker than, the changes observed in the CCN70 fields (not- suggest that the reductions in CDN are unlikely to have an ing again the vertical integral of CDN through the column is effect on cloud properties or large-scale precipitation (via shown). No statistical significance is attributed to the changes the second indirect effect where fewer CDN, given the same in CDN over the MC-Aus region, although reasonable en- availability of liquid water, would increase rainfall). semble agreement is found in Fig. 11c. These weak changes Atmos. Chem. Phys., 21, 5883–5903, 2021 https://doi.org/10.5194/acp-21-5883-2021
S. L. Fiddes et al.: Influence of coral reefs on climate                                                                       5897

Figure 11. As for Fig. 9 but for column integrals of CDN (first row) in square centimetres (cm−2 ), LWP (second row) in kilograms per
square metre (kg m−2 ) and percent and low cloud fraction (third row) as a fraction and in percent.

   A small increase in LWP is found on average over the              concentrations have decreased insignificantly (by 0.5 %) and
MC-Aus region in the free simulations, although Fig. 11g–h           the LWP has increased (7.4 % p < 0.1) over the QLD region,
show a large amount of variability in the region and lit-            resulting in more large-scale rainfall, attributing the change
tle model agreement. This change in CDN and LWP has                  in LWP in particular to changes in aerosol is difficult, as dis-
had little impact on properties such as low cloud fraction           cussed in the previous sections.
(Fig. 9k) or large-scale precipitation (not shown), as shown            At this point, it is worth remembering that the convective
in Table 3, over the MC-Aus region for each season. In addi-         scheme is not coupled to the aerosol scheme and thus has no
tion there is very little model agreement in these responses.        knowledge of the removal of coral-reef-derived DMS. Hence
For the nudged simulations, constrained meteorology has              the increased convective activity must be occurring dynam-
meant little response of cloud properties is allowed. Sub-           ically, with possible causes discussed in Sect. 3.5. Specifi-
sequently, these results suggest that the loss of coral-reef-        cally, over QLD, a significant decrease in N3 of 5 % is found
derived aerosol has little or no impact on climate via the in-       (p < 0.05). Although this does not translate into a meaning-
direct aerosol effects.                                              ful decrease of CCN70 (0.5 %), a significant (p < 0.1) de-
                                                                     cline in the AOD is found of 1.6 %, which has resulted in
                                                                     less SW↑TOA,CS of −0.16 W m−2 , (p < 0.05). As for the
4   Implications for Queensland, Australia                           MC-Aus region, the increased radiation allowed through the
                                                                     atmospheric column has been absorbed by increased water
A relatively large increase in precipitation, of 11 %, has been
                                                                     vapour (see Fig. 9o), resulting in a significant reduction in
found over QLD in response to removal of DMS produced
                                                                     SW↓Surf of −0.38 W m−2 (p < 0.1). While high cloud cover
by coral. Although approximately equivalent increases were
                                                                     has increased by 7.4 % (p < 0.1), which in turn has caused a
found in the large-scale and convective precipitation (10.9 %,
                                                                     decrease in SW↓Surf of 1.61 W m−2 (p < 0.1), linking these
p > 0.1, and 9.4 %, p < 0.1), very little large-scale precipi-
                                                                     convective responses to the changes in direct aerosol effect
tation occurs in this region, with convective precipitation by
far the more important of the two. Furthermore, while CDN

https://doi.org/10.5194/acp-21-5883-2021                                              Atmos. Chem. Phys., 21, 5883–5903, 2021
5898 S. L. Fiddes et al.: Influence of coral reefs on climate
at the top of the atmosphere is not able to be done with con- Despite the weak AOD response over the MC-Aus region,
fidence. a significant reduction in SW↑TOA,CS of −0.11 W m−2 was
Due to increased high cloud cover, the relatively large found for SON in the free-running ensemble and is attributed,
change in all sky surface solar radiation is of the opposite in part, to the reduction of aerosol (despite its statistical in-
sign to what one would expect following the aerosol direct significance) in the region. This decrease is greater than the
and indirect theories. Further, it is noted that the changes in equivalent decrease in the nudged simulations. Much smaller
the all-sky radiation are much larger than those of the clear- (or no) reductions were found in all other seasons. In con-
sky radiation and indicate that the response in cloud cover is trast to the nudged simulations, the free-running SON reduc-
much more important for radiative processes in this region tion in SW↑TOA,CS does not directly translate to similar in-
than the direct aerosol effects. creases in SW↓Surf,CS as expected. The most likely expla-
Despite the changes presented in this section for QLD hav- nation is that interaction of shortwave radiation with water
ing greater statistical significance and more ensemble agree- vapour causes the opposite SW↓Surf,CS effect, which is it-
ment than over the MC-Aus region, low confidence is at- self a result of complex meteorological feedbacks. The re-
tached to these results due to an unclear physical mechanism sponse of water vapour could not be confidently attributed
(Sect. 3.5) and the existence of similar responses elsewhere to changes in aerosol (as opposed to model variability be-
that are likely to be model noise (not shown). It is empha- tween ensemble members), and the direct effects at the top
sised that the meteorological results discussed above are con- of the atmosphere are found to be weak. For these reasons,
sidered to be a response to a direct aerosol radiative effect, this work concludes that no robust direct aerosol effects can
only possible when meteorological feedbacks are allowed. be confidently associated with coral-reef-derived DMS.
Nevertheless, these results were interesting and unexpected, We have found little to no evidence of indirect aerosol ef-
demonstrating a clear example of how non-linear the DMS– fects in any region in response to coral reef DMS. This is
climate system is and how important it is to consider the sys- unsurprising given the small and insignificant changes found
tem as a whole, rather than isolating certain aspects. in the CDN and also the results of Fiddes et al. (2018), where
few indirect effects were observed outside of the clean ma-
rine regions of the Southern Hemisphere mid-latitudes. How-
5 Conclusions ever, it may also be a result of the lack of coupling between
the convective scheme and aerosol in the model. Coral reefs,
This study set out to determine if the loss of coral-reef- by nature, are located in tropical regions that are dominated
derived DMS could impact global and regional climate. The by convective processes. Hence, it is possible that no indirect
ability of coral reefs to produce an aerosol precursor gas has effects were found in this work simply because such effects
been known for some time; however the impact of this source are only allowed to occur in the large-scale scheme, which is
of sulfur on the climate has not been quantified until now. not particularly active in the regions of interest.
On the global scale, coral reefs appear to have little influence How convection may interact with changes in aerosol is
on the sulfur budget or global energy balance. At regional currently a large source of uncertainty (Tao et al., 2012).
scales, however, this work has found some interesting and Aerosol-induced convective invigoration theories suggest
unexpected effects that highlight the complexity of this sys- that with less aerosol, CDN would rain out more quickly,
tem. reducing the amount of latent heat release caused by conden-
The MC-Aus region has been found to have the largest sation, thus inhibiting convection. This mechanism has been
aerosol response to removal of coral-reef-derived DMS found in both simulations and observations with respect to
across the globe. This is unsurprising given that this re- increased anthropogenic ultrafine aerosol over the Amazon
gion has the highest density of coral reefs in the world. invigorating deep convection (Fan et al., 2018). However,
Over other coral reef regions, the effects of coral-reef-derived Nishant et al. (2019) have demonstrated that while satellite
DMS are quickly diluted by other influencing factors, such observations correlate high aerosol loading to increased con-
as anthropogenic aerosol sources. Significant decreases in vection, the presence of aerosol may not be the cause of
the free-running ensemble’s small size aerosol (both number convective activity due to the co-variation of aerosol–wind
and mass) are found over the MC-Aus region when coral- and wind–cloud processes. Fan et al. (2016) summarise that
reef-derived DMS is removed. For the larger sized aerosols, the influence of aerosol on convection is highly dependent
small, generally insignificant decreases in sulfate mass are on different kinds of convective systems (e.g. the trigger
found, while little change in number is noted. The nudged mechanism, whether it is a super cell) and the environment
simulation shows a more consistent small decrease across all (e.g. wind shear, cloud base temperature). The studies dis-
aerosol fields and seasons. The decreases in aerosol have cu- cussed above and the results of this work indicate that trop-
mulatively led to an insignificant decrease in SON of AOD in ical aerosol interaction with climate is far from linear and
the MC-Aus region and a significant decrease of AOD over requires significantly more work to integrate both the con-
QLD. No significant or robust changes were detected in other vective and large-scale responses in climate modelling.
seasons.
Atmos. Chem. Phys., 21, 5883–5903, 2021 https://doi.org/10.5194/acp-21-5883-2021You can also read