The impact of biomass burning and aqueous-phase processing on air quality: a multi-year source apportionment study in the Po Valley, Italy
←
→
Page content transcription
If your browser does not render page correctly, please read the page content below
Atmos. Chem. Phys., 20, 1233–1254, 2020
https://doi.org/10.5194/acp-20-1233-2020
© Author(s) 2020. This work is distributed under
the Creative Commons Attribution 4.0 License.

The impact of biomass burning and aqueous-phase processing
on air quality: a multi-year source apportionment study
in the Po Valley, Italy
Marco Paglione1 , Stefania Gilardoni1 , Matteo Rinaldi1 , Stefano Decesari1 , Nicola Zanca1,a , Silvia Sandrini1 ,
Lara Giulianelli1 , Dimitri Bacco2 , Silvia Ferrari2 , Vanes Poluzzi2 , Fabiana Scotto2 , Arianna Trentini2 ,
Laurent Poulain3 , Hartmut Herrmann3 , Alfred Wiedensohler3 , Francesco Canonaco4 , André S. H. Prévôt4 ,
Paola Massoli5,6 , Claudio Carbone7 , Maria Cristina Facchini1 , and Sandro Fuzzi1
1 ItalianNational Research Council – Institute of Atmospheric Sciences and Climate (CNR-ISAC), 40129 Bologna, Italy
2 Regional Agency for prevention, environment and energy (ARPAE) of Emilia-Romagna, Bologna, Italy
3 Leibniz-Institut für Troposphärenforschung (TROPOS), 04318 Leipzig, Germany
4 Laboratory of Atmospheric Chemistry, Paul Scherrer Institute, Villigen PSI 5232, Switzerland
5 Aerodyne Research, Inc. Billerica, MA, USA
6 MultiSensor Scientific, Inc., Greentown Labs, Sommerville, MA, USA
7 Proambiente S.c.r.l., CNR Research Area, Bologna, Italy
a now at: Department of Chemistry and Institute for Atmospheric and Earth System Research (INAR),

University of Helsinki, 00014 Helsinki, Finland

Correspondence: Marco Paglione (m.paglione@isac.cnr.it)

Received: 21 March 2019 – Discussion started: 5 April 2019
Revised: 15 November 2019 – Accepted: 22 November 2019 – Published: 3 February 2020

Abstract. The Po Valley (Italy) is a well-known air qual-        organic aerosol (POA) comprises biomass burning (23±13 %
ity hotspot characterized by particulate matter (PM) levels      of OA) and fossil fuel (12±7 %) contributions with a marked
well above the limit set by the European Air Quality Direc-      seasonality in concentration. As expected, the biomass burn-
tive and by the World Health Organization, especially during     ing contribution to POA is more significant at the rural site
the colder season. In the framework of Emilia-Romagna re-        (urban / rural concentration ratio of 0.67), but it is also an
gional project “Supersito”, the southern Po Valley submicron     important source of POA at the urban site during the cold
aerosol chemical composition was characterized by means of       season, with contributions ranging from 14 % to 38 % of the
high-resolution aerosol mass spectroscopy (HR-AMS) with          total OA mass.
the specific aim of organic aerosol (OA) characterization and       Secondary organic aerosol (SOA) contributes to OA mass
source apportionment. Eight intensive observation periods        to a much larger extent than POA at both sites throughout
(IOPs) were carried out over 4 years (from 2011 to 2014)         the year (69 ± 16 % and 83 ± 16 % at the urban and rural
at two different sites (Bologna, BO, urban background, and       sites, respectively), with important implications for public
San Pietro Capofiume, SPC, rural background), to character-      health. Within the secondary fraction of OA, the measure-
ize the spatial variability and seasonality of the OA sources,   ments highlight the importance of biomass burning aging
with a special focus on the cold season.                         products during the cold season, even at the urban back-
   On the multi-year basis of the study, the AMS observa-        ground site. This biomass burning SOA fraction represents
tions show that OA accounts for averages of 45 ± 8 % (rang-      14 %–44 % of the total OA mass in the cold season, indi-
ing from 33 % to 58 %) and 46 ± 7 % (ranging from 36 %           cating that in this region a major contribution of combustion
to 50 %) of the total non-refractory submicron particle mass     sources to PM mass is mediated by environmental conditions
(PM1 -NR) at the urban and rural sites, respectively. Primary    and atmospheric reactivity.

Published by Copernicus Publications on behalf of the European Geosciences Union.
1234                          M. Paglione et al.: Impact of biomass burning and aqueous-phase processing on air quality

   Among the environmental factors controlling the forma-            The Po Valley, located in northern Italy, is amongst the
tion of SOA in the Po Valley, the availability of liquid water    most polluted areas in Europe (EEA, 2016). It is surrounded
in the aerosol was shown to play a key role in the cold season.   by the Alps to the north and northwest and by the Apennines
We estimate that the organic fraction originating from aque-      to the south. The occurrence of frequent and prolonged low-
ous reactions of biomass burning products (“bb-aqSOA”)            wind periods and atmospheric stability conditions favor the
represents 21 % (14 %–28 %) and 25 % (14 %–35 %) of the           accumulation of particulate and gaseous pollutants locally
total OA mass and 44 % (32 %–56 %) and 61 % (21 %–                emitted, especially during the cold months. The distinctive
100 %) of the SOA mass at the urban and rural sites, respec-      features of the Po Valley make it an interesting “laboratory”
tively.                                                           to study the development of POA and SOA concentrations in
                                                                  the ambient atmosphere.
                                                                     The Supersito project (https://www.arpae.it/supersito, last
                                                                  access: 14 December 2019) is a comprehensive study of
1   Introduction
                                                                  atmospheric particulate matter pollution in the Emilia-
Ambient air pollution represents the highest environmental        Romagna Region, encompassing the southern part of the
risks for human health, leading to about 3 million premature      Po Valley from the Po River to the Apennines. Overall, the
deaths every year (WHO, 2016) due to the exacerbation of          project deals with chemical, physical and toxicological pa-
respiratory and cardio-vascular diseases, especially in young     rameters of the aerosol and integrates them with epidemio-
children and elderly people. In Europe atmospheric pollu-         logical and medical assessments through interpretative mod-
tion is responsible for more than 400 000 premature deaths a      els. Results about aerosol chemical characterization using of-
year (EEA, 2016), with the largest share due to fine particu-     fline techniques were presented by Ricciardelli et al. (2017).
late matter (PM2.5 and PM1 ) exposure. Organic aerosol (OA)          Here we describe the results of HR-AMS PM1 measure-
accounts for 20 % to 90 % of fine particle mass worldwide         ments carried out during eight intensive measurement cam-
(Zhang et al., 2007) and for up to 50 % (20 %–90 %) of fine       paigns with a focus on OA source apportionment. Previous
particle mass in Europe (Putaud et al., 2010). The OA global      projects have investigated the properties of fine aerosols at
budget and atmospheric processing are still characterized by      urban, rural and regional sites of the Po Valley, including
large uncertainties (Hallquist et al., 2009). Better knowledge    their chemical features (Carbone et al., 2014; Putaud et al.,
of OA is essential to support effective air quality control and   2002, 2010; Saarikoski et al., 2012) and main sources (Belis
remediation measures.                                             et al., 2013; Gilardoni et al., 2011; Larsen et al., 2012; Per-
   OA is directly emitted by various sources, including traf-     rone et al., 2012). Further studies based on Aerosol Mass
fic, other combustion sources and biogenic emissions, and         Spectrometer (AMS) measurements have been conducted in
can also be produced via secondary formation pathways in          the same area during specific field experiments with the aim
the atmosphere (Hallquist et al., 2009). In particular, our un-   of characterizing specific phenomena and seasonal features
derstanding of the formation mechanisms and evolution pro-        (fog events, cooking aerosols, biomass burning emissions,
cesses of secondary OA (SOA) is still largely uncertain.          etc.) (Gilardoni et al., 2014; Decesari et al., 2014; Paglione
   Direct quantification of SOA in the ambient aerosol is         et al., 2014; Dall’Osto et al., 2015). Nevertheless, system-
challenging, but many recent studies have established that        atic AMS observations in the valley are available from very
oxygenated OA (OOA) determined by multivariate statisti-          few studies. Bressi et al. (2016), using a 1-year long dataset
cal analysis (e.g., positive matrix factorization, PMF) of OA     of measurements by an Aerosol Chemical Speciation Moni-
fragmentation mass spectra is a good proxy of SOA (Zhang          tor (ACSM), described the chemical composition and the or-
et al., 2007; Ulbrich et al., 2009). Therefore, OOA is widely     ganic PM1 sources of the northwestern edge of the Po Valley
used to study the abundance and formation mechanisms of           at the rural background site of Ispra, 60 km northwest of Mi-
SOA. Although several types of these OOAs were isolated in        lan.
ambient aerosol everywhere (often representing more than             In this study, we analyze a multi-year dataset of high-
half of the total OA, Zhang et al., 2007; Ng et al., 2010;        resolution measurements carried out at two different sites
Crippa et al., 2014), their link to a specific source or mecha-   (Bologna and San Pietro Capofiume), exploring for the first
nism remains largely undetermined. This is a consequence of       time the spatial–temporal variability of OA sources, chem-
their complexity in terms of chemical and physical properties     ical features and formation/transformation processes in the
and the difficulty in reproducing the real conditions in which    southern part of the Po Valley. A special focus is dedi-
SOAs are formed/transformed. As a result, traditional mod-        cated to the interpretation of the main sources and forma-
els often show substantial discrepancies in simulating SOA        tion/transformation processes of the SOA in the region active
mass concentrations (Kleinman et al., 2008; Matsui et al.,        during the cold period.
2009) and oxidation states (Chen et al., 2011), especially in
wintertime.

Atmos. Chem. Phys., 20, 1233–1254, 2020                                            www.atmos-chem-phys.net/20/1233/2020/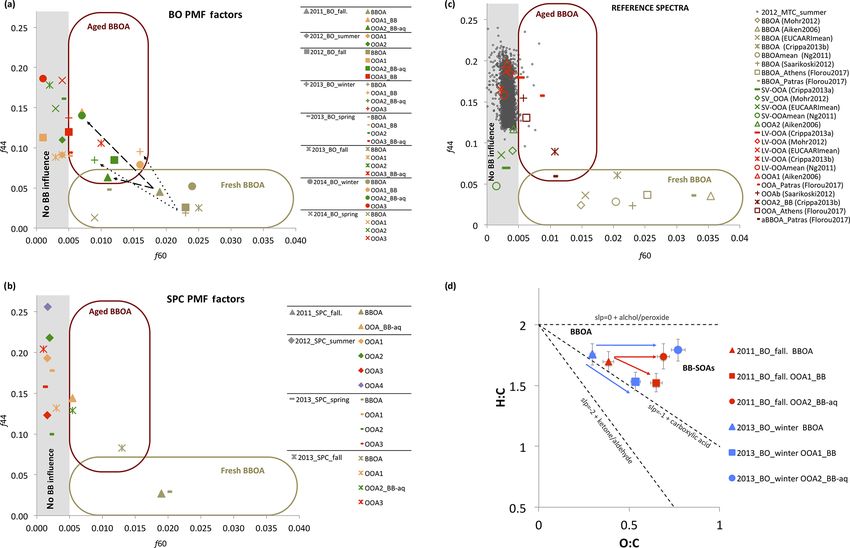
M. Paglione et al.: Impact of biomass burning and aqueous-phase processing on air quality 1235
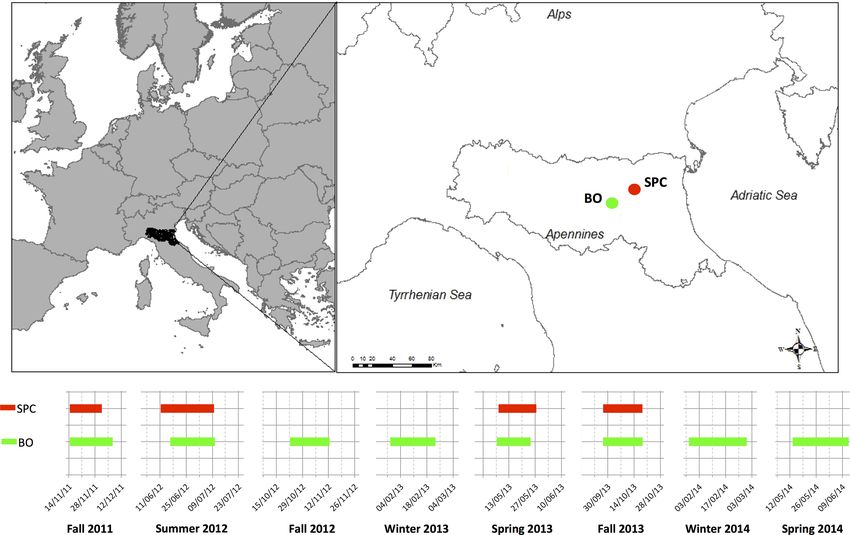
Figure 1. Supersito field campaigns: map of the sites and measurement periods considered in this study.
2 Material and methods During the 4-year project, the intensive campaigns were
programmed to account for the marked seasonality in both
2.1 Measurement field campaigns sources and weather conditions of this region. Nevertheless,
most of the Supersito campaigns took place in the cold sea-
Eight intensive observation periods (IOPs) were carried out son (three campaigns in fall and two in winter, out of eight
over 4 years (from November 2011 to June 2014) at two dif- in total), when the highest PM levels are found. Similarly to
ferent sites of the southern part of the Po Valley (Bologna, other continental sites, during fall–winter the reduced height
BO, urban background, and San Pietro Capofiume, SPC, of the planetary boundary layer (PBL) and calm wind condi-
rural background). Figure 1 shows a map of the measure- tions favor the accumulation of pollutants and are respon-
ment sites and a timeline of the field campaigns carried sible for the rise in the PM concentration (Perrone et al.,
out during the Supersito project. Bologna is located at the 2012; Stanier et al., 2012; Bressi et al., 2013). Another fea-
foot of the Apennines and is an important population basin ture of the cold months in this area is the high relative humid-
for the region (400 000 inhabitants), impacted by signif- ity, which leads to fogs and hazes (i.e., conditions of high
icant industrial and agricultural activities and crossed by aerosol liquid water content, ALWC). The consequence of
several major highways. The BO measurement site is lo- these meteorological conditions for PM concentrations is 2-
cated in the National Research Council (CNR) Research fold: it promotes both wet removal (Gilardoni et al., 2014;
Area (44◦ 310 2900 N, 11◦ 200 2700 E). The rural background sta- Giulianelli et al., 2014; Montero-Martìnez et al., 2014) and
tion of San Pietro Capofiume (SPC) is located in a sparsely aqueous-phase processing with SOA formation (Gilardoni et
populated flat countryside (44◦ 390 1500 N, 11◦ 370 2900 E) sur- al., 2016).
rounded by kilometers of flat lands in the southeastern part
of the Po Valley, 30 km northeast of Bologna, and is repre- 2.2 Aerosol mass spectrometer measurements and
sentative of the regional background. This site has been used apportionment of organic fraction
for many atmospheric characterization studies and research
projects (Saarikoski et al., 2012; Paglione et al., 2014; Dece- During all of the Supersito campaigns, the mass loading
sari et al., 2014; Sandrini et al., 2016). and the size-resolved chemical composition of submicron
www.atmos-chem-phys.net/20/1233/2020/ Atmos. Chem. Phys., 20, 1233–1254, 2020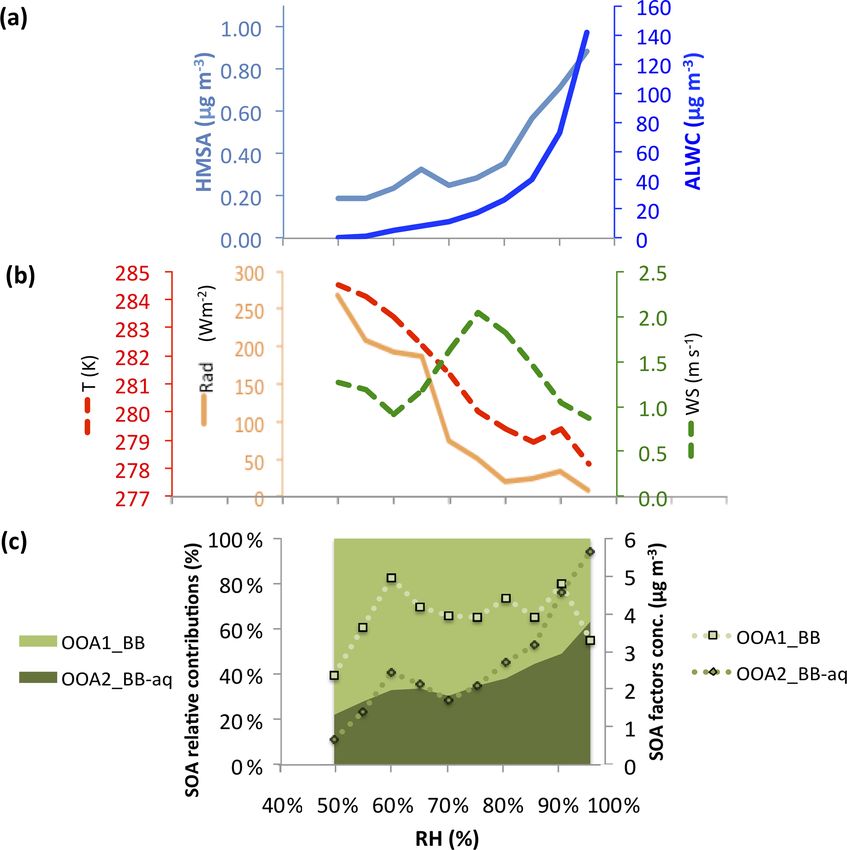
1236                          M. Paglione et al.: Impact of biomass burning and aqueous-phase processing on air quality

Table 1. Average organic aerosol (OA) concentrations and their relative contributions to the NR-PM1 mass measured by the HR-ToF-AMS
within each campaign.

                                                         BO                                SPC
                                          OA (µg m−3 )    OA / NR-PM1      OA (µg m−3 )      OA / NR-PM1
                          2011 fall              15.85             46 %             9.30            50 %
                          2012 summer             7.16             58 %             5.27            49 %
                          2012 fall               4.61             46 %
                          2013 winter             8.37             42 %
                          2013 spring             2.04             44 %             1.74            36 %
                          2013 fall               3.81             33 %             3.37            40 %
                          2014 winter             3.60             39 %
                          2014 spring             3.31             54 %

aerosol particles were obtained online by the Aerodyne              spanning between +0.2 % and +1.4 % (+0.65 ± 0.35 % on
High-Resolution Time-of-Flight Aerosol Mass Spectrome-              average), well below the limit considered acceptable even
ter (HR-ToF-AMS, Aerodyne Research, Canagaratna et al.,             for periods of high inorganic mass fractions set to +3.4 %
2007). The HR-ToF-AMS provides measurements of the                  (Pieber et al., 2016). Filter blank acquisitions during the cam-
non-refractory sulfate, nitrate, ammonium, chloride, and or-        paign were performed once a day to evaluate the background
ganic mass of the submicron particles (NR-PM1 ). The av-            and correct for the gas-phase contribution. All data were ana-
erage concentrations of NR-PM1 chemical components and              lyzed using the standard SQUIRREL v1.51 and PIKA v1.10
their relative contributions as measured by the AMS in each         ToF-AMS analysis software (Donna Sueper, Aerodyne
campaign are reported in the Supplement (Table S1 and               Research Inc., CIRES, University of Colorado, Boul-
Fig. S1). For some of the Supersito campaigns, specific stud-       der, available at http://cires.colorado.edu/jimenez-group/
ies have already been published. We refer to Gilardoni et           ToFAMSResources/ToFSoftware/index.html, last access:
al. (2014, 2016) for the SPC fall 2011 and BO winter 2013           14 December 2019) within Igor Pro 6.2.1 (WaveMetrics,
campaigns, respectively, and to Sullivan et al. (2016) for the      Lake Oswego, OR). The HR-ToF-AMS collection effi-
SPC summer 2012 campaign. In this paper we focus on the             ciency (CE) was calculated based on aerosol composition,
organic aerosol (OA) component that represents the most             according to Middlebrook et al. (2012), and evaluated
abundant fraction of submicron particle mass for most of            against parallel offline measurements (see Sect. 2.3 and
the campaigns, ranging from 33 % to 58 % of NR-PM1 (con-            Table S2 in the Supplement). The aerosol was dried to about
centration range: 1.8–18.4 µg m−3 ), consistent with the value      35 %–40 % by means of a Nafion drier before sampling with
found by Jimenez et al. (2009), Ng et al. (2010) and Crippa et      the HR-ToF-AMS.
al. (2014). Table 1 summarizes the average OA concentration            The organic fraction (OA) measured by HR-ToF-AMS
for each site and season and the relative organic contribution      was apportioned using the PMF approach (Paatero and Tap-
to the NR-PM1 as measured by the HR-ToF-AMS.                        per, 1994; Lanz et al., 2007; Ulbrich et al., 2009; Zhang et al.,
   The working principle of the HR-ToF-AMS is described             2011) by applying the Multilinear Engine 2 solver (ME-2,
in detail in Canagaratna et al. (2007), Jayne et al. (2000),        Paatero, 2000) controlled within the Source Finder software
and Jimenez et al. (2003). Briefly, during all the campaigns,       (SoFi v4.8, Canonaco et al., 2013; Crippa et al., 2014).
the HR-ToF-AMS operated by alternating between “V” and                 Similarly to the classical PMF solvers (e.g., PMF2, PMF3,
“W” ion path modes every 5 min. The concentrations re-              Paatero and Tapper, 1994), the ME-2 solver (Paatero, 1999)
ported here correspond to the data collected in V mode. The         executes the positive matrix factorization algorithm. How-
resolving power (DeCarlo et al., 2006) of the V-ion mode            ever, the user has the advantage of supporting the analysis
was about 2000–2200 during all the campaigns.                       by introducing a priori information such as known factor
   Ionization efficiency (IE) calibrations were performed           profiles (FPs), for example within the so-called a-value ap-
before and after every campaign and approximately once a            proach. The a-value is a scalar (defined between 0 and 1) that
week during the campaigns. Data from IE calibrations were           determines how much the resolved factor profiles are allowed
also used to quantify the interference of ammonium nitrate in       to vary from the reference ones (Canonaco et al., 2013). For
the CO+ 2 signal for the different instruments and campaigns        instance, applying an a-value of 0.05 lets ±5 % variability
following the criteria suggested by Pieber et al. (2016).           into our FP solution with respect to the reference FP during
The relationship “b” (the slope of the orthogonal distance          the PMF iteration.
linear fit of the CO+           −
                      2 and NO3 signals expressed in nitrate           The standardized source apportionment strategy intro-
equivalent mass, i.e., RIE = 1) in our estimations resulted in      duced in Crippa et al. (2014) was applied to the 12 individ-

Atmos. Chem. Phys., 20, 1233–1254, 2020                                              www.atmos-chem-phys.net/20/1233/2020/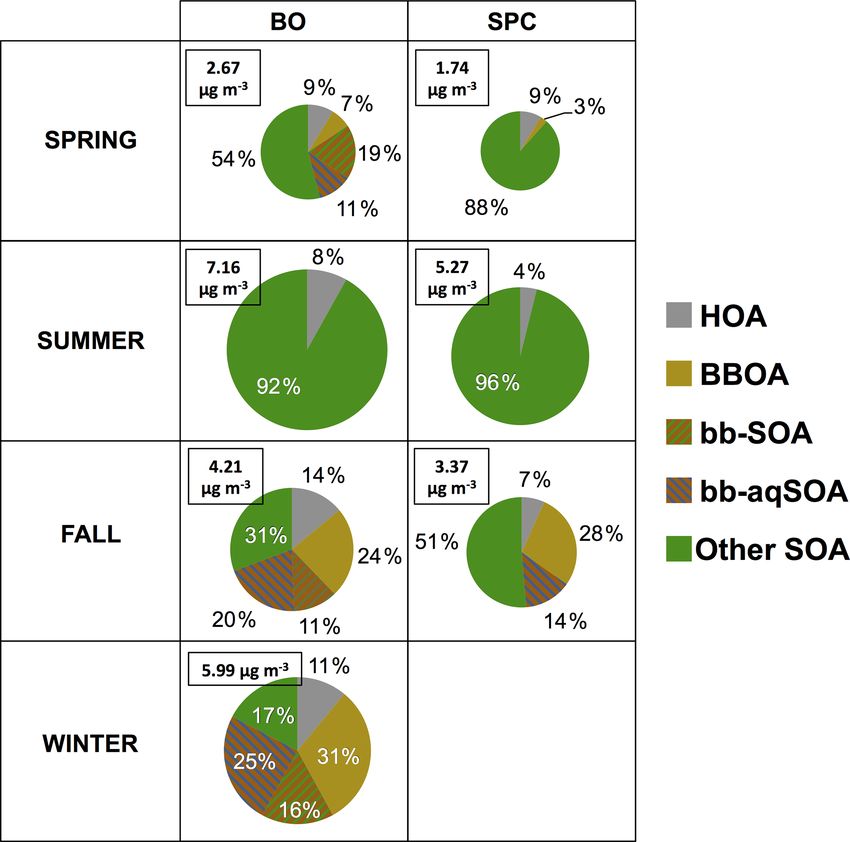
M. Paglione et al.: Impact of biomass burning and aqueous-phase processing on air quality                                     1237

Figure 2. Schematic step-by-step procedure of the adopted source apportionment approach.

ual HR-ToF-AMS datasets (8 from BO and 4 from SPC).                  the standard flow rate of 38.3 L min−1 ) on quartz-fiber fil-
The PMF analysis followed the iterative, step-by-step proto-         ters (PALL Tissu Quartz 2500 QAO-UP 2500 filters, 47 mm)
col shown in Fig. 2. A comprehensive description of the PMF          during all of the project periods for the analysis of the car-
protocol and of the criteria for identifying the best solutions      bonaceous fractions (total carbon, TC; organic carbon, OC;
followed in each campaign, together with specific metrics for        and elemental carbon, EC) by thermo-optical transmittance
every single factor analysis (number of iterations, number of        (Sunset, Laboratory Inc., Oregon, USA, using the EUSAAR2
factors chosen, Q, and residual diagnostic plots, constrained        thermal protocol, Cavalli et al., 2010; Ricciardelli et al.,
factor profiles and a-values if applied, etc.), are reported in      2017) and of polar organic compounds (anhydrosugars and
Supplement Sect. S2.                                                 acids) by GC/MS analysis (Pietrogrande et al., 2014). Due
   The interpretation of the retrieved source apportionment          to the elevated PM loading during the first experiment in fall
factors as organic aerosol sources is based on the compari-          2011, the discrimination between OC and EC was not pos-
son of their mass spectral profiles with reference ones (Ta-         sible for the filters collected, and only TC data are available
bles S5, S6 and S7), on the correlations with external data          for that specific campaign.
(see Table S8) and on the investigation of their diurnal trends         Black carbon (BC) was calculated from aerosol absorp-
(Ulbrich et al., 2015).                                              tion coefficient measurements (when available) by single-
                                                                     wavelength (573 nm) and multi-wavelength (467, 530, and
2.3   Additional measurements and analytical                         660 nm) Particle Soot Absorption Photometers, PSAPs
      techniques                                                     (Bond et al., 1999), as previously described (Gilardoni et al.,
                                                                     2011, 2016; Costabile et al., 2017).
Additional measurements from the routine daily program of               Size-segregated aerosol particles were also sampled by a
the Supersito project are used in this study as ancillary data.      Berner impactor (flow rate 80 L min−1 ) (Matta et al., 2003).
PM2.5 daily samples were collected by a low-volume sam-              The Berner impactor collects particles in five stages, cor-
pler (Skypost PM, TCR TECORA Instruments, operating at               responding to the following particle aerodynamic diameter

www.atmos-chem-phys.net/20/1233/2020/                                                  Atmos. Chem. Phys., 20, 1233–1254, 2020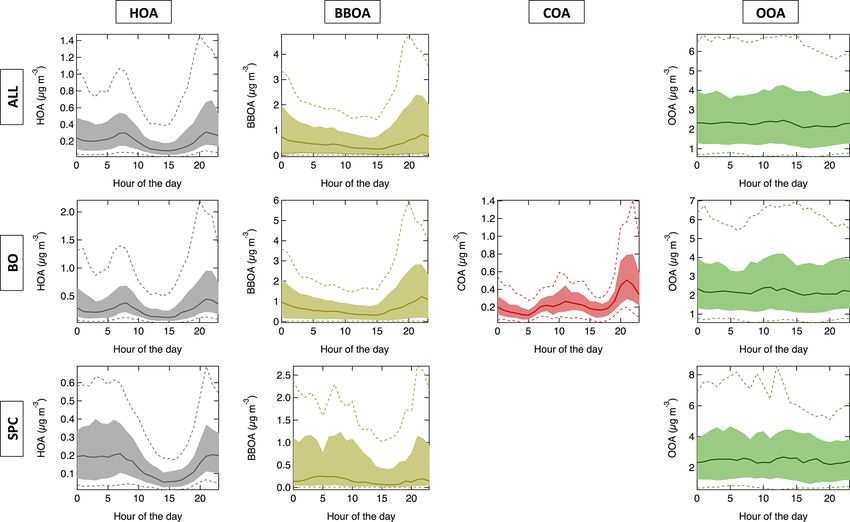
1238                           M. Paglione et al.: Impact of biomass burning and aqueous-phase processing on air quality

cutoffs: 0.14, 0.42, 1.2, 3.5, and 10 µm. Sampling was per-        sists of OOAs, representative of secondary formation and/or
formed continuously during the intensive campaigns. Each           aging processes in the atmosphere. Factor analysis extracted
day we collected two samples: a daytime sample (from               different types of OOAs with distinct time trends and/or
≈ 09:00 to 17:00 LT during fall–winter and from ≈ 09:00 to         spectral features. In this section, we will consider the OOA
21:00 LT during spring–summer) and a night-time one (from          factors as a whole, while in Sect. 4 we will discuss a source
17:00 to 09:00 LT during fall–winter and from 21:00 to 09:00       attribution for the individual factors.
during spring–summer). Particles collected were extracted in           Figure 3 shows the average mass spectra of all the iden-
water and analyzed by means of evolved gas analysis and ion        tified HOA (n = 12), BBOA (n = 10) and OOA (n = 12)
chromatography for quantification of the water-soluble to-         (reduced from high resolution, HR, to unit mass resolution,
tal carbon (TC) and the inorganic ions. Elemental and chro-        UMR, for better readability) together with their standard de-
matographic analyses of the filter samples are used to vali-       viation. The comparison between our profiles from the Po
date the AMS data for the main aerosol components (Org,            Valley and reference profiles is reported in Sect. S2.1 in terms
          2−
NO−                +        −
    3 , SO4 , NH4 and Cl ) and PMF factors, as reported in         of the theta angle (θ) between the spectra (Kostenidou et al.,
the Supplement (Tables S2 and S8).                                 2009). The theta angle is a metric for the similarity between
   Submicron particles were also sampled on prewashed and          two spectra (θ < 15◦ good; 15◦ < θ < 30◦ partial; θ > 30◦
prebaked quartz-fiber filters (PALL, 9 cm size) using HiVol        bad similarity).
samplers (a dichotomous sampler Universal Air Sampler,                 The HOA profile is characterized by peaks corresponding
model 310, MSP Corporation, at a constant nominal flow             to aliphatic hydrocarbons including m/z 27, 41, 43, 55, 57,
of 300 L min−1 or, alternatively, a TECORA eco-highvol             69, 71, etc. (Canagaratna et al., 2004). The median HOA pro-
equipped with a Digitel PM1 sampling inlet, nominal flow           file in our study shows a good overlap (mostly θ < 15◦ ) with
500 L min−1 ) located at ground level. Typically, two filters      almost all the reference spectra compared, as expected for
were collected every day in parallel with the Berner im-           this type of source, which is quite reproducible in terms of
pactor sampling time. The HiVol quartz-fiber samples were          AMS spectral characteristics (Crippa et al., 2014). Among
analyzed to identify organic molecular tracers (e.g., levoglu-     the HOA profiles found for the individual campaigns, only
cosan, hydroxymethansulfonate (HMSA) and low-molecular             one (SPC fall 2011) shows low correlations with the others
weight amines) using proton nuclear magnetic resonance             from this study and with the references. Such a discrepancy
(1 H-NMR) spectroscopy according to Decesari et al. (2006).        must be due to the peculiar conditions during the campaign,
The concentrations of the organic tracers identified by NMR        as the numerous fog events strongly impacted the OA time
are correlated with the PMF factors identified by the AMS,         trends and, in turn, also the ability of PMF to resolve source
trying to detail their chemical features and infer their sources   profiles. The aerosol observations during the SPC fall 2011
and atmospheric processing (especially for the OOAs).              campaign have already been thoroughly described by Gilar-
   Meteorological data are provided by the Hydro-Meteo-            doni et al. (2014) and will be summarized later in the discus-
Climate Service of the Regional Environmental Protection           sion.
Agency of Emilia Romagna (ARPAE). In addition, aerosol                 Unlike the HOA, the BBOA profiles are more variable,
liquid water content that is associated with the aerosol in-       in agreement with earlier findings (Grieshop et al., 2009;
                                                      2−
organic species (K+ , Ca+         +      +     +
                           2 , Mg2 , NH4 , Na , SO4 , NO3 ,
                                                              −
                                                                   Heringa et al., 2011) showing that the biomass burning
Cl−) was predicted by the ISORROPIA-II model used in re-           aerosol mass spectrum is strongly affected by burning con-
verse mode (Fountoukis and Nenes, 2007).                           ditions and types of wood/biomass. Nonetheless, the decon-
                                                                   volved BBOA profiles show good similarities to many refer-
                                                                   ence spectra from previous studies, with their characteristic
3     Results and discussion                                       peaks at m/z 29 (CHO+ ), 60 (C2 H4 O+                         +
                                                                                                            2 ) and 73 (C3 H5 O2 ),
                                                                   which are associated with fragmentation of anhydrosugars
3.1    Organic aerosol source apportionment                        such as levoglucosan (Alfarra et al., 2007; Aiken et al.,
                                                                   2009).
The source apportionment procedure allowed the identifica-             The COA factor was identified without any constraint only
tion of various components tracing the contributions of pri-       during the BO spring 2014 campaign. Its spectral profile ex-
mary and secondary organic aerosol sources: hydrocarbon-           hibits good similarities to the correspondent reference spec-
like organic aerosol (HOA) resulting from the combustion of        tra (Mohr et al., 2012; Crippa et al., 2013a). The presence of
fossil fuels (e.g., vehicular traffic); BBOA (biomass burning      this COA factor reduced sensibly the model residuals in the
organic aerosol) resulting from biomass combustion, mainly         central part of the day, and it is therefore considered in the
associated with wood combustion for domestic heating; and          final solution.
COA (cooking organic aerosol) associated with specific food            The more oxidized factors (OOAs) differ from each other
cooking practices. The latter is found just as a minor compo-      for the fractional abundance of m/z 43 and 44 and for the
nent of OM and only in one campaign at BO (spring 2014).           intensity of other fragments such as 29, 60 and 73. The spec-
The rest of the mass of sub-micrometer organic aerosol con-

Atmos. Chem. Phys., 20, 1233–1254, 2020                                             www.atmos-chem-phys.net/20/1233/2020/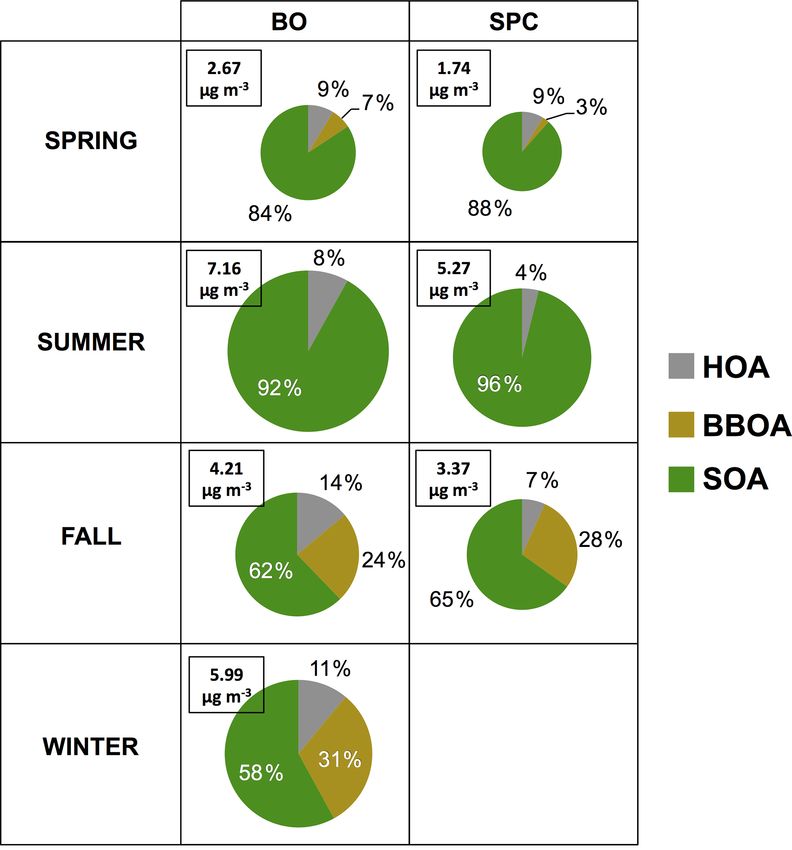
M. Paglione et al.: Impact of biomass burning and aqueous-phase processing on air quality                                             1239

Figure 3. Mass spectral variability for the main retrieved OA sources. Mean values are represented with circles and the ± standard deviation
with error bars. COA from the BO spring 2014 campaign is represented in red color over-imposed on the COA reference spectrum from
Crippa et al. (2013a).

tral characteristics of the specific OOA factors are discussed             The daily trends of each organic component exhibit
in Sect. 4.                                                             consistent characteristics during all the campaigns. HOA
   The correlation parameters between the time trends of                presents a diurnal cycle characterized by two maxima cor-
AMS organic factors and of atmospheric tracer compounds                 responding to the rush hours (impacted by the greatest ve-
are shown in Table S8. The time series of HOA corre-                    hicular traffic) between 8–9 and 18–20, in agreement with
lates with that of elemental carbon (EC) or black carbon                the attribution of this fraction to traffic sources. This is espe-
(BC) and with that of NOx . The correlation with NOx                    cially evident at the urban site of Bologna compared to the
points to major sources of HOA from traffic. The trend of               rural one, at which the concentrations of HOA are lower and
BBOA concentrations instead correlates with the trend for               rush hour signatures are weak, as expected for a rural back-
levoglucosan (measured by offline techniques: GC/MS or                  ground site. BBOA is characterized by a daily cycle with a
1 H-NMR) and with the organic fragments at m/z 60 and                   midday minimum and a night-time maximum. This behav-
73, which have been previously shown to be good mark-                   ior reflects the combination of two factors: the influence of
ers for biomass burning (Alfarra et al., 2007; De Carlo                 the mixing-layer height – which favors pollutant accumu-
et al., 2008; Aiken et al., 2009). The concentration ratios             lation near the ground at nighttime – and the daily pattern
between POA factors and tracer compounds (HOA / BC,                     of the emissions from domestic heating, increasing in the
HOA / NOx , BBOA / levoglucosan, etc.) are shown in Ta-                 evening/night hours. The concentrations of COA exhibit a
ble S9 and compared with literature ranges. The overall good            characteristic daily trend with two maxima corresponding
agreement between these source-specific ratios and the lit-             to the hours of main meals, one in the central hours of the
erature ranges confirms our apportionment of POA compo-                 day (12–14) and the other in the evening (20–21, more pro-
nents. The time trends of the OOA concentrations are con-               nounced due to the shallow boundary layer after the sunset).
trasted with those of secondary inorganic species (i.e., NO− 3,         Finally, OOA exhibits an almost flat daily trend, reflecting its
    2−          +                                                       regional nature or the influence of multiple secondary forma-
SO4 and NH4 ) and with the organic fragments at m/z 43
(Org_43 = C2 H3 O+ ) and 44 (Org_44 = CO+     2 ) generally ex-
                                                                        tion processes. Therefore, the weak diurnal trends of OOA
hibiting good correlations.                                             were not informative of potential sources of SOA in this re-
   The identified factors’ daily trends (HOA, BBOA, COA                 gion.
and OOA) are shown in Fig. 4. Median diurnal patterns are
shown together with the 10th, 25th, 75th and 90th percentiles           3.2    POA and SOA contributions, seasonality and
for each factor, for the lumped datasets from all Supersito                    spatial variability
campaigns and separately for Bologna (BO) and San Pietro
Capofiume (SPC).                                                        Table 2 summarizes the site-specific and campaign-specific
                                                                        contributions of OA components determined by AMS factor
                                                                        analysis (see also Fig. 5). A few clear seasonal patterns can

www.atmos-chem-phys.net/20/1233/2020/                                                      Atmos. Chem. Phys., 20, 1233–1254, 2020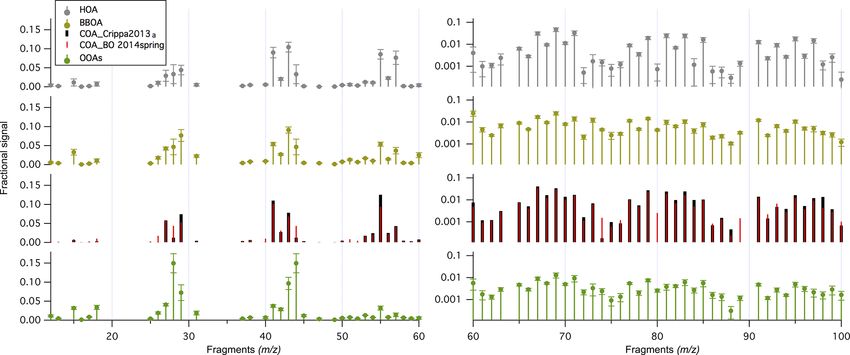
1240                            M. Paglione et al.: Impact of biomass burning and aqueous-phase processing on air quality

Figure 4. Daily trends of the factors identified (HOA, BBOA, COA and SOA). Median diurnal patterns are shown together with the 10th,
25th, 75th and 90th percentiles for each source, for all the Supersito campaigns together and separately for Bologna (BO) and San Pietro
Capofiume (SPC).

Table 2. Relative (%) and absolute mass contributions (µg m−3 ) of the main organic aerosol components HOA, BBOA, COA and OOA for
all the considered campaigns. BO: Bologna; SPC: San Pietro Capofiume.

                                                            HOA          BBOA           COA            OOA
                           BO      Spring     2013    12 % (0.25)    14 % (0.29)            –    73 % (1.49)
                                              2014     6 % (0.18)     2 % (0.06)   8 % (0.28)    84 % (2.71)
                                   Summer     2012     8 % (0.58)              –            –    92 % (6.58)
                                   Fall       2011    18 % (2.80)    38 % (6.05)            –    44 % (7.00)
                                              2012    16 % (0.74)    30 % (1.37)            –    54 % (2.50)
                                              2013    11 % (0.43)    17 % (0.64)            –    72 % (2.74)
                                   Winter     2013    11 % (0.88)    28 % (2.35)            –    61 % (5.14)
                                              2014    12 % (0.43)    38 % (1.37)            –    50 % (1.80)
                           SPC     Spring     2013     9 % (0.15)     3 % (0.05)            –    88 % (1.54)
                                   Summer     2012     4 % (0.20)              –            –    96 % (5.06)
                                   Fall       2011    32 % (2.93)    33 % (3.07)            –    35 % (3.29)
                                              2013     7 % (0.23)    28 % (0.95)            –    65 % (2.20)

be identified, especially for the Bologna urban site, for which       aspects: the reduction of work and school activities in sum-
a higher number of measurements are available (Fig. 5).               mertime nearby the sampling areas, leading to a reduction of
   In Bologna, HOA contributes 11 %–18 % of the mass of               traffic emissions, and a possible meteorological effect due to
sub-micrometric OA in fall–winter and 6 %–12 % in spring–             the higher mixing layer, resulting in an enhanced dilution of
summer. The slightly lower average HOA contribution dur-              the primary pollutants locally emitted.
ing the warmer season likely reflects the combination of two

Atmos. Chem. Phys., 20, 1233–1254, 2020                                                 www.atmos-chem-phys.net/20/1233/2020/
M. Paglione et al.: Impact of biomass burning and aqueous-phase processing on air quality 1241
Figure 5. Organic aerosol source contributions for each site and each Supersito campaign. Relative contributions are shown as shaded
histograms (referring to the left axis) in the background of the absolute ones (referring to the right axis).
The contribution of BBOA varies instead from 17 % to
38 % in the fall–winter campaigns to 0 %–14 % in summer–
spring. In particular, the contribution of BBOA has not been
detected in the summer period. Biomass burning therefore
dominates over fossil fuel combustion as a source of primary
organic aerosols at the urban site during the cold season. At
the same site, OOA contributes 44 %–68 % of the mass of
sub-micrometric OA in fall and winter, while its contribution
in the spring and summer period increases to 74 %–92 %. The
higher relative contribution of OOA in the warm period is ex-
pected given the reduction in residential combustion and the
increased photochemistry. However, the OOA fraction in the
cold season is still quite high, considering the latitude and
climate of Bologna, where sunshine duration in winter is less
than 3 h per day (in contrast to the almost 9 h in the summer).
A discussion about SOA formation mechanisms alternative
to gas-phase photochemistry is presented later in Sect. 4.2.
At the rural site of San Pietro Capofiume, as expected, the
dominant contribution to POA in the cold periods is provided
by BBOA (varying between 28 % and 33 % of the total OA
mass during the 2013 and 2011 fall campaigns, respectively),
and the contribution of OOA to total OA is larger than at the
urban site (35 %–65 % in fall, and reaching 96 % in summer).
Peculiar results were found for the SPC fall 2011 campaign,
during which very large contributions of POA were recorded:
Figure 6. Seasonal relative contribution of the main OA sources at
the HOA fraction reached 32 % of the OA mass, somewhat
both the urban and rural sites. The pie-chart area is proportional to
strange for a rural site. Gilardoni et al. (2014) specifically
the total average concentration of OA (shown on the upper-left side
studied this campaign, suggesting that these high HOA rela- of each box in terms of µg m−3 ) and the individual portions are the
tive contributions are likely due to the occurrence of persis- averages between the different campaigns made at the sites in one
tent fogs, which scavenge the most water-soluble OA com- season.
ponents and leave the interstitial aerosol enriched in its most
www.atmos-chem-phys.net/20/1233/2020/ Atmos. Chem. Phys., 20, 1233–1254, 20201242 M. Paglione et al.: Impact of biomass burning and aqueous-phase processing on air quality
Table 3. Urban increment, calculated as the ratio between the cam- HOA (1.67, 1.91 and 2.85 in spring, fall and summer, respec-
paign average concentration at the urban and rural sites, for each tively), in agreement with a major HOA source from urban
season and OA fraction considered. traffic. The urban increment of BBOA is less clear: it varies a
lot between spring (in which its value is very high, i.e., 5.87)
Urban increment HOA BBOA OOA OA TOT and fall (with 0.67). Nevertheless, the spring value is affected
Spring 2013 1.67 5.87 0.97 1.17 by the low and intermittent high BBOA levels, likely indicat-
Summer 2012 2.85 – 1.30 1.36 ing very local sources. The fall value seems more representa-
Fall 2013 1.91 0.67 1.25 1.13 tive and suggests a higher contribution of BBOA in the rural
areas, probably due to the more spread use of fire places and
wood stoves for domestic heating and to additional possible
sources such as agricultural burning.
hydrophobic organic components (i.e., HOA) (Gilardoni et
al., 2014).
A summary of the seasonality of OA fractions at the two 4 SOA sources and their evolution
Po Valley sites is shown in Fig. 6. The COA fraction, which
In the previous section we presented OOA as one single com-
was determined only at BO during one individual campaign
ponent; however, the HR-ToF-AMS statistical analysis iden-
and in small amounts, was not considered here to simplify
tified various OOA types that may indicate different forma-
the comparison between the other components. The SPC fall
tion (sources) and transformation processes (aging) of SOA
2011 campaign was also not included in this statistic since
in the aerosol. The number of OOA categories identified dur-
the aerosol composition and concentrations for this experi-
ing the Supersito campaigns ranged from one (for the SPC
ment referred to a mixture of total OA and interstitial OA in
fall 2011 campaign) to four (for the SPC summer 2012 cam-
fog conditions, as mentioned above and better described in
paign). Most of the IOPs (7 out of 12) allowed the identifica-
Gilardoni et al. (2014).
tion of three OOA factors.
Table S10 shows the correlation coefficients between the
The spectral profiles of the individual OOAs are distin-
PMF factors discussed so far and the main chemical species
guishable based on minor mass fragments and other parame-
constituting the sub-micrometric aerosol masses measured
ters. Among the most common parameters used in the litera-
by the HR-ToF-AMS. The highest correlations are observed
ture for the distinction and interpretation of the various OOA
between OOA and secondary inorganic species, nitrate and
factors are elemental ratios (OM : OC, O : C and H : C), the
ammonium sulfate, confirming the secondary nature of this
carbon oxidation state (OSc) and the fractional abundance f
fraction of OA. In particular, it can be noticed that OOA cor-
(where the f no. is the ratio between the abundance of a spe-
relates better with ammonium nitrate in winter and fall, and
cific ion and the total organic spectrum) of specific fragments
with ammonium sulfate in summer and late spring, in agree-
in their spectral profiles (CO+ +
2 at m/z 44 (f 44); C2 H3 O at
ment with previous results (Zhang et al., 2011; Canonaco et +
m/z 43 (f 43); C2 H4 O2 at m/z 60 (f 60); etc.). The elemen-
al., 2015). This behavior likely reflects the differences in tem-
tal ratios and the relative proportion between f 43 and f 44
perature and relative humidity between winter and summer,
generally indicate the degree of oxidation and therefore the
which shift the partitioning of nitrate toward the gas phase
extent of aging of a single factor (normally the less oxidized
(due to its volatility) during the warm season. In addition,
components exhibit higher H : C, lower O : C and less f 43
the different correlation suggests the possibility of different
and f 44, while OOAs have O : C and f 44 increasing with
oxidation pathways in secondary species formation between
their degree of oxidation and aging in the atmosphere, largely
the cold and warm seasons: a pathway characterized by cold
due to the formation of carboxylic acids during this process)
temperature and high relative humidity (correlating with ni-
(Ng et al., 2010; Duplissy et al., 2011).
trate) and another one related to higher temperature and pho-
Tables S12 and S13 show a summary of the parameters
tochemical activity (correlating more with sulfate). The latter
for the analysis and interpretation of all the factors identi-
hypothesis will be better developed in the following sections.
fied by the PMF statistical analysis (including the different
For the campaigns carried out in parallel at the urban and
OOAs listed in order of their O : C ratios) during the cam-
rural sites (summer 2012, spring 2013 and fall 2013), we es-
paigns of the Supersito project. We focus on two aspects:
timated an “urban increment”, i.e., the increase in OA-type
the influence of biomass burning emissions on OOA compo-
concentrations in urban areas with respect to the regional
nents and the importance of the aqueous-phase processing in
background. We expressed the increment as the ratio between
their formation and evolution. A more comprehensive anal-
the campaign average concentrations at the urban vs. rural
ysis of the OOA features of particular IOPs is the object of
sites, according to the season and the specific OA fraction
specific publications (Gilardoni et al., 2014, 2016; Sullivan
considered (see Table 3). For total organic aerosol (OA) and
et al., 2016).
for its OOA fraction, the ratios are quite constant through-
out the seasons, varying between 1.13 and 1.36 and 0.97 and
1.30, respectively. By contrast, higher values were found for
Atmos. Chem. Phys., 20, 1233–1254, 2020 www.atmos-chem-phys.net/20/1233/2020/M. Paglione et al.: Impact of biomass burning and aqueous-phase processing on air quality 1243
Figure 7. Influence of biomass burning emissions on SOA and their evolution processes. The plots in panels (a), (b) and (c) show f 44 (the
normalized mass spectrum at m/z 44), which is a proxy of the OA oxygenation degree, vs. f 60 (the normalized mass spectrum signal at m/z
60), which is a proxy of anhydrosugars. Different shapes of the markers identify different Supersito campaigns (a, b) or different reference
spectra (c). Different colors represent the different kinds of PMF factors: gold–green identifies BBOA primary factors, yellow, green and red
the OOAs numerically ordered based on their O : C ratios. Black dots in (c) represent the measurements taken as the background level of no
influence of biomass burning. Grey areas correspond to f 60 0.003 ± 0.002 representing the Cubison et al. (2010) threshold of BB influence.
(d) shows a van Krevelen (VK) diagram of the BBOA and OOA-BB PMF factors obtained from the HR-ToF-AMS data analysis for both BO
fall 2011 (red markers) and winter 2013 (blue markers). The line connecting BBOA and OOA-BB has different slopes, indicating different
chemistry processing leading to different SOA types.
4.1 Biomass burning influence on SOA At the same time, atmospheric aging leads to the oxidation
of the molecules, which corresponds to the increase in oxy-
The products of cellulose pyrolysis, such as levoglucosan genated fragments in the mass spectrum, the most intense of
and similar species (mannosan, galactosan, etc., collectively which is at m/z 44 (CO+ 2 , f 44).
called hereinafter “anhydrosugars”), generate mass spectra The contribution of f 60 to the different OA components
with an enhanced signal at m/z 60 and 73 due to the ions of each campaign is represented in Fig. 7 by points in the
C2 H4 O+ +
2 and C3 H5 O2 , which are therefore considered good
f 44 vs. f 60 space (Cubison et al., 2011) together with those
tracers of wood combustion (Schneider et al., 2006; Alfarra of some references from previous studies (Aiken et al., 2009;
et al., 2007). So, the parameter f 60 (the ratio of the inte- Ng et al., 2011; Mohr et al., 2012; Saarikoski et al., 2012;
grated signal at m/z 60 to the total signal of the OA mass Crippa et al., 2014; Florou et al., 2017). The background
spectrum) is used as a marker to evaluate the influence of level indicating no influence of biomass burning is repre-
biomass burning emissions on the OA components (Cubison sented in Fig. 7a–c by a grey shaded area. As an additional
et al., 2011). reference of OA not influenced by biomass combustion, we
Fresh biomass burning emissions (BBOA factors) exhibit also report the measurements carried out during the summer
the highest content of anhydrosugars (f 60). During atmo- 2012 parallel campaign at the high-altitude background sta-
spheric aging, the relative intensity of the anhydrosugar sig- tion of Monte Cimone (Rinaldi et al., 2015).
nal decreases because of degradation and oxidation reactions.
www.atmos-chem-phys.net/20/1233/2020/ Atmos. Chem. Phys., 20, 1233–1254, 20201244 M. Paglione et al.: Impact of biomass burning and aqueous-phase processing on air quality
Figure 7a–c show that the spectral features of the OOA oxidation processes driven by OH radicals which might take
factors from several campaigns are those typical of aged OA place both in the gas and aqueous phases (Ng et al., 2011; Ti-
(large f 44), but they also indicate the presence of anhydro- monen et al., 2013; McNeill, 2015). Conversely, OOAx_BB-
sugars above the background level. This suggests a variable aq formation (slope 0) is consistent with the hydroxyl group
influence of biomass combustion on the OOA factors. formation possibly taking place in aerosol water (i.e., wet
Such OOA factors influenced by biomass burning aerosol) through dark chemistry (Lim et al., 2010; Gilardoni
(OOAx_BB) represent a substantial mass fraction of the et al., 2016; Ervens et al., 2011), a hypothesis better assessed
total OA during the fall–winter period (17 %–61 % at the in the next paragraph.
Bologna site and 14 %–35 % at SPC). In the spring season,
the biomass burning impact on OOA composition is much 4.3 Aqueous-phase chemistry in SOA formation
less evident (f 60 closer to the background levels), but still
represents 37 % of the total OA, more than twice the contri- Figure 8 shows the variations in contributions of the two BB-
bution of POA at BO during the spring 2013 campaign. influenced OOA factors identified during the BO fall 2011
Additional tests and details on the determination of the campaign as a function of RH, together with some other
biomass burning influence on OOA components are dis- meteorological and chemical parameters. The aerosol liquid
cussed in Sect. S2.2.3. water content (ALWC), as calculated by the ISORROPIA-
II model, and the hydroxymethanesulfonate (HMSA) were
4.2 Biomass burning oxidation pathways used to trace the effects of aqueous-phase SOA formation. In
fact, HMSA is formed by the reaction of sulfite and bisul-
The vertical axis in Fig. 7 is controlled by the oxidation of fite with dissolved formaldehyde in droplets and deliquesced
the bulk OA, and the horizontal axis by the anhydrosug- aerosols and is oxidized by ozone at concentrations as low
ars loss. Thus, depending on the relative rates of these pro- as 10 ppb (Kok et al., 1986; Facchini et al., 1992; Whiteaker
cesses, the slopes of the virtual lines connecting the primary and Prather, 2003). We suggest here that formaldehyde (as
factors (BBOAs) and the corresponding aged PMF factors well as a number of other gaseous compounds including
(OOAx_BB) are expected to be different. We do see indeed ketones, aldehydes, and small carboxylic acids in the BB
that the slopes vary in different campaigns. We also see that plumes, Schauer et al, 2001; Andreae, 2019) would preferen-
two OOA_BB factors detected during the BO fall 2011 and tially partition into particles at high ALWC and would react
winter 2013 campaigns are connected to the primary BBOA to form HMSA (and/or other products). Then the products
with different slopes in the f 60 vs. f 44 space (as shown by of these aqueous-phase reactions (such as HMSA) remain
the arrows in Fig. 7a). This variability could suggest that the in the particle phase after water evaporation, changing the
two OOA_BB components, observed during the same exper- chemical composition of the organic aerosol. For this reason,
iment, are formed through different oxidation rates and path- considering also that HMSA formation is inhibited by pho-
ways due to the variable environmental conditions. tochemistry (due to its fast reaction with ozone) and that the
In order to test this hypothesis, the evolution of the BBOA analyzed aerosol was dried before sampling, the correlation
into OOAs is further analyzed for BO fall 2011 and BO win- of some factors with HMSA can be considered reliable evi-
ter 2013 in Fig. 7d using the O : C and hydrogen-to-carbon dence of the aqueous-phase formation pathway of some OA
(H : C) ratios of the BBOA and OOAx_BB factors in the van fractions. HMSA was detected by the HR-ToF-AMS (fol-
Krevelen (VK) diagram. The VK diagram is typically used lowing the estimation method presented by Ge et al., 2012)
to investigate the OA evolution during field and laboratory during all the campaigns, and its presence and concentration
experiments (Heald et al., 2010; Ng et al., 2011). The plot were confirmed by offline H-NMR analysis of filter sam-
allows us to remove the effect of physical mixing between ples. ALWC and HMSA exhibit a strong increase as a func-
secondary and primary aerosols, providing a clearer inter- tion of RH during the campaign, confirming the influence of
pretation of the results. Aerosol aging has the overall effect aqueous-phase processing at high RH levels (Fig. 8a). At the
of increasing O : C ratios. In the VK plot the H : C vs. O : C same time, temperature and solar radiation (Fig. 8b) decrease
slope of 0 is equivalent to the replacement of a hydrogen as a function of RH, suggesting a reduction of photochemical
atom with an OH moiety, whereas a slope of −1 indicates activity.
the formation of carboxylic acid groups (Ng et al., 2011). These ambient conditions result in a large increase in the
O : C and H : C values are reported for BBOA (triangles) and contribution of OOA2_BB-aq, whereas the OOA1_BB con-
OOA_BB factors (squares and circles). The slope of the line centration remained relatively constant (Fig. 8c).
that links BBOA to the circles (i.e., OOAx_BB-aq) is close Extending this analysis to all the campaigns (see also
to zero, while the line linking BBOA to the squares (i.e., Fig. S5), we identified at least one OOA factor originat-
OOAx_BB) is between −0.5 and −1, suggesting possible ing from biomass burning through aqueous-phase processing
different oxidation pathways. The negative slope indicates (OOAx_BB-aq) in 8 out of the 12 datasets (all fall and win-
that OOAx_BB likely formed from BBOA through forma- ter campaigns plus spring 2013). The correlations of all the
tion of carboxylic acid moieties, suggesting photochemical OOAs with the aerosol liquid water content (ALWC) and the
Atmos. Chem. Phys., 20, 1233–1254, 2020 www.atmos-chem-phys.net/20/1233/2020/Table 4. Correlation (Pearson coefficients, R) between OOA components identified by PMF/ME-2 and some variables linked to the aqueous phase: relative humidity (RH) of the air;
aerosol liquid water content (ALWC) calculated by the ISORROPIA II model; hydroxymethanesulfonate (HMSA) estimated by AMS and (when available) NMR measurements. Bold
fonts highlight the identified aqSOA factors.
BO SPC
RH ALWC HMSA (AMS) HMSA (NMR) RH ALWC HMSA (AMS) HMSA (NMR)
Spring 2013_spring OOA1_BB 0.53 0.56 0.12 – OOA1 0.38 0.65 0.36
(May) OOA2 −0.15 0.53 0.40 – OOA2 0.19 0.76 0.55
OOA3_BB-aq 0.33 0.75 0.62 – OOA3 −0.09 0.53 0.58
www.atmos-chem-phys.net/20/1233/2020/
2014_spring OOA1 0.25 0.11 −0.03 –
(May) OOA2 −0.09 −0.07 0.40 –
OOA3 0.13 0.23 0.56 –
Summer 2012_summer OOA1 −0.26 0.12 −0.28 0.32 OOA1 0.08 0.20 0.33
(Jun–Jul) OOA2 0.38 0.31 −0.47 0.13 OOA2 0.50 0.79 0.20
OOA3 0.15 0.38 0.51
OOA4 −0.27 −0.22 0.42
Fall 2011_fall. OOA1_BB −0.12 0.63 −0.06 – OOA_BB-aq 0.00 0.88 0.77 0.66
(Nov–Dec) OOA2_BB-aq 0.43 0.82 0.58 –
2012_fall OOA1 0.00 −0.01 −0.04 –
(Oct–Nov) OOA2_BB-aq 0.26 0.83 0.70 –
OOA3_BB 0.11 0.20 0.55 –
2013_fall OOA1 −0.29 0.16 −0.22 0.15 OOA1_BB −0.24 −0.29 −0.06 −0.17
(Oct) OOA2 0.28 0.65 0.76 0.53 OOA2_BB-aq 0.07 0.63 0.68 0.70
OOA3_BB-aq 0.34 0.82 0.81 0.86 OOA3 −0.04 0.28 0.45 0.25
Winter 2013_winter OOA1_BB 0.06 0.43 0.24 0.23
M. Paglione et al.: Impact of biomass burning and aqueous-phase processing on air quality
(Jan–Feb) OOA2_BB-aq 0.33 0.73 0.68 0.47
OOA3 0.29 0.32 0.19 0.16
2014_winter OOA1_BB 0.16 0.38 0.43 0.57
(Jan–Feb) OOA2_BB-aq 0.31 0.74 0.72 0.71
OOA3 −0.11 0.63 0.44 0.60
Atmos. Chem. Phys., 20, 1233–1254, 2020
12451246 M. Paglione et al.: Impact of biomass burning and aqueous-phase processing on air quality
Figure 8. Variations of meteorological and chemical parameters as a function of RH during the BO fall 2011 campaign. The data were
binned according to the RH (5 % increment), and mean values are shown for each bin. (a) Aerosol liquid water content (ALWC) and
hydroximethansulfonic acid (HMSA). (b) Air temperature together with solar radiation and wind speed (WS) measured at ground level.
(c) Variations in the contributions of the two BB-influenced OOA factors identified (OOA1_BB and OOA2_BB-aq) in both absolute (µg m−3 )
and relative (% of OOA) terms.
hydroxymethanesulfonate (HMSA) are summarized in Ta- ical fragments of methylglyoxal and glyoxal that are pre-
ble 4 (and also shown in Fig. 9 for the OOAx_BB-aq factors). cursors of SOA via cloud processing (Carlton et al., 2007;
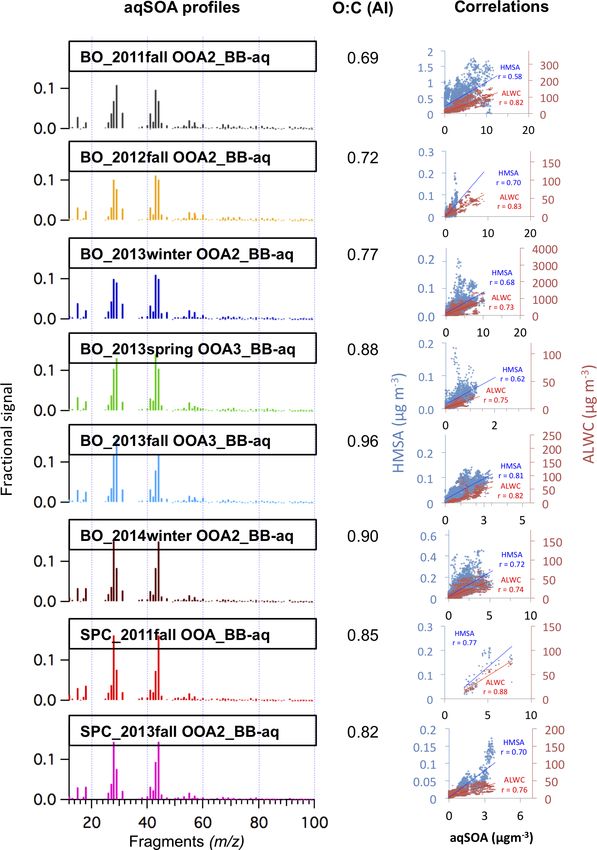
The spectral profiles of these OOA_BB-aq factors orig- Altieri et al., 2008). We further stress the link between
inating from aqueous-phase processing (shown in Fig. 9) biomass burning and these aqSOAs by looking at the cor-
are characterized by higher signals at m/z 29 (CHO+ ) and relations of these components with specific fragment ions
m/z 58 (C2 H2 O+ 2 ) in addition to the more common m/z 43 of aqueous-phase products of phenol and guaiacol emitted
(C2 H3 O+ ), m/z 44 (CO+ +
2 ) and m/z 60 (C2 H4 O2 ) that also during the biomass burning (namely PhOH-OH, C6 H6 O+ 2,
characterized the other BB-influenced secondary compo- m/z 110.037; PhOH-2OH, C6 H6 O+ 3 at m/z 126.032; GUA-
nents. The OOAx_BB-aq factors’ spectra also have good OH, C7 H8 O+ 3 at m/z 140.047; GUA-2OH, C7 H8 O4 at m/z
+
similarities (4 < θ angle < 29; see Table S15) between each 156.042) already identified in previous laboratory studies (Yu
other and to the OOA spectra recorded after fog dissipation et al., 2014). Moreover, considering the elemental composi-
at SPC during fall 2011 (Gilardoni et al., 2016). tion of the OOAx_BB-aq (Tables S12–S13 and Fig. 9), we
The conclusion that these components are affected by notice that their O : C ratios, calculated following the ambient
aqueous-phase processing is further supported by the cor- improved (AI) method (Canagaratna et al., 2015), are similar
relations between the OOAx_BB-aq factors and some spe- (on average 0.82 ± 0.09) to the AI O : C ratios obtained from
cific fragment ions. As shown in Table S16 all the aq- laboratory oxidation of phenolic compounds (0.89 ± 0.10,
SOAs identified during Supersito campaigns are well cor- Sun et al., 2010; 1.03 ± 0.17, Yu et al., 2014) and from the
related with C2 H2 O+ + +
2 , C2 O2 and CH2 O2 , which are typ- laboratory-generated SOA from the photo-oxidation of or-
Atmos. Chem. Phys., 20, 1233–1254, 2020 www.atmos-chem-phys.net/20/1233/2020/M. Paglione et al.: Impact of biomass burning and aqueous-phase processing on air quality 1247 Figure 9. OOAx_BB-aq main features: the left column shows the mass spectral profile of each BB-aqSOA component identified during the Supersito campaigns; the OOA factors are numerically ordered for each campaign based on their O : C ratios; the central column shows the O : C elemental ratios of the same factors; the right column illustrates the correlation between their concentration time series and the HMSA (in blue) and the ALWC (in red). ganic precursors in the aqueous phase (0.89 ± 0.13, Lee et ten more than half of the total SOA influenced by BB emis- al., 2011, 2012). sions, while the other half undergoes photochemical oxida- In conclusion, BB-influenced SOA formed by aqueous- tion pathways leading to OOAx_BB. Overall, our results sup- phase processing (bb-aqSOA) identified during the Super- port the importance in the Po Valley of SOA formation by sito campaigns represents a substantial mass fraction of the aqueous-phase processing of wood combustion reported by total OA during the fall–winter months (14 %–28 % at the Gilardoni et al. (2016), extending the ambient observations Bologna site and 14 %–35 % at SPC). This component is of- of these phenomena to a larger dataset (Fig. 10). www.atmos-chem-phys.net/20/1233/2020/ Atmos. Chem. Phys., 20, 1233–1254, 2020
1248                            M. Paglione et al.: Impact of biomass burning and aqueous-phase processing on air quality

                                                                         The possibility of comparing the organic factors identified
                                                                      by the HR-AMS with additional chemical tracers measured
                                                                      in parallel by other advanced spectroscopic techniques (i.e.,
                                                                      NMR) and more traditional ones (IC, GC / MS, OC / EC,
                                                                      etc.) provided new insights into the detailed chemical struc-
                                                                      ture and especially into the formation and aging mechanisms
                                                                      of SOA.
                                                                         On the multi-year basis of the project, OA represents on
                                                                      average 45 ± 8 % (33 %–58 %) and 46 ± 7 % (36 %–50 %) of
                                                                      the total non-refractory submicron particles (PM1 -NR) at the
                                                                      urban and rural sites, respectively, within the range reported
                                                                      in the literature for other European sites (Crippa et al., 2014)
                                                                      and the Asian regions (Hu et al., 2017; Li et al., 2015; Wu et
                                                                      al., 2018, for China and East Asia; Chakraborty et al., 2018,
                                                                      for India), and slightly less than the values reported for the
                                                                      southeastern US (50 %–75 %, Xu et al., 2015; Budisulistior-
                                                                      ini et al., 2016). Among this fraction, primary sources (POA)
                                                                      are dominated by biomass burning (23 ± 13 %), especially
                                                                      at the rural site (SPC), whereas the fossil fuel combustion
                                                                      (12 ± 7 %) is higher at the urban background site (Bologna),
                                                                      where it also presents a marked seasonality. However, the
Figure 10. Seasonal relative contribution of the main OA sources
at both the urban and rural sites with explicit separation also of
                                                                      biomass burning contribution to POA remains the most im-
the SOA (OOA) components. The pie-chart area is proportional to       portant source of POA also at the urban site during the cold
the total average concentration of OA (shown on the upper-left side   fall/winter seasons. The BBOA contribution ranging from
of each box in terms of µg m−3 ) and the individual portions are      17 % to 38 % at Bologna during the fall/winter seasons is
the averages between the different campaigns made at the site in      not far from the values reported for other European cities
one season. OOA factors influenced by biomass burning (charac-        (10 %–40 % in Paris, Crippa et al., 2013b; 5 %–27 % from the
terized by a brown background color) are divided into the two cat-    EUCAARI multi-site study, Crippa et al., 2014) and United
egories, “bb-SOA” and “bb-aqSOA”, representing the OOAx_BB            States areas (e.g., 15 %–33 % for the southeastern US, Bud-
and OOAx_BB-aq described in the text. “Other SOA” is the sum          isulistiorini et al., 2016), and slightly higher than that of other
of the other OOA factors whose source has not been unequivocally      highly populated and polluted cities/regions of Asia (11 %–
identified.
                                                                      14 % at Beijing, China, Sun et al., 2018; 10 %–20 % at Kun-
                                                                      pur, India, Chakraborty et al., 2018), where, however, other
5   Conclusions                                                       combustion sources (i.e., coal) contribute to the POA frac-
                                                                      tion.
The Supersito project constitutes the first extensive (multi-            The contributions of OOA (used as a proxy for SOA) were
site and multi-year) time-resolved aerosol chemical experi-           found to be much higher than the primary ones, regardless
ment in the Po Valley. Eight intensive observation periods            of site and season, with multi-year averages of 66 % (44 %–
(IOPs) were carried out over the 4 years of the project (from         92 %; standard deviation SD = 16 %) and 71 % (35 %–96 %;
2011 to 2014) at two different sites (Bologna, urban back-            SD = 27 %) of the total OA mass, at the urban and rural sites,
ground, and San Pietro Capofiume, rural background) using             respectively. The SOA dominance is also observed during
a High Resolution Aerosol Mass Spectrometer (HR-AMS).                 winter at the urban site, where the SOA represents on average
The source apportionment of the OA allowed improvement                56 % (50 %–61 %; SD = 8 %) of the total OA mass. Within
of our understanding of aerosol sources, their chemical fea-          this SOA, the measurements highlight the dominant presence
tures and the spatial–temporal variability in the region, one of      of biomass burning secondary components, even in the urban
the most important pollution hotspots in Europe. Considering          background. The HR-AMS data indicate that the OA mass
the special focus of the project on the cold season (three cam-       contributions of this SOA factor influenced by wood com-
paigns in fall and two in winter, out of eight in total), it was      bustion were on the order of 14 %–44 %, which translates
especially possible to investigate the wintertime SOA forma-          into biomass burning emissions representing the 31 %–82 %
tion pathways, which are the less characterized and, for this         of the OM mass in the Po Valley during cold months (fall and
reason, one of the most important missing processes in at-            winter). Significant contribution of aged BB emissions on the
mospheric chemistry and air quality models (Tsimpidi et al.,          OA mass loadings has already been suggested by previous
2016).                                                                studies regarding the Po Valley (Saarikoski et al., 2012) and
                                                                      different European (Paris, France, Crippa et al., 2013b; east-
                                                                      ern Mediterranean, Bougiatioti et al., 2014; Athens, Greece,

Atmos. Chem. Phys., 20, 1233–1254, 2020                                                 www.atmos-chem-phys.net/20/1233/2020/
You can also read