Aptian-Albian clumped isotopes from northwest China: cool temperatures, variable atmospheric pCO2 and regional shifts in the hydrologic cycle
←
→
Page content transcription
If your browser does not render page correctly, please read the page content below
Clim. Past, 17, 1607–1625, 2021
https://doi.org/10.5194/cp-17-1607-2021
© Author(s) 2021. This work is distributed under
the Creative Commons Attribution 4.0 License.

Aptian–Albian clumped isotopes from northwest China: cool
temperatures, variable atmospheric pCO2 and regional
shifts in the hydrologic cycle
Dustin T. Harper1 , Marina B. Suarez1,2 , Jessica Uglesich2 , Hailu You3,4,5 , Daqing Li6 , and Peter Dodson7
1 Department    of Geology, The University of Kansas, Lawrence, KS, USA
2 Department    of Geological Sciences, University of Texas, San Antonio, TX, USA
3 Key Laboratory of Vertebrate Evolution and Human Origins, Institute of Vertebrate Paleontology and Paleoanthropology,

Chinese Academy of Sciences, Beijing, PR China
4 Chinese Academy of Science Center for Excellence in Life and Paleoenvironment, Beijing, PR China
5 College of Earth and Planetary Sciences, University of Chinese Academy of Sciences, Beijing, PR China
6 Institute of Vertebrate Paleontology and College of Life Science and Technology,

Gansu Agricultural University, Lanzhou, PR China
7 Department of Biomedical Sciences, The University of Pennsylvania, Philadelphia, PA, USA

Correspondence: Dustin T. Harper (dtharper@ku.edu)

Received: 25 November 2020 – Discussion started: 21 December 2020
Revised: 20 May 2021 – Accepted: 25 June 2021 – Published: 3 August 2021

Abstract. The Early Cretaceous is characterized by warm              enced δ 18 Omw in the region, complicating these MAAT es-
background temperatures (i.e., greenhouse climate) and car-          timates. Thus, temperature records independent of δ 18 Omw
bon cycle perturbations that are often marked by ocean               (e.g., clumped isotopes or 147 ) are desirable and required
anoxic events (OAEs) and associated shifts in the hydro-             to confirm temperatures estimated with δ 18 Op and δ 18 Oc
logic cycle. Higher-resolution records of terrestrial and ma-        and to reliably determine regional shifts in δ 18 Omw . Primary
rine δ 13 C and δ 18 O (both carbonates and organics) suggest        carbonate material was identified using traditional petrog-
climate shifts during the Aptian–Albian, including a warm            raphy, cathodoluminescence inspection, and δ 13 C and δ 18 O
period associated with OAE 1a in the early Aptian and a sub-         subsampling. Our preliminary 147 -based temperature re-
sequent “cold snap” near the Aptian–Albian boundary prior            constructions (record mean of 14.9 ◦ C), which we interpret
to the Kilian and OAE 1b. Understanding the continental sys-         as likely being representative of MAAT, match prior esti-
tem is an important factor in determining the triggers and           mates from similar paleolatitudes of Asian MAAT (aver-
feedbacks to these events. Here, we present new paleosol             age ∼ 15 ◦ C) across the Aptian–Albian. This, supported by
carbonate stable isotopic (δ 13 C, δ 18 O and 147 ) and CAL-         our estimated mean atmospheric paleo-pCO2 concentration
MAG weathering parameter results from the Xiagou and                 of 396 ppmv, indicates relatively cooler midlatitude terres-
Zhonggou formations (part of the Xinminpu Group in the               trial climate. Additionally, our coupled δ 18 O and 147 records
Yujingzi Basin of NW China) spanning the Aptian–Albian.              suggest shifts in the regional hydrologic cycle (i.e., 1MAP,
Published mean annual air temperature (MAAT) records of              mean annual precipitation, and 1δ 18 Omw ) that may track
the Barremian–Albian from Asia are relatively cool with re-          Aptian–Albian climate perturbations (i.e., a drying of Asian
spect to the Early Cretaceous. However, these records are            continental climate associated with the cool interval).
largely based on coupled δ 18 O measurements of dinosaur ap-
atite phosphate (δ 18 Op ) and carbonate (δ 18 Ocarb ) and there-
fore rely on estimates of meteoric water δ 18 O (δ 18 Omw ) from
δ 18 Op . Significant shifts in the hydrologic cycle likely influ-

Published by Copernicus Publications on behalf of the European Geosciences Union.
1608                                              D. T. Harper et al.: Aptian–Albian clumped isotopes from northwest China

1   Introduction                                                 climate conditions. Therefore, confirming these temperatures
                                                                 with a secondary geochemical proxy is warranted.
Early Cretaceous climate is characterized by a warm back-           Hydrologic cycle models and observations of past warm
ground greenhouse climate state and perturbations to climate     intervals (e.g., early Cenozoic and greenhouse Cretaceous)
and the carbon cycle associated with shifts in global δ 13 C,    indicate an “intensification” of the hydrologic cycle due to
including Cretaceous ocean anoxic events (OAEs; Föllmi,          enhanced poleward moisture transport associated with global
2012; Hay, 2016; Jenkyns, 2018). Such climate aberrations        warming (e.g., White et al., 2001; Poulsen et al., 2007;
can provide insight into the sensitivities and coupling of       Suarez et al., 2011a; Hasegawa et al., 2012; Carmichael
the carbon cycle, climate, and the hydrologic cycle through      et al., 2016). Likewise, as temperatures cool during Creta-
quantitative reconstruction of past physical and environmen-     ceous climate recovery or during long-term transitions driven
tal conditions (e.g., atmospheric paleo-pCO2 , temperature       by changes in global tectonics and paleogeography, the hy-
and precipitation). Indeed, much work has been done gener-       drologic cycle tends to respond with regionally dependent
ating geochemical proxy-based observations and simulations       shifts in mean annual precipitation (MAP). For example,
of past global warming events which serve as useful ana-         Hasegawa et al. (2012) observed the hydrologic cycle re-
logues of future warming (e.g., Zachos et al., 2008; Hönisch     sponses track greenhouse gas (GHG) forcing in Asia during
et al., 2012; Hay, 2016). Similarly, both long-term and abrupt   the mid-Cretaceous. For the Aptian–Albian, models and ob-
cooling intervals in the past can supply proxy-based obser-      servations suggest changes in continental-interior precipita-
vations of negative climate feedbacks associated with carbon     tion during the global “cold snap” (e.g., Mutterlose et al.,
sequestration and global cooling.                                2009) and the potential for variable Asian aridity associ-
    Multiple climate events (including OAEs) have been iden-     ated with warm/cool cycles (Poulsen et al., 2007; Zhou et
tified during the late Early Cretaceous (Jenkyns, 2018; Vick-    al., 2008; Hasegawa et al., 2010, 2012; Föllmi, 2012; Ta-
ers et al., 2019) oftentimes referred to as the mid-Cretaceous   bor et al., 2016), which may hamper δ 18 Op -based temper-
(i.e., here, our records span the Aptian–Albian; 125 to          ature reconstructions for the Aptian–Albian that fail to quan-
100.5 Ma). While limited, available temperature records          tify δ 18 Omw independently of δ 18 Op . To address this defi-
(e.g., Jenkyns, 2018) and high-latitude sedimentological ev-     ciency, here we provide new multi-proxy records from the
idence (Vickers et al., 2019) suggest a relatively cool in-      Yujingzi Basin of NW China spanning the Aptian–Albian us-
terval (following warmth during OAE 1a) associated with          ing δ 13 C, δ 18 O and 147 (i.e., clumped isotopes) of terrestrial
a global carbon isotope maximum (i.e., “C10”; Menegatti          paleosol carbonates. Additionally, MAP is quantified using
et al., 1998; Bralower et al., 1999; Mutterlose et al., 2009)    chemical weathering ratios, specifically CALMAG (Nordt
at the Aptian–Albian boundary prior to OAE 1b (Bottini et        and Driese, 2010). We combine our new records with organic
al., 2015). Estimates of Aptian–Albian atmospheric paleo-        stable carbon isotope chemostratigraphic records for the site
pCO2 , while highly uncertain, tend to suggest low (less than    (Suarez et al., 2018) to provide age control to quantitatively
1000 to 1500 ppmv background greenhouse climate condi-           interpret shifts in regional temperature, δ 18 Omw , MAP and
tions; Franks et al., 2014) concentrations at the Aptian–        global atmospheric paleo-pCO2 associated with the Aptian–
Albian consistent with a cooler climate (Ekart et al., 1999;     Albian. These proxy interpretations are compared to models
Wallmann, 2001; Fletcher et al., 2005; Aucour et al., 2008;      and records of Cretaceous Asian climate and the global ex-
Passalia, 2009; Haworth et al., 2010; Du et al., 2018). This     ogenic carbon cycle (i.e., atmospheric paleo-pCO2 ) to pro-
C10 interval has been identified on land using stable iso-       vide new constraints on Aptian–Albian climate, carbon and
topes in terrestrial paleosol carbonates and organic carbon      hydrologic cycles.
from the continental interiors of North America (Ludvigson
et al., 2010; Suarez et al., 2014) and Asia (Suarez et al.,
                                                                 2     Materials and methods
2018). For Asia, Aptian–Albian terrestrial temperature esti-
mates have been generated using oxygen isotopes in dinosaur      2.1    Sampling and analyses
tooth enamel (Amiot et al., 2011) and suggest a relatively
cool interval (e.g., ∼ 10 ± 4 ◦ C mean annual air temperature,   The Xiagou and Zhonggou formations, part of the Xinminpu
MAAT; ∼ 42◦ N paleolatitude) consistent with marine pale-        Group in the Yujingzi Basin of northwest China (Gansu
otemperatures (Mutterlose et al., 2009; Bottini et al., 2015)    Province), were sampled in 2011 with the goal of placing
and elevated global carbonate δ 13 C (Menegatti et al., 1998;    the Early Cretaceous paleobiology and geology of this region
Bralower et al., 1999). However, MAAT estimates from δ 18 O      in a global climate and carbon isotope chemostratigraphic
of dinosaur tooth enamel phosphate (δ 18 Op ) hinge on the       framework (e.g., Suarez et al., 2018). The Xinminpu Group,
relationship between mean annual temperature, latitude and       approximately Early Cretaceous in northwest China, is com-
the δ 18 O of meteoric water or δ 18 Omw (Amiot et al., 2004).   posed of four formations (ordered stratigraphically bottom
δ 18 Omw is influenced by other parameters in addition to tem-   to top): Chijinqiao Formation, Chijinpu Formation, Xiagou
perature and latitude and is further complicated as the inten-   Formation and Zhonggou Formation. Outside of the Yu-
sity of poleward moisture transport is altered by greenhouse     jingzi Basin, Xinminpu Group strata produce Aptian radio-

Clim. Past, 17, 1607–1625, 2021                                                     https://doi.org/10.5194/cp-17-1607-2021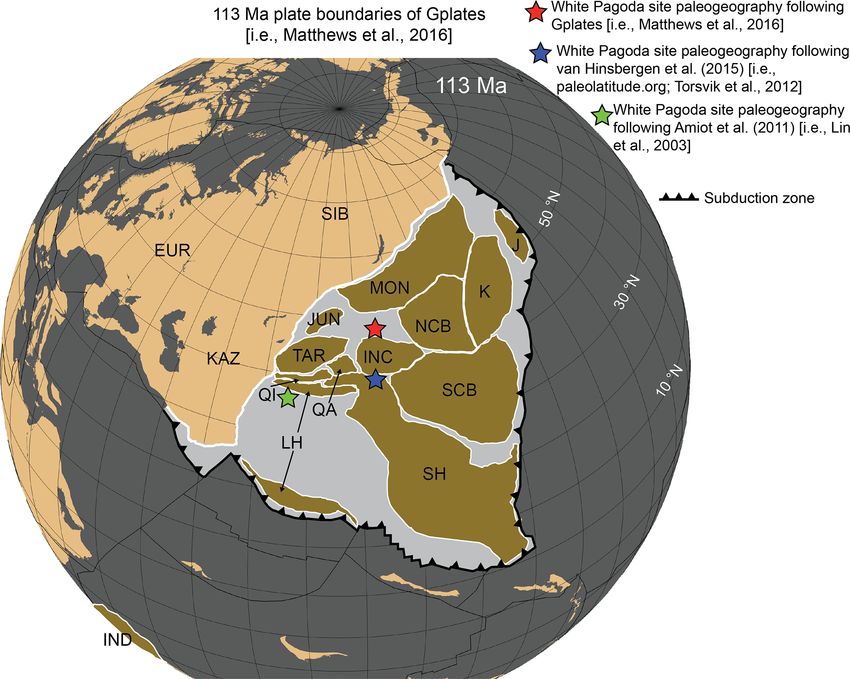
D. T. Harper et al.: Aptian–Albian clumped isotopes from northwest China                                                       1609

metric dates of 123.0 ± 2.6 to 133.7 ± 1.8 Ma (Li et al., 2013;       Thin sections were cut from hand samples for petrographic
Kuang et al., 2013). Additionally, a recent study (Zheng et        analysis and cathodoluminescence (CL) imaging to aid in
al., 2021) establishes regional ages through bio- and chronos-     the identification and isolation of primary carbonate nodule
tratigraphy. They review available age controls for the Lower      material. Briefly, thin sections were inspected for environ-
Cretaceous in northwest China and place the organic car-           mental indicators and microfabrics and photographed under
bon isotope records of Suarez et al. (2018) (i.e., our study       plane-polarized and cross-polarized light (PPL and XPL, re-
sections) within the chronostratigraphic framework of the re-      spectively) using an Olympus BX43P petrographic micro-
gion. Zheng et al. (2021) provide additional evidence that our     scope with an SC50 Olympus camera. Thin sections were
study section spans the “C10” interval at the Aptian–Albian        then CL imaged using a Relion Industries Reliotron III cold-
boundary. Outcrop sections (Fig. 1) are regionally exposed         cathode chamber, with operating conditions consisting of a
in the Yujingzi Basin at a fossil-rich site informally known       rarified helium atmosphere at 50 millitorr (6.7 Pa), accelerat-
as the White Pagoda Site, produced by accommodation of             ing voltage of 10 kV and a beam current of 0.5 mA (i.e., con-
strike-slip motion from Lhasa Block convergence with Asia          ditions for high luminescence sensitivity). Macroscale imag-
(Chen and Yang, 1996; Vincent and Allen, 1999).                    ing through the 50 mm top window of the chamber was car-
   Outcrop sections for White Pagoda were numbered and             ried out using a 16 Mpx Canon EOS SL1 DSLR camera with
split into three facies by Suarez et al. (2018): (1) the low-      a macro lens suspended over the CL chamber. Microphotog-
ermost facies consisting of sections 1, 2, 2A, dominated by        raphy of CL images was taken with an Olympus BX41 com-
sandstones, (2) an overlying facies of alternating gray and        pound microscope and DP73 17 megapixel Olympus cam-
variegated mudstones and muddy sandstones consisting of            era at the Kansas Geologic Survey. CL imaging was used to
sections 3, 3A–H and 6, and (3) coarse-grained poorly sorted       detect any heterogeneities in cation substitution which may
arkosic sandstones and sandy mudstones (section 4). Here,          indicate alteration, as Mn2+ tends to substitute for Ca2+ in
we utilize sample material from sections (in stratigraphic or-     reducing conditions generating bright orange luminescence
der) 3, 3A–H, 6 and 4 (see Fig. S1 in the Supplement for           (Habermann et al., 2000; Cazenave et al., 2003). While lu-
lithostratigraphic details). Suarez et al. (2018) observed car-    minescence in biogenic carbonates (e.g., mollusk shells) in-
bonate nodules, root traces, charophytes, turtle remains, os-      dicate diagenetic alteration from the original carbonate, high
tracods and gastropods within the middle facies (sections 3,       luminescence does not always indicate a degree of diagenesis
3A–H and 6), with root traces and nodules extending into           in soil and palustrine carbonates which likely form in condi-
the uppermost facies (section 4). Section 4 had a higher de-       tions that are alternately saturated and reducing and unsat-
gree of color mottling, blocky ped structures and burrows          urated and oxidative as water tables fluctuate (Ludvigson et
compared to the underlying facies. Facies interpretations for      al., 2010; Mintz et al., 2011).
sections sampled for this study indicate fluvio-lacustrine and        Once located in thin section using petrography and CL,
palustrine environments (i.e., Suarez et al., 2018). For exam-     primary nodule carbonate was mapped onto the correspond-
ple, sections 3, 3A-H, 6 and 4 exhibit evidence of subaerial       ing thin-section billet and sampled using a dental drill. In
exposure (soils indicated by horizonation, slickensides, root      some samples, suspect non-primary carbonate material (e.g.,
traces and carbonate nodule formation), fluvial deposition         spar) was also sampled for isotopic comparison but excluded
(lenticular sands fining up with erosive bases) and lacustrine     from primary carbonate isotopic averages reported here. De-
environments (turtle remains, charophytes, ostracods, thin         pending on the number of nodules and lithologic complexity
limestones and organic-rich mudstones) (Suarez et al., 2018;       of a hand sample, approximately eight to fourteen ∼ 50 µg
Fig. 1). For the sections of interest, the presence of cracking,   samples were drilled for traditional stable isotopes (i.e., δ 13 C
slickensides (mukkara structures) and expansive clays sug-         and δ 18 O) in each hand sample. Stable isotope samples were
gests wet and dry periods typical of Vertisols (Fig. 1).           heated to 200 ◦ C in a vacuum for 1 h prior to analysis via
   The organic stable carbon isotope record at White Pagoda        ThermoFinnigan MAT 253 gas source isotope ratio mass
was used as a guide to sample carbonate nodules for anal-          spectrometer (IR-MS) coupled to a Kiel IV carbonate device
ysis. Specifically, samples were selected to span deposition       at the University of Kansas (KU) Keck-NSF Paleoenviron-
before, during and after carbon isotope excursions of inter-       mental and Environmental Stable Isotope Laboratory (KPE-
est, namely the C10 excursion. Nodules for analysis were           SIL). Standard reproducibility indicates analytical precision
sampled from well below channel sands and surface pale-            (1σ ) of 0.03 ‰ and 0.05 ‰ for δ 13 C and δ 18 O, respectively.
osol horizons in outcrop (i.e., sampled from paleosol B hori-         Following δ 13 C and δ 18 O analysis of dental-drilled car-
zons; Tabor and Myers, 2015) to help avoid potential surfi-        bonate powder, larger samples (∼ 6 mg of material for each
cial biases on carbonate (e.g., radiative heating in soil depths   analysis; n = 4 per sample with the exception of one sample
< 50 cm; Burgener et al., 2019). Paleosols from which nod-         with n = 3) were drilled for clumped isotope (147 ) analysis
ules are sampled are fine grained throughout the section,          from areas of primary nodule carbonate exhibiting uniform
which suggests suitability for clumped isotope-based MAAT          δ 13 C and δ 18 O and CL. Our pedogenic carbonate nodules
interpretation (e.g., Kelson et al., 2020).                        were centimeter to multi-centimeter in scale, providing am-
                                                                   ple carbonate material for sampling. Clumped isotopes were

https://doi.org/10.5194/cp-17-1607-2021                                                        Clim. Past, 17, 1607–1625, 2021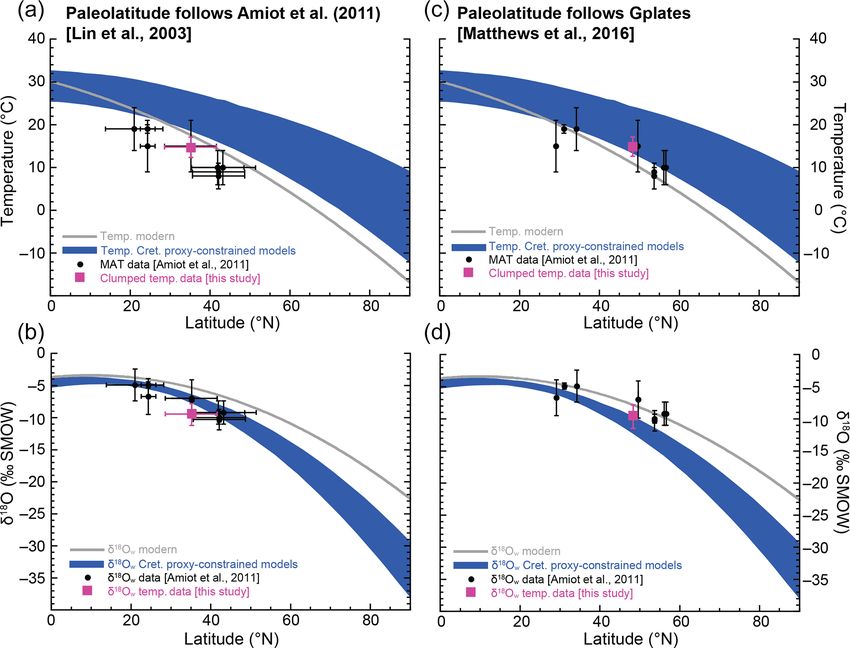
1610                                                  D. T. Harper et al.: Aptian–Albian clumped isotopes from northwest China

Figure 1. Approximate location of sampled sections with respect to regional topography (a; Amante and Eakins, 2009) and geography (b).
Outcrop images of carbonate nodule bearing Vertisol section typical of the composite study section (c, d). Root traces, mukkara cracks, ped
structure and coloration (Retallack, 1997) are all indicative of Vertisols.

measured at the University of Colorado Boulder (CUB) Earth              IAEA-C1, IAEA-C2, Merck and NBS19) were utilized to
Systems Stable Isotope Laboratory (CUBES-SIL) on a cus-                 further correct 147 values (see Table S1 for acquired stan-
tom automated vacuum line sample introduction system, in                dard values). Potentially contaminated data were culled (e.g.,
which samples are digested at 90 ◦ C in a common phos-                  sample analyses which exhibit 148 excess that tracks vari-
phoric acid bath. This system removes isobaric contamina-               ability in 147 ; see Supplement). Replicate analyses tended
tion by entraining the CO2 sample in helium and passing it              to be highly consistent (see Supplement; Tables S2 and S3
through a ∼ 1.5 m long stainless steel column hand packed               for raw data).
with Poropak for 45 min at −20 ◦ C. CO2 is transferred to the              X-ray fluorescence (XRF) measurements were carried out
sample side bellows of a ThermoFinnigan dual inlet MAT                  on samples from horizons that appear to be well-developed
253+. Values are reported relative to the carbon dioxide                paleosols, specifically horizons interpreted as B horizons.
equilibration scale (Dennis et al., 2011), using gases with a           Analysis was completed with a Rigaku Primus II WD-XRF
range of bulk δ 47 values and equilibrated at 1000 and 25 ◦ C           spectrometer at the University of Texas at San Antonio. Raw
to convert in-house values to the Carbon Dioxide Equilibra-             X-ray intensities were calibrated by the analysis of eight
tion Scale (CDES). IUPAC parameters for 17 O corrections                USGS certified elemental standards (BIR-1a, COQ-1, DNC-
(Brand et al., 2010) were used in the initial steps of data re-         1a, GSP-2, RGM-2, SBC-1, STM-2, W-2a), with an RSD
duction, following recommendations of Daëron et al. (2016)              (relative standard deviation) value of 0.036 %. Weight per-
and Schauer et al. (2016). We then applied an acid correction           centages were converted into molar weights before the ap-
factor (0.088 ‰) appropriate for use with values calculated             plication of a chemical index, following Sheldon and Ta-
using IUPAC parameters (Petersen et al., 2019). In addition             bor (2009). Al2 O3 , CaO and MgO are the oxides used for
to the heated and equilibrated gas reference frame, interna-            the calculation of the CALMAG (Nordt and Driese, 2010)
tional carbonate standards (i.e., ETH1, ETH2, ETH3, ETH4,

Clim. Past, 17, 1607–1625, 2021                                                             https://doi.org/10.5194/cp-17-1607-2021
D. T. Harper et al.: Aptian–Albian clumped isotopes from northwest China                                                      1611

chemical weathering index (see following section for param-        Mean annual precipitation (MAP) is then determined
eter calculation and proxy details).                               from the CALMAG parameter based on the Nordt and
                                                                   Driese (2010) calibration:
2.2   Quantitative proxies                                         MAP = 22.69 × (CALMAG) − 435.8.                              (4)
Clumped isotopes (i.e., 147 ) have been successfully utilized      Paleosols have been widely utilized as archives to determine
to estimate temperature in carbonates, leveraging the thermo-      the past concentration of atmospheric pCO2 (Cerling, 1991;
dynamically controlled abundance of isotopically heavy 13 C        Ekart et al., 1999). While requiring a number of assumptions,
and 18 O bonded isotopes (Ghosh et al., 2006; Schauble et al.,     soil carbonate nodule δ 13 C, when used in tandem with esti-
2006) relative to a stochastic abundance of such “clumps”.         mates from other proxies (e.g., MAP from CALMAG and
This approach has an advantage over δ 18 O-based tempera-          respired soil δ 13 CCO2 from δ 13 Corg ), provides many of the
ture estimates, as other controlling variables (e.g., δ 18 Omw )   most robust estimates of Cretaceous atmospheric pCO2 out-
need not be estimated. 147 values are translated into cal-         side of a stomatal approach (Franks et al., 2014), especially
cification temperature following the calibration of Petersen       because paleosol carbonate nodules are abundant in the rock
et al. (2019), and we define our temperature uncertainty as        record. The soil carbonate paleobarometer uses a diffusion
2σ , or twice the mean propagated external precision (1σ ) of      model in which atmospheric pCO2 (δ 13 Ca ) and respired CO2
each 147 analysis, as this likely captures compounded uncer-       from soils (δ 13 Cr ) are the dominant controls on soil CO2
tainties in our temperature estimates (Fernandez et al., 2017;     (δ 13 Cs ) following the mixing model of Cerling (1991) in
Bernasconi et al., 2021). We also include 2SE uncertainty          terms of δ 13 C (Ekart et al., 1999). The relative isotopic in-
for 147 (Fig. 5 and Table S3). Additional temperature cali-        fluence of atmospheric versus respired CO2 on soil CO2 (i.e.,
bration approaches (i.e., Ghosh et al., 2006; Bonifacie et al.,    the source CO2 for calcite) will therefore be controlled by the
2017) and calculation details (i.e., R code for data analysis)     concentration of CO2 in the atmosphere if the concentration
are available in the Supplement. However, for this study, in       of the soil-derived component of total gas at depth, S(z), is
subsequent calculations and figures, we opt for Petersen et        accounted for following Ekart et al. (1999):
al. (2019) 147 values and calibration temperatures calculated
using the following relationship:                                  pCO2 = S(z) × δ 13 Cs − 1.0044 × δ 13 Cr − 4.4 /

147 = 0.0383 ± 1.7−6 × 10⁶ /T 2                                               δ 13 Ca − δ 13 Cs .                              (5)

      + 0.258 ± 1.7−5 .                                      (1)   δ 13 Cs can be determined from δ 13 Ccarb , assuming
                                                                   temperature-dependent fractionation (here we use 147 -
Groundwater δ 18 O is derived from the oxygen isotopic com-        based temperature) between gaseous soil CO2 and carbonate
position of precipitation, which is ultimately controlled by       (Romanek et al., 1992). Suarez et al. (2018) correlated
factors such as temperature, amount, continentality and sea-       sections in this study to bulk carbonate surface marine
sonality. It can be further modified by processes such as          sections using δ 13 C chemostratigraphy. We estimate atmo-
evaporation in paleoenvironments which experience wet and          spheric δ 13 C (i.e., δ 13 Ca ) from a marine section correlated
dry cycles. δ 18 O of groundwater (δ 18 Ow ) can be determined     chemostratigraphically with the White Pagoda Site (i.e.,
for pedogenic carbonate calcification once temperature is          Peregrina Canyon, Mexico of Bralower et al., 1999, corre-
known and δ 18 Ocarb is measured following Friedman and            lated to White Pagoda by Suarez et al., 2018), applying a
O’Neil (1977):                                                     δ 13 CDIC (i.e., δ 13 C of marine dissolved inorganic carbon,
                                                                 DIC) to δ 13 Ca fractionation of −8.23 ‰ consistent with
δ 18 Ow (SMOW) = δ 18 Ocarb (SMOW) + 103 /                         “greenhouse climate” carbon cycle simulations (i.e., Zeebe,
                                                                 2012) and assuming the bulk carbonate δ 13 C for the Pereg-
                    e(18 030/T −32.42)/1000 − 103 .         (2)    rina Canyon section is representative of global surface DIC
                                                                   δ 13 C. This results in δ 13 Ca values ranging from −5.38 to
To estimate mean regional precipitation for the study inter-       −4.18 in samples used to compute pCO2 . For δ 13 Cr , we
val and determine shorter-term precipitation variability in our    apply the bulk sedimentary organic carbon δ 13 C values of
record, we use the bulk geochemical compositional proxy            Suarez et al. (2018).
CALMAG (Nordt and Driese, 2010), which utilizes the gains             In addition to estimates of δ 13 C for the three carbon reser-
and losses of elemental oxide abundances as a result of            voirs outlined above, the term S(z), or the depth-dependent
weathering in Vertisols. The concentration of aluminum ox-         contribution of soil-respired CO2 , must be determined to
ide, calcium oxide and magnesium oxide are estimated using         compute atmospheric paleo-pCO2 . While this term is a sig-
XRF, and the CALMAG parameter is determined:                       nificant source of uncertainty due in part to a large range
                                                                   of potential past environmental conditions, Cotton and Shel-
CALMAG = (Al2 O3 )/(Al2 O3 + CaO + MgO) × 102 .             (3)    don (2012) hypothesized a relationship between summer

https://doi.org/10.5194/cp-17-1607-2021                                                       Clim. Past, 17, 1607–1625, 2021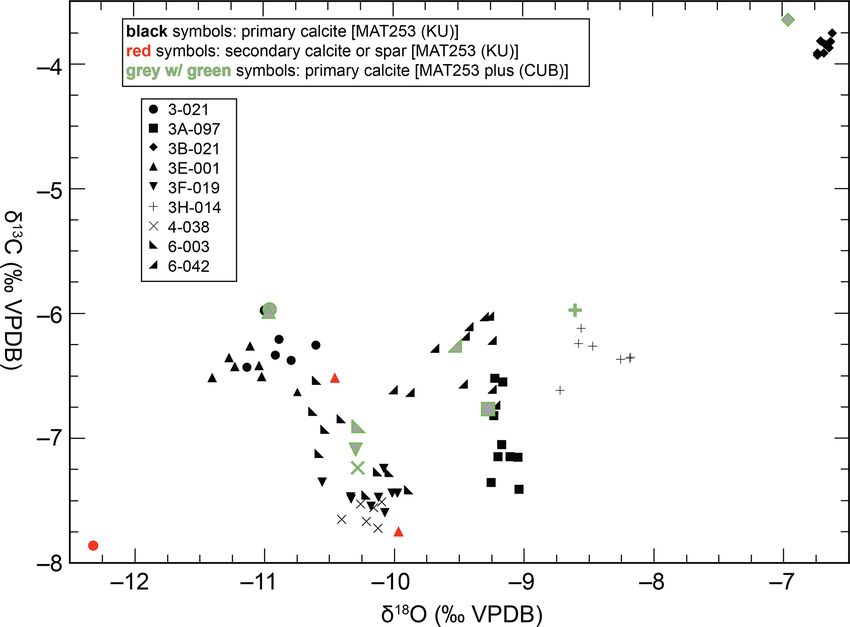
1612                                                D. T. Harper et al.: Aptian–Albian clumped isotopes from northwest China

minimum S(z) and MAP using observations of modern soils:            the individual nodule shape is somewhat maintained (i.e., un-
                                                                    like microfacies (ii)). CL displayed by White Pagoda samples
S(z) = 5.67 × MAP − 269.9.                                   (6)    is consistent with previous descriptions of vertic soil carbon-
Here, we apply their relationship to compute S(z) from our          ates in which dull to lightly luminescent primary nodule car-
CALMAG-based MAP estimates. It is important to note that            bonate is differentiated with either non-luminescing (early)
the relationship defined by Cotton and Sheldon (2012) uses          or brightly luminescing (late) secondary material (Driese and
a dataset which does not include humid climate soils or Ver-        Mora, 1993). In addition, variation in the luminescence of
tisols, and it is therefore cautiously applied and discussed in     soil carbonates from modern Vertisols (Mintz et al., 2011)
terms of paleoenvironmental influence on our paleo-pCO2             emphasizes that soil carbonates can often be precipitated and
estimates (i.e., we evaluate our atmospheric pCO2 record            stabilized in varying Eh environments that can affect the lu-
against a large range in S(z)).                                     minescence of primary carbonate.

3     Results                                                       3.2   Traditional stable and clumped isotopes

                                                                    Stable isotopes of drill spot samples show a high degree of
3.1    Petrography
                                                                    intrasample homogeneity (Fig. 4). Measurements between
Based on carbonate petrography we recognize two distinct            University of Kansas and University of Colorado, Boulder,
microfacies in our samples and split samples into two groups        are largely consistent with comparable precision (Tables 1
(microfacies (i) and (ii)) to evaluate the origin of stable iso-    and 2; Fig. 4). δ 13 C values range from −8 ‰ to −3 ‰
tope values (primary vs. secondary; depositional environ-           and δ 18 O ranges from −12 ‰ to −6 ‰ for carbonates mea-
ment) (Fig. 2; Table 1). Microfacies (i) is characterized by        sured in this study. Sample 3B-021 displays the most heavy-
distinct nodules which originated from primarily clayey hori-       isotope-enriched δ 13 C and δ 18 O values, with δ 13 C more than
zons, consisting of dense micrite with abundant root traces         2 ‰ and δ 18 O more than 1 ‰ greater than all other sam-
and fractures filled with sparry calcite and microspar calcite      ples (Fig. 4), despite the relative isotopic low in the δ 13 Corg
(Fig. 2). Fracturing is less pervasive and micritic nodules in-     curve which results in a large 113 C for that sample (Ta-
clude less clay minerals in microfacies (i). Nodule micrite is      ble 1). Carbonate samples tend to be isotopically homoge-
dull to brightly luminescent under CL and secondary spar-           neous (2σ ≤ 0.6 ‰ for all sample δ 13 C and δ 18 O, with only
filled fractures and voids tend to be non-luminescent or dull.      two samples with 2σ > 0.3 ‰; Table 1) following Cotton and
The clay matrix displays birefringent microfabric and con-          Sheldon (2012), who proposed a requirement of 2σ < 0.5 ‰
tains subangular to subrounded clasts of calcic and siliciclas-     for δ 13 C and δ 18 O for all samples applied to paleo-pCO2 re-
tic grains (mainly quartz and feldspars as well as fragments        constructions. We discern no relationship between δ 13 C and
of other nodules) (Fig. 3). Microfacies (i) includes samples        δ 18 O of carbonates nor grouping of microfacies by stable iso-
3-021, 3A-097, 4-038 and 3H-014.                                    topic composition (e.g., Fig. 4; Table 1).
    Samples in microfacies (ii) (observed in samples 3B-021,           Clumped isotope (147 ) mean sample values range from
3E-001, 6-003 and 6-042) tend to be coalesced nodules or            0.707 to 0.732 ‰ (Table 2), which, following the Petersen
beds comprised almost entirely of clay-rich microcrystalline        et al. (2019) calibration, translates to temperatures ranging
calcite in which discreet nodules are less evident (e.g., sam-      from ∼ 10 to 20 ◦ C, with an average temperature of 14.9 ◦ C
ples 3E-001 and 6-042; Fig. 3). Microfacies (ii) shows dull         for the entire record. Transient cooling of ∼ 2 to 4 ◦ C (i.e.,
yellow to orange luminescence of the micrite with brightly          down to 11.1 ◦ C) is observed in the C10 carbon isotope in-
luminescent spar-filled fracture voids. The microfacies dis-        terval, with the warmest temperature occurring immediately
plays a higher degree of CL heterogeneity (i.e., patchiness).       following the C10 interval (i.e., warms to 18.8 ◦ C; Fig. 5).
For example, Mn staining tends to luminesce to a greater de-        Temperature variation tends to be smaller in magnitude than
gree than surrounding non-Mn-stained micrite (Fig. 3). The          2σ temperature uncertainty.
second microfacies is characterized by clay-rich (i.e., com-
mon to frequent in abundance) micritic limestone with abun-         3.3   CALMAG
dant fracturing and brecciation, including circum-granular
fractures (i.e., sample 6-042; Fig. 3). These are filled with mi-   CALMAG values for all measured samples range from a low
crospar and spar (Fig. 2). Color mottling and Mn staining are       of 2 to a high of 70. Lowest values are either samples that
observed, perhaps related to microbial activity (i.e., thrombo-     were not identified as B horizons or likely immature soils
lites and/or pisoids; Fig. 2b). Sample 3F-019 appears to be a       which yield values inapplicable to range in calibration (CAL-
mixture of the two microfacies, with dense, brightly lumines-       MAG less than ∼ 35; Table S4). If only B-horizon samples
cent (i.e., CL) micritic nodules in a dominantly clay matrix,       applicable to the range in the Nordt and Driese (2010) cal-
mottled coloring in thin section, rhizoliths, circum-granular       ibration are considered, the maximum variability in CAL-
fractures and Mn staining (Fig. 2c). Nodules appear slightly        MAG is ± 12 (Tables 3 and S4). This translates to MAP vari-
coalesced in this sample (i.e., unlike microfacies (i)), whilst     ability of ±270 mm yr−1 over the interval, with mean MAP

Clim. Past, 17, 1607–1625, 2021                                                        https://doi.org/10.5194/cp-17-1607-2021
D. T. Harper et al.: Aptian–Albian clumped isotopes from northwest China 1613
Figure 2. Annotated photomicrographs from select carbonate nodules of the White Pagoda Site. Samples are split into two microfacies (a, b)
with sample 3F-019 appearing to be a mixture of the two microfacies (c).
Table 1. Primary carbonate stable isotope data measured at KU (δ 13 C and δ 18 O) for the White Pagoda Site. 1δ 13 C calculated with δ 13 Corg
of Suarez et al. (2018).
Sample Composite microfacies n δ 13 C mean δ 18 O mean δ 13 C 2σ δ 18 O 2σ δ 13 Corg 1δ 13 C
section (‰ VPDB) (‰ VPDB) (‰ VPDB) (‰ VPDB) (‰ VPDB) (δ 13 C
carb −
(meters δ 13 Corg )
above base) (‰ VPDB)
3-021 8.75 (i) 6 −6.26 −10.89 0.32 0.36 −23.14 16.65
3A-097 58.75 (i) 9 −7.02 −9.16 0.64 0.16 −22.55 15.53
3B-021 74.50 (ii) 8 −3.86 −6.69 0.12 0.09 −27.48 23.62
3E-001 103.00 (ii) 7 −6.45 −11.12 0.24 0.43 −21.59 14.99
3F-019 111.25 mix of (i) & (ii) 9 −7.45 −10.19 0.21 0.37 −22.11 14.66
3H-014 123.00 (i) 7 −6.33 −8.43 0.31 0.43 −21.00 14.67
6-003 141.00 (ii) 9 −7.07 −10.35 0.63 0.55 −25.04 17.97
6-042 150.90 (ii) 11 −6.36 −9.46 0.54 0.54 −21.97 15.61
4-038 209.85 (i) 6 −7.61 −10.21 0.17 0.23 −25.33 17.72
of 641 mm yr−1 (i.e., mean CALMAG of 47.5) for paleosols 4 Discussion
in which clumped isotopes were also measured (Table 3;
Fig. 5). 4.1 Carbonate nodule δ 13 C and δ 18 O
Light stable isotopes (δ 13 C and δ 18 O) of carbonate material
measured at KU and CUB are consistent (Tables 1 and 2;
https://doi.org/10.5194/cp-17-1607-2021 Clim. Past, 17, 1607–1625, 20211614 D. T. Harper et al.: Aptian–Albian clumped isotopes from northwest China Figure 3. Reflected light (left column), transmitted light (middle column) and cathodoluminescence (CL; right column) images of select nodule thin sections (two from each microfacies group; top two samples are microfacies (i) and bottom two samples are microfacies (ii)). Samples 3-021 (a–c), 3A-097 (d–f), 3E-001 (g–i) and 6-042 (j–m) are included. Drill spots for δ 13 C and δ 18 O analysis, mapped from billets, are indicated by circles. Dashed squares are the approximate field of view for transmitted light and CL images. Fig. 4) indicating primary carbonate was successfully sam- by variation in the other exogenic carbon reservoirs. Carbon- pled from nodules for clumped isotope analyses (i.e., pri- ate δ 18 O is reflective of regional meteoric water and tem- mary carbonate isotopic composition characterized by drill perature. Though of much coarser resolution, our carbonate spot measurements at KU match values from CUB clumped δ 13 C largely follows δ 13 Corg which has been tied to global measurements). δ 13 C in carbonate nodules is controlled by variations in the carbon cycle (Ando et al., 2002; Heimhof- soil water DIC which, through time, is ultimately controlled fer et al., 2003; Ludvigson et al., 2010, 2015; Suarez et al., Clim. Past, 17, 1607–1625, 2021 https://doi.org/10.5194/cp-17-1607-2021
D. T. Harper et al.: Aptian–Albian clumped isotopes from northwest China                                                                               1615

Figure 4. Carbonate δ 13 C and δ 18 O for White Pagoda samples. Black symbols represent drill spot measurements of inferred primary calcite
and red symbols represent drill spot measurements of inferred secondary calcite (measured at KU). Gray with green symbols represent mean
δ 13 C and δ 18 O measured on larger inferred primary calcite samples at CUB.

Table 2. Primary carbonate stable isotope data measured at CUB (147 , δ 13 C and δ 18 O) for the White Pagoda Site. Clumped isotopes
and interpreted temperatures follow Petersen et al. (2019). Meteoric water δ 18 O calculated from δ 18 Ocarb (CUB measured), and clumped
temperatures following Friedman and O’Neil (1977).

 Sample    Composite    n   δ 13 C mean   δ 18 O mean     δ 13 C 2σ     δ 18 O 2σ     147    147 2SE      T          T 2σ       δ 18 Owater   δ 18 Owater 2σ
              section       (‰ VPDB)      (‰ VPDB)      (‰ VPDB)      (‰ VPDB)       mean        (‰)   (◦ C)          (◦ C)   (‰ SMOW)         (‰ SMOW)
              (meters                                                                 (‰)
          above base)
 3-021          8.75    4       −5.95        −10.99           0.16          0.33     0.731     0.006   11.4    +7.5/ − 7.0          −11.5               1.9
 3A-097        58.75    3       −6.76         −9.30           0.05          0.34     0.717     0.008   15.9    +7.5/ − 7.0           −8.8               1.9
 3B-021        74.50    4       −3.67         −6.98           0.08          0.80     0.719     0.007   15.0    +8.8/ − 8.1           −6.7               2.6
 3E-001       103.00    4       −5.98        −10.98           0.23          0.68     0.732     0.008   11.1    +9.8/ − 8.9          −11.5               2.8
 3F-019       111.25    4       −7.05        −10.38           0.14          0.62     0.719     0.006   15.1    +7.8/ − 7.2          −10.1               2.3
 3H-014       123.00    4       −5.95         −8.63           0.16          0.35     0.717     0.006   15.9    +7.9/ − 7.3           −8.2               2.0
 6-003        141.00    4       −6.86        −10.32           0.03          0.27     0.707     0.007   18.8    +9.2/ − 8.4           −9.2               2.1
 6-042        150.90    4       −6.27         −9.60           0.04          0.61     0.723     0.006   14.0    +7.7/ − 7.1           −9.5               2.2
 4-038        209.85    4       −7.24        −10.32           0.08          0.26     0.715     0.006   16.5    +7.9/ − 7.3           −9.7               1.9

2018), suggesting both carbonate and organic records at the                    4.2     Interpreting paleoenvironmental biases in
site track global variability in the carbon cycle originally de-                       ∆47 -based temperatures
scribed in Menegatti et al. (1998) and Bralower et al. (1999)
(Fig. 5) (e.g., δ 13 Ccarb is highest in the C10 interval). We ob-             Macroscopic features described in Suarez et al. (2018) along
serve no clear grouping of carbonate stable isotopes by mi-                    with traditional carbonate petrography suggest a paleoenvi-
crofacies, and all samples contain pedogenic features. This                    ronment which experienced wet and dry cycles. These fea-
suggests δ 13 Ccarb tracks global variations in the carbon cy-                 tures include redoximorphic color mottling, gilgai structures
cle and δ 18 Ocarb values reflect δ 18 O of regional precipitation             and mukkara cracks (Fig. 1), fracturing which is pervasive to
once temperature is considered.                                                varying degrees in carbonate nodules, microspar and spar re-
                                                                               crystallization which is present in voids and fractures, Mn
                                                                               staining, and root traces (Figs. 1, 2 and 3). Microscopic
                                                                               features are consistent with facies interpretations of Suarez

https://doi.org/10.5194/cp-17-1607-2021                                                                         Clim. Past, 17, 1607–1625, 2021
1616 D. T. Harper et al.: Aptian–Albian clumped isotopes from northwest China Figure 5. Multi-proxy climate records and record interpretations from the White Pagoda Site, including δ 13 Corg of Suarez et al. (2018) and our new records of carbonate δ 13 C, 147 (with 2SE uncertainty) and temperature (with 2σ uncertainty), MAP and δ 18 Omw (with 2σ uncertainty), and atmospheric paleo-pCO2 with 2σ and additional S(z) sensitivity test (see main text; non-positive calculated values are not displayed). The C10 interval has been highlighted. Note the break in depth scale at ∼ 165 m. et al. (2018), which suggest a fluvio-palustrine paleoenvi- concentration of ions, calcite precipitation tends to occur dur- ronment. Rhizoliths (i.e., calcified root structures) in nearly ing warm, dry conditions. Numerous early studies have sug- all nodule samples (e.g., Figs. 1 and 2) indicate that veg- gested warm season bias in soil carbonate formation and thus etation was present and the carbonate nodules are indeed the 147 -derived temperatures (Breecker et al., 2009; Passey soil-formed in subhumid to semiarid conditions (Zhou and et al., 2010). Recent work of Kelson et al. (2020) suggests Chafetz, 2009). Indeed, mean MAP derived from our CAL- this may not always be the case for a number of reasons. The MAG proxy record suggests 712 mm yr−1 (respective mini- presence of vegetation (suggested by abundant root traces) mum and maximum MAP of 476 and 984 mm yr−1 for the may shade the soil surface from solar radiation. However, interval; Fig. 5), and 147 -based temperatures range from Burgener et al. (2019) and Kelson et al. (2020) found that this 11.4 ◦ C (+7.5/ − 7.0 ◦ C; 2σ ) to 18.8 ◦ C (+9.2/ − 8.4 ◦ C; effect is rare, and samples for this study were collected from 2σ ), consistent with the subhumid to semiarid environments paleosol horizons deep enough (i.e., > 50 cm) to be buffered in which soil carbonates commonly form (Birkeland et al., against the effects of radiative heating (i.e., Burgener et al., 1999; Zhou and Chafetz, 2009; Breecker et al., 2009). 2019). Seasonality of precipitation, evaporation and evapo- Understanding the timing of carbonate formation in soils transpiration likely affects the degree to which a warm sea- is important for the interpretation of δ 13 C, δ 18 O and 147 . son temperature bias may occur. In a study of modern soils in The solubility of calcite is the primary controlling factor on North America, Gallagher and Sheldon (2016) suggested that carbonate formation, and it is significantly affected by soil only continental climate with rainy seasons in the spring had CO2 concentration. Because CO2 concentration is lower in summer temperature biases. Suarez et al. (2011b) suggested warmer conditions and drier conditions result in a greater that lower than expected temperatures of Mio–Pliocene soil Clim. Past, 17, 1607–1625, 2021 https://doi.org/10.5194/cp-17-1607-2021
D. T. Harper et al.: Aptian–Albian clumped isotopes from northwest China                                                          1617

Table 3. Lithologic and CALMAG (see text for details) data, with        tisol formation at our study location and proxy-based esti-
interpreted mean annual precipitation (MAP) for White Pagoda Site       mates of MAAT and MAP, the paleoenvironment is likely
samples. All samples listed here are derived from interpreted B hori-   best represented by either the “continental” or “semiarid
zons of paleosols.                                                      monsoonal” climates of Gallagher and Sheldon (2016). We
                                                                        note that the modern soil type for the settings of Gallagher
 Sample     Composite    Lithology         CALMAG           MAP
                                                                        and Sheldon (2016) consists of Mollisols and thus may not
               section                                  (mm yr−1 ;
               (meters                                  CALMAG)         be representative of the Vertisols in which nodules used in
           above base)                                                  this study formed. Their continental model indicates a de-
 3-021           8.75    mudstone                55.4          822
                                                                        cline in water storage in July–August, which tends to bias
 3-035          12.25    mudstone                47.9          651      carbonate formation to warmer values. In contrast, the semi-
 3-036          12.50    fine sandstone          50.1          701      arid monsoonal model shows a decrease in water storage in
 3-043          14.25    mudstone                54.0          790      April resulting in a slight cool season bias. However, cool
 3A-069         50.50    mudstone                40.4          481
 3A-071         51.00    mudstone                43.5          552
                                                                        season biases tend to be much smaller in magnitude (less
 3A-085         55.75    mudstone                43.6          553      than 4 ◦ C) than warm season biases (as much as 24 ◦ C) (Kel-
 3A-091         57.25    mudstone                62.6          984      son et al., 2020). Therefore, regardless of the interpretation
 3A-097         58.75    mudstone                43.1          543      of seasonal biases, our mean temperature based on clumped
 3A-100         59.50    mudstone                54.0          788
 3B-009         71.50    mudstone                61.9          969
                                                                        isotopes (14.9 ◦ C) suggests very cool conditions in the mid-
 3B-014         72.75    mudstone                62.2          976      latitude Asian continental interior during the Aptian–Albian.
 3B-023         75.00    mudstone                45.0          586      Any potential warm season bias on our temperature results is
 3B-024         75.25    mudstone                43.1          542      unlikely as it would suggest even cooler conditions inconsis-
 3E-010        105.25    mudstone                43.3          548
                                                                        tent with combined proxy observations. In addition, because
 3F-001        106.50    mudstone                41.7          509
 3F-015        110.25    mudstone                54.6          803      soil carbonates likely form over long periods of time and are
 3G-003        116.75    mudstone                45.5          596      likely stabilized in the phreatic environment as the soil is re-
 3H-001        119.75    mudstone                50.1          701      moved from the active zone of pedogenesis, it is likely that
 3H-007        121.25    mudstone                57.4          867
                                                                        seasonal temperature biases are further dampened. Indeed,
 3H-010        122.00    mudstone                60.4          934
 3H-014        123.00    claystone               55.1          815      the temperatures calculated here are consistent with other re-
 6-003         141.00    silty mudstone          48.4          663      gional paleotemperature proxy observations (e.g., Amiot et
 6-014         143.75    sandy siltstone         44.1          566      al., 2011) and counter to the predominantly warm greenhouse
 6-030         147.90    mudstone                53.0          768      climate of the Cretaceous (Föllmi, 2012).
 6-035         149.15    mudstone                52.9          765
 6-042         150.90    carb. mudstone          42.0          517
 6-047         152.15    carb. mudstone          53.2          771      4.3   Latitudinal gradients of temperature and δ 18 Omw for
 4-042         210.85    mudstone                40.2          476            the Aptian–Albian
 4-077         219.95    mudstone                49.9          697
 4-081         220.95    muddy sandstone         51.7          738      Clumped isotope-based temperatures for the White Pagoda
 4-085         221.95    muddy sandstone         58.5          892
                                                                        site indicate a mean record value of 14.9 ◦ C, which is equiv-
                                                                        alent to δ 18 Op -based temperature estimates (15 ◦ C) carried
                                                                        out on dinosaur teeth from formations within the same group
carbonates from the Chinese Loess Plateau may be the result             (Xinminpu) in NW Asia (Amiot et al., 2011). The meteoric
of a monsoon climate in which the rainy seasons occur dur-              water δ 18 O based on our combined clumped isotope and car-
ing the warmest part of the season and conditions for calcite           bonate isotope analyses ranges from −11.5 ‰ to −6.7 ‰
precipitation occur prior to or after the warm season.                  (SMOW), with an average of −9.5 ‰, which is somewhat
   These studies suggest that carbonate nodule clumped                  lower than the values of Amiot et al. (2011) (−7.0 ‰).
isotope-based temperatures revealed from the Xinminpu                      Modern climate observations of the study site indi-
Group likely represent lower temperatures than the mean                 cate cool, dry conditions with mean δ 18 Omw of −9.3 ‰
warm season. In addition, mean clumped isotope-based tem-               and −7.7 ‰ in nearby Zhangye and Lanzhou, respectively
perature over the study interval (14.9 ◦ C) matches Aptian–             (GNIP, 2020). Largely due to the influence of regional to-
Albian MAATs derived from phosphate δ 18 O in dinosaur                  pography (study location elevation: ∼ 1500 m), present-day
teeth from similar paleolatitudes in Asia (i.e., 15 ◦ C for Xin-        precipitation averages < 100 mm yr−1 and MAATs indicate
minpu Group; Amiot et al., 2011). However, our midlatitude              locally cooler temperatures (9.0 and 10.5 ◦ C in Zhangye and
continental-interior temperatures reflect the temperature of            Lanzhou, respectively; GNIP, 2020) relative to global zonal
calcite precipitation and may be biased towards the time of             averages (15.0 ◦ C; Rozanski et al., 1993). Aptian–Albian
year during which a region experiences its first month with-            temperatures may similarly be influenced by regional pale-
out water storage, which varies by regional climate (Gal-               otopography, although topographic reconstructions for Asia
lagher and Sheldon, 2016). Given our paleoenvironmental                 during the Aptian–Albian are lacking, limiting speculation.
interpretation of wet–dry seasonality which resulted in Ver-

https://doi.org/10.5194/cp-17-1607-2021                                                            Clim. Past, 17, 1607–1625, 2021
1618 D. T. Harper et al.: Aptian–Albian clumped isotopes from northwest China
Generally, proxy-based temperatures and δ 18 Omw for the 4.4 Atmospheric paleo-pCO2
Xinminpu Group tend to fall within zonally averaged gen-
eral circulation GENESIS-MOM model results (Zhou et al., Cotton and Sheldon (2012) refine procedural guidelines pre-
2008) given the large range in possible site paleolatitude viously established by Cerling and Quade (1993) and Ekart et
during the Aptian–Albian. For example, paleogeographic re- al. (1999) for the use of pedogenic carbonates in reconstruc-
constructions indicate paleolatitudes ranging from ∼ 35 to tions of atmospheric pCO2 , which include maximum lim-
∼ 48◦ N for the White Pagoda Site during the Aptian–Albian its for 113 C (i.e., δ 13 Ccarb − δ 13 Corg ), isotopic heterogene-
(Lin et al., 2003; Torsvik et al., 2012; Matthews et al., 2016), ity and δ 13 C versus δ 18 O covariation. They suggest limit-
which corresponds to simulated temperatures ranging from ing proxy application to samples with 14 ‰ < 113 C < 17 ‰
9 to 19 ◦ C and simulated δ 18 Omw ranging from −11.8 ‰ to as modern soils with large 113 C tend to have S(z) values
−6.7 ‰ (Zhou et al., 2008). which fall off the MAP versus S(z) relationship defined by
Combining our new temperature and δ 18 Omw data with Cotton and Sheldon (2012) and are likely to have been dis-
that compiled in Amiot et al. (2011), we re-cast latitudinal proportionately influenced by atmospheric δ 13 C. For our at-
temperature and δ 18 Omw gradients according to the paleo- mospheric pCO2 reconstruction, we omitted samples with
geography applied in Amiot et al. (2011) (Lin et al., 2003) large 113 C (i.e., samples with 113 C > 18 ‰; sample 3B-
and using an updated paleogeography based on Matthews 021). We include two samples in our reconstruction (sam-
et al. (2016) (i.e., Gplates). The updated paleogeography re- ples 6-003 and 4-038) which have 17 ‰ < 113 C < 18 ‰ (Ta-
sults in higher Early Cretaceous paleolatitudes for all Asian ble 1 and Fig. 5). Though this 113 C signature may indicate
sites included in this compilation (Supplement; Table S5), low productivity (Cotton and Sheldon, 2012), which can in-
including a more than +13◦ N shift for the Xinminpu Group fluence the MAP versus S(z) relationship, the presence of
sites (Fig. 6). When placed on the paleogeography of Lin et abundant root traces in sections 4 and 6 (i.e., Suarez et al.,
al. (2003), proxy-based temperature reconstructions for Asia 2018) suggests otherwise. In addition to meeting 113 C cri-
indicate a cool climate relative to latitudinal models of tem- teria, no clear correlation between carbonate δ 13 C and δ 18 O
perature and hydrology (i.e., land surface gradients compiled is observed (Fig. 4) and carbonates tend to be isotopically
in Suarez et al., 2011a, including leaf physiognomy-based homogeneous (Fig. 4; Table 4; maximum 1σ of 0.3 ‰ in
gradients of Spicer and Corfield, 1992, cool and warm Creta- all samples for both δ 13 C and δ 18 O). We include estimates
ceous gradients of Barron, 1983, and GENESIS-MOM gen- of uncertainty in our atmospheric pCO2 reconstructions fol-
eral circulation model gradients of Zhou et al., 2008). For lowing Retallack (2009). Specifically, uncertainty is equiva-
example, temperature data fall below even the coolest Cre- lent to the square root of the sum of the individual compo-
taceous modeled gradient (i.e., Barron, 1983) despite agree- nents of uncertainty squared. Here, we propagate uncertainty
ment between proxy δ 18 Omw in midlatitude continental Asia in δ 13 Cc , including 2σ analytical uncertainty in δ 13 Ccarb and
and the modeled cool Cretaceous (Fig. 7a and b). However, if 2σ temperature uncertainty and δ 13 Cr (2σ analytical uncer-
the Matthews et al. (2016) paleolatitudes are applied, proxy- tainty). To test the sensitivity of S(z) estimates on pCO2 , we
based temperatures become better aligned with Cretaceous include two pCO2 reconstructions using (1) the MAP-based
modeled temperature gradients (Fig. 7c). Additionally, the variable S(z) computed for each sample following Cotton
updated paleolatitudes tend to offset δ 18 Op -based δ 18 Omw and Sheldon (2012) and (2) a large range in S(z), which is ap-
estimates in a positive direction relative to the modeled plied to all samples and propagated as additional uncertainty.
cool Cretaceous δ 18 Omw gradient, aligning these data with For the second pCO2 reconstruction approach, the maximum
a flatter, more modern appearing δ 18 Omw gradient (Fig. 7d). range in S(z) is set using the relationship of Cotton and Shel-
Meanwhile, our clumped isotope and δ 18 Ocarb -based δ 18 Omw don (2012), applying the maximum MAP value observed
value falls within the error of the range in Cretaceous mod- in the sections containing samples for pCO2 reconstruction
eled δ 18 Omw gradients (Fig. 7d) suggesting potential errors (i.e., 984 mm yr−1 which translates to S(z) of 5309 ppmv).
in required assumptions for δ 18 Op -based δ 18 Omw reconstruc- This maximum value is representative of some maximum
tions of Amiot et al. (2011). The δ 18 Op may be more 18 O- modern S(z) values observed in Holocene calcic soils by
enriched compared to δ 18 Omw than accounted for in those Breecker et al. (2010) and consistent with summer minimum
original studies. The consumption of evaporatively enriched S(z) values observed in grassland Vertisols by Mielnick and
leaf water in herbivores provides one possible mechanism Dugas (2000). Minimum S(z) is set at 2500 ppmv, following
for 18 Op enrichment (Levin et al., 2006). Alternatively, the the recommended S(z) of Breecker et al. (2010), as this value
range in paleolatitudes presented here demonstrates the large is consistent with minimum MAP for our record following
degree of uncertainty with regards to Early Cretaceous pale- the relationship of Cotton and Sheldon (2012). As observed
ogeographic reconstructions of Asia (Supplement; Table S5), previously for the Cretaceous (e.g., Franks et al., 2014), at-
which may be driving Aptian–Albian proxy–model dispari- mospheric paleo-pCO2 derived from pedogenic carbonate
ties. stable isotopes tends to lose sensitivity at low atmospheric
CO2 concentrations, resulting in calculated error which spans
negative concentrations. Here, we exclude negative, unrealis-
Clim. Past, 17, 1607–1625, 2021 https://doi.org/10.5194/cp-17-1607-2021D. T. Harper et al.: Aptian–Albian clumped isotopes from northwest China 1619
Figure 6. Paleogeographic reconstruction of plate boundaries at ca. 113 Ma (Matthews et al., 2016) using the Gplates software. Approximate
location of the White Pagoda site following Matthews et al. (2016) is plotted in red. Additional paleogeographic reconstructions are also plot-
ted for comparison (Lin et al., 2003; Torsvik et al., 2012), although these paleolocations are inconsistent with plate boundary reconstructions
shown here (i.e., do not follow Matthews et al., 2016). The Aptian–Albian paleolatitude using the Gplates software is more consistent with
the cooler temperatures indicated by clumped isotope paleothermometry.
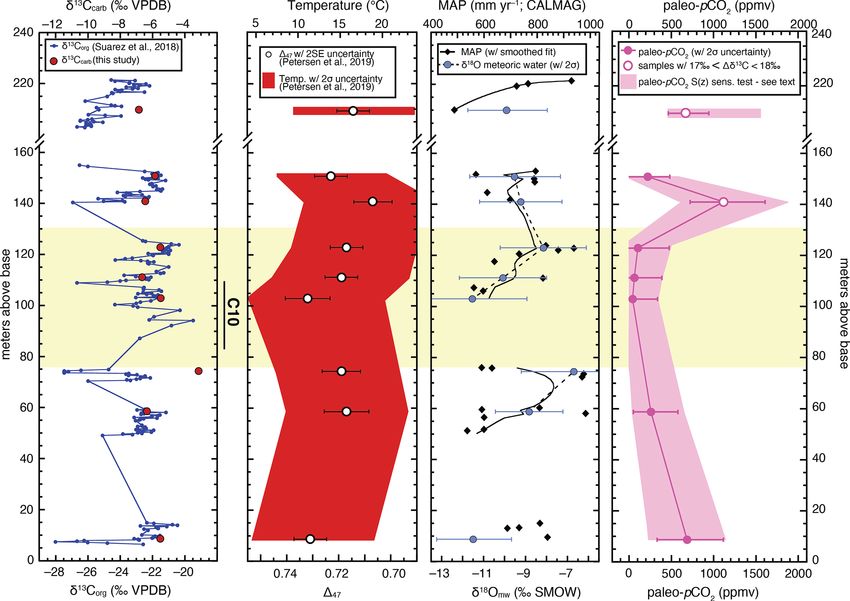
tic pCO2 values from our record and report these minimums resolution to pick up on shorter-term variations. Addition-
as 0 ppmv (Fig. 5) and note that calculated minimum pCO2 ally, although comparatively offset to lower values, variabil-
is > −231 ppmv for all samples (Table 4). ity in our atmospheric pCO2 reconstruction follows the pat-
Our atmospheric pCO2 reconstruction suggests relatively tern of Aptian–Albian pCO2 variability observed in other pe-
low (for greenhouse climates) and variable pCO2 over dogenic and pelagic marine carbonate-based estimates (i.e.,
the study interval. This observation is consistent with cool gradual decrease in late Aptian with a low at the Aptian–
Aptian–Albian temperatures (i.e., MAAT ∼ 15 ◦ C in mid- Albian boundary before increasing into the early Albian; Li
latitudes as indicated by this study and others). Mean at- et al., 2013; Bottini et al., 2015).
mospheric pCO2 for the entire record is 396 ppmv and
pCO2 generally tracks temperature variability with low (i.e., 4.5 Aptian–Albian variations in atmospheric pCO2 ,
< 300 ppmv) pCO2 in the cool C10 interval increasing up climate and the hydrologic cycle
section to ∼ 1100 ppmv. Our record is largely in agreement
with paleobotanical proxy-based pCO2 reconstructions for Cooler midlatitude terrestrial temperatures (MAATs of
the Aptian–Albian, which range from ∼ 500 to 1300 ppmv ∼ 15 ◦ C) are consistent with the post-OAE 1a cold snap hy-
(Aucour et al., 2008; Passalia, 2009; Haworth et al., 2010; Du pothesis (e.g., Mutterlose et al., 2009) observed in terrestrial
et al., 2016). While this study indicates slightly lower pCO2 (e.g., Amiot et al., 2011) and sea surface temperature records
than other carbon-isotope-based records for the Aptian– (e.g., both nannofossil indicators and organic glycerol dialkyl
Albian (e.g., Ekart et al., 1999, suggest ∼ 1500 ppmv; Wall- glycerol tetraether (GDGT) temperature proxy TEX86 show
mann, 2001, suggest 700 to 1500 ppmv; Fletcher et al., 2005, cooling at globally distributed sites; Bottini et al., 2015).
suggest 1100 to 1200 ppmv), these records do not all sat- Following Friedman and O’Neil (1977), coupled carbon-
isfy the requirements of Cotton and Sheldon (2012) (e.g., ate δ 18 O and temperatures suggest variations in δ 18 Omw of
113 C < 17 ‰ in the record of Ekart et al., 1999, likely bi- ±2.2 ‰ over the study interval consistent with shifts in the
ases to higher atmospheric pCO2 ) and may lack the sampling distribution of atmospheric moisture associated with climate
change but similar in magnitude to 2σ reconstruction uncer-
https://doi.org/10.5194/cp-17-1607-2021 Clim. Past, 17, 1607–1625, 20211620 D. T. Harper et al.: Aptian–Albian clumped isotopes from northwest China Figure 7. Northern Hemisphere latitudinal gradients of temperature and meteoric water δ 18 O for the mid-Cretaceous (Barremian–Albian). Our mean record data (pink) and the data of Amiot et al. (2011) (black) are plotted with a range in modeled gradients of Cretaceous climate as a function of latitude (blue shaded area) compiled in Suarez et al. (2011a). Details on models included in this range are in the main text. Modern temperature and meteoric water δ 18 O (gray lines) are plotted following Rozanski et al. (1993). The 1σ uncertainty is included for all data. Two paleolatitude reconstructions are considered: Lin et al. (2003) (a, b) and Matthews et al. (2016) (c, d). Uncertainty in latitude is included in panels (a) and (b); reconstructions of Matthews et al. (2016) do not provide uncertainty. tainty (Table 2). However, climate-change-induced variations coarseness of our record which likely does not pick up on in Asian continental-interior δ 18 Omw during the Early Creta- peak temperature variability, we observe subtle temperature ceous would be expected given model results which show shifts over the interval (i.e., cooling of −2 to −4 ◦ C preced- shifts in δ 18 Omw of +2 ‰ to +4 ‰ associated with two dou- ing +4 to +6 ◦ C of warming across the inferred C10 inter- blings of atmospheric pCO2 (global average surface warm- val), which likely corresponds to the cool interval between ing of 6 ◦ C) in continental interiors (Poulsen et al., 2007). OAE 1a and OAE 1b and may include Kilian and/or OAE 1b Our records similarly suggest subtle warming-induced 18 O warmth (e.g., Bottini et al., 2015) around 140 m (Fig. 5). enrichment in δ 18 Omw for continental Asia, as atmospheric Shifts in the hydrologic cycle reflected in δ 18 Omw and pCO2 , temperature and δ 18 Omw increase following the C10 MAP (Fig. 5) track 147 -based temperatures, suggesting interval (Fig. 5). Variability in δ 18 Omw is likely minimally climate-controlled regional shifts in the interior Asian hydro- influenced by seasonality following our interpretation above logic cycle. Interestingly, the driest conditions tend to cor- of consistent seasonal formation of pedogenic carbonate nod- relate to relative lows in temperature and δ 18 Omw perhaps ules in Vertisols. While age controls are limited, chemostrati- pointing to variations in the seasonality and/or sourcing of graphic correlations (i.e., Suarez et al., 2018) suggest our meteoric waters in Asia associated with long-term climate record spans several million years (i.e., C7 to C12 carbon evolution. Compared with background environmental condi- isotope segments after Menegatti et al., 1998, and Bralower tions, cooler temperatures (down to 11.1 ◦ C), drier conditions et al., 1999; roughly 6 million years). Given the temporal (MAP < 600 mm yr−1 ) and 18 O-depleted meteoric waters are Clim. Past, 17, 1607–1625, 2021 https://doi.org/10.5194/cp-17-1607-2021
You can also read