COSMOS-UK: national soil moisture and hydrometeorology data for environmental science research - ESSD
←
→
Page content transcription
If your browser does not render page correctly, please read the page content below
Earth Syst. Sci. Data, 13, 1737–1757, 2021
https://doi.org/10.5194/essd-13-1737-2021
© Author(s) 2021. This work is distributed under
the Creative Commons Attribution 4.0 License.

                      COSMOS-UK: national soil moisture and
                     hydrometeorology data for environmental
                                science research
      Hollie M. Cooper1 , Emma Bennett1 , James Blake1 , Eleanor Blyth1 , David Boorman1 , Elizabeth Cooper1 ,
         Jonathan Evans1 , Matthew Fry1 , Alan Jenkins1 , Ross Morrison1 , Daniel Rylett1 , Simon Stanley1 ,
           Magdalena Szczykulska1 , Emily Trill1 , Vasileios Antoniou1 , Anne Askquith-Ellis1 , Lucy Ball1 ,
            Milo Brooks2 , Michael A. Clarke3 , Nicholas Cowan4 , Alexander Cumming1 , Philip Farrand1 ,
       Olivia Hitt1,a , William Lord1 , Peter Scarlett1 , Oliver Swain1 , Jenna Thornton1,b , Alan Warwick1 , and
                                                  Ben Winterbourn1,c
                            1 UK  Centre for Ecology & Hydrology, Wallingford, OX10 8BB, UK
          2 UK Centre for Ecology & Hydrology, Environment Centre Wales, Bangor, Gwynedd, LL57 2UW, UK
         3 UK Centre for Ecology & Hydrology, Lancaster Environment Centre, Bailrigg, Lancaster, LA1 4AP, UK
                4 UK Centre for Ecology & Hydrology, Bush Estate, Penicuik, Midlothian, EH26 0QB, UK
                      a formerly at: UK Centre for Ecology & Hydrology, Wallingford, OX10 8BB, UK
                    b now at: UK Met Office, Cardington Airfield, Shortstown, Bedford, MK42 0SY, UK
                c now at: School of Ocean Sciences, Bangor University, Bangor, Gwynedd, LL59 5AB, UK

                                   Correspondence: Hollie M. Cooper (holcoo@ceh.ac.uk)

                                Received: 14 February 2020 – Discussion started: 17 March 2020
                         Revised: 26 February 2021 – Accepted: 1 March 2021 – Published: 28 April 2021

      Abstract. The COSMOS-UK observation network has been providing field-scale soil moisture and hydrom-
      eteorological measurements across the UK since 2013. At the time of publication a total of 51 COSMOS-UK
      sites have been established, each delivering high-temporal resolution data in near-real time. Each site utilizes
      a cosmic-ray neutron sensor, which counts epithermal neutrons at the land surface. These measurements are
      used to derive field-scale near-surface soil water content, which can provide unique insight for science, industry,
      and agriculture by filling a scale gap between localized point soil moisture and large-scale satellite soil mois-
      ture datasets. Additional soil physics and meteorological measurements are made by the COSMOS-UK network
      including precipitation, air temperature, relative humidity, barometric pressure, soil heat flux, wind speed and
      direction, and components of incoming and outgoing radiation. These near-real-time observational data can be
      used to improve the performance of hydrological models, validate remote sensing products, improve hydro-
      meteorological forecasting, and underpin applications across a range of other scientific fields. The most recent
      version of the COSMOS-UK dataset is publically available at https://doi.org/10.5285/b5c190e4-e35d-40ea-8fbe-
      598da03a1185 (Stanley et al., 2021).

Published by Copernicus Publications.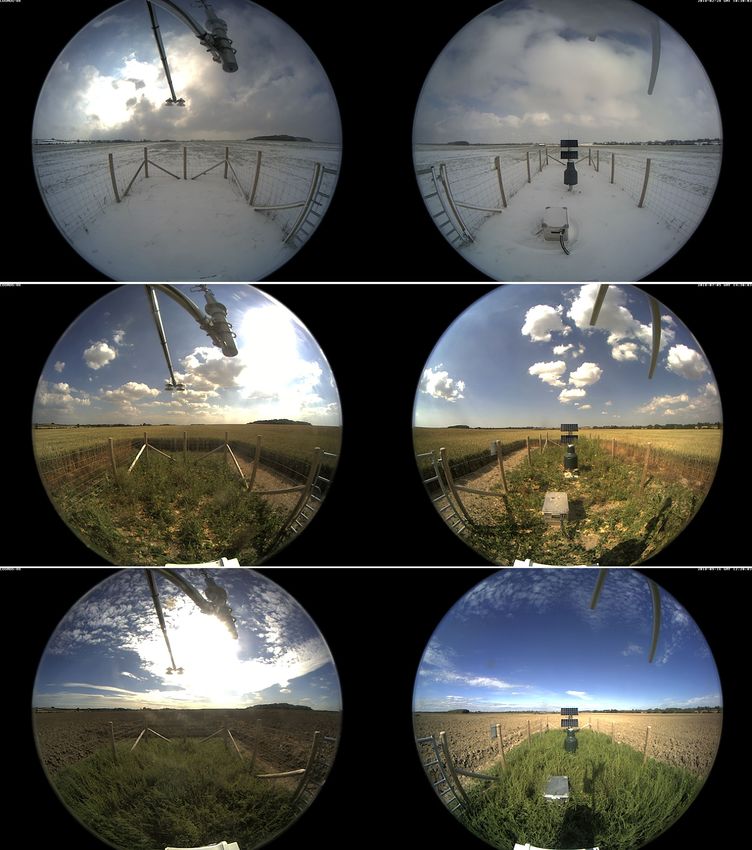
1738                                                                                          H. M. Cooper et al.: COSMOS-UK

1   Introduction

Soil moisture plays a crucial role in a range of biogeophys-
ical and biogeochemical land surface processes (Moene and
van Dam, 2014; Seneviratne et al., 2010). These processes in-
clude the transport of energy and matter via evapotranspira-
tion, drainage, run-off, infiltration and plant photosynthesis,
and controlling aerobicity of soils. Since 2013 the UK Cen-
tre for Ecology & Hydrology (UKCEH) has established the
world’s most spatially dense national network of innovative
cosmic-ray neutron sensors (CRNSs) to monitor soil mois-
ture across the UK. The Cosmic-ray Soil Moisture Observing
System for the UK (COSMOS-UK) delivers field-scale near-
surface soil water content for around 50 sites in near-real
time (https://cosmos.ceh.ac.uk, last access: 22 April 2021).
The field-scale measurement footprint of these soil moisture
observations, collocated with hydrometeorological measure-
ments, is directly relevant to land surface models (LSMs) and
Earth observation (EO) data products. COSMOS-UK there-
fore aims to transform hydrological and land surface mod-
elling and monitoring, enabling and supporting a range of
applications across science and industry.
   Whilst the UK has a long history and well-established tra-
dition of monitoring meteorological and hydrometeorolog-
ical variables, namely precipitation, temperature, and river
flow, soil moisture has until recently been difficult to measure
in a cost-effective way and at a scale appropriate to many
applications. Real-time soil moisture information is crucial
in understanding the susceptibility of rainfall to cause flood-
ing, the need for irrigation, the likelihood of landslip, and the
suitability of undertaking agricultural activities. Addition-
ally, knowledge of the soil moisture regime informs all land-       Figure 1. Map of COSMOS-UK site locations (Boorman et al.,
use planning, the need for drainage, water resource develop-        2020).
ment, flood forecasting, drought management, and agricul-
tural development. High-frequency soil moisture measure-
ments are also crucial to the development of process-based          a depth of approximately 80 cm depending on local condi-
models which replicate soil and microbial processes in soils,       tions (see Sect. 3.1 for details). This therefore fills the scale
which significantly influence greenhouse gas (GHG) emis-            gap between buried point soil sensor measurements and very-
sions and the nitrogen cycle in natural and agricultural sys-       near-surface soil data captured in EO soil moisture products.
tems (Oertel et al., 2016). With the absence of appropriate         CRNS data are being used across the globe, including from
sensor technology, most notably due to the gap in spatial           networks in the United States (Zreda et al., 2012), Australia
scale between small-area sensors and large-area remote sens-        (Hawdon et al., 2014), Germany (Baatz et al., 2014; Fersch
ing, soil moisture information has historically been estimated      et al., 2020), Kenya, and India (Montzka et al., 2017; Upad-
by hydrological and land-surface models. The development            hyaya et al., 2021). COSMOS-UK aims to support science,
and use of the CRNS provide appropriate scale data to enable        industry, and agriculture by providing reliable, accurate, and
model application, calibration, and testing as well as provid-      timely soil moisture information for the UK.
ing near-real-time data of local relevance.                            This paper introduces the COSMOS-UK network and the
   COSMOS-UK fills a critical gap in UK hydrological mon-           data available for use. Current instrumentation and proto-
itoring by utilizing CRNSs to monitor field-scale soil mois-        cols are described in Sect. 2. Section 3 outlines how the data
ture (see the UK Water Resources Portal, https://eip.ceh.ac.        are handled. Section 4 describes the datasets that are avail-
uk/hydrology/water-resources/, last access: 22 April 2021).         able for download from The Environmental Information Data
At each COSMOS-UK site the CRNS sits above ground,                  Centre (EIDC) online data repository. A selection of existing
autonomously counting epithermal neutrons for near-real-            and potential data applications are discussed in Sect. 5, fol-
time processing at UKCEH. The instrument has a measure-             lowed by conclusions.
ment footprint of approximately 12 ha and can measure to

Earth Syst. Sci. Data, 13, 1737–1757, 2021                                          https://doi.org/10.5194/essd-13-1737-2021
H. M. Cooper et al.: COSMOS-UK                                                                                                   1739

Table 1. Site information. Standard average annual rainfall (SAAR) is provided by the Flood Estimation Handbook (FEH) catchment
descriptor SAAR6190 as described in Bayliss (1999). Monitored soil types include mineral soil (MS), calcareous mineral soil (CMS),
organic soil (OS), and organic soil over mineral soil (OSMS). Land covers comprise broadleaf woodland (BW), coniferous woodland (CW),
coniferous forest (CF), arable and horticulture (AH), grassland (G), improved grassland (IG), acid grassland (AG), calcareous grassland
(CG), heather grassland (HG), heather (H), and orchard (O).

           Site name             Start (end) date             Altitude (m)   SAAR (mm)       Soil type   Current land cover
           Alice Holt            06/03/2015                            80             801    MS          BW
           Balruddery            15/05/2014                           130             740    MS          AH
           Bickley Hall          28/01/2015                            78             727    MS          G
           Bunny Park            27/01/2015                            39             579    MS          AH
           Cardington            24/06/2015                            29             552    MS          IG
           Chimney Meadows       02/10/2013                            65             626    CMS         IG
           Chobham Common        24/02/2015                            47             662    OSMS        HG
           Cochno                23/08/2017                           168            1387    MS          IG
           Cockle Park           21/11/2014                            87             720    MS          AH
           Crichton              02/12/2014                            42            1051    MS          AH
           Cwm Garw              29/06/2016                           299            1740    MS          IG
           Easter Bush           13/08/2014                           208             798    MS          IG
           Elmsett               11/08/2016                            76             564    CMS         AH
           Euston                31/03/2016                            18             600    MS          IG
           Fincham               07/06/2017                            15             613    CMS         AH
           Fivemiletown          26/06/2018                           174            1227    MS          AH
           Gisburn Forest        15/08/2014                           246            1485    MS          CW
           Glensaugh             14/05/2014                           399            1109    OS          H
           Glenwherry            15/06/2016                           274            1340    OS          IG
           Hadlow                27/10/2016                            33             669    MS          IG
           Hartwood Home         20/05/2014                           225             946    MS          IG
           Harwood Forest        22/05/2015                           300             895    OS          CF
           Henfaes Farm          17/12/2015                           287            1282    MS          AG
           Heytesbury            16/08/2017                           166             832    CMS         CG
           Hillsborough          14/06/2016                           146             909    MS          IG
           Hollin Hill           25/03/2014                            82             673    MS          IG
           Holme Lacy            11/04/2018                            76             674    MS          AH
           Loddington            26/04/2016                           186             664    MS          AH
           Lullington Heath      16/12/2014                           119             825    CMS         CG
           Moor House            04/12/2014                           565            1239    MS          AG
           Moreton Morrell       15/11/2018                            53             611    MS          IG
           Morley                14/05/2014                            55             620    MS          AH
           North Wyke            16/10/2014                           181             979    MS          AH
           Plynlimon             05/11/2014                           542            2421    OS          AG
           Porton Down           18/12/2014                           146             759    CMS         IG
           Redhill               18/02/2016                            91             656    CMS         O
           Redmere               10/02/2015 (–20/09/2018)               3             559    OS          AH
           Riseholme             04/05/2016                            53             603    CMS         IG
           Rothamsted            25/07/2014                           131             692    MS          AH
           Sheepdrove            24/10/2013                           170             737    MS          AH
           Sourhope              19/11/2014                           487            1009    MS          AG
           Spen Farm             23/11/2016                            57             654    CMS         AH
           Stiperstones          06/11/2014                           432             874    OS          IG
           Stoughton             19/08/2015                           130             641    MS          AH
           Sydling               27/11/2018                           249            1064    MS          IG
           Tadham Moor           14/10/2014                             7             749    OS          IG
           The Lizard            17/10/2014                            85            1084    MS          G
           Waddesdon             04/11/2013                            98             636    MS          IG
           Wimpole               10/09/2019                            30             555    MS          AH
           Writtle               04/07/2017                            44             571    MS          IG
           Wytham Woods          26/11/2013 (–01/10/2016)             109             647    MS          BW

https://doi.org/10.5194/essd-13-1737-2021                                            Earth Syst. Sci. Data, 13, 1737–1757, 2021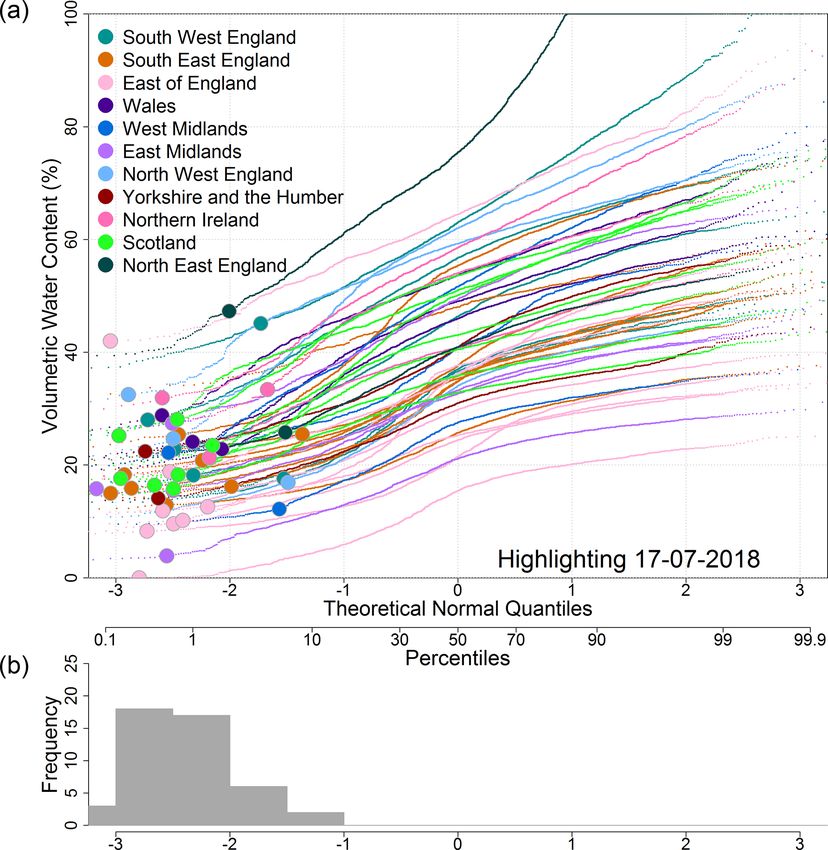
1740 H. M. Cooper et al.: COSMOS-UK
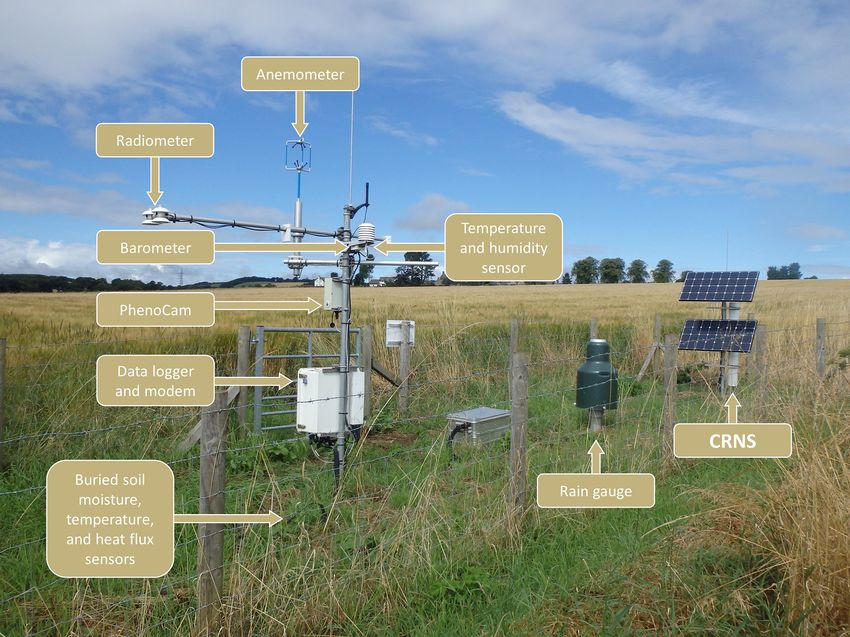
Figure 2. COSMOS-UK site instrument layout. Photograph of the Balruddery site in Scotland. Photograph taken by Jenna Thornton.
Table 2. Changes in land cover at COSMOS-UK sites. derstanding of UK soil moisture conditions, including rep-
resentation of key land cover and soil types. All UK regions
Site ID Land cover Land cover start date are represented, though there are more sites in the south and
Crichton IG 21/11/2014
east of the UK to adequately capture the greater soil mois-
AH 10/05/2019 ture variability in these areas. Installation of sites in less rep-
resented regions is in consideration but is dependent on the
North Wyke IG 16/10/2014 availability of resources.
AH 09/09/2019 Specific site locations have been further determined by
Sheepdrove IG 24/10/2013 practical considerations such as long-term permission and
AH 03/10/2019 reasonable access for instrument installation and mainte-
nance, and mobile phone network coverage. Where pos-
sible, site selection has aimed to exploit opportunities for
COSMOS-UK data to support independent, existing research
2 Measurement methodology
projects, e.g. data assimilation for forecasting and prediction,
validation of remote sensing data, and support of other mon-
2.1 Network creation
itoring programmes and activities. Similarly, site selection
Between 2013 and the time of writing, UKCEH has deployed has aimed to create partnerships with farmers and support
51 COSMOS-UK environmental monitoring sites across the agricultural research.
UK (Fig. 1) (Boorman et al., 2020). Two sites, Wytham Some site characteristics can limit their suitability for
Woods and Redmere, have been decommissioned during this CRNS soil moisture measurement, such as proximity to
time due to changes to site conditions and access. A summary open water or shallow or perched groundwater (such features
of each site’s main characteristics is included in Table 1, and should not be present within the CRNS measurement foot-
a record of any changes to site land cover is provided in Ta- print) and highly variable topography. Sites have therefore
ble 2. been installed in non-mountainous and largely flat locations
The selection of sites within the network has aimed to with no regular irrigation or close proximity to significant
provide an appropriate spatial coverage for improving un- water bodies.
Earth Syst. Sci. Data, 13, 1737–1757, 2021 https://doi.org/10.5194/essd-13-1737-2021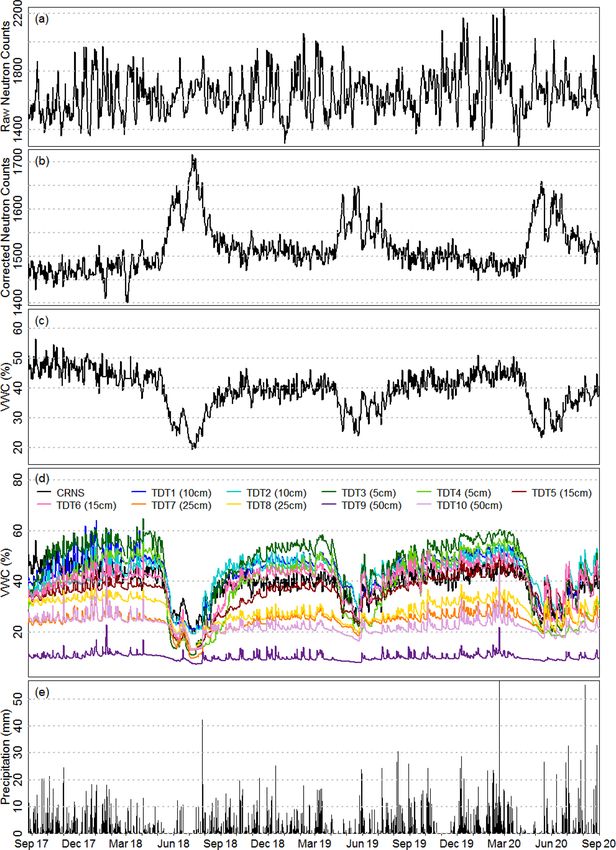
H. M. Cooper et al.: COSMOS-UK                                                                                                  1741

Table 3. COSMOS-UK site instrumentation. The snow depth SR50A sensors and SnowFox CRNS are only at sites established as sites
experiencing significant periods of snow cover.

  Data                                            Instrument
  Neutron counts and field-scale soil moisture    Hydroinnova CRS1000/B CRNS OR Hydroinnova CRS2000/B CRNS
  Point soil moisture and temperature             2 Acclima ACC-SEN-SDI (TDT)
  Profile soil moisture and temperature           1 IMKO PICO-PROFILE and 1 Hukseflux STP01 OR 8 Acclima ACC-SEN-SDI
                                                  (TDT) and 1 Hukseflux STP01
  Point soil heat flux                            2 Hukseflux HFP01SC
  Precipitation                                   1 OTT Pluvio2 (L) OR 1 OTT Pluvio2 (L) and 1 SBS500
  Short- and long-wave radiation in and out       Hukseflux NR01
  Air temperature and relative humidity           Rotronic HC2(A-)S3 OR Vaisala HMP155(A)
  Barometric pressure                             Gill MetPak Pro Base Station OR Vaisala PTB110
  Wind speed and direction                        Gill Integrated WindSonic OR Gill WindMaster 3D sonic anemometer
  PhenoCam photos                                 Mobotix S14 OR S15 OR S16 IP camera
  Snow depth                                      Campbell Scientific SR50A
  Neutron counts for snow water equivalent        Hydroinnova SnowFox CRNS

2.2   Site data acquisition                                           USA), Maestro M100 (Lantronix Inc., Irvine, California,
                                                                      USA), Proroute® H820 (E-Lins Group, Shenzhen, China), or
Instrumentation at COSMOS-UK sites is largely standard-
                                                                      9502 BGAN (Hughes Network Systems LLC, Germantown,
ized (Fig. 2); however differences have arisen for the follow-
                                                                      Maryland, USA) modem.
ing reasons.
                                                                         Sensor calibration coefficients are stored on the CR3000
  – Instrument performance was reviewed, resulting in                 for measurements such as soil heat flux (G, W m−2 ) and the
    subsequent installations utilizing different, higher-             four components of net radiation (RN, W m−2 ). Equipment
    performance sensors (e.g. for improved sensor accu-               across the network is promptly replaced when faults are de-
    racy).                                                            tected, and instruments are tested and re-calibrated on an an-
                                                                      nual basis under a maintenance contract with the suppliers
  – Where a site was located in an area which is expected to          of the field instrumentation, Campbell Scientific Ltd. A full
    experience a significant period of snow cover, the mon-           record of sensor exchanges is maintained by UKCEH.
    itoring equipment includes additional sensors for mea-
    surements of snow.
                                                                      2.2.1   Soil data
  – A site has been located within a forest and requires mea-
                                                                      Each COSMOS-UK site utilizes a moderated CRS2000/B
    surements from a tower structure above the canopy of
                                                                      CRNS (Hydroinnova LLC, Albuquerque, New Mexico,
    mature vegetation.
                                                                      USA) which counts epithermal neutrons at the land sur-
   These site differences are detailed in Table 3. For fur-           face. The sites at Chimney Meadows, Sheepdrove, and
ther information regarding individual instruments, a de-              Wytham Woods were installed with a bare and moderated
tailed summary is provided in the COSMOS-UK User Guide                CRS1000/B, and Waddesdon was installed with only a mod-
(Boorman et al., 2020).                                               erated CRS1000/B (Hydroinnova LLC, Albuquerque, New
   Available measurements are described below, and fur-               Mexico, USA) (Zreda et al., 2012). All bare CRNSs have
ther information regarding variables and recording inter-             subsequently been removed. Wytham Woods was decommis-
vals is provided in Sect. 4. All COSMOS-UK measure-                   sioned in 2016, and in February 2020 CRS2000/B sensors
ments are logged on a CR3000 Micrologger (Campbell Sci-               were installed adjacent to the remaining CRS1000/B instru-
entific Ltd., Logan, Utah, USA) and telemetered via the               ments. The neutron counts from these sensors are used to de-
2G, 3G, or 4G mobile network, or Inmarsat BGAN satel-                 rive average field-scale volumetric water content (VWC, %)
lite network (Inmarsat Global Ltd., London, UK), to secure            of the near-surface soil layer (see Sect. 3.1 for details). Each
servers at UKCEH Wallingford. Telemetry has been achieved             site includes point-scale soil moisture sensors, which esti-
using a COM110 (Campbell Scientific Ltd., Logan, Utah,                mate VWC via time domain transmissometry (TDT). These

https://doi.org/10.5194/essd-13-1737-2021                                            Earth Syst. Sci. Data, 13, 1737–1757, 2021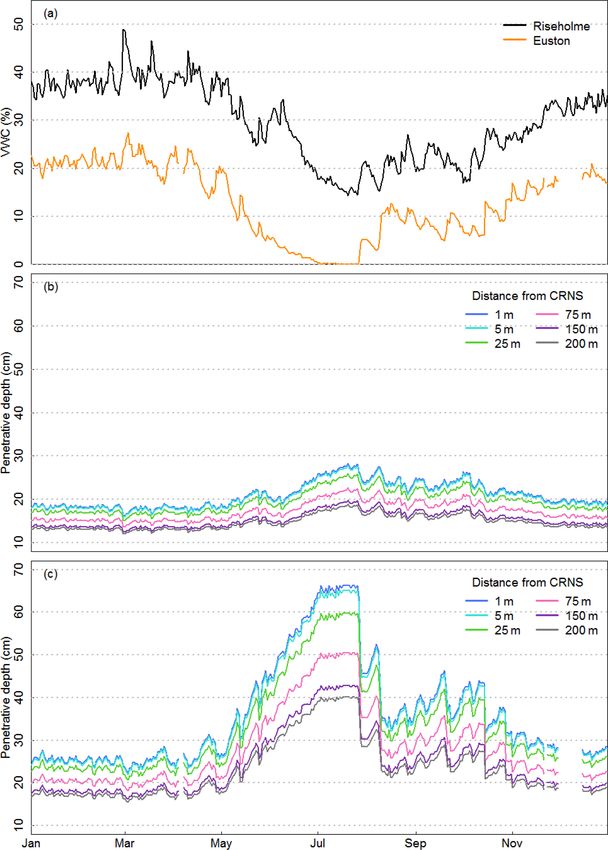
1742                                                                                              H. M. Cooper et al.: COSMOS-UK

Table 4. Buried depths of the paired TDT point soil sensors. TDT3–10 are only present at sites installed on or after 31 March 2016. At the
Heytesbury site TDT9 and TDT10 are buried at 0.05 m depth due to the presence of solid chalk. TDT pair 1 and 2 are located 1 m apart,
whilst the additional TDTs (3–10) are buried with 0.3 m space between the paired sensor and 0.15 m horizontal distance between pairs. Data
for each individual sensor are provided.

                     TDT1     TDT2      TDT3      TDT4      TDT5      TDT6     TDT7      TDT8      TDT9      TDT10
                     0.1 m    0.1 m     0.05 m    0.05 m    0.15 m    0.15 m   0.25 m    0.25 m    0.5 m     0.5 m

TDT sensors estimate point-scale soil moisture by measur-              or a three-dimensional WindMaster anemometer (Gill Instru-
ing the time taken for an electromagnetic wave to travel               ments Limited, Lymington, UK) at a measurement height of
along the sensor’s closed circuit; this transmission decreases         2.6 m.
in speed with soil permittivity (Blonquist et al., 2005). Each
site includes either 2 (deployment prior to March 2016) or 10
buried ACC-SEN-SDI TDTs (Acclima Inc., Idaho, USA) to                  2.2.3    Non-standard sites
measure small-area soil VWC (%) at defined depths (listed
in Table 4). Sites installed prior to March 2016 included a            COSMOS-UK sites located in dense forest or woodland (Al-
PICO-PROFILE soil moisture sensor (IMKO Micromodul-                    ice Holt, Harwood Forest and Wytham Woods) were de-
technik GmbH, Ettlingen, Germany) to measure VWC (%)                   signed with certain meteorological sensors installed above
at depths of 0.15, 0.4, and 0.65 m. The configuration of               the canopy, on pre-existing flux monitoring towers. Wind
site sensors resulted in occasional data loss, and the PICO-           measurements, barometric pressure, relative humidity, air
PROFILE instruments were subsequently removed from sites               temperature, precipitation, and the components of net radia-
during 2019–2020 network maintenance to improve overall                tion are measured above the canopy. The measurement height
data capture. Soil heat flux (W m−2 ) is measured at every             of these variables ranges from approximately 23–33 m. Pre-
site using a pair of HFP01-SC sensors (Hukseflux Thermal               cipitation is captured by a funnel above the canopy and fed
Sensors B.V., Delft, the Netherlands) buried at a depth of             via a tube to the Pluvio2 (L) rain gauge located at ground
0.03 m. All sites include an STP01 profile soil temperature            level. Forest sites do not accurately measure rainfall intensity
sensor (Hukseflux Thermal Sensors B.V., Delft, The Nether-             due to the lag time in precipitation captured above canopy
lands) to measure the soil temperature gradient (◦ C) at 0.02,         and recorded in the rain gauge below. Precipitation data are
0.05, 0.1, 0.2, and 0.5 m depths.                                      corrected for the smaller aperture area of the funnel relative
                                                                       to that of the Pluvio2 (L).
                                                                          Across the COSMOS-UK network, eight site locations
2.2.2   Hydrometeorological data                                       were identified in areas likely to experience a significant pe-
                                                                       riod of snow cover over the winter period. These sites (Glen-
COSMOS-UK sites include a Pluvio2 (L) digital weighing                 saugh, Easter Bush, Gisburn Forest, Plynlimon, Sourhope,
rain gauge (OTT HydroMet, Kempten, Germany) installed                  Moor House, Cwm Garw, and Cochno) were installed with
with an aperture height of 1 m above the soil surface. These           two additional sensors: an SR50A snow depth sensor (Camp-
rain gauges measure precipitation intensity and amount (mm)            bell Scientific Ltd., Logan, Utah, USA) measuring small
at 1 min resolution. Sites were identified as being not partic-        area snow depth (mm) and a buried SnowFox CRNS (Hy-
ularly exposed, and therefore Pluvio wind shields were not             droinnova LLC, Albuquerque, New Mexico, USA) measur-
installed. Incoming and outgoing short- and long-wave ra-              ing neutron counts which can be used to derive snow water
diation (W m−2 ) are measured at each site using an NR01               equivalent (Desilets, 2017).
four-component net radiometer (Hukseflux Thermal Sensors                  Tadham Moor is located on the Somerset Levels, an area
B.V., Delft, the Netherlands). Barometric pressure (hPa) is            that can experience inundation during high rainfall. The
measured at all sites using either a Gill MetPak Pro Base              COSMOS-UK site was therefore adapted to withstand any
Station (Gill Instruments Ltd., Lymington, UK) at a height of          significant floodwater. For this reason, the digital weighing
2 m or a PTB110 barometer (Vaisala Corporation, Helsinki,              rain gauge has an aperture height of approximately 1.7 m,
Finland). From this, pressure corrected to sea level is de-            and the CRNS is installed horizontally at a height of approx-
rived. Air temperature (◦ C) and relative humidity (%) are             imately 1.1 m rather than vertically. This non-standard instal-
measured at every site using either an HC2(A-)S3 (Rotronic,            lation enables an assessment of the CRNS technology in an
Bassersdorf, Switzerland) or HMP155(A) sensor (Vaisala                 environment with very high soil moisture.
Corporation, Helsinki, Finland). Air temperature and rela-                During COSMOS-UK network maintenance in Febru-
tive humidity are measured at the standard height of 2 m.              ary 2020 an SBS500 tipping-bucket rain gauge (Environmen-
Wind speed and direction are measured using either a two-              tal Measurements Limited, North Shields, UK) was added
dimensional WindSonic at a measurement height of 2.2 m                 to three sites (Chimney Meadows, Sheepdrove, and Waddes-

Earth Syst. Sci. Data, 13, 1737–1757, 2021                                              https://doi.org/10.5194/essd-13-1737-2021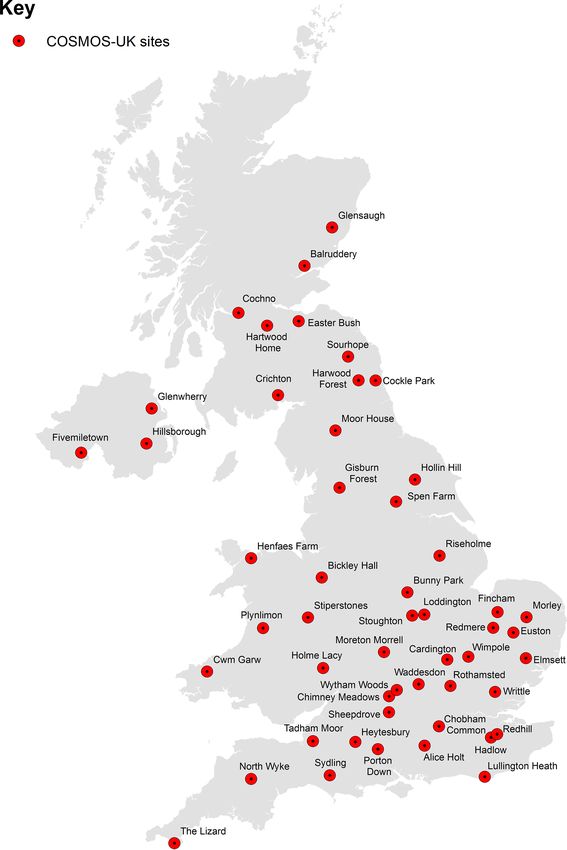
H. M. Cooper et al.: COSMOS-UK                                                                                                 1743

                                                                      07.53.SC sample ring kit and Edelman auger)) were taken
                                                                      at five depths: 0–0.05, 0.05–0.1, 0.1–0.15, 0.15–0.2, and
                                                                      0.2–0.25 m below ground level (b.g.l.). Soil sampling depths
                                                                      for CRNS calibration were selected to match typical (moist)
                                                                      UK conditions, and higher weighting is later applied to
                                                                      shallow soil layers to ensure appropriate representation
                                                                      of the decreasing contribution of deeper water (Köhli et
                                                                      al., 2015a; Schrön et al., 2017) (see Sect. 3.1 for details).
                                                                      Three locations at different bearings and distances were also
                                                                      selected for an additional soil sample for the determination
                                                                      of lattice and bound water and organic matter. The additional
                                                                      soil samples were taken from 0–0.25 m b.g.l. This therefore
                                                                      gives a total of 90(+3) soil samples for each calibration.
                                                                         The field soil samples were returned to the laboratory for
                                                                      analysis. VWC and dry bulk density were determined for the
                                                                      90 volumetric samples using oven drying (∼ 36 h at 105 ◦ C).
                                                                      Following analysis, a ∼ 2 g sub-sample was taken from each
                                                                      sample and aggregated to form a composite sample for lattice
Figure 3. Plan view of soil sampling locations (not to scale). Dis-
                                                                      and bound water and organic matter determination. The three
tances used prior to 14 September 2016 are shown in brackets.
                                                                      additional soil samples from the field were air-dried (on the
                                                                      lab bench or in the oven at 30 ◦ C) for around 3 d. The addi-
don), providing an additional precipitation (mm) reference            tional samples, along with the composite, were then crushed
against which the performance of the Pluvio2 (L) rain gauges          to pass a ∼ 0.4 mm sieve and subsequently air dried at 105 ◦ C
can be evaluated. The SBS500 tipping bucket rain gauge                for ∼ 36 h. Soil organic matter was then estimated for a ∼ 3 g
(TBR) was chosen for its improved aerodynamic characteris-            air dried sub-sample (with six replicates per additional sam-
tics and reduction in turbulence and under-catch (Colli et al.,       ple, i.e. 24 sub-samples) using loss on ignition at 400 ◦ C for
2018; Strangeways, 2004).                                             16 h in the furnace (following Nelson and Sommers, 1996).
                                                                      Following cooling in a desiccator and weighing, the sub-
                                                                      samples were then returned to the furnace to estimate lattice
2.3   Soil sampling and lab analysis for site calibration
                                                                      and bound water by loss on ignition at 1000 ◦ C for 4 h (fol-
An in situ soil sampling procedure adapted from                       lowing Pansu and Gautheyrou, 2006). For use in the CRNS
Franz (2012) and Zreda et al. (2012) has been completed at            calibration calculation, soil organic carbon was estimated as
each COSMOS-UK site following installation. The results               50 % of soil organic matter (Nelson and Sommers, 1996).
from the sampling are used to determine site-specific soil            Pansu and Gautheyrou (2006) note that loss on ignition re-
properties for CRNS calibration: field average soil moisture          moves organic matter at 300–500 ◦ C and lattice and bound
and dry bulk density, lattice and bound water, and organic            water at 350–1000 ◦ C. The procedure outlined above there-
matter. Once the CRNS count data have been corrected for              fore follows the 400 ◦ C temperature recommendation by Nel-
atmospheric pressure (Desilets, 2017; Evans et al., 2016),            son and Sommers (1996), which removes organic matter but
humidity (Evans et al., 2016; Rosolem et al., 2013), and an           causes minimal dehydroxylation of clay minerals. The CRNS
empirical background neutron intensity factor (adapted from           calibration procedure uses the mean soil organic carbon and
Evans et al., 2016), the calibration data are used to derive N0       mean lattice and bound water from the 24 sub-samples along
on the day of calibration (details in Sect. 3.1). Soil samples        with the mean dry bulk density from the 90 volumetric sam-
for determination of VWC and dry bulk density were taken              ples. The field average reference VWC for the day of calibra-
at 18 representative locations centred on the CRNS: at com-           tion is then calculated as a radial and vertical weighted mean
pass bearings of 0, 60, 120, 180, 240, and 300◦ and at 5, 25,         following Köhli et al. (2015). Planned work includes obtain-
and 75 m radial distance at each of these compass bearings            ing site bulk density using this weighting function. The soil
(Fig. 3). For CRNS calibrations before 14 September 2016,             properties and soil moisture results for calibrating each site
samples were taken at 25, 75, and 200 m radial distances.             are available in Table 5.
These locations follow Franz (2012), subsequently modified               Repeat calibrations using secondary samples have been
to account for revised CRNS footprint characteristics (Köhli          conducted at two COSMOS-UK sites to explore the accu-
et al., 2015b). In addition, as the 180◦ sample at 5 m distance       racy of the derived VWC obtained on a particular day using
would fall on a cable run within the CRNS enclosure, this             this methodology. There was < 0.03 cm3 cm−3 difference in
location has been replaced with a sample at either 90 or 270◦         VWC between the soil moisture determined from the sec-
at 1 m distance. At each location volumetric soil samples             ond calibration and the corresponding daily VWC value de-
(using 0.05 m diameter, 0.051 m length rings (Eijkelkamp              rived using the site’s first calibration. Considering the esti-

https://doi.org/10.5194/essd-13-1737-2021                                            Earth Syst. Sci. Data, 13, 1737–1757, 2021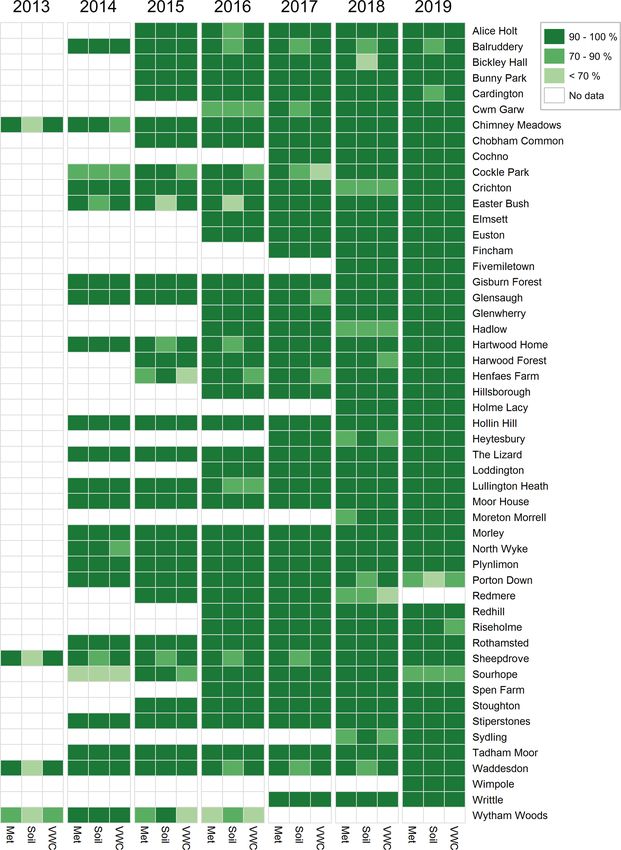
1744                                                                                                H. M. Cooper et al.: COSMOS-UK

Table 5. COSMOS-UK soil sampling results. Standard deviations are available in the dataset (Stanley et al., 2021).

                                                      Reference soil    Reference bulk       Reference      Reference soil
                                        Date of            moisture            density     lattice water    organic carbon
                 Site name              calibration    (cm3 cm−3 )           (g cm−3 )           (g g−1 )          (g g−1 )
                 Alice Holt             04/08/2015             0.266               0.85           0.025              0.042
                 Balruddery             29/07/2014             0.254               1.34           0.018              0.023
                 Bickley Hall           24/02/2015             0.412               1.31           0.010              0.020
                 Bunny Park             25/02/2015             0.283               1.55           0.008              0.016
                 Cardington             18/08/2015             0.141               1.14           0.016              0.040
                 Cardington             17/01/2018             0.325               1.30           0.014              0.032
                 Chimney Meadows        13/11/2013             0.393               1.36           0.011              0.027
                 Chimney Meadows        31/08/2018             0.247               1.26           0.011              0.032
                 Chobham Common         12/03/2015             0.566               0.90           0.003              0.031
                 Cochno                 18/10/2017             0.524               0.83           0.019              0.068
                 Cockle Park            10/12/2014             0.447               1.21           0.020              0.033
                 Crichton               08/12/2014             0.428               1.15           0.011              0.045
                 Cwm Garw               28/09/2018             0.417               0.96           0.022              0.048
                 Easter Bush            16/09/2014             0.303               1.10           0.019              0.033
                 Elmsett                19/01/2017             0.400               1.26           0.015              0.022
                 Euston                 18/01/2017             0.189               1.27           0.003              0.029
                 Fincham                28/07/2017             0.279               1.33           0.007               0.02
                 Fivemiletown           15/11/2018             0.537               0.97           0.014              0.039
                 Gisburn Forest         17/09/2014             0.542               0.82           0.021              0.061
                 Glensaugh              28/07/2014             0.608               0.44           0.014              0.203
                 Glenwherry             20/10/2016             0.631               0.54           0.024              0.153
                 Hadlow                 15/12/2016             0.398               1.22           0.028              0.031
                 Hartwood Home          30/07/2014             0.356               1.02           0.033              0.043
                 Harwood Forest         14/06/2017             0.591               0.33           0.009              0.304
                 Henfaes Farm           06/10/2016             0.507               0.97           0.022              0.077
                 Heytesbury             22/02/2018             0.411               0.88           0.006              0.066
                 Hillsborough           19/10/2016             0.450               1.15           0.021              0.042
                 Hollin Hill            25/06/2014             0.364               1.06           0.025              0.032
                 Holme Lacy             03/05/2018             0.292               1.24           0.017              0.022
                 Loddington             14/09/2016             0.455               1.16           0.041              0.036
                 Lullington Heath       14/01/2015             0.452               0.90           0.006              0.043
                 Moor House             11/12/2014             0.578               0.76           0.014              0.076
                 Moreton Morrell        13/02/2019             0.433               1.22           0.026              0.035
                 Morley                 19/06/2014             0.161               1.53           0.016              0.017
                 North Wyke             05/11/2014             0.472               1.12            0.02              0.037
                 Plynlimon              26/11/2014             0.590               0.62            0.02              0.098
                 Porton Down            02/02/2015             0.391               0.97           0.004              0.049
                 Redhill                08/12/2016             0.252               1.26           0.011              0.024
                 Redmere                04/06/2015             0.504               0.60           0.056              0.238
                 Riseholme              16/02/2017             0.429               1.27           0.022              0.032
                 Rothamsted             02/09/2014             0.280               1.33           0.018              0.021
                 Sheepdrove             20/03/2014             0.327               1.04           0.027              0.059
                 Sourhope               09/12/2014             0.578               0.65           0.021              0.086
                 Spen Farm              15/06/2017             0.269               1.41           0.011              0.019
                 Stiperstones           27/11/2014             0.612               0.62           0.016              0.104
                 Stoughton              19/11/2015             0.351               1.33           0.018              0.027
                 Sydling                21/03/2019             0.374               1.17           0.020              0.035
                 Tadham Moor            06/11/2014             0.615               0.32           0.029              0.314
                 The Lizard             04/11/2014             0.568               0.95           0.014              0.058
                 Waddesdon              13/03/2014             0.460               1.11           0.021              0.034
                 Wimpole                15/10/2019             0.361               1.22           0.015              0.035
                 Writtle                27/07/2017             0.350               1.26           0.019              0.035
                 Wytham Woods           15/04/2014             0.485               1.05           0.017              0.028

Earth Syst. Sci. Data, 13, 1737–1757, 2021                                                https://doi.org/10.5194/essd-13-1737-2021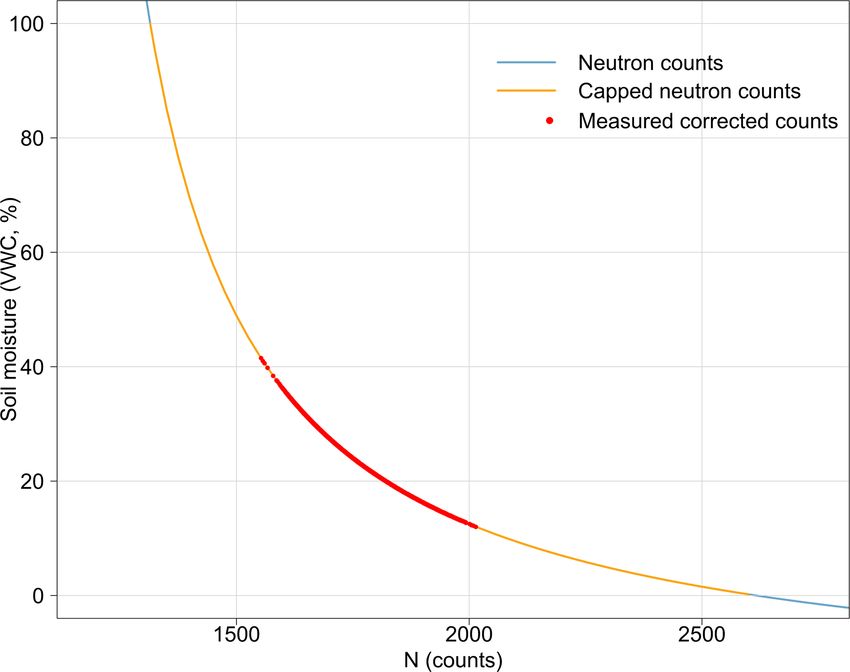
H. M. Cooper et al.: COSMOS-UK 1745
mated errors in soil sampling and (to a lesser extent) labora-
tory procedures, the difference in calibrations is considered
to be within the uncertainty of the reference soil moisture de-
termined from secondary sampling and the predicted VWC
from the CRNS and its original calibration. Additional repeat
calibrations are planned across the network to help further
analyse the current methodologies and assess sensor perfor-
mance over time.
3 COSMOS-UK data
3.1 Deriving soil moisture from the CRNS
Field-scale soil moisture (CRNS VWC) is derived from the
corrected CRNS epithermal neutron counts, which inversely
correlate with hydrogen present at the land surface (soil,
vegetation, and any other water sources; Zreda et al., 2008,
Figure 4. The calibration curve (Eq. 1) for determining soil mois-
2012). Incoming epithermal neutrons collide with hydrogen ture for the Redhill site. The range of neutron counts and the derived
nuclei at the land surface and are therefore moderated by the CRNS VWC are shown in blue. The range of possible capped neu-
hydrogen present in water molecules, thereby enabling an in- tron counts and VWC (determined by Nmin and Nmax ) is shown in
direct measurement of soil moisture (Rivera Villarreyes et al., orange. Corrected neutron counts and corresponding VWC at this
2011). VWC is calculated using the following formula where site between 18 February 2016 and 8 February 2021 are shown in
coefficients are determined for a basic silica soil (Desilets et red.
al., 2010; Evans et al., 2016).
0.0808 ρbd with appropriately scaled values from alternate monitors: an-
VWC = − 0.115 − (τ + SOC) (1) other counter at Jungfraujoch (JUNG1), Newark in the USA
Ncorr
− 0.372 ρw
N0 (NEWK) provided by the University of Delaware Depart-
ment of Physics and Astronomy and the Bartol Research
In Eq. (1), Ncorr denotes the corrected counts, τ is the ref- Institute, or Apatity in Russia (APTY). When choosing the
erence lattice and bound water, SOC is the reference soil most suitable neutron monitors for COSMOS-UK data, these
organic carbon, ρbd is the reference bulk density, and ρw monitors were identified as well-maintained with high lev-
is the water density equal to 1 g cm−3 . τ , SOC, and ρbd els of data completeness. The geomagnetic cut-off rigidity of
are determined on the calibration day by field and labora- the available monitors’ locations was also considered when
tory analysis (Evans et al., 2016; Franz, 2012; Franz et al., identifying suitable monitors. Normalized count rates are not
2013; Zreda et al., 2012). Ncorr is obtained by aggregating greatly affected by cut-off rigidity except for during signifi-
raw neutron counts from each site to a 60 min interval and cant space weather events, when magnetic field disturbances
correcting for atmospheric pressure (Desilets, 2017; Evans may result in a change to a location’s cut-off rigidity. A com-
et al., 2016), humidity (Evans et al., 2016; Rosolem et al., parison between JUNG and monitors with cut-off rigidities
2013), and background neutron intensity variations (adapted similar to COSMOS-UK sites presented good agreement be-
from Evans et al., 2016) using in situ measurements. The at- tween the normalized counts and associated trends. Follow-
mospheric pressure correction uses instantaneous baromet- ing this correction for background neutron intensity, counts
ric attenuation lengths (Desilets and Zreda, 2003) calculated are then calibrated to the site’s specific soil, using the soil
for COSMOS-UK sites according to http://crnslab.org/util/ calibration values determined by UKCEH laboratory analy-
intensity.php (last access: 22 April 2021), and the correc- sis.
tion uses a fixed reference pressure value of 1000 Pa. The COSMOS-UK uses the site-specific N0 method (Desilets
background neutron intensity correction uses the publically et al., 2010) for deriving water content from a site’s cor-
available Jungfraujoch (JUNG) data (http://nmdb.eu/station/ rected neutron count data, where N0 is the site-specific neu-
jung/, last access: 22 April 2021) provided by the Physikalis- tron counting rate over dry soil under reference atmospheric
ches Institut, University of Bern, Switzerland. Normalized pressure and solar activity conditions. Alternative methods
count rates from JUNG are retrieved and used in sub- are described in Baatz et al. (2014), Bogena et al. (2015), and
daily calculations to produce near-real-time COSMOS-UK Iwema et al. (2015). A site-specific N0 value is calculated by
datasets; the period of record is subsequently updated for rearranging Eq. (1) for N0 and substituting the average neu-
any changes to JUNG data on an annual basis. Where data tron counts on the day of calibration for N, together with
are unavailable from the JUNG detector the period is infilled reference soil moisture for VWC. The corrected counts and
https://doi.org/10.5194/essd-13-1737-2021 Earth Syst. Sci. Data, 13, 1737–1757, 20211746 H. M. Cooper et al.: COSMOS-UK Figure 5. Daily COSMOS-UK data for the Cochno site in Scotland. (a) Raw neutron counts from the CRNS (aggregated from hourly totals); (b) neutron counts corrected for pressure, humidity, and background count intensity (aggregated from hourly totals); (c) VWC determined from the CRNS-corrected counts and corrected for snow; (d) CRNS VWC and point TDT VWC at a series of depths; (e) precipitation. Note the 2018 cold wave and summer heatwave impact on soil moisture. N0 can then be input into Eq. (1) to produce VWCs. These tron counts are averaged to a daily mean and undergo the data are subsequently constrained to the physical range of same calculations to produce the daily CRNS VWC soil 0 %–100 % soil water content by determining values of Nmax moisture dataset. A minimum of 20 hourly values in a day and Nmin respectively, the maximum and minimum physi- is set as the requirement to produce a daily soil moisture cally admissible neutron count value for each site. Figure 4 value. An additional version of the soil moisture dataset is shows an example of the calibration curve for the Redhill calculated, in which daily CRNS VWC has been adjusted for site, located in South East England. snow events using site measurements of albedo. Once complete, this process produces the hourly CRNS An in-lab cross-comparison was performed on the major- VWC dataset. In a subsequent process, hourly corrected neu- ity of CRNSs prior to field deployment. Cross-calibration of Earth Syst. Sci. Data, 13, 1737–1757, 2021 https://doi.org/10.5194/essd-13-1737-2021
H. M. Cooper et al.: COSMOS-UK                                                                                                   1747

                                                                      each site. This figure demonstrates the importance of identi-
                                                                      fying and understanding localized soil properties and shows
                                                                      how sites in close proximity and experiencing broadly sim-
                                                                      ilar weather patterns can exhibit vastly different ranges and
                                                                      extremes in VWC.

                                                                      3.2   Soil moisture measurement area and depth
                                                                      The CRNS VWC value is an average soil moisture measure-
                                                                      ment (%) across an estimated, variable footprint of radius
                                                                      up to 200 m and estimated variable measurement depth of
                                                                      between approximately 0.1 and 0.8 m (following Köhli et
                                                                      al., 2015). Measurement area depends on local soil mois-
                                                                      ture, humidity, and land cover (Köhli et al., 2015b), whilst
                                                                      penetration depth depends on soil moisture as well as lat-
                                                                      tice water and soil organic matter water equivalent (Zreda
                                                                      et al., 2008, 2012; Franz et al., 2012). The greater the ac-
                                                                      tual soil water content, the smaller the CRNS measurement
                                                                      area and shallower the penetrative depth. The measurement
                                                                      area of the CRNS was initially believed to have a radius of
                                                                      approximately 300 m (Zreda et al., 2008); however Köhli et
Figure 6. Soil moisture regime plot for all COSMOS-UK sites
                                                                      al. (2015) report that 50 % of measured neutrons originated
grouped by region (dot colour) according to the Nomenclature of       within 50 m of the CRNS, and the footprint radius extended
Territorial Units for Statistics (NUTS) codes of the United King-     to only 240 m in arid climates. The penetration depth of the
dom. The (a) dots and (b) histogram represent the soil moisture and   measurement is greatest near the CRNS and decreases with
corresponding frequency respectively, on 17 July 2018 when there      distance from the sensor; this varying depth across the foot-
was a widespread drought across the UK. Each line represents the      print is provided as “D86”, the depth at which 86 % of the
distribution of CRNS VWC at a COSMOS-UK site; sites with wet-         measured neutron counts are estimated to have originated at
ter regimes plot higher up in the figure.                             a given distance (Zreda et al., 2008; Franz et al., 2013). In the
                                                                      COSMOS-UK dataset, D86 is provided at distances of 1, 5,
                                                                      25, 75, 150, and 200 m from the CRNS. Figure 7 shows the
deployed CRNSs was also carried out at six COSMOS-UK                  estimated D86 values for a typically drier site, Euston (aver-
sites; data were captured from two adjacent CRNSs for a pe-           age soil moisture approximately 15 %), and a typically wetter
riod of several months to establish a reliable relationship be-       site, Riseholme (average soil moisture approximately 33 %),
tween their counts using a linear regression model.                   for 2018. During this year the UK experienced a cold wave
   Point soil moisture and precipitation data at each                 with significant snow in February to March and a heatwave in
COSMOS-UK site provide important ancillary information                June to August. This figure presents how measurement depth
for assessing the potential accuracy of the CRNS VWC data.            increases in drier conditions, decreases with distance from
Figure 5 shows each of the processing stages for deriving             the CRNS, and differs between sites.
soil water content from neutron counts for the Cochno site in
Scotland, alongside soil moisture measured by the 10 buried           3.3   Data processing and quality procedures
point sensors and precipitation. This figure clearly shows that
                                                                      Raw data collected at each COSMOS-UK site, comprising
daily CRNS VWC data closely resemble the soil moisture
                                                                      the measured variables described above as well as additional
dynamics measured by the point sensors, and the response of
                                                                      diagnostic data from sensors (e.g. internal humidity of the
both VWC measurements to precipitation events.
                                                                      CRNS), are telemetered to UKCEH and stored in an Oracle
   Some sites may have a higher CRNS VWC measurement
                                                                      relational database (Oracle, 2012). When new values are de-
uncertainty. For example sites with extensive soil organic
                                                                      rived following the application of corrections, calibrations,
matter accumulation (e.g. carbon-dense peatlands) or mature
                                                                      and quality tests, these derived data are stored in separate,
woodlands where CRNS VWC methods might need to be
                                                                      secondary tables. These secondary datasets are those that are
further refined to account for biomass, plant roots, litter-layer
                                                                      published.
thickness, and intercepted water (Andreasen et al., 2017;
                                                                         Data quality assurance (QA) and quality control (QC) are
Baatz et al., 2015; Heidbüchel et al., 2016; Rivera Villar-
                                                                      applied to specific variables in the raw data. QC is conducted
reyes et al., 2011). The contrast of CRNS VWC measure-
                                                                      in two stages.
ments between sites can be seen in Fig. 6, which displays
all data for the period of record as a normalized curve for

https://doi.org/10.5194/essd-13-1737-2021                                            Earth Syst. Sci. Data, 13, 1737–1757, 2021
1748 H. M. Cooper et al.: COSMOS-UK
Figure 7. CRNS VWC and corresponding D86 penetrative depth estimates at a range of distances for two COSMOS-UK sites throughout
2018. (a) CRNS VWC for the Riseholme and Euston sites; (b) D86 values for Riseholme; (c) D86 values for Euston.
1. Automated processing is applied to raw data to provide have passed the automated QC tests are flagged and
a quality-assured dataset. Data which fail the tests are omitted from the secondary dataset.
flagged and are not written to secondary datasets. These
Automated processing tasks assess the raw data and cre-
automated tests include pre-processing for known errors
ate a flagged dataset based on the test results. This enables
and subsequent QC processes for detecting additional
tracking of data removal and ensures raw data are not lost or
erroneous data. These processes are explained below.
overwritten. Raw data are passed through multiple indepen-
dent QC tests (Table 6). Each test assigns a unique flag value
2. Regular manual inspection of raw, diagnostic, and pro- to any raw data which fail. Where data fail multiple tests, the
cessed data is performed using a variety of automated flag values are summed. The summed flag values are unique
summary plots and reports. Clearly erroneous data that for each combination of tests, allowing failed tests to be de-
Earth Syst. Sci. Data, 13, 1737–1757, 2021 https://doi.org/10.5194/essd-13-1737-2021H. M. Cooper et al.: COSMOS-UK 1749
Table 6. Unique flag values assigned to data based on QC test results.
Test Flag description Flag value
Passes all tests 0
Missing Fails the test for missing values 1
Zero data Fails the test for zero values where impossible 2
Too few samples Fails if not enough samples taken by the data logger over the data interval 4
Low power Fails if the site battery level is too low 8
Sensor faults Fails where sensor has been manually recorded as faulty for a period of the record 16
Diagnostic Fails based on diagnostic data for particular sensors 32
Range Fails if values are outside a predefined range for the variable 64
Secondary variables Fails if a value of one variable implies a fault with another 128
Spike Fails where a spike in the data exceeds a given threshold 512
Error codes Fails where data contain any known error code 1024
termined from the sum. Where data pass all QC tests, the 3.5 Additional available data
flag values are assigned “0”. The tests flag issues including
Additional information can be derived from the data provided
data exceeding known thresholds, implausible values, and
by COSMOS-UK sites. As part of ongoing and planned evo-
data where other variables indicate an issue. The secondary
lution of the network, the additional data described in this
dataset comprises all data not flagged by the QC processes.
section are not yet included in the published data.
All derived datasets are obtained using the quality-checked
Existing PE data will be complemented by a new de-
30 min data. Planned future work includes the development
rived dataset, which estimates actual evapotranspiration (ET)
of a tertiary dataset comprising quality-processed and gap-
as the residual term from measurements of net radiation,
filled data.
soil heat flux, and the sensible heat flux derived from sonic
anemometer measurements. Modelled energy fluxes, such as
3.4 Derived data latent and sensible heat, have been calculated by utilizing
In addition to the COSMOS-UK observed soil and hydrom- the 20 Hz wind measurements recorded at the majority of
eteorological data, the network provides derived datasets in- COSMOS-UK sites (Crowhurst et al., 2019). This provides a
cluding potential evaporation (PE), albedo, snow days, and network-wide modelled actual ET dataset for the UK.
snow water equivalent (SWE). In addition to the measurements mentioned previously,
PE has been derived from each site’s solar radiation, soil COSMOS-UK sites also capture photographs. Sites include
heat flux, air temperature, humidity, and wind speed data us- a camera for monitoring phenology, a “PhenoCam”, with
ing the Penman–Monteith method as described by the Food two hemispheric lenses facing north and south (Fig. 9). Each
and Agriculture Organization of the United Nations (FAO) COSMOS-UK site sends five photographs per day, which
(Allen et al., 1998) (Fig. 8). Daily PE data for all COSMOS- capture the full extent of the COSMOS-UK site and sur-
UK sites are provided in this dataset. rounding area, thereby providing additional information on
Snow days have been identified using albedo measure- local phenology and cloud cover. These PhenoCam images
ments, and SWE has been determined using the albedo can be used to confirm when site conditions have changed,
and neutron count data available from the CRNS at each for example when the land cover has been modified (e.g.
COSMOS-UK site. Neutron counts from both the CRNS ploughing, mowing, grazing, harvesting) or there has been
and SnowFox sensor are sensitive to all sources of water in heavy snowfall. PhenoCam photos from COSMOS-UK sites
the environment, allowing them to be used to estimate the are also currently being analysed to produce a greenness
SWE held in a snowpack. First the albedo is used to deter- dataset. Using site-specific image masks, RGB (red, green,
mine the presence or absence of snow cover, and then, if blue) data can be extracted from each image to determine
present, the reduction in neutron count rate from an estimated the greenness of the land cover at each site (Wingate et al.,
snow-free value is used to approximate the SWE, following 2015). In 2020 the network’s first gauge board was installed
the method of Desilets (2017). This dataset includes CRNS at the Cwm Garw site in Wales. Gauge boards indicate height
SWE. Methods for estimating SWE are available from Wall- above ground level (cm) against which vegetation height and
bank et al. (2020) and discussed in more detail in Wallbank snow depth can be estimated via PhenoCam images. Further
et al. (2021). gauge boards are planned at sites across the network.
Available derived data are listed in Sect. 4.
https://doi.org/10.5194/essd-13-1737-2021 Earth Syst. Sci. Data, 13, 1737–1757, 20211750 H. M. Cooper et al.: COSMOS-UK
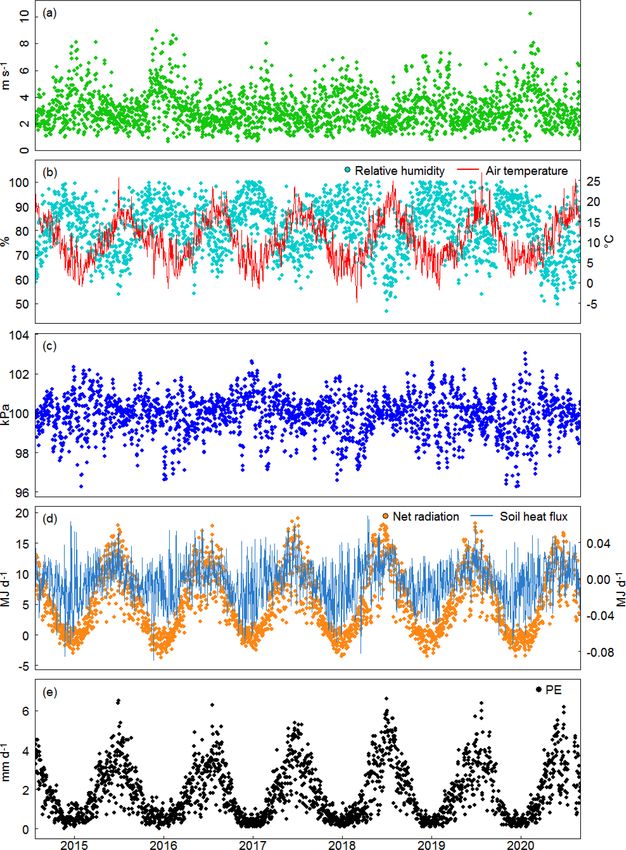
Figure 8. Daily COSMOS-UK observations required for the calculation of potential evaporation (PE) and derived PE at the Rothamsted
site in East Anglia. (a) Wind speed; (b) relative humidity and air temperature; (c) barometric pressure; (d) net radiation and soil heat flux;
(e) potential evaporation.
4 Data availability ber 2019 inclusively for 51 sites across the UK. The files
included for each site are as follows.
The “Daily and sub-daily hydrometeorological and soil data 1. COSMOS-UK_[SITE_ID]_HydroSoil_SH_2013-
(2013–2019) [COSMOS-UK]” time series dataset is the most 2019.csv
recent COSMOS-UK dataset at the date of publication. The
dataset is published by, and available for download from, the 2. COSMOS-UK_[SITE_ID]_HydroSoil_SH_2013-
EIDC at https://doi.org/10.5285/b5c190e4-e35d-40ea-8fbe- 2019_QC_Flags.csv
598da03a1185 (Stanley et al., 2021).
This dataset comprises daily and sub-daily observations 3. COSMOS-UK_[SITE_ID]_HydroSoil_Hourly_2013-
and derived data between 2 October 2013 and 31 Decem- 2019.csv
Earth Syst. Sci. Data, 13, 1737–1757, 2021 https://doi.org/10.5194/essd-13-1737-2021H. M. Cooper et al.: COSMOS-UK 1751
Figure 9. PhenoCam photographs from the Fincham COSMOS-UK site in East Anglia. From top: a snow event at the end of February 2018,
rapeseed oil crop growing in surrounding field in July 2018, and the bare field in September 2018.
4. COSMOS-UK_[SITE_ID]_HydroSoil_Daily_2013- 8. COSMOS-UK_HydroSoil_Daily_2013-
2019.csv 2019_Metadata.csv
Table 7 comprises the measured and derived variables, Data availability for individual variables and sites varies
units, and temporal resolution of data available in these files. throughout the dataset due to sensor faults, planned preven-
File 1 contains measured and derived variables at 30 min res- tative maintenance, and disruptions to data collection. Over-
olution, and file 2 comprises the QC flags for the data in all data completeness for this period for available variables
file 1. File 3 comprises the derived variables available at is 95.5 % (see a summary in Fig. 10) (Stanley et al., 2021).
hourly resolution, and file 4 contains derived data at daily Missing values due to technical faults and failed QC calcula-
resolution. tions are recorded as −9999.
Site metadata are available in four additional files. COSMOS-UK has been designed as a long-term monitor-
5. COSMOS-UK_SiteMetadata_2013-2019.csv ing network, and further data will be made available via the
EIDC. The dataset is superseded annually, with the inclu-
6. COSMOS-UK_HydroSoil_SH_2013- sion of 1 additional year of COSMOS-UK data for all avail-
2019_Metadata.csv able sites. Data are provisional and subject to change with
the release of each new version in line with developments
7. COSMOS-UK_HydroSoil_Hourly_2013- to the science, instrumentation, data processing, quality con-
2019_Metadata.csv trol, and data gap-filling protocols. Data are supplied with
https://doi.org/10.5194/essd-13-1737-2021 Earth Syst. Sci. Data, 13, 1737–1757, 20211752 H. M. Cooper et al.: COSMOS-UK
Table 7. Measured and derived variables available in the four data files provided in the COSMOS-UK dataset (Stanley et al., 2021).
Variable Unit Data type Data resolution File
Precipitation mm Measured 30 min 1
Relative humidity % Measured 30 min 1
Absolute humidity g m−3 Derived 30 min 1
Air temperature ◦C Measured 30 min 1
Atmospheric pressure hPa Measured 30 min 1
Incoming longwave radiation W m−2 Measured 30 min 1
Incoming shortwave radiation W m−2 Measured 30 min 1
Outgoing longwave radiation W m−2 Measured 30 min 1
Outgoing shortwave radiation W m−2 Measured 30 min 1
Net radiation W m−2 Derived 30 min 1
Wind direction Degrees Measured 30 min 1
Wind speed m s−1 Measured 30 min 1
3D wind speed data (X3) m s−1 Measured 30 min 1
Snow depth mm Measured 30 min 1
Soil heat flux (X2) W m−2 Measured 30 min 1
Soil temperature (X5) ◦C Measured 30 min 1
Soil temperature (TDT) (X2 or X10) ◦C Measured 30 min 1
Soil moisture (TDT VWC) (X2 or X10) % Measured 30 min 1
Soil moisture (CRNS VWC) % Derived Hourly & daily 3&4
Effective depth of CRNS (D86 at 75 m) cm Derived Hourly & daily 3&4
Neutron counts from CRNS (corrected) Counts Derived Hourly 3
Potential evaporation mm Derived Daily 4
Albedo Dimensionless Derived Daily 4
Snow days Yes/no Derived Daily 4
Snow water equivalent (from CRNS) mm Derived Daily 4
supporting information and a data licence that outlines the served range of soil moisture values (Cooper et al., 2020b).
terms of use to data users. This demonstrates the value in using in situ COSMOS-UK
data to drive models for increased performance. Additional
potential exists in using these larger area data across a vari-
5 Data applications ety of land covers to explore interactions and dynamics in in-
filtration, run-off (Dimitrova-Petrova et al., 2020), and inter-
Observational data from the COSMOS-UK network have ception (Zreda et al., 2012). Improved understanding of these
been used for a variety of purposes. They have significant processes could lead to more accurate and reliable modelling
potential to empower a range of existing and novel scientific of, and thus improved forecasting for, a range of hydrologi-
applications. Descriptions of some uses are included in this cal phenomena. For instance the JULES model, used as the
section. The main and immediate applications for COSMOS- land-surface scheme in UK Met Office forecasts (Best et al.,
UK observational data are for use in hydrological and land- 2011), is run at a minimum scale of 1 km. The parameteriza-
surface models and for validating remote sensing data. tion of this model can be improved in response to these soil
COSMOS-UK measurements cover a range of environ- moisture data (Cooper et al., 2020b), which can then be used
mental characteristics, and this can be exploited for devel- with UK-scale meteorological data (Robinson et al., 2020) to
opment of models, which are used for scaling up and fore- deliver a national-scale soil moisture product.
casting soil moisture at the national scale. Field-scale soil Using land–atmosphere modelling together with
moisture measurements from a variety of land covers have COSMOS-UK soil moisture and modelled ET data, along
been used to investigate the accuracy and reliability of LSMs. with measured ET where available, can empower further
Comparison of COSMOS-UK soil moisture measurements investigation into soil moisture dynamics and biosphere–
with outputs from LSMs allows for investigation into those atmosphere fluxes. These combined data can provide greater
models’ ability to represent soil moisture dynamics and un- understanding of land–atmosphere processes, for example of
derlying physical processes (Cooper et al., 2020a). For ex- feedback events during periods of drying soils and extreme
ample, data assimilation techniques have been used to adjust air temperatures (Dirmeyer et al., 2021) and storm initiation
soil physics parameters (via pedo-transfer functions), thereby (Taylor et al., 2012). Use of these data can also help estimate
allowing the JULES model to more closely produce the ob-
Earth Syst. Sci. Data, 13, 1737–1757, 2021 https://doi.org/10.5194/essd-13-1737-2021H. M. Cooper et al.: COSMOS-UK 1753 Figure 10. Data completeness for the Stanley et al. (2021) COSMOS-UK dataset. “VWC” is the CRNS VWC data, “Soil” consists of data from buried point and profile soil moisture sensors, and “Met” comprises meteorological variables. landscape average precipitation, as described in Franz et existing products (Beale et al., 2020; Pinnington et al., 2021; al. (2020). Quinn et al., 2020) for obtaining better estimates of UK soil COSMOS-UK field-scale soil moisture is also proving moisture data at higher spatial resolution (Peng et al., 2020). particularly useful for ground-truthing remote sensing soil Similar networks across the globe, for example in the US, moisture data. For this application, the value of COSMOS- India, and China, have also been exploited for such research UK data largely resides in the footprint of the CRNS. The (Montzka et al., 2017; Upadhyaya et al., 2021; Zhu et al., field-scale soil moisture data prove to be a radical improve- 2019). COSMOS-UK soil moisture can be used together with ment on point soil measurements alone, as the larger foot- PhenoCam data to further investigate remote sensing analysis print more closely represents the resolution of satellite prod- in vegetation growth, crop senescence, snow events, surface ucts, whilst averaging across smaller-scale soil heterogeneity. ponding, and land cover change. COSMOS-UK data can therefore help validate and improve https://doi.org/10.5194/essd-13-1737-2021 Earth Syst. Sci. Data, 13, 1737–1757, 2021
1754                                                                                           H. M. Cooper et al.: COSMOS-UK

   With a vision to develop a dynamic near-real-time UK soil      cold wave, heatwave, and agricultural drought the UK expe-
moisture map, there is potential for COSMOS-UK data to in-        rienced during 2018. As the length of the data record con-
fluence wider fields. Scaled-up near-real-time COSMOS-UK          tinues to grow, COSMOS-UK will provide an unprecedented
data through using models, remote sensing, or both could in-      resource for national-scale environmental monitoring. Data
form water regulators such as the Environment Agency on           from the COSMOS-UK network are of significant national
the state of UK soil moisture. Direct evidence of drought         and international relevance, empowering applications includ-
and flooding events induced, or impacted, by soil moisture        ing the validation of remotely sensed data products, the inter-
is increasingly needed to inform decisions at the national        pretation of biogeochemical flux observations, and the cali-
scale. Similarly, these data could help inform UK wildfire        bration and testing of LSMs. Significant opportunity exists
prediction and ecological applications via simulations of soil    for new applications in support of water resources, weather
moisture, air temperature, precipitation, and vegetation infor-   prediction and space sciences, and biodiversity and environ-
mation (Albertson et al., 2009). Additionally, with an under-     mental change.
standing of the links between soil moisture and plant produc-        At the time of publication, the most recent COSMOS-UK
tivity, COSMOS-UK data can be used to monitor the need            dataset available comprises daily and sub-daily hydrometeo-
for irrigation (Ragab et al., 2017), thereby improving our        rological and soil physics data between 2 October 2013 and
predictions of crop yield for the UK. Furthermore, under-         31 December 2019 for 51 sites. The COSMOS-UK dataset
standing soil moisture at identified landslip sites could help    will be updated on an annual basis.
in the development of landslide early warning systems, for
example using the Hollin Hill COSMOS-UK site in North
Yorkshire (Bliss et al., 2020). At the site scale, soil mois-     Author contributions. The initial draft manuscript was prepared
ture data from individual COSMOS-UK sites have proven             and written by HC with significant contributions from JB, DB, and
valuable when paired with gas flux data provided by field-        SS. Additional manuscript contributions were made by E Bennett,
scale methodologies such as eddy covariance (Cowan et al.,        E Blyth, EC, NC, JE, MF, AJ, RM, DR, MS, and ET. AA, JB, MB,
                                                                  MC, HC, NC, AC, JE, PF, WL, RM, DR, PS, JT, ET, AW, and
2018, 2020). Here the high temporal, spatially integrated soil
                                                                  BW conducted fieldwork and maintained network operation. JB, E
moisture data can be used to better refine gap-filling meth-
                                                                  Blyth, DB, EC, HC, JE, MF, OH, RM, SS, MS, and ET contributed
ods, particularly for emissions of the powerful GHG nitrous       to data processing, quality control, and applications. VA, E Bennett,
oxide, which responds strongly to changes in soil aerobicity.     DB, OH, SS, and OS contributed to data accessibility. LB, E Ben-
As all of the major GHGs (CO2 , CH4 , N2 O), and many sec-        nett, DB, JE, and AJ contributed to the planning and management
ondary GHGs and other sources of air pollution (CO, NO,           of the network. All authors contributed to the success of the dataset.
NO2 ) generated by soil microbial activity, are heavily influ-
enced by soil moisture (Cowan et al., 2018; Davidson et al.,
2000; Oertel et al., 2016; Van Den Pol-van Dasselaar et al.,      Competing interests. The authors declare that they have no con-
1998), the COSMOS-UK network will provide the ability to          flict of interest.
better refine UK-scale emission inventories in the future as
UK-scale soil moisture models are improved.
   COSMOS-UK data could also provide insight into alterna-        Acknowledgements. The authors would like to thank past and
tive scientific research, such as the relationship between soil   present COSMOS-UK team members for their support of the mon-
moisture and pest behaviour (Hertl et al., 2001), the impact of   itoring network: Joshua Alton, Sarah Bagnoli, Sandie Clemas,
                                                                  Louisa Doughty, Richard Ellis, Charles George, Duncan Harvey,
soil moisture on local infrastructure (Pritchard et al., 2013),
                                                                  Ned Hewitt, Filip Kral, Sarah Leeson, Jeremy Libre, Gemma Nash,
investigation of ground-level cosmic ray events (Flückiger et     Joanne Newcomb, Matthew Parkes, Ragab Ragab, Warren Read,
al., 2005), and meteorological data with respect to bacterial     Colin Roberts, Ondrej Sebek, Andrew Singer, Charlie Stratford,
infection seasonality (Djennad et al., 2019).                     Simon Teagle, Helen Vincent, John Wallbank, Helen Ward, and
                                                                  George Wright.
                                                                     This work was supported by the Natural Environment Research
6   Conclusions                                                   Council award number NE/R016429/1 as part of the UK-SCAPE
                                                                  programme delivering National Capability.
The COSMOS-UK network is the world’s most spatially                  The authors would like to thank the Physikalisches Institut, Uni-
dense national network of cosmic-ray neutron sensors for ob-      versity of Bern, Switzerland, for kindly and reliably providing
serving near-surface field-scale soil water dynamics. Field-      Jungfraujoch neutron monitor data.
                                                                     The authors also thank the University of Delaware Department
scale soil moisture and hydrometeorological data are avail-
                                                                  of Physics and Astronomy and the Bartol Research Institute, USA,
able from a diverse range of sites located across the UK, with
                                                                  for the reliable provision of Newark/Swarthmore neutron monitor
the earliest sites providing data since 2013. The COSMOS-         data.
UK dataset is a unique and growing resource that has already
captured soil water dynamics across a wide range of climatic
conditions, including extreme events such as the extended

Earth Syst. Sci. Data, 13, 1737–1757, 2021                                             https://doi.org/10.5194/essd-13-1737-2021
You can also read


