Soil as an extended composite phenotype of the microbial metagenome - Nature
←
→
Page content transcription
If your browser does not render page correctly, please read the page content below
www.nature.com/scientificreports
OPEN Soil as an extended composite
phenotype of the microbial
metagenome
Andrew L. Neal1*, Aurélie Bacq‑Labreuil2,4, Xiaoxian Zhang3, Ian M. Clark3, Kevin Coleman3,
Sacha J. Mooney2, Karl Ritz2 & John W. Crawford3,5
We use a unique set of terrestrial experiments to demonstrate how soil management practises result
in emergence of distinct associations between physical structure and biological functions. These
associations have a significant effect on the flux, resilience and efficiency of nutrient delivery to plants
(including water). Physical structure, determining the air–water balance in soil as well as transport
rates, is influenced by nutrient and physical interventions. Contrasting emergent soil structures exert
selective pressures upon the microbiome metagenome. These selective pressures are associated with
the quality of organic carbon inputs, the prevalence of anaerobic microsites and delivery of nutrients
to microorganisms attached to soil surfaces. This variety results in distinctive gene assemblages
characterising each state. The nature of the interactions provide evidence that soil behaves as an
extended composite phenotype of the resident microbiome, responsive to the input and turnover
of plant-derived organic carbon. We provide new evidence supporting the theory that soil-microbe
systems are self-organising states with organic carbon acting as a critical determining parameter.
This perspective leads us to propose carbon flux, rather than soil organic carbon content as the critical
factor in soil systems, and we present evidence to support this view.
Soil—the basis of terrestrial life on Earth—continues to defy our comprehensive understanding despite the
evident catastrophic consequences of mismanagement, such as the North American “Dust Bowl” of the 1930s
which was exacerbated by poor stewardship of agricultural soils1. Faced with the multiplicity of processes which
constitute soil, scientific reductionism has led to studies which have advanced our knowledge of soil’s biological,
chemical or physical components predominantly in isolation. However, soil—in common with many biological
phenomena—is more appropriately considered a hierarchical assemblage of interacting processes, stabilized and
actively maintained at different timescales2: soil is processual and not comprehensible based on single-discipline
experimentation. Tisdall and Oades’ pioneering conceptual m odel3 linking microbial activity to soil structural
development advanced the importance of interaction between biotic and abiotic phenomena in the process of
generating soil structural complexity (topology and connectivity).
Soil organic matter (SOM) is the fundamental causative agent generating structural complexity, as it acts to
bind mineral particles and colloids together. Plant and animal residues are processed by microbes before join-
ing the SOM pool4,5: this step is an important facet of both the Tisdall and Oades model, and its subsequent
extension6. SOM may take the form of microbial polysaccharidic and proteinaceous exudates as well as cell
debris and is chemically structurally diverse4; in effect, SOM is a continuum of progressively more extensively
oxidized compounds7. Much of this SOM is associated with pores of 30–100 μm d iameter8, scales comparable
to the 12–13 μm distances observed in soil between microbial c ells9. As a result, the effect of microbial pro-
cesses—metabolism, extracellular degradation of compounds, polymer secretion and cell lysis—on soil structure
is particularly evident at the scales < 50 μm responsible for regulating convective and diffusive flow rates, as well
as the balance of air and water at any given matric p otential6. These hierarchical processes exhibit characteristic
properties of self-organizing and emergent s ystems10,11.
1
Department of Sustainable Agriculture Sciences, Rothamsted Research, North Wyke EX20 2SB, UK. 2Division of
Agriculture and Environmental Science, School of Biosciences, The University of Nottingham, Sutton Bonington
Campus, Sutton Bonington LE12 5RD, UK. 3Department of Sustainable Agriculture Sciences, Rothamsted
Research, Harpenden AL5 2JQ, UK. 4Present address: Greenback, 4 rue de l’église, 27440 Lisors, France. 5Present
address: Adam Smith Business School, University of Glasgow, Glasgow G12 8QQ, UK. *email: andy.neal@
rothamsted.ac.uk
Scientific Reports | (2020) 10:10649 | https://doi.org/10.1038/s41598-020-67631-0 1
Vol.:(0123456789)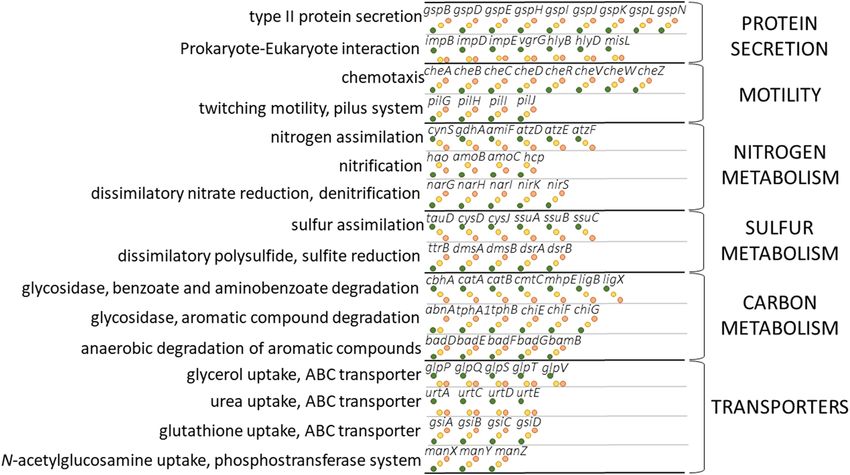
www.nature.com/scientificreports/
Such experiential and theoretical approaches are formulating a new understanding of how microbial activity
controls soil structure—in effect, how soil should be viewed as an expression of biological process. They also pro-
vide evidence supporting a view of soil as a product of genes, manifest through the combined effects of multiple
organism phenotypes: in essence, an extended composite phenotype (Phillips12, after Dawkins13). The identifying
features of this phenomenon are a strong influence of at least one organism upon the form or structure of a soil
environment—termed a process-form relationship; demonstrable synchrony between the activity of influencing
organisms and form development; selective pressure arising from form development acting, in Dawkins’ strict
sense upon alleles13,14 and in Phillips’ broader concept upon soil o rganisms12; which results in positive feedback
where selective pressure favours alleles (or organisms) associated with the process-form state, manifest as the
influence of microbial turnover of SOM upon soil structural development, discussed above.
There is compelling evidence implicating plant-derived organic carbon inputs in the soil extended composite
phenotype15,16. However, complete description of such a phenotype requires, in turn, a well-developed under-
standing of the consequences of evolving soil structure for the genetic manifestation of on-going microbial
processes—such feedback is necessary for emergence of organisation, observable at the whole-system level in
complex biological, chemical and physical systems. Currently, few studies present comprehensive description
of the influence of soil structure upon microbial processes, and those that do, typically address only the associa-
tion of metabolically defined bacterial groups with soil aggregate or particle size, rather than soil structure per
se (see Lensi et al.17 and Chotte et al.18). The principal influence of soil structural complexity is predicted to be
on diffusion processes dictating the microenvironments surrounding surface-associated c ells19. Observation of
anaerobic regions of soil aggregates associated with denitrification p rocesses20, and the influence of anaerobic
microsites in ostensibly oxygen-rich soils upon microbial respiration and carbon compound oxidation rates21
provide indirect evidence for such metabolic constraints arising from soil structure. However, this view of soil
as an extended composite phenotype requires two specific conditions to be met. The first we term the Process-
Form Condition, where the biological structures and functions that emerge from interactions between individual
genotypes and their microenvironments should result in soil structural changes beyond the scale of individual
cells. The second we term the Allelic Response Condition, where the process-form interaction should be reflected
in significant modification at the level of individual alleles in soil microbiomes (i.e., fundamental changes in gene
abundance patterns and whole metabolic pathways) such that alleles that correspond with specific processes are
preferentially selected for—extending beyond short-term quantitative changes in specific gene expression profiles.
In this paper, we integrate biological and physical data relating to dynamics of the soil system with mathemati-
cal modelling to explore these conditions. This approach is used to interpret results from a unique long-term
field-experiment within the context of the proposed view of soil as an extended composite phenotype: linking
organic carbon inputs to soil with emergence of key soil structural properties; and describing the gene-level
microbiome responses to contrasting emergent soil structural complexity arising from long-term carbon input
regimes. The experiment uses the Highfield Ley-Arable Experiment at Rothamsted Research, Harpenden, U.K.
Results
Process‑form relationships in soil are expressed through fine‑scale connected porosity. We
first investigated the influence of added organic carbon (Corg) on the development of soil structural complexity,
testing the hypothesis that greater inputs of Corg to soil are associated with development of improved soil struc-
ture; assessed as the degree of connectedness between pores (connected porosity). The bare fallowed soil used as
a starting point for these experiments experienced a demonstrable decline in C org22 and microbial abundance23
over forty-nine years of continuous management. Estimates of Corg are approximately 3 g C kg−124 and the soil
has a significantly reduced total porosity compared to mixed grass sward s oils25. To assess the influence of newly
imposed managements, we followed structure development for a decade (2008–2018) in these degraded soils
following conversion to either arable or mixed grass sward. The resulting estimates of soil structure demon-
strated clear differences in the development of connected porosity between soil managed continuously as bare
fallow and the converted soils (Fig. 1). Testing treatment effects upon connected porosity (square-root trans-
formed to stabilize variances) between 2012 and 2018 inclusive, by analysis of covariance employing time as a
covariate, indicated no significant heterogeneity of slopes (F2,75 = 0.537, p = 0.587) due to land management. The
resulting equal slopes model indicated a significant effect of management upon connected porosity develop-
ment (F2,72 = 26.2, p < 0.001). Post hoc pair-wise comparisons indicated that connected porosity generated in
grassland soil (meanadjusted, 0.079) was significantly greater than in either continuous bare fallow (meanadjusted,
0.010) or converted arable (meanadjusted, 0.025) soils (smallest difference, t = 4.79, p < 0.001). A significant differ-
ence between connected porosity generated in arable and bare fallow soils was also apparent (t = 2.30, p = 0.024).
No significant differences were detected when the complete 2008–2018 dataset was included, suggesting that
significant differences only become apparent after a period of at least 5 years post conversion. This represents
prima facie evidence for an extended composite phenotype, since there is clear synchrony between the estab-
lishment and continued growth of plants and development of connected porosity, representing a process-form
relationship.
To test the potential role of C
org in the observed relationship, we compared connected porosity development
with soil C org inputs. We modelled changes in C org content (see “Methods” for details) in bare fallow soil from
inception of the experiment in 1949 up to the year before conversion, 2007. From 2008, C org changes were mod-
elled for each year, based upon continued bare fallow management or management as either winter wheat based
arable or mixed grass sward. Continuously managed arable and grassland soils were also modelled in the same
manner but using their respective starting dates. The extremes of the cumulative C org input-connected porosity
relationship (Fig. 2) are derived from consistently managed soils; bare fallow being associated with the lowest net
Corg input and connected porosity, and arable and grassland soils being associated with the second highest and
Scientific Reports | (2020) 10:10649 | https://doi.org/10.1038/s41598-020-67631-0 2
Vol:.(1234567890)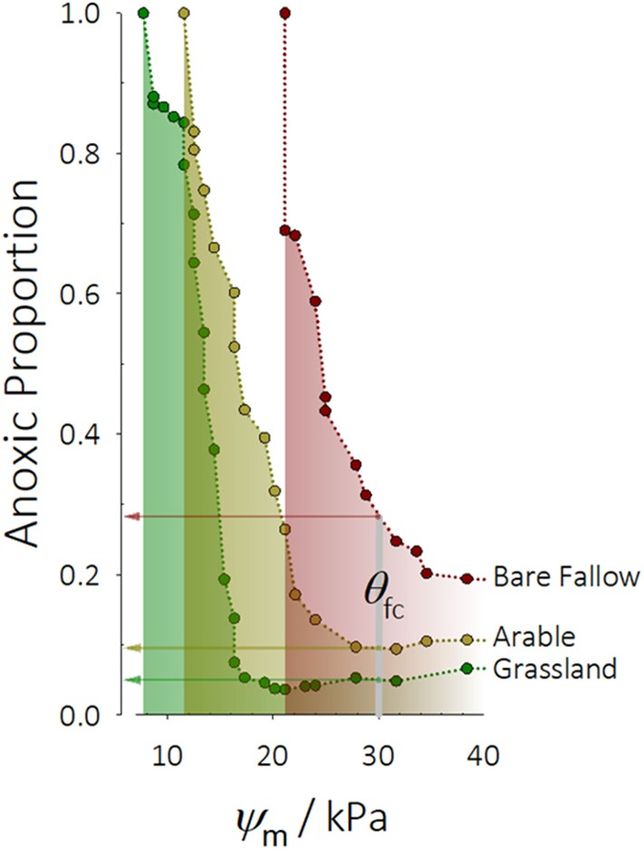
www.nature.com/scientificreports/
Figure 1. Grassland soils generate connected pore space more rapidly than arable soils. Degraded soil
(managed as bare fallow since 1959) developed greater connected micro-porosity following conversion in 2008
to grassland than bare fallow soil converted to arable. The mean and standard error of the mean of connected
porosity measured in soil aggregates collected from soil managed continuously as bare fallow (brown), soil
converted to arable management (dark yellow) and soil converted to grassland (green) over the ten years
following conversion are shown. The dotted line marks the mean connected porosity of continuously managed
bare fallow soil over the entire ten-year period.
Figure 2. Soil process-form relationships reflect biotic organic carbon inputs and turnover. The connected
pore space in degraded soils converted after 49 years of bare fallow management to either arable or grassland
increases in association with the net input of organic carbon (Corg). Soils managed continuously as either arable
(for 66 years) or grassland (for > 175 years) which have each accumulated over 100 Mg ha−1 of Corg over their
history follow this trend. The relationship is described by an asymptotic function; the resulting fit (solid line) is
shown, together with the upper and lower 95% confidence intervals of the fit (dotted lines). R2 = 0.85.
highest Corg input and connected porosity, respectively. Modelled Corg inputs and measured connected porosity
for soils converted to both arable and grassland for each of the ten years between 2008 and 2018 is distributed
between the consistently managed bare fallow and arable soils data. We assumed that C org in soils managed as
grassland since 1838 represented the maximum which could be stored; this and the Akaike information crite-
rion was used to guide selection of a sigmoidal function. There was a clear non-linear relationship between C org
inputs to soil and connected porosity, with all converted and continuously managed soils following the same
trend (Fig. 2). This establishes that process-form relationships can be explained in terms associated with biotic
Corg inputs and turnover in soil.
Contrasting long‑term soil management results in different process‑form states. Although
the converted soils provided compelling evidence for structural development contemporaneous with the estab-
lishment and development of plant populations (albeit that arable soils are subject to external processes such
as tillage and fertilization), the relatively short time span did not allow comparison of maximal differences in
structural development, or evaluation of the potential for any resulting selective pressures to influence the repre-
sentation of specific genes within the soils. Soils which had been under continuous management, at the time of
sampling, as bare fallow for 52 years, arable for 62 years and mixed grass swards for over 170 years presented an
Scientific Reports | (2020) 10:10649 | https://doi.org/10.1038/s41598-020-67631-0 3
Vol.:(0123456789)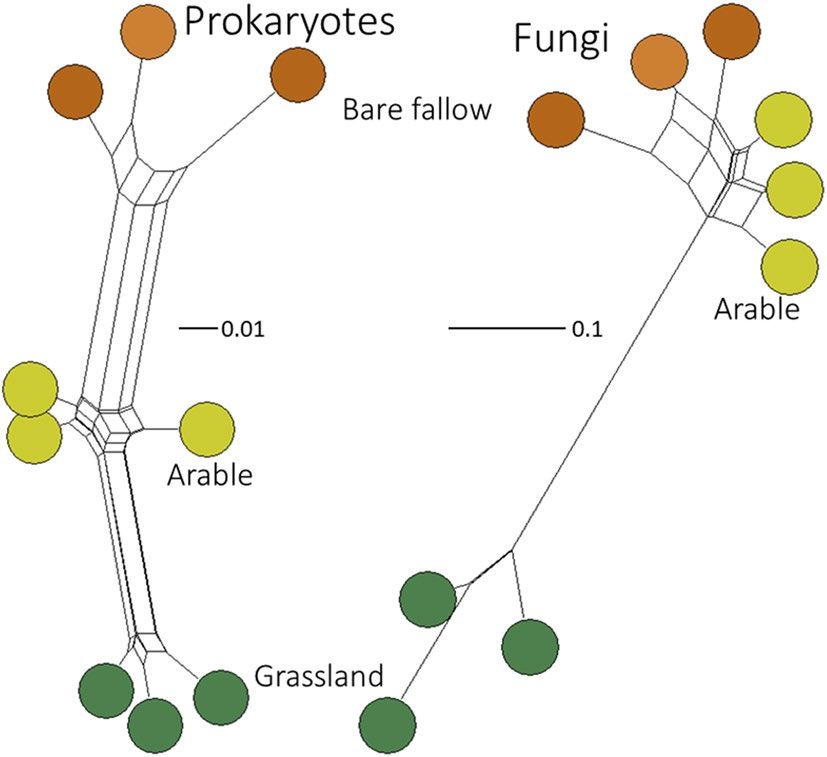
www.nature.com/scientificreports/
Pore surface
Porosity/% Permeability/mm2 Connectivity/µm−3 density/µm2 µm−3 dcrit/µm Pore neck size/µm
Grassland (n = 14) 31.1 ± 1.18 1.13 ± 0.310 − 0.206 ± 0.025 0.088 ± 0.003 9.74 ± 0.37 11.19 ± 0.34
Arable (n = 14) 23.4 ± 1.22 0.62 ± 0.154 − 0.236 ± 0.033 0.092 ± 0.004 7.17 ± 0.26 8.79 ± 0.48
Bare fallow (n = 9) 15.0 ± 2.21 0.55 ± 0.339 − 0.018 ± 0.080 0.059 ± 0.010 3.10 ± 0.76 4.72 ± 0.95
Table 1. Topology-related parameters derived from binary images generated from X-ray computed
tomography of aggregates from Highfield soils. The mean and standard error of each parameter is shown.
opportunity to test the hypothesis that established process-form relationships result in selection of organisms or
genes, the fitness of which is suited to each particular soil biotope.
We have already determined that the continuously managed grassland and arable soils have significantly
greater total porosity, a wider range of pore sizes and greater pore connectivity than continuously managed bare
fallow soil25. Here we extend these findings, generating detailed information concerning pore topology and con-
nectivity since they exert a strong influence upon diffusive flow in porous materials26, and modelling the effect
of the observed pore networks upon diffusion processes within the soils. Euler connectivity functions [χ(d)/V,
see “Methods” section for calculation] for each soil are shown in Supplementary Fig. 1. For connected pores
χ(d)/V < 0, the value is positive for unconnected pores. χ(d)/V = 0 represents a critical threshold diameter (dcrit)
describing the maximum pore throat size of connected pores controlling hydraulic conductivity27. Mean estimates
(± standard error) of dcrit were 9.7 ± 0.37 µm for grassland soils, 7.2 ± 0.26 µm for arable soils, and 3.1 ± 0.76 µm
for bare fallowed soils. There was a significant effect of soil management upon dcrit (F2,6 = 42.3, p < 0.001) and each
mean was significantly different from all others (smallest difference, grassland versus arable, Q = 4.99, p = 0.029).
Topology-related parameters derived from X-ray computed tomography of aggregates (Table 1) showed a consist-
ent trend of greater parameter estimates in grassland soils than degraded bare fallow soils. We chose porosity and
dcrit as measures of pore topology since their implications are readily defined and they are of direct relevance to
cells within the soil matrix because of their influence upon advective and diffusional processes. Porosity meas-
urements from X-ray CT were used to derive diffusion coefficients for solutes within saturated soil aggregates,
relative to unconstrained solute diffusion in water (D/D0, see “Methods” for details). For grassland soils, mean
D/D0 was determined at 0.399 ± 0.014, 0.285 ± 0.009 for arable and 0.161 ± 0.001 for bare fallow. These estimates
were significantly different (F2,70 = 106.4, p < 0.001). Normalised diffusion coefficients for each treatment were
all significantly different from each other (p < 0.001 for all comparisons).
Direct measurement of pore network topology and modelling of the consequences for diffusion demon-
strate that different long-term soil management results in quantitatively different process-form states. We also
used estimates of pore network topology to model the hydrodynamic behaviour of the pore networks under
saturated conditions, estimating hydraulic conductivity as a function of connected porosity. This measures the
dynamical state of the pore space and the maximum potential flow rate at which resources can move through
the networks—effectively the capacity for flux within the soil pore space. Figure 3 shows the combined effects
of soil C org and connected porosity upon the predicted hydraulic conductivity of soils. Combined direct meas-
urements and modelling indicate a power law relationship between connected porosity and conductivity and
that Corg is associated with these changes. Regions of this relationship correspond to the process-form states
of continuously managed bare fallow, arable and grassland soils. The fraction of anoxic volume characterising
each process-form state was estimated using a multi-phase lattice-Boltzmann a pproach28,29, described in detail
in the “Methods” section. The results (Fig. 4) indicate that the predicted anoxic fraction is significantly lower in
grassland soil, compared with arable and bare fallowed soils, the latter is predicted to have the highest fraction
of anoxic volume at all matric potentials (moisture contents).
Microorganisms in each land management-associated process-form state are likely to experience markedly
different hydraulic environments, particularly in degraded bare fallow soils where reduced delivery of dissolved
nutrients and O 2 is predicted compared to grassland soils. This is a direct result of constraints placed upon dif-
fusive flow by reduced connected porosity and dcrit resulting from different biotic Corg inputs and turnover. These
constraints are likely to exert significant selective pressures in soil microbiomes which should be reflected in
changes in the assemblages of organisms or alleles in the different process-form states. To test this hypothesis, we
generated shotgun metagenome sequence datasets from nucleic acids extracted directly from the different soils.
These were analysed to determine whether any observed differences in phylogenetic community assemblages or
in gene abundance were directly attributable to the differences in porosity or dcrit described above.
Process‑form states in soil do not exert selective pressure at the organismal level. Chao-1
lower bound estimates of Prokaryote OTU richness (SChao1) for each land management ranged from 562 to
578 (mean 570) for grassland, 530–547 (mean 540) for arable, and 482–542 (mean 513) for bare fallow soils.
There was a significant effect of soil treatment upon SChao1 (F2,6 = 7.6, p = 0.023), the difference between grassland
and bare fallow mean richness was significant (Q = 5.49, p = 0.019). There was no significant difference between
arable and grassland or arable and bare fallowed soils. Grassland soils also exhibited the largest Fungal OTU
richness, range 35–44 (mean 39) compared to either arable (range 19–27, mean 24) or bare fallowed (range
17–27, mean 23) soils. There was again a significant treatment effect upon SChao1 (F2,6 = 11.8, p = 0.008) and pair-
wise comparison indicated grassland was significantly more rich in fungal OTUs than either arable or bare
fallowed soils (smallest difference, Q = 5.68, p = 0.017), but there was no difference between arable and bare fal-
lowed soils. Weighted UniFrac distance-based comparison of β-diversity (Fig. 5) indicated significant effects of
Scientific Reports | (2020) 10:10649 | https://doi.org/10.1038/s41598-020-67631-0 4
Vol:.(1234567890)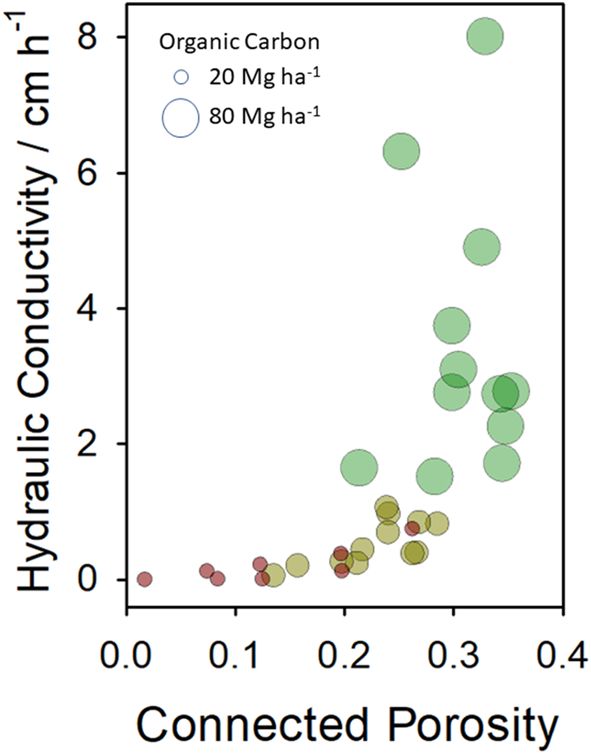
www.nature.com/scientificreports/
Figure 3. Contrasting long-term soil management results in quantitatively different process-form states.
Soils are described by a combination of the connectivity of pore space, established from X-ray connected
porosity (CT) and modelled hydraulic conductivity—a measure of capacity, representing the maximum
potential movement of resources through pore networks to organisms. Grassland soils (green data points)
are characterized as having high pore connectivity and hydraulic conductivity and are associated with the
greatest stocks of Corg. In contrast, degraded bare fallow soils (brown data points) are associated with extremely
limited connected porosity and hydraulic conductivity and the lowest stocks of C org. Arable soil (dark yellow)
is intermediate between these two extremes. Data point size is proportional to C org (Mg ha−1) in each soil, the
extremes of which are shown in the key.
Figure 4. Process-form states control anoxia within soil. Low-Corg, low-connected porosity soil contains
much larger volumes of anoxic microsites than high-Corg, high-connected porosity soil. Across a range of
matric potential (ψm), the predicted volume of anoxic sites is consistently larger in degraded bare fallowed
soil than arable or grassland. At field capacity (θfc), approximately 30% of degraded soil is anoxic, falling to
5% in grassland soil. At 21 kPa degraded soil is completely anoxic while the volume remains between 4–5% in
grassland soil. In arable soil 10% of the soil volume is predicted to be anoxic at θfc—double that in grassland.
soil management upon both prokaryotic (PERMANOVA, pseudo-F2,6 = 15.5, pperm < 0.0001) and fungal (pseudo-
F2,6 = 19.0, pperm = 0.0032) community structures. Prokaryote communities were significantly different between
all three treatments (smallest difference, pseudo-t = 2.9, pMC < 0.0001) but fungal communities in arable and bare
fallowed soils did not differ (pseudo-t = 1.7, pMC = 0.111); both were significantly different from the grassland
community (smallest difference, pseudo-t = 5.0, pMC = 0.0015). Inspection of individual fungal OTU abundance
Scientific Reports | (2020) 10:10649 | https://doi.org/10.1038/s41598-020-67631-0 5
Vol.:(0123456789)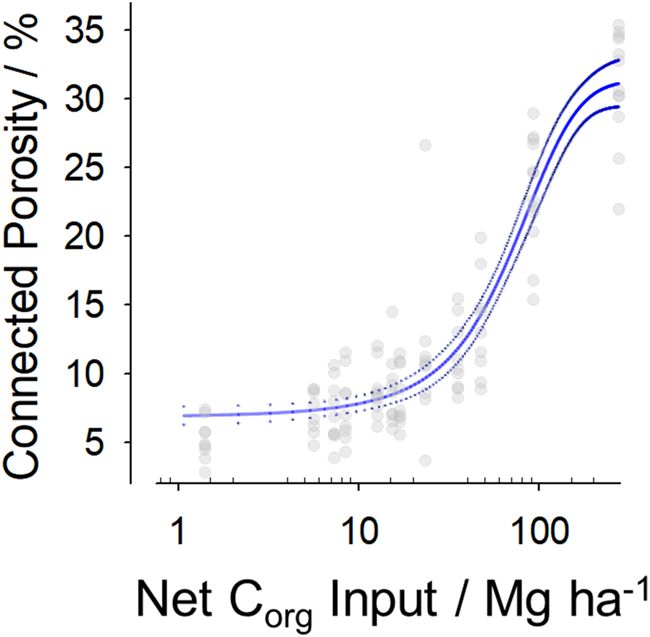
www.nature.com/scientificreports/
Figure 5. Grassland, arable and bare fallowed soil microbial community β-diversity. Neighbour-Net networks
of prokaryotic and fungal community profiles from the three soil managements based on weighted UniFrac
distance. Prokaryotic community assemblages were significantly phylogenetically different between all three
managements; for fungi there was no difference between arable and bare fallow soil assemblages, which were
both significantly different from grassland assemblages.
indicated that this was due to several OTUs, including Rhizophagus irregularis (formerly Glomus intraradices)
and other Glomeromycetes, Agaricomycetidae, Onygenales, Eurotiomycetidae, Aspergillaceae and Atheliaceae,
being abundant in grassland soils but not detected in either arable or bare fallowed soils: arbuscular mycorrhizal
R. irregularis, for example, had a mean abundance in grassland soils of 3.5 × 10⁵, but was not detected in the other
soils. This large, qualitative, difference between the soils is consistent with the effect of soil t illage30,31 upon fungal
communities and cannot be interpreted as a response to selective pressures arising from different process-form
states. Since prokaryotes appeared to be less sensitive to the effects of tillage than fungi, the effects of soil man-
agement upon prokaryotic communities were studied in detail.
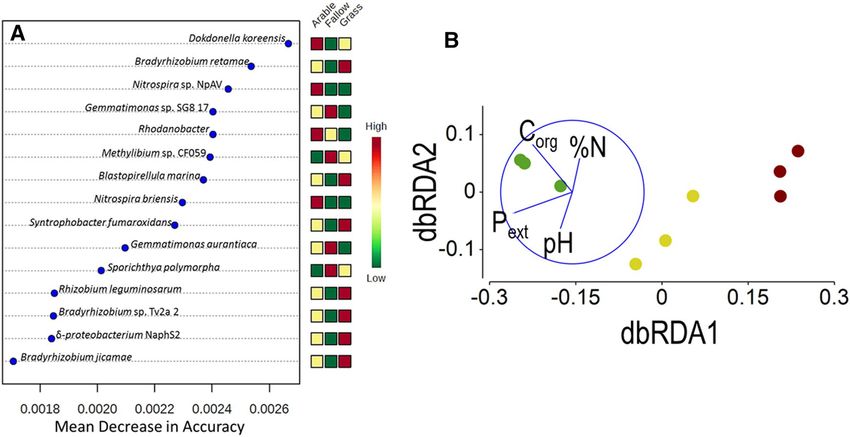
Random Forest machine learning classification of biomarkers (Fig. 6A) indicated prokaryotic communities in
grassland soils were characterized by Rhizobiaceae including Bradyrhizobium spp. and Rhizobium leguminosarum
as well as the planctomycete Blastopirellula. At the other extreme, taxa characteristic of degraded, low input bare
fallow soils were Gemmatimonas spp., an organism related to the aromatic compound degrader Methylibium and
the actinomycete Sporichthya. The influence of nitrogenous fertilization was evident in the organisms identified
as characteristic of arable soils; nitrite-oxidizing Nitrospira spp. were particularly characteristic of these soils
together with the denitrifying Rhodanobacter and Dokdonella koreensis32.
16S rRNA gene-conditional phylogenetic diversity based upon placement of exact sequence variants for
each treatment was compared using Kantorovich-Rubinstein (KR) distance metrics. PERMANOVA identified a
significant effect of treatment (pseudo-F2,6 = 17.9, pperm < 0.0001) and all post hoc comparisons were significantly
different (smallest difference: bare fallow vs. arable, pseudo-t = 3.2, pMC = 0.0018) consistent with the weighted
UniFrac approach described above. Principal coordinates analysis (PCoA) was used to present an unconstrained
view of differences in 16S rRNA gene-conditional microbiome assemblages (Supplementary Fig. 2) using KR
distance. The first two principal coordinates separated treatments clearly, the ordination accounting for 89% of
total variation across the two axes. Distance-based linear modelling (distLM) was used to describe the relation-
ship between the 16S rRNA gene-conditional phylogenetic community structure and edaphic variables shown in
Table 2. All combinations of variables were considered: the most parsimonious model, identified using Bayesian
information criterion (BIC), was a combination of the chemical factors pH, soil Corg, soil organic nitrogen (%N)
and NaOH-EDTA extractable phosphorus (Pext). Distance-based redundancy analysis (dbRDA) indicated the
model accounted for 84% of total variation on the two axes (Fig. 6B). Separation of treatments on dbRDA axis 1
was associated most highly with P ext (r = − 0.81; marginal test, pseudo-F = 7.4, pperm = 0.013) and Corg (r = − 0.53;
marginal test, pseudo-F = 12.2, pperm = 0.0035), both greatest in grassland soils and least in bare fallowed soils. The
second axis was most highly associated with Corg (r = − 0.88) and %N (r = 0.41; marginal test, pseudo-F = 11.3,
pperm = 0.004). Using these four chemical parameters to model the distribution, addition of neither porosity
(sequential test, pseudo-F = 0.7, pperm = 0.565) nor dcrit (sequential test, pseudo-F = 0.5, pperm = 0.691) accounted
for a significant amount of additional variation.
Although there are clear qualitative and phylogenetic differences between prokaryote assemblages associated
with each soil, distLM suggests that these differences are adequately described by chemical edaphic parameters.
They are therefore unlikely to be due to selective pressure arising from the respective process-form states directly.
Instead, assemblage differences are likely to reflect organism traits: for example, Gemmatimonadetes are common
in soil and show adaptation to low soil moisture33, so identification of Gemmatimonas as characteristic of bare
fallow soil is likely to reflect the fact that direct isolation experienced by these soils renders them much drier than
the other soils; nitrogenous fertilization of arable soils is reflected by the organisms identified as characteristic of
Scientific Reports | (2020) 10:10649 | https://doi.org/10.1038/s41598-020-67631-0 6
Vol:.(1234567890)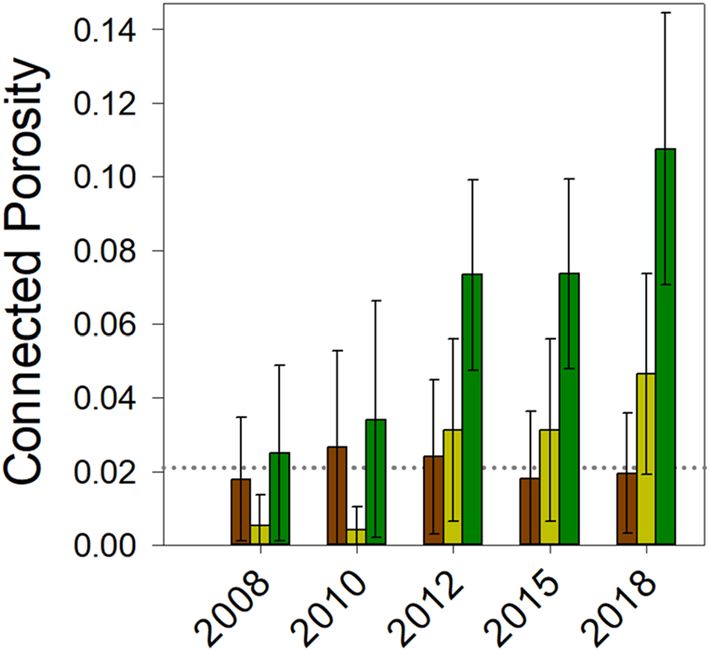
www.nature.com/scientificreports/
Figure 6. Taxonomy- and phylogeny-based community responses to land management. (A) Predictive
modelling using a supervised Random Forest algorithm identified the fifteen OTUs that were most
discriminatory between the different soils, based upon the mean decrease in model accuracy of a leave-one-
out cross-validation procedure. (B) Management-conditional distance-based redundancy analysis (dbRDA) of
chemical edaphic factors and 16S rRNA gene-based assessment of microbiomes associated with the Highfield
Ley-Arable experiment using Kantorovich–Rubinstein phylogenetic distances calculated from placement of
homologous metagenome reads on the 16S rRNA gene reference phylogenetic tree. Data points represent
individual replicate plots of grassland (green), arable (yellow) and bare fallow (brown) soils. Environmental
factors (pH, NaOH-EDTA extractable P [Pext], Corg and % organic N [%N]) were determined by distance-based
linear modelling as the most parsimonious combination of variables to model the multivariate data and are
represented as vectors, increasing in the direction of the vector: vector length indicates the degree of partial
correlation of each environmental variable with the dbRDA axes. The circle has an arbitrary origin and radius
of r = 1. dbRDA axis 1 accounted for 83.95% of variation accounted for by the model (74.71% of total variation)
and dbRDA axis 2 accounted for 9.96% of variation accounted for by the model (8.87% of total variation).
R2 = 0.8899. The corresponding unconstrained PCoA ordination is shown in Supplementary Fig. 2. See text for a
detailed description of the analysis.
NaOH-EDTA extractable
pH (H2O)a/−log(g[H+]L−1) Organic carbona/mg g−1 soil Total nitrogena/µg g−1 soil phosphorusb/µg g−1 soil
Grassland 6.2 ± 0.13 3.72 ± 0.44 340 ± 39.0 661.7 ± 31.3
Arable 5.8 ± 0.11 1.85 ± 0.06 190 ± 5.08 517.0 ± 12.6
Bare fallow 5.3 ± 0.19 1.07 ± 0.10 110 ± 6.71 235.0 ± 3.8
Table 2. Summary of chemical data of Highfield Ley-Arable experiment soils. The mean and standard error of
the mean are shown (n = 3). a Gregory et al.22. b Neal et al.68.
these soils to be either nitrite-oxidisers or denitrifiers; and while identification of Rhizobiaceae as characteristic
of the mixed swards of grassland soils suggests association with legumes—and therefore possibly responsive to
selection pressure exerted by the plant population, Bradyrhizobium spp. in these soils lack genes and gene clusters
for symbiosis and nitrogen fixation34.
Process‑form states in soil exert selective pressure at the level of alleles. A total of 1,197 KEGG
orthologs were identified as having significantly different abundance between the soils (selected orthologs
are presented in detail in Supplementary Figs. 3–7). We adopted a similar approach to analysing the effects of
soil management upon microbiome genetic variation, determined by binning reads to KEGG orthologs, as for
the effect upon community assemblage, described above. Multivariate ortholog analysis was based on Hellinger
distance, calculated from square root-transformed ortholog abundance. PERMANOVA identified a signifi-
cant effect of land use upon ortholog assemblage (pseudo-F2,6 = 26.8, pperm < 0.0001) and all post hoc compari-
sons were significantly different (smallest difference: arable vs. bare fallow, pseudo-t = 3.6, pMC = 0.0006). PCoA
separated each land use, the first two axes accounting for 91% of total variation (Supplementary Fig. 8). The
most parsimonious model identified by distLM and BIC included a combination of both chemical and physi-
cal edaphic variables; namely pH, Corg, %N, porosity and dcrit. dbRDA (Fig. 7) showed clear separation between
Scientific Reports | (2020) 10:10649 | https://doi.org/10.1038/s41598-020-67631-0 7
Vol.:(0123456789)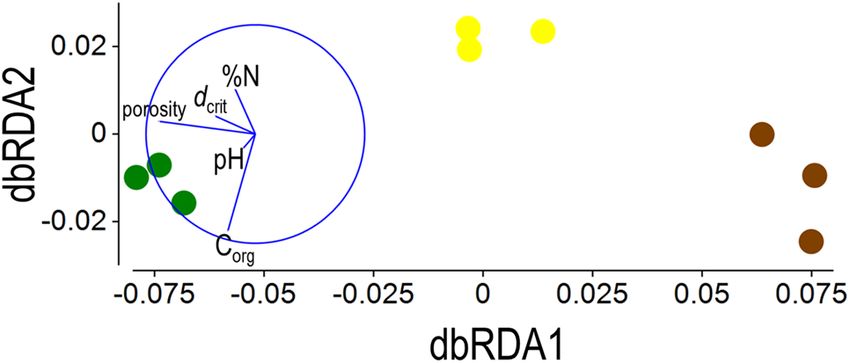
www.nature.com/scientificreports/
Figure 7. Function-based community responses to process-form states. Management-conditional dbRDA of
chemical and physical edaphic factors and function-based assessment of genes associated with the Highfield
Ley-Arable experiment. Square root transformed KEGG ortholog abundances were used to calculate Hellinger
distances between the nine samples. Data points represent individual replicate plots of grassland (green), arable
(yellow) and bare fallow (brown) soils. Environmental factors (pH, C org, % organic N [%N], porosity and dcrit)
were selected by distLM as the most parsimonious combination of variables to model the multivariate data and
are represented as vectors, increasing in the direction of the vector: vector length indicates the degree of partial
correlation of each environmental variable with the dbRDA axes. The circle has an arbitrary origin and radius
of r = 1. dbRDA axis 1 accounted for 88.40% of variation accounted for by the model (83.21% of total variation)
and dbRDA axis 2 accounted for 7.17% of variation accounted for by the model (6.75% of total variation).
R2 = 0.9414. The corresponding PCoA ordination is shown in Supplementary Fig. 8. See text for a detailed
description of the analysis.
the treatments on dbRDA axis 1. The edaphic variables associated most highly with this axis were both physical
parameters; porosity (r = − 0.87; marginal test, pseudo-F = 24.7, pperm = 0.0009) and dcrit (r = − 0.36; marginal test,
pseudo-F = 15.2, pperm = 0.0019). Both variables were greatest in grassland soil and least in bare fallowed soil.
The treatments showed little separation on the second axis. Edaphic variables associated most highly with this
second axis were chemical, Corg (r = − 0.88; marginal test, pseudo-F = 17.3, pperm = 0.0002), %N (r = 0.47; marginal
test, pseudo-F = 0.42, pperm = 0.633) and pH (r = 0.41; marginal test, pseudo-F = 13.9, pperm = 0.0038). Using these
edaphic parameters to model the distribution, addition of Pext (sequential test, pseudo-F = 0.97, pperm = 0.484) did
not account for a significant amount of additional variation.
This analysis presents clear evidence for a large and direct influence of process-form state upon gene assem-
blages. The topological parameters shown to be so influential upon gene distributions are both fundamental
properties of pore networks which we have shown to be sensitive to biotic C org inputs and turnover in soil (Figs. 2,
3). We have also demonstrated that they exert a dominant influence upon hydrodynamic conductance of the
pore network and the potential for anaerobic sites across a range of soil matric potential (Figs. 3, 4). However,
the analysis cannot demonstrate preferential selection of genes dependent upon their fitness within each process-
form state. To test whether the differences in gene abundance could be due to selection pressures arising from
different plant inputs and emergent soil structural properties, we characterised the genes shown to be sensitive to
the different land managements. Consideration of changes in individual gene abundance indicated clear shifts in
both cellular behaviour and metabolic potential (Fig. 8). For cell behaviour, there were a number of genes associ-
ated with protein secretion, among them impB, impD, impE and vgrB associated with bacterial type VI protein
secretion systems, hylB and hylD associated with type I protein secretion systems and the autotransporter gene
misL: all typify bacterial-bacterial and bacterial-Eukaryotic interactions and were more abundant in grassland
soils. Genes associated with type II protein secretion systems (T2SS) were more abundant in arable and bare
fallow soils, suggesting a greater reliance upon exoenzymes in these soils. Consistent with this latter observation,
several genes coding for exoenzymes were more abundant in these soils, including abnA (glucosyl hydrolase [GH]
family 43 endo-arabinanase), chiE (GH family 18 chitinase) and chiF and chiG (both GH family 19 chitinases)
associated with carbohydrate metabolism, and dmsA and dmsB (dimethyl sulfoxide reductase) associated with
sulfur metabolism. Genes coding for chemotaxis and twitching motility were also more abundant in arable, and
particularly bare fallowed soils compared to grassland soil.
The increase in abundance of dmsAB was also part of a general trend of an increase in genes associated with
dissimilatory anaerobic metabolism of nitrogen and sulfur in arable and bare fallowed soils combined with
reductions in genes associated with assimilatory pathways. Nitrification-associated genes were most abundant
in arable soils, and genes associated with dissimilatory reduction of nitrate and sulfate most abundant in bare
fallowed soils. There was also an increase in genes associated with anaerobic degradation of aromatic compounds
in arable and bare fallowed soil. Transport pathways also differed between land use with genes associated with
ATP-binding cassette (ABC) transporter pathways of glycerol and urea being most abundant in grassland soil
and least abundant in bare fallowed soil, while genes associated with the ABC transport pathway for glutathione
and the N-acetylglucosamine phosphotransferase pathway exhibited the opposite trend.
These genetic shifts were related to nutrient status and, saliently, changes in soil structure (in this case pore
topology) controlling gaseous and nutrient diffusion. They present direct evidence for genetic selection of genes
and pathways based upon fitness under the different process-form states. The increase in genes associated with
less efficient anaerobic processes in arable and bare fallowed soil can be considered a response to reduced diffu-
sion of O 2 in these progressively more poorly connected pore networks. Other responses, such as the increase
Scientific Reports | (2020) 10:10649 | https://doi.org/10.1038/s41598-020-67631-0 8
Vol:.(1234567890)www.nature.com/scientificreports/
Figure 8. Schematic representation of the relative abundance of genes for which significant differences between
process-form states was determined. The central column indicates the general trend in relative abundance for
genes grouped according to specific functions. Grassland gene abundance is represented as green points, arable
gene abundance as yellow points and bare fallow gene abundance as brown points: each specific function is
described in the left-hand column; specific functions are organized into higher-level KEGG ontologies, shown
in the right-hand column. Absolute abundances for each gene and associated significance (p) and positive false
discovery rate (q) of the difference in abundance between the three treatments are shown in Supplementary
Figs. 3–7.
in gene abundance for chemotaxis and protein secretion, may also be responses to reduced diffusion of soluble
nutrients, and hence a requirement to search out nutrients, or avoidance of anaerobic niches within the soil.
Microbial community structure is often considered as a balance of cooperative behaviours between individuals,
mediated by “public goods” or soluble nutrients arising from leaky processes (nutrients which are lost through
the outer membrane or released by cell lysis) or the activity of exoenzymes35,36. Producers of public goods support
populations of “cheaters” which exploit goods without contributing to them. In well-mixed systems, cheaters
maintain a competitive advantage over producers, but this advantage is lost in structured environments where
diffusive constraints are manifest37. In this context, the increase of T2SS and arabinanase and chitinase exoen-
zyme genes in arable and bare fallowed soils may be a response to both qualitative changes to organic inputs,
and reduced delivery of soluble nutrients by advective flow and diffusion to cheaters, and thus an increase in
abundance of producer organisms. Additionally, the reduced diffusive processes predicted for arable and particu-
larly bare fallowed soil may result in an increased efficiency of exoenzymes since reduced diffusion allows for a
greater accumulation of product near producer organisms38. Thus, production of exoenzymes, and cell motility
as a searching or avoidance behaviour provide adaptations in response to spatially constrained circumstances
arising from reduced pore connectivity as a result of reduced C org inputs in arable and bare fallowed soils.
Discussion
We have presented data consistent with the conditions which should be met if soil is an extended composite
microbial phenotype: the emergent physical states are organised at several orders of magnitude above the scale of
individual microbes; different physical states are associated with different genetic states at the level of individual
alleles rather than organisms. The data also demonstrates that both physical and biotic states of the system can
be manipulated by nutritional interventions, particularly relating to the flux of energy through the system.
The data do not prove the associations are causal, however comparison with simpler systems that are ame-
nable to deeper theoretical analysis and direct manipulation provides additional evidence of a causal feedback
between allelic abundance, process and form. Specifically, the soil-microbe system exhibits behaviour seen in
physical systems that display spontaneous (and endogenously driven) emergence of large-scale self-organisation
as a result of such feedback. In a subset of such systems, there is a critical point at which the state of the system
changes discontinuously (a phase transition) with continuous change in one of the system parameters. The rate
of change of the system with respect to that parameter is characterised by a power law close to the phase transi-
tion, reflecting the emergence of coherence across a wide range of scales (often referred to as fractal scaling). In
Fig. 3 we observe such behaviour between connected porosity and hydraulic conductivity. The state of the soil
system changes from one with a disconnected pore space to one with a connected pore space where Corg (energy)
flux is a critical parameter. There is a power law relation between conductivity and porosity, consistent with the
emergence of large-scale spatial coherence in soil structure at a critical value of Corg flux. In this sense, soil dis-
plays many of the properties of self-organising s ystems39. Results presented here provide further evidence for a
Scientific Reports | (2020) 10:10649 | https://doi.org/10.1038/s41598-020-67631-0 9
Vol.:(0123456789)www.nature.com/scientificreports/
causal feedback between allelic abundance, process and form. We have previously posited a mechanism for this
in soil and shown how soils with and without plants are capable of spontaneously generating emergent structures
at important s cales6 compared with sterile soils, which do not. This interpretation predicts that soils which are
more self-organising will be more metabolically active in any given situation than a soil where the interaction
between biological process and form is weak or non-existent. We see that, after a minimum of 52 years, each
soil in our study is a different expression of its multiple biotic components; a phenomenon termed an extended
composite phenotype12.
With plants present, such as land managed as long-term mixed grass sward, the extended composite phe-
notype has an increased capacity to store water and soluble nutrients, a property which may confer a degree of
resilience to the soil–plant–microbe system during periods of low rainfall or nutritional inputs. Independent
analysis of these same soils has demonstrated greater water storage capacity in the grassland s oil40. In addition,
the more extensive and more connected pore network selects for assimilatory, and against dissimilatory, processes
by permitting greater flux of O2 through the system: it thus improves the efficiency of metabolic processes and
Corg conversion into biomass while reducing potential losses of plant nutrients arising from leaching or emis-
sion to the atmosphere. Thus, the extended phenotype interacts with plants to increase the flux, resilience and
efficiency of nutrient transport to plants (including water).
The finding that soil under grassland management has significantly higher capacity, efficiency and resilience
compared with arable or bare fallowed management is associated with greater C org inputs and turnover. Further-
more, the rate of recovery of degraded soil is also linked to stocks and flows of Corg (Fig. 1). Our experiments
cannot distinguish between C org flux or storage as the dominant mechanism supporting improved soil function.
However, interpreting results in terms of soil remodelling through self-organizing processes, we predict that
the biophysical state of soil and rate of change of that state will both be related to cumulative metabolic activity.
Our data are consistent with recovery rate being limited by cumulative soil metabolism: soil Corg content acts
as a diagnostic for this. This raises the important questions of what limits soil metabolism and incorporation of
Corg in s oil41, and how it can be manipulated in each context to maximise the rate of soil recovery. We know both
anaerobic niches and physical dislocation of microbes from resources result from low pore connectivity, and both
significantly limit microbial metabolism. We also know soil recovery is associated with more voluminous and
better-connected pore space and significantly lower levels of anaerobic respiration. We speculate that the rate-
limiting factor in recovery of degraded soil is the process of microbially-mediated micro-structure remodelling,
and that this is soil texture dependent25. Sandy-textured soil would be less able to recover compared to soils with
higher fractions of silt and clay, where remodelling fine-scale structure is inherently more feasible due to a greater
proportion of “raw materials” to enable such fine-scale architecture to be manifest. It is also likely to be dependent
on the quality and quantity of organic inputs to soil, especially in relation to the latent energy contained in them.
This is apparent in our data, though we are not able to distinguish the relative importance of each.
Tillage is known to contribute to decreases in soil C org, and the most effective recovery rate and highest
metabolizing end-state in our data was achieved with management under grassland without tillage. Tillage has
the effect of significantly changing the distribution of microenvironments in soil through increased aeration and
exposure of previously physically protected prey organisms and soil Corg. This results in the immediate release of
physical and chemical constraints on metabolism and therefore to loss of soil C org. More importantly, rearrange-
ment of microenvironments—i.e. within and between soil macro- and micro-aggregates—will have the effect
of “re-setting” microbial remodelling of soil microarchitecture, slowing down establishment of connected pore
space and longer-term cumulative metabolism.
This new interpretation of the role of nutritional and physical management of soil is a step towards a more
general theory of soil. Such a theory is needed as a framework upon which to synthesize data and knowledge
on biological, chemical and physical properties of soil that are typically studied in isolation. Theory leading to
quantitative prediction is also essential in seeking synergistic interventions that recognise the interplay between
capacity, efficiency and resilience of soil, and to avoid the unintended consequences of land management that
are directing us towards systemic collapse of productive land and an amenable climate.
Methods
Soils. We analysed soil from plots of the Rothamsted Highfield Ley-Arable field experiment (00:21:48° W,
51:48:18° N) set on soil that has been under permanent grass since at least 1838. The soil is a silty clay loam (25%
clay: 62% silt: 13% sand) (Chromic Luvisol according to FAO criteria). In 2008, plots of severely degraded soil
managed as bare fallow by regular tillage to remove any plants since 1959, were converted to arable and grass-
land managements. Arable soil was placed under continuous wheat rotation (winter wheat, Triticum aestivum
L., currently cv. “Hereward” seed coated with Redigo Deter combination insecticide/fungicide treatment, Bayer
CropScience) receiving ammonium nitrate fertilization to provide approximately 220 kg-N ha−1 annum−1, and
additional 250 kg-K ha−1 and 65 kg-P ha−1 every three years, and grassland plots were maintained as a managed
sward of mixed grasses and forbs. Plots were sampled annually, and soil was air-dried and sieved (< 2 mm) before
being archived. To follow the development of soil structure in these soils, soil aggregates from continuous bare
fallow, bare fallow converted to arable and bare fallow converted to grassland were selected for the years 2008,
2010, 2012, 2015 and 2018. In addition, we also sampled plots which had been managed consistently as bare fal-
low for fifty-two years, arable for sixty-two years or mixed grass swards since 1838. Physical and biological data
has already been reported for these consistently managed soils (Table 1). Over these periods, the bare fallowed
soils have become depleted in more labile organic carbon and enriched in persistent organic carbon42 and soil
organic carbon has been reduced to a greater extent than in arable soil. There has also been an observable pro-
gressive shift, from grassland to arable and bare fallowed soil, in the distribution of organic carbon between dif-
ferent pools in the three soil managements, particularly a relative decline in discrete organic particles independ-
Scientific Reports | (2020) 10:10649 | https://doi.org/10.1038/s41598-020-67631-0 10
Vol:.(1234567890)www.nature.com/scientificreports/
ent of stable soil aggregates, and a corresponding increase in the proportion of organic particles encapsulated
in stable aggregates23. Confirmation of this apparent shift in soil structure has been provided by high-resolution
X-ray Computed Tomography25.
X‑ray computed tomography and image analysis. We generated X-ray Computed Tomography (CT)
images at 1.5 µm resolution and scales relevant to microbes (100–102 µm), requiring imaging of 0.7–2.0 mm
diameter soil aggregates. The connectivity of pores within networks was assessed from binary images derived
from X-ray CT using Minkowski functions27, basic geometric measures defined for binary structures. Aggre-
gates were selected at random from soil collected from each plot of the Highfield experiment. Each was scanned
using a Phoenix Nanotom system (GE Measurement and Control solution, Wunstorf, Germany) operated at
90 kV and a current of 65 µA. Initial image analysis was performed using Image-J. Images were threshold-
adjusted using the bin bi-level approach of Vogel et al.27 using QuantIm version 4.01 (https://www.quantim.ufz.
de/). Porosity and mean pore neck size were estimated directly from the threshold-adjusted binary images and
Minkowski functions including Euler number—χ(d), pore size distribution, pore connectivity and surface area
density were determined according to Vogel et al.27. χ(d) is a well-defined characteristic related to pore space
topology and shown to be critical to hydraulic properties43. In three dimensions, χ(d) is defined as the number
of isolated pores (of diameter, d) minus the number of redundant connections within the pore space, plus the
number of enclosed pores44. Using this approach, we estimated Euler number density—χ(d)/V, where V rep-
resents the image volume—of the pore network of aggregates from each continuously managed Highfield soil.
Calculation of diffusion in soil pore networks. The hierarchical soil structures revealed in X-ray CT
images indicate that gaseous O2 in the atmosphere moves into soil primarily through its inter-aggregate pores
and is then dissolved in water prior to moving into the aggregates largely by molecular diffusion. Since gase-
ous O2 diffuses up to 103-fold more quickly than O2 dissolved in water, microbial community activity is thus
constrained mainly by O2 diffusion within aggregates. The ability of aggregates to conduct dissolved O2 and
other soluble substrates depends on the intra-aggregate pore geometry, and we quantified it with effective diffu-
sion coefficients calculated directly by mimicking solute movement through the pore geometry using numerical
simulations. The movement of solutes, including O2 and substrates, within the pore geometry is assumed to be
diffusion dominated. For the images illustrated in Supplementary Fig. 9, the temporal change in solute concen-
tration inside any pore voxel can be calculated using the finite volume approach, as follows:
cot+δt − cot
= qw + qe + qs + qn + qu + qd ,
δt
D(cwt+δt − cot+δt ) if voxel w is pore D(cet+δt − cot+δt ) if voxel e is pore
qw = , qe =
0, if voxel w is solid 0, if voxel e is solid
(1)
D(cnt+δt − cot+δt ) if voxel s is pore D(cst+δt − cot+δt ) if voxel n is pore
qs = , qn =
0, if voxel s is solid 0, if voxel n is solid
t+δt
t+δt t+δt t+δt
D(cu − co ) if voxel u is pore
D(cd − co ) if voxel d is pore
qd = , qu = ,
0, if voxel d is solid 0, if voxel u is solid
where c is concentration, q is diffusive flux, D is molecular diffusion of the solute in liquid water, superscripts
t and t + δt represent time, δt is a time increment, subscript o represents the pore voxel being calculated, and
subscripts w, e, s, n, u and d represents the face-to-face neighbours of voxel o on the west, east, south, north, top
and bottom sides respectively. Applying Eq. (1) to all pore voxels leads to linear systems which was solved by the
bi-conjugate gradient stabilized m ethod45.
Calculation of diffusion coefficients. To calculate the effective diffusion coefficient of each aggregate,
we applied a constant concentration C1 on the top and a constant concentration Co on the bottom of the image,
and then simulated solute diffusion to steady state. The diffusive flux in the three directions in each pore voxel
was calculated by Eq. 1. Taking the vertical direction as the z direction for the image, the effective diffusion coef-
ficient of the image was calculated as follows:
Lz N
i=1 qz (xi )
Deff = , (2)
N(C1 − C0 )
where Deff is the effective diffusion coefficient, N is the total number of pore voxels in the simulated images,
qz (xi ) is the vertical diffusive flux in pore voxel centred at location xi, Lz is the height of the image as shown in
Supplementary Fig. 9. To address the impact of change in pore geometry due to management on the ability of
the aggregate to diffuse solute, in result analysis we normalized the effective diffusion coefficient Deff of all solutes
by their associated molecular diffusion coefficient in non-constrained water, D.
Modelling of oxygen diffusion and anoxia. The impact of soil structure on O2 diffusion and its subse-
quent consumption by microbes under various saturations was studied using pore-scale simulations. We first
calculated the spatial distribution and connectedness of different pores and then determined water distributions
in pores under different matric potentials (ψm). We assumed the soil was initially saturated and then applied a
negative pressure p at the bottom to drain water. We assumed the soil was essentially hydrophilic in that only
pores whose associated capillary pressure pc, calculated by pc = σ/r with σ being water–air surface tension, is
Scientific Reports | (2020) 10:10649 | https://doi.org/10.1038/s41598-020-67631-0 11
Vol.:(0123456789)You can also read