Organismal Biology A Journal of the Society for Integrative and Comparative Biology - Oxford University Press
←
→
Page content transcription
If your browser does not render page correctly, please read the page content below
Downloaded from https://academic.oup.com/iob/article/3/1/obab011/6276991 by guest on 10 October 2021
 Integrative
Organismal
       Biology   A Journal of the Society
                 for Integrative and
                 Comparative Biology

                 academic.oup.com/icb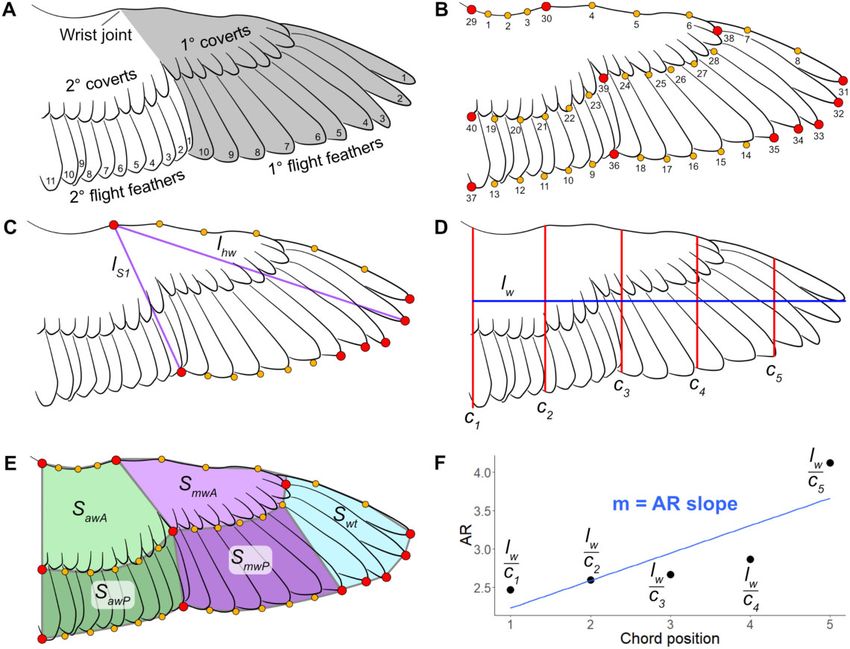
Integrative Organismal Biology
               Integrative Organismal Biology, pp. 1–20
               doi:10.1093/iob/obab011                                            A Journal of the Society for Integrative and Comparative Biology

RESEARCH ARTICLE

Wing Shape in Waterbirds: Morphometric Patterns Associated with
Behavior, Habitat, Migration, and Phylogenetic Convergence
Stephanie L. Baumgart                    ,*1 Paul C. Sereno*,† and Mark W. Westneat*,†

                                                                                                                                                     Downloaded from https://academic.oup.com/iob/article/3/1/obab011/6276991 by guest on 10 October 2021
*Department of Organismal Biology and Anatomy, University of Chicago, 1027 E, 57th St, Chicago, IL 60637, USA;
†
  Committee on Evolutionary Biology, University of Chicago, 1027 E, 57th St, Chicago, IL 60637, USA
1
    E-mail: slbaumgart@uchicago.edu

 Synopsis Wing shape plays a critical role in flight function          Resume La forme de l’aile joue un rôle essentiel dans le
in birds and other powered fliers and has been shown to be             vol chez les oiseaux et les autres animaux presentant un
correlated with flight performance, migratory distance, and            vol actif. Il a ete demontre que cette dernière est correlee
the biomechanics of generating lift during flight. Avian               aux performances de vol, a la distance de migration et a la
wing shape and flight mechanics have also been shown                   biomecanique generant de la portance pendant le vol. La
to be associated with general foraging behavior and hab-               forme de l’aile et la mecanique du vol chez les oiseaux
itat choice. We aim to determine if wing shape in water-               sont egalement associees au comportement alimentaire et
birds, a functionally and ecologically diverse assemblage              au choix de l’habitat. Notre objectif est de determiner si la
united by their coastal and aquatic habitats, is correlated            forme de l’aile chez les oiseaux aquatiques, un assemblage
with various functional and ecological traits. We applied              fonctionnellement et ecologiquement diversifie uni par
geometric morphometric approaches to the spread wings                  leurs habitats côtiers, est correlee a divers traits fonction-
of a selection of waterbirds to search for evolutionary                nels et ecologiques. Nous nous sommes appuyes sur des
patterns between wing shape and foraging behavior, hab-                techniques de morphometrie geometrique appliquees aux
itat, and migratory patterns. We found strong evidence of              ailes deployees d’une selection d’oiseaux aquatiques afin
convergent evolution of high and low aspect ratio wing                 de mettre en evidence un lien evolutif entre la forme des
shapes in multiple clades. Foraging behavior also consis-              ailes, le comportement alimentaire, l’habitat et les mouve-
tently exhibits strong evolutionary correlations with wing             ments migratoires. Nous avons trouve des preuves con-
shape. Habitat, migration, and flight style, in contrast, do           crètes de l’evolution convergente des formes d’ailes a fort
not exhibit significant correlation with wing shape in                 et faible allongements dans plusieurs clades. Le comporte-
waterbirds. Although wing shape is critical to aerial flight           ment alimentaire presente egalement de fortes correlations
function, its relationship to habitat and periodic locomo-            evolutives avec la forme des ailes. L’habitat, la migration
tor demands such as migration is complex.                              et le style de vol, en revanche, ne presentent pas de
                                                                       correlation significative avec la forme de l’aile chez les
                                                                       oiseaux aquatiques. Bien que la forme de l’aile soit essen-
                                                                       tielle au vol, sa relation avec l’habitat et les exigences
                                                                       locomotrices periodiques telles que la migration reste
                                                                       complexe.
Introduction                                                          between wing shape and aerodynamic function has
Wing shape has long been known to exhibit a strong                    also been found in every group of aerial or aquatic
correlation with a generalized description of aerody-                 powered fliers, including cephalopods, insects, fishes,
namic performance: long, narrow wings (high aspect                    pterosaurs, and bats, and has often been applied to
ratio [AR]) characterize large-bodied gliding and                     airfoil design in mechanized flight (Da Vinci 1505;
soaring organisms, whereas short, broad wings (low                    Norberg 1990, 1995; Hansen 2003; Lentink and
AR) characterize smaller-bodied organisms with                        Biewener 2010; Martin-Silverstone et al. 2020).
more maneuverable flight (Norberg 1990; Tobalske                      Despite the extensive body of work on bird flight
2007; Alexander 2015). This general correlation                       and wing shape, we are only beginning to

ß The Author(s) 2021. Published by Oxford University Press on behalf of the Society for Integrative and Comparative Biology.
All rights reserved. For permissions please email: journals.permissions@oup.com.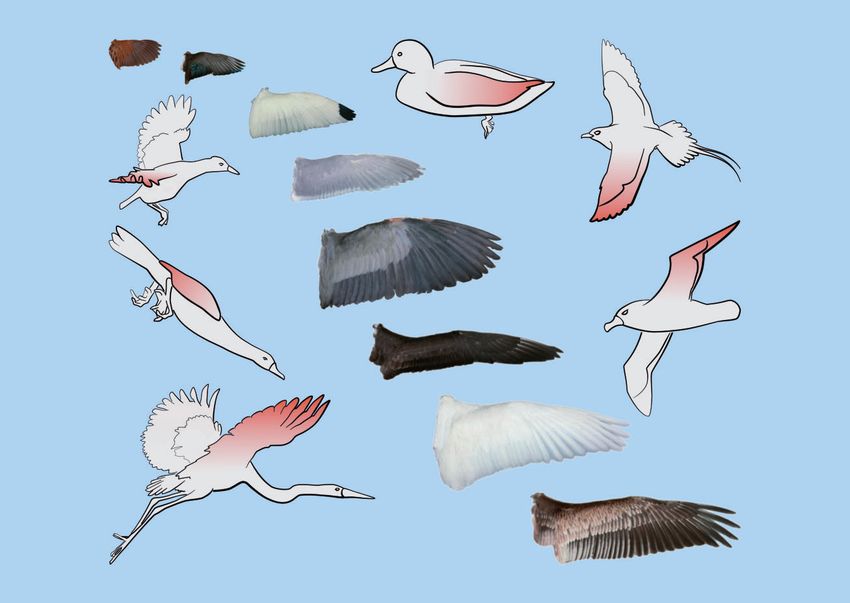
2                                                                                               S. L. Baumgart et al.

understand the complexity of biological wings, the        waterbirds may yield unexpected insights in the re-
relationship between their form and their function,       lationship between structure and function.
and their evolutionary history.                              We began with the hypothesis that using
    Previous work has shown a strong relationship         landmark-based geometric, rather than simple linear,
between avian wing shape and various aspects of           morphometrics to capture waterbird wing shape
flight function. AR has a significant relationship        would yield clearer relationships to important eco-
with maneuverability, rapid takeoff, and efficient        logical traits. And given that no single variable fully
gliding (Hartman 1961; Greenewalt 1975; Norberg           captures the complexity of avian lifestyle, we tested
1990). Wingtip shape has proven to be significant         several: flight style, foraging behavior, habitat, migra-
with regards to dispersal ability, takeoff, and flight    tory status, and migratory status categorized by geo-
performance, and relative migration distance within       graphic location. Flight style has previously been
species or between closely related species (Mulvihill     used to describe the wingbeat pattern used in hori-

                                                                                                                        Downloaded from https://academic.oup.com/iob/article/3/1/obab011/6276991 by guest on 10 October 2021
and Chandler 1990; Lockwood et al. 1998; Combes           zontal flight, that is, frequent flapping versus gliding
and Daniel 2001; Swaddle and Lockwood 2003;               (Viscor and Fuster 1987). Foraging behavior better
Brewer and Hertel 2007; Claramunt et al. 2012;            captures the range of different behaviors that may
Minias et al. 2015). Wang and Clarke (2014, 2015)         require more or less agility, for example, plunge div-
discovered that wing bone shape and wing outlines         ing versus dabbling. Habitat categories often reflect
have a strong phylogenetic signal when examined in        differences in air currents or foliage density, which
an evolutionary context; wing shape was more              again would draw upon wing function. Finally, mi-
closely associated with clade membership than flight      gration variables are used here to capture how much
style. In addition, recent work across birds has linked   a bird requires long distance migratory flights, and
wing length and beak morphology to feeding behav-         determine whether long migratory distances over
iors and ecological habitats (Pigot et al. 2020). These   land rather than ocean results in any wing shape
large-scale analyses show convergence as a common         differences.
evolutionary pattern across birds, underscoring the          Our central aim is to explore the relation between
need to carefully assess avian morphological traits       wing metrics and a variety of ecological variables
against the phylogenetic and ecologic background          waterbirds, which exhibit diverse behaviors in a
of birds selected for the study.
                                                          range of habitats. We test the hypothesis that wing
    Waterbirds comprise a diverse assemblage for ex-
                                                          shape and foraging behavior are strongly correlated
ploring patterns of morphological and ecological di-
                                                          (Webb 1984; Higham 2007) and test the strength of
versity. They include water-adapted species from 3
                                                          the correlation between wing shape indices and mi-
clades: Aequiornithines (diving birds, wading birds,
                                                          gratory patterns. Using geometric morphometric
and shorebirds), Gruiformes (containing rails and
                                                          data in the context of a well-resolved phylogeny
cranes), and Anseriformes (ducks and geese) (Prum
                                                          (Hackett et al. 2008; Jetz et al. 2012), we also exam-
et al. 2015). With sufficient ornithological interest
                                                          ine biomechanical traits such as the distribution of
for their own focus group (e.g., Waterbird Society),
                                                          wing area (WA), wing loading (WL), and wing AR.
waterbirds have been subject to extensive research
including recent exploration of the genetic basis un-     Finally, we look anew at phylogenetic convergence of
derlying interdigital webbing in their feet (Tokita et    wing shape in the light of an integrated phylomor-
al. 2020). Waterbirds, known conclusively now to be       phospace and comparative approach.
representatives of at least 3 phylogenetic assemblages,   Materials and methods
are nonetheless united ecologically by their proximity
                                                          Specimen selection, phylogeny, and ecological data
to, and dependence on, aquatic or nearshore habitats
                                                          sources
that has led to convergence in morphology, trophic
strategy, and locomotor behavior. Recent work             We analyzed wing images for 136 species of water-
shows that waterbird wing shapes are diverse, occu-       birds from 8 clades to search for correlation with
pying roughly half of total avian wing shape space        ecological or behavioral traits (Supplementary Table
(Wang and Clarke 2014, 2015). These studies, among        S1). A diversity of wing shapes is represented (Fig.
the first to analyze avian wing shape within phylo-       1). Penguins are excluded because their wing feather
genetic context, demonstrated that some traditional,      morphology is too divergent for many of the meas-
functional, and ecological variables showed little cor-   urements in this study (e.g., no clear distinction be-
relation with wing shape. This result runs counter to     tween primary, secondary, and covert feathers) and
the idea that form and function are correlated. Thus,     because previous work has shown their wing outlines
exploration of wing shape among the diversity of          differ markedly from that of other birds (Wang and
Avian wing morphology and ecology                                                                                                    3

                                                                                                                                         Downloaded from https://academic.oup.com/iob/article/3/1/obab011/6276991 by guest on 10 October 2021
Fig. 1 Waterbird wing shapes across the phylogeny with color-labeled clades: A, Anseriformes; C, Charadriiformes; P,
Podicipediformes; Gr, Gruiformes; G, Gaviiformes; Pr, Procellariiformes; S, Suliformes; Pe, Pelecaniformes. Images reproduced with
permission from the Puget Sound Wing and Tail Image Collection and the Burke Museum of Natural History and Culture.

Clarke 2015). Included species all are documented by                tree was created from these 1000 trees with median
an adult wing (dorsal view) in the Wing and Tail                    node heights using TreeAnnotator from BEAST
Image Collection of the University of Puget Sound’s                 (Drummond and Rambaut 2007). The resulting
Slater Museum of Natural History (2011). All in-                    tree contained a single negative branch length, which
cluded wing images are preserved in the standard                    was converted to a branch length of 0.01. The tree
“spread wing” position.                                             was imported into R and pruned to our species with
   Our phylogeny follows Pigot et al. (2020) in the                 the drop.tip() function in the ape package (Paradis
use of the avian molecular tree of Jetz et al. (2012),              and Schliep 2019) for subsequent use in phylogenetic
the latter based on the earlier phylogenetic tree of                analyses.
Hackett et al. (2008). One thousand full molecular                     We scored our sample of 136 waterbirds for body
trees from the Hackett Sequenced Series were down-                  mass, phylogenetic relationships, and a suite of eco-
loaded from BirdTree.org. A maximum credibility                     logical traits including foraging behavior, habitat,
4                                                                                                 S. L. Baumgart et al.

and migration. For body mass, we accessed data in          package StereoMorph (Olsen and Westneat 2015;
Dunning (2007). We gathered ecological trait data          Olsen and Haber 2017) was used to digitize the
from various traditional and recent compilations.          images. Homologous landmarks (Fig. 2B, larger red
“Flight style” came from Viscor and Fuster (1987)          circles) include the anteroproximal point (approxi-
with species in our analysis coded according to their      mate location of the humeral head), the anterior-
clade-level assignments. “Foraging behavior” was           most part of the wrist, the distal tips of the first 5
adapted from the “All About Birds” website                 primary flight feathers, the division between primary
(Cornell Lab of Ornithology 2015), The Birder’s            and secondary flight feathers, the last secondary
Handbook (Ehrlich et al. 1988), and the Animal             flight feather, the distalmost primary greater covert
Diversity Web (Myers et al. 2020) (see                     tip, the division between the primary and secondary
“Terminology” in Supplementary text for the list of        greater coverts, and the last secondary greater covert.
terms). All terms were taken from the Cornell Lab of       Six curves of sliding semi-landmarks (Fig. 2B,

                                                                                                                          Downloaded from https://academic.oup.com/iob/article/3/1/obab011/6276991 by guest on 10 October 2021
Ornithology, except “aerial hunter,” which we use          smaller yellow circles) were created at the anterior
here to describe birds that hunt on the wing.              edge of the wing (humeral head to wrist, wrist to
Jaegers and frigatebirds, for example, prey on other       distal tip of first primary flight feather), the posterior
birds in flight, and petrels often catch food on the       edge of the flight feathers (tip of fifth primary flight
wing rather than diving (Cornell Lab of Ornithology        feather to tip of last primary flight feather and tip of
2015). In both of these cases, significant time is spent   last primary flight feather to tip of last secondary
in the air to catch prey. “Foraging niche” was de-         flight feather), and the posterior edge of the greater
fined and logged following Pigot et al. (2020). As we      coverts (distalmost tip of primary coverts to tip of
found no substantive differences between foraging          last primary covert, tip of last primary covert to tip
niche and foraging behavior (Supplementary Fig.            of last secondary covert). These points create the
S2), we used foraging behavior. “Habitat” data             dataset for the whole-wing morphospace, subsets of
came from the Cornell Lab of Ornithology (2015),           which were used to calculate additional variables and
The Birder’s Handbook (Ehrlich et al. 1988), and the       morphospaces.
Animal Diversity Web (Myers et al. 2020).
   “Migratory status” (full migrant, partial migrant,      Wing shape measurements and functional metrics
and nonmigrant) was obtained from BirdLife                 Wingspan, wing length, AR, WA, WL, and pointed-
International (2020). Most species in this compila-        ness of the wingtip (for symbols, see Table 1) are the
tion were logged as full migrants or non-migrants.         most commonly used wing metrics for comparative
A single species, Phalacrocorax carbo (great cormo-        functional analysis (Ellington 1984; Norberg 1990).
rant), was registered as a third category, “partial        We followed the terminology used in Norberg
migrant,” because only part of the population              (1990): wingspan, b, is the distance between wingtips;
migrates. The majority of waterbirds have geographic       wing length, lw, is the distance from the shoulder
ranges that were scored as either “continent-based”        joint to wingtip; armwing length, law, is the distance
or “oceanic” using range maps from BirdLife                between the shoulder and wrist joints; and handwing
International (2020). As a result, we scored our           length, lhw, is the distance between wrist joint and
waterbirds for an additional variable that combines        wingtip (Fig. 2A). It is worth noting that ornitholo-
migratory status with geographic location. Only 5          gists have often used “wing length” as the measure
species ranged across both continental and oceanic         from the wrist joint to the wingtip (equivalent to
geography, and we scored these as “mixed range.”           lhw), because that has been the easiest measure to
We combined these data with migratory status to            get from a museum specimen with a folded wing
generate our variable “MigrationþLocation” (i.e.,          (Greenewalt 1962). Because we used spread wings,
continental migrant, continental nonmigrant).              we can distinguish between the different regions of
                                                           the wing.
Digitization                                                  Traditionally, AR is wingspan divided by mean
To capture wing shape, wing images were digitized          chord, because the chord of a bird wing changes
with a mixture of homologous and sliding semi-             significantly over its length. However, most recent
landmarks (Fig. 2A for wing anatomy; Fig. 2B for           studies measure single-wing AR, as wing length
numbered landmarks). The trailing edge of the cov-         squared divided by WA (Norberg 1990).2 We fol-
erts was also included in wing shape, because overall      lowed that convention here as AR ¼ lSww . We also
covert shape was found to contribute significantly to      developed an AR slope metric (“AR slope”) using
wing shape disparity (Wang and Clarke 2015). The R         wing length and a series of 5 incrementally more
Avian wing morphology and ecology                                                                                                             5

                                                                                                                                                  Downloaded from https://academic.oup.com/iob/article/3/1/obab011/6276991 by guest on 10 October 2021
Fig. 2 Landmark protocol for wings. (A) Anatomy of a bird wing, handwing—gray portion, armwing—white portion; (B) Numbered
homologous landmarks (red) and sliding semi-landmarks (yellow); (C) Subset of landmarks used for handwing morphospace, and
measurements taken for handwing index calculations (purple, lS1 and lhw); (D) Wingspan (blue, lw) chords (red, C1–C5) for AR
distribution analysis; (E) WA segments: anterior armwing (light green, SawA), posterior armwing (dark green, SawP), anterior midwing
(light purple, SmwA), posterior midwing (dark purple, SmwP), wingtip (light blue, Swt); (F) Calculating slope for AR distribution of a wing.

Table 1 Variables and abbreviations for wing and aerodynamic metrics (adapted from Norberg 1990)
AR ¼ aspect ratio                        l ¼ length                          Mg ¼ body weight                       Sw ¼ area of one wing
b ¼ wingspan, wingspread                 law ¼ armwing length                mw ¼ mass of one wing                  Ti ¼ wingtip-shape index
c ¼ wing chord                           lhw ¼ handwing length               S ¼ airfoil or WA                      Tl ¼ wingtip-length ratio
c ¼ mean wing chord                     lw ¼ wing length                    Saw ¼ armwing area                     Ts ¼ wingtip-area ratio
g ¼ acceleration of gravity              M ¼ body mass                       Shw ¼ handwing area                    WL ¼ wing loading

distal chords to calculate an AR series along the                       between the shoulder and wrist joints, which extends
wing. These points generated a linear regression                        across the secondary feathers (Fig. 3A), and handw-
(Fig. 2F), from which was derived the AR slope.                         ing area (Shw) is the area of the wing between the
This metric measures the degree that AR changes                         wrist joint and the wingtip, which extends across the
along the length of the wing.                                           primary feathers (Fig. 3A) (Norberg 1990). WL (Mg  S Þ
   Airfoil area (S) refers to the lift-generating surface               is a measure of the force of body weight placed per
of an object (Table 1) (Norberg 1990). Single-WA                        unit of WA (Norberg 1990). Pennycuick (2008)
(Sw) refers solely to the area of one wing (Norberg                     noted that WL needs to be calculated using total
1990). Armwing area (Saw) is the area of the wing                       airfoil area (S), which includes the area of both
6 S. L. Baumgart et al.
mwestneat/WingMorph) to calculate functional met-
rics for bird wings. The app imports the two-
dimensional wing landmarks, from which it com-
putes functional metrics (wing spans, chords, ARs,
HWI, regional WAs, and total WA; Fig. 2C–E) that
are output as a trait matrix (.csv) file. The full set of
wing metrics calculated for our waterbird dataset is
available (Supplementary Table S2).
Morphometric analysis and phylogenetic comparative methods
The functional metric morphospace was calculated
using AR, AR slope, WA, WL, and HWI. These
Downloaded from https://academic.oup.com/iob/article/3/1/obab011/6276991 by guest on 10 October 2021
data were size corrected by calculating the log shape
ratios for WA and WL, two variables strongly af-
fected by body size. A single geometric mean was
calculated between WA and WL. Each of those var-
iables was divided by that geometric mean, and those
values were log10-transformed (Mosimann 1970;
Price et al. 2019). Because each of the variables in
morphospace use dramatically different ranges, each
set of variables were z-scored for standardization be-
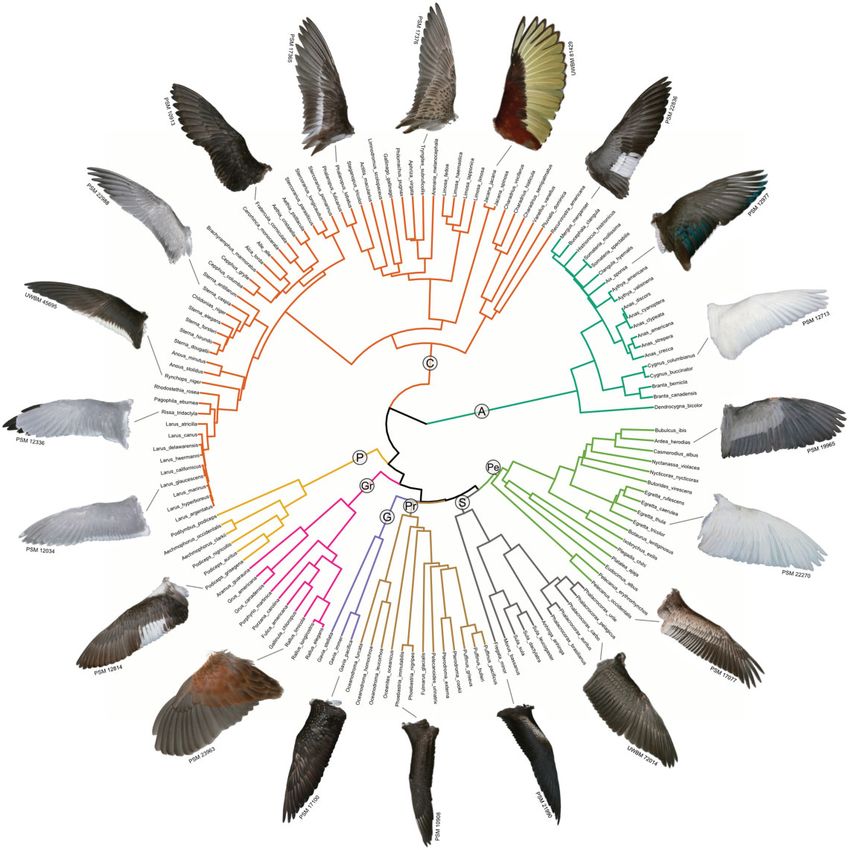
Fig. 3 Wing measurements associated with flight performance.
fore running the principal component analysis
(A) Based on definitions in Norberg and Rayner (1987) and
Norberg (1990). (B) Measurements on folded wings for Kipp’s
(PCA).
index (Lockwood et al. 1998), illustration adapted from Sibley Geometric morphometric analysis was performed
(2018). Abbreviations: b, wingspan; l, length; S, area; DS 1 , distance using the R packages geomorph (Adams et al. 2020)
between longest primary and first secondary flight feathers. and RRPP (Collyer and Adams 2018; 2020), which
wings and the body. This area represents the portion included a General Procrustes analysis of coordinate
of the bird that is contributing to lift while gliding. data (used for standardizing landmark data in
Norberg and Rayner (1987) examined data from whole-wing and handwing data) and PCA to gener-
many birds and bats and found that the body area ate whole-wing and handwing morphospaces. The
is 20% of combined WA. Because our dataset is whole-wing morphospace was represented by the
composed of single wings, we approximated WL landmarks in Fig. 2B, and the handwing morpho-
asWL ¼ 2Sw þðMg 2
2Sw 0:2Þ Nm .
space was represented by a subset of those landmarks
Handwing pointedness has been linked to flight outlining the handwing, from the wrist, around the
performance and dispersal ability (Lockwood et al. wingtip, to the last primary flight feathers (circles in
1998; Claramunt et al. 2012). “Kipp’s distance” Fig. 2C). Wing area (WA) distribution data (calcu-
(DS1 Þ has been defined as the distance between the lated from polygons as presented in Fig. 2E) were
longest primary and secondary flight feathers, though analyzed using PCA using the base prcomp() func-
has since changed to being the distance between the tion (R Core Team 2020). Phytools (Revell 2012) was
longest primary flight feather and first secondary used for discerning phylogenetic signal (phylo.sig(),
flight feather: lw lS1 (Kipp 1959; Lockwood et al. Pagel’s lambda) and ancestral state estimation (dis-
1998; Claramunt et al. 2012; Pigot et al. 2020; Sheard crete character: reRootingMethod(); continuous char-
et al. 2020), which is readily measured on the folded acter: contMap()). The equal rates (ERs) and
wings of museum specimens (Fig. 3B). “Kipp’s symmetric rates models were recommended for
index” (IK), or the “handwing index” (HWI), is a reRootingMethod() (Revell 2012), and they had an
commonly used metric for wingtip shape. This equivalent log likelihood for this dataset, so the ER
index is often calculated as a proportion of Kipp’s model was used in this analysis. Ape (Paradis and
distance against the traditional wing length measure- Schliep 2019) was used for setting up the phyloge-
ment: IK ¼ lw llw
S1
100 (Fig. 3B) (Lockwood et al. netic tree, and geiger (Harmon et al. 2008) was used
1998; Baldwin et al. 2010). for phylogenetic analysis of covariance (aov.phylo(),
1000 simulations, Wilks test). Phylogenetic analysis
WingMorph app for calculating functional metrics of covariance (phylo-MANOVA) was done with the
We developed a Mac Xcode app called WingMorph first 6 PCs for whole-wing morphospace data (90.9%
(free for download; http://www.github.com/ total variance) and with the first 3 PCs for handwingAvian wing morphology and ecology 7
morphospace data (91.3% total variance). Data were Rallus limicola (AR ¼ 1.8) to long, slender, high AR
plotted with ggplot2 (Wickham 2016) and plotly wings in the albatross Phoebastria immutabilis
(Sievert 2020), and phylomorphospaces were plotted (AR ¼ 5.8) (Figs. 4–8). Results show strong patterns
using ggphylomorpho (Barr 2017). A few nonwater- of correlation between multiple wing metrics and
bird clades among our waterbird clades (Galliformes, ecological traits such as foraging behavior and hab-
Strisores, Columbaves, and Inopinaves (¼landbirds); itat across the phylogeny of waterbirds. Some signif-
following nomenclature of Prum et al. 2015) are ei- icant differences were found to be associated with
ther arboreal or ground-dwelling. These birds were taxonomic grouping as well, but there was no signif-
excluded so they would not introduce nonwaterbird icant association of waterbird wing shape functional
behaviors to the analyses. metrics with migratory status. Below is a summary of
Convergence in whole-wing shape among water- the functional metrics and discussion of key varia-
birds was tested by using the R package convevol bles. We present the complete analysis of functional
Downloaded from https://academic.oup.com/iob/article/3/1/obab011/6276991 by guest on 10 October 2021
(Stayton 2015). We used the function convratsig() metrics and their ecological and migratory associa-
to test whether identified sets of tip species have tions in the supplementary materials.
converged more strongly on a region of morpho- Both low and high AR wings appear to have
space than would be expected from that of a simu- evolved at least 5 times independently (Fig. 4B).
lated null distribution. We used convergence The waterbirds with higher AR wings tend to be
measure C1, representing the proportion of the max- plunge divers and aerial hunters (Fig. 4 and
imum distance between focal taxa that has been Supplementary Fig. S3C), although albatrosses with
closed by evolution. For several larger groups of spe- very high AR wings dabble (surface skim or head
cies, we also used the function convnumsig() to test submerged tipping downward) when they forage
whether the frequency of lineages independently (Fig. 4). Birds with lower AR wings tend to be prob-
evolving into a certain region of morphospace is sig- ers and stalkers (Fig. 4 and Supplementary Fig. S3C).
nificantly different from a simulated null distribution Surface divers, ground foragers, and dabblers tend to
(convergence measure C5). Both tests were run with have medium AR wings (Fig. 4 and Supplementary
1000 simulations. The convnumsig() function Fig. S3C).
requires the number of species selected for compar- Functional metrics plotted in morphospace sug-
ison within a given group to be larger than the num- gest there exists significant overlap between major
ber of variables, in this case, PCs. As such, only the groups for foraging behavior and migra-
first 5 PCs were used for convnumsig() to enable tests tionþlocation variables (Fig. 5). The loadings in
for clusters with 6 species or more. The convratsig() Fig. 5A and Supplementary Table S4 show that AR,
function does not have this restriction, allowing us AR slope, and HWI are positively correlated and
to use 10 PCs (90% total variance) for clusters provide most of the influence for PC 1. WA and
with 2–10 species and increase the robustness of WL are also positively correlated and mostly influ-
the convergence analysis. ence PC 2. The top left (low on PC 1 and high on
PC 2) has birds with low AR wings and a low HWI.
Results Moving toward the higher PC 1 are birds with high
Our geometric morphometric analysis provided new AR wings and a high HWI. Birds with low PC 2
information on wing shape and wing functional met- values do not have a notably different AR than the
rics in waterbirds. We found that whole-wing AR, birds with higher PCs, but it seems there is a com-
WA, WL, and body mass, are all significantly influ- plex interaction with WA and/or WL to bring the
enced by phylogenetic relationships (Supplementary species to the lower PC 2 values.
Table S3). Our phylogenetic comparative analyses
Landmark-based morphospaces of waterbird wings
showed that wing shape in waterbirds is significantly
associated with ecological traits, such as foraging be- Whole-wing morphospace
havior and habitat, but not with migratory behav- Whole-wing morphospace shows some clustering by
iors. Phylomorphospace analysis revealed a strong clade, whereas ecological specializations distinguish
phylogenetic pattern of repeated convergence in species from a central cluster that includes species
wing shape across waterbird clades. with various behaviors in various habitats (Fig. 6C–
E). PC 1 and whole-wing AR are closely associated,
Wing shape correlations with ecology and migration boxplots following very similar trends for all phyloge-
Results show a wide range of wing shapes in water- netic and ecological categories (Supplementary Figs.
birds, from short, broad low AR wings in the rail S3A–E and S5A–E, respectively; also Supplementary8 S. L. Baumgart et al.
Downloaded from https://academic.oup.com/iob/article/3/1/obab011/6276991 by guest on 10 October 2021
Fig. 4 (A) Ancestral state estimation of waterbird foraging behavior. (B) Wing AR. Abbreviations: H, evolution of high AR wings, L,
evolution of low AR wings.
Fig. S6A). This trend suggests that PC 1 is driven primary coverts (more proximal or more distal)
largely by whole-wing AR, rather than body mass (Supplementary Fig. S6B). The PC 3 axis is influenced
and WL traits (Supplementary Fig. S5F–J). PC 2 is by coverage of the secondary coverts (anterior wing or
an axis influenced strongly by the relative size of the extending to the trailing edge; Supplementary Fig.
armwing to the handwing, curvature of the leading S6C) and the curvature of the leading edge.
edge of the wing (straight or curved), pointedness of Considering whole-wing phylomorphospace by
the wingtip (rounded or pointed), and coverage of the taxonomic group, Anseriformes, Gaviiformes,Avian wing morphology and ecology 9
A -0.8 -0.6 -0.4 -0.2 0.0 0.2 0.4 0.6 0.8 1.0
WA, WL
0.4
0.2
0.0
PC 2 (36.7%)
AR -0.2
AR slope
HWI
-0.4
Anseriformes
Charadriiforme
Charadriiformes
Downloaded from https://academic.oup.com/iob/article/3/1/obab011/6276991 by guest on 10 October 2021
Gaviiformes -0.6
Gruiformes
Pelecaniforme
Pelecaniformes
Podicipediform
Podicipediformes
Procellariiform
Procellariiformes -0.8
Suliformes
PC 1 (55.2%)
B 3 C 3
2 2
1 1
0 0
PC 2 (36.7%)
PC 2 (36.7%)
−1 −1
−2 −2
−3 −3
Aerial hunter
Dabbler
−4 Ground forag
forager −4 Continental migrant
Plunge dive Continental non-mig
non-migrant
Probing Mixed migrant
−5 Stalking −5 Oceanic non-migran
non-migrant
Surface dive Oceanic migrant
−4 −2 0 2 4 −4 −2 0 2 4
PC 1 (55.2%) PC 1 (55.2%)
Fig. 5 Morphospace of functional metrics: AR, AR slope, WA, WL, and HWI. (A) colored by taxonomy and includes loading plot, (B)
colored by foraging behavior, (C) colored by migrationþlocation. WA and WL were corrected for size using Mosimann shape ratios,
then all the variable distributions were standardized using z-scores before running the PCA. PCs 1 and 2 represent 91.9% of the total
variance. Size of points indicates relative WL. Interactive plot in Supplementary Fig. S4.
Pelecaniformes, Podicipediformes, and Suliformes more central (Fig. 6D). The major habitat groups
score low and Charadriiformes high on PC 2 (Fig. also feature a lot of overlap in the central region
6A and B). Gruiformes and Charadriiformes extend of wing morphospace (Fig. 6E), with ocean, shore-
into lower PC 1 and PC 2 values, and line, and a few marsh birds exhibiting higher PC 1
Procellariiformes and Charadriiformes score high values. Marsh-dwelling birds also extend to lower PC
on PC 1 and PC 2 (Fig. 6A and B). Different flight 1 values. Migratory and continental birds occupy a
styles feature major overlap, with only gliding/soar- huge range of wing morphospace (Fig. 6F and G),
ing birds limited to high PC 1 values (Fig. 6C). whereas oceanic birds (migratory and nonmigratory)
Foraging behavior is significantly correlated with are limited to higher PC 1 values (Fig. 6G).
whole-wing shape space (phylo-MANOVA: Wilks
statistic ¼ 0.178, P ¼ 0.0170, Supplementary Table Wing area morphospace
S8). Aerial hunters and plunge divers are limited to Like whole-wing morphospace, wing area (WA)
higher PC 1 values, probing birds extend to lower morphospace shows a central cluster with some pe-
PC 1 values, and the other foraging behaviors are ripheral extensions. This analysis compares the10 S. L. Baumgart et al.
A Phylomorphospace
PC 2 (26.1%)
Downloaded from https://academic.oup.com/iob/article/3/1/obab011/6276991 by guest on 10 October 2021
PC 1 (45.6%)
B Taxonomy C Flight
Fli Style
PC 2 (26.1%)
D Foraging Behavior E Habitat
PC 2 (26.1%)
/
/
F Migration G Migration + Location
PC 2 (26.1%)
.
.
PC 1 (45.6%) PC 1 (45.6%)
Fig. 6 Whole-wing morphospace based on PCs 1 and 2, 71.7% of total variance. (A) Phylomorphospace with warp grids depicting wing
shape at extremes of axes and wing shapes of selected specimens. Subsequent morphospaces are colored for (B) major clades, (C)
flight style, (D) foraging behavior, (E) habitat, (F) migration, and (G) migrationþlocation. FF, forward/bounding flight; GS, gliding/soaring
flight; HF, high-frequency flapping flight; UF, undulating flapping flight. PC scores in Supplementary Table S7. Interactive plot in
Supplementary Fig. S7.Avian wing morphology and ecology 11
distribution of the handwing to armwing areas, as and low PC 1 values. For flight style, forward/bound-
well as the extent to which the dorsal greater coverts ing flapping flight, and gliding/soaring birds overlap
cover the wing surface. PC 1 (53.3%) represents the very little, though they overlap with the high-
ratio between anterior and posterior armwing areas, frequency flapping and undulating flapping birds
with posterior armwing areas generating higher PC 1 (Fig. 8C). There is a lot of overlap within foraging
values. PC 2 (34.4%) represents the change in rela- behavior, aerial hunters, and plunge divers tend to-
tive wingtip area, with smaller wingtip areas gener- ward the right, and probing birds occupy the largest
ating higher PC 2 values. area of morphospace, and are the only ones expand-
Taxonomy provides the strongest separation be- ing into the area with low PC 1 and PC 2 values
tween groups within WA morphospace. (Fig. 8D). Foraging behavior has a significant rela-
Anseriformes, Gruiformes, Pelecaniformes, and tionship with handwing morphospace (phylo-
Podicipediformes compose the central cluster (Fig. MANOVA: Wilks statistic ¼ 0.369, corrected
Downloaded from https://academic.oup.com/iob/article/3/1/obab011/6276991 by guest on 10 October 2021
7A and B). Charadriiformes are present in the cen- P ¼ 0.032, Supplementary Table S11). Habitat mor-
tral cluster but also extend into areas of higher (gulls phospace does not differentiate clusters. Unlike the
and terns) and lower (a couple jacanas) PC 1 values. other habitats, marsh-dwelling birds expand toward
Suliformes are split between average and low PC 1 low PC 1 and PC 2 values. Habitat also shows a
values. Procellariiformes and Gaviiformes tend to weakly significant relationship with handwing mor-
have high PC 1 values. There is no major pattern phospace (phylo-MANOVA: Wilks statistic ¼ 0.571,
in shape space with regard to flight style, although corrected P ¼ 0.061, Supplementary Table S11).
undulating flappers expand to fill the morphospace There is little difference in migratory versus nonmi-
(Fig. 7C). Considering foraging, aerial hunters have gratory birds in wing morphospace (Fig. 8F).
larger anterior than posterior wings with a range of Oceanic birds tend to have more pointed handwings
wingtip sizes (Fig. 7D). Some surface divers and a than continental birds, which occupy a greater range
few probers have large posterior WAs, a wing shape in morphospace (Fig. 8G).
feature not observed in birds characterized by other
foraging behaviors. Ocean-dwelling birds tend to Convergence in waterbird wing shape
have the widest range in morphospace (Fig. 7E).
When tested within a phylogenetic framework, wing
The WAs of other habitats largely overlap, although
shapes in waterbirds converged at statistically signif-
marsh-dwelling birds with small anterior and large
icant levels multiple times. We found significant
posterior WAs cluster together. Full migrants tend to
convergence in whole-wing phylomorphospace
have greater coverage of morphospace than nonmi-
among groups of waterbirds with high and with
grants (Fig. 7F). Oceanic migrants tend to have
low wing ARs, among clusters of waterbirds with
larger anterior than posterior wings and exhibit a
similar foraging behaviors and habitats as well as
range of wingtip sizes (Fig. 7G). Most categories (ex-
clusters with a variety of foraging behaviors and hab-
cept mixed migrant) have representatives with larger
posterior than anterior WAs. itats (Table 2).
Most of the groups in Table 2 (circled in Fig. 9)
Handwing morphospace had significant C1 convergence in wing shape, indi-
Handwing morphospace shows some clustering cating that the maximum phylogenetic distance rep-
among the variables (Fig. 8). PC 1 (69.0% of the resented by the clusters was greater than expected
variation) represents wing tip shape, and PC 2 under the Brownian motion model of evolution.
(15.7% of the variation) records the location of the The larger groups (1–3) also featured highly signifi-
tip of the first secondary flight feather in relation to cant C5 values, a statistic indicating that the selected
the wrist (inclined distally or proximally) and the organisms invaded that area of morphospace a
curvature of the primary flight feathers (straight or greater number of times than would be expected
curved trailing edge). under the Brownian motion model of evolution.
Phylogenetically, many of the same trends in the Overall, most groups tested here resulted in sig-
whole-wing morphospace are repeated in handwing nificant convergence in wing shape in multiple
morphospace (Fig. 8A and B). Gruiformes and regions of morphospace. Clusters of species that oc-
Pelecaniformes tend to have lower PC 1 values, cupied the regions of morphospace and share similar
Anseriformes average, and Procellariiformes high foraging behaviors and/or habitats had significant
PC 1 values. Charadriifromes shows the greatest convergence (Groups 1, 2, 3, 6, and 12). Regions
range in handwing morphospace, and two suliform with clusters of species featuring different foraging
clusters are on either side of the plot with both high behaviors and habitats were also significantly12 S. L. Baumgart et al.
A Phylomorphospace
Downloaded from https://academic.oup.com/iob/article/3/1/obab011/6276991 by guest on 10 October 2021
B Taxonomy C Flight Style
D Foraging Behavior E Habitat
/
/
F Migration G Migration + Location
Fig. 7 Wing-area morphospace based on PCs 1 and 2. (A) Phylomorphospace with icons depicting extremes of morphospace and WA
distributions of selected specimens. Subsequent morphospaces are colored for (B) major clades, (C) flight style, (D) foraging behavior,
(E) habitat, (F) migration, and (G) migrationþlocation. PC scores available in Supplementary Table S9. Interactive plot in
Supplementary Fig. S8.Avian wing morphology and ecology 13
A Phylomorphospace
Downloaded from https://academic.oup.com/iob/article/3/1/obab011/6276991 by guest on 10 October 2021
B Taxonomy C Flight Style
D Foraging Behavior E Habitat
/
/
F Migration G Migration + Location
Fig. 8 Handwing morphospace based on PCs 1 and 2. (A) Phylomorphospace with warp grids depicting extremes of axes and
handwing outlines from selected specimens. Subsequent morphospaces are colored for (B) major clades, (C) flight style, (D) foraging
behavior, (E) habitat, (F) migration, and (G) migrationþlocation. PC scores available in Supplementary Table S10. Interactive plot in
Supplementary Fig. S9.14 S. L. Baumgart et al.
Table 2 Convergence testing in the 11 groups of waterbirds for important functional metrics that characterize
circled in Fig. 9 their functional diversity and evolutionary history.
C1 C5 The central conclusion of this study is that impor-
tant wing metrics such as aspect ratio (AR), wing
Group no. Obs. C P-value Obs. C P-value
area (WA), and wing loading (WL) are significantly
1 0.625Avian wing morphology and ecology 15
1 8
9
6
10 7
11
Downloaded from https://academic.oup.com/iob/article/3/1/obab011/6276991 by guest on 10 October 2021
12
5 2
3 4
Fig. 9 Testing wing shape convergence within whole-wing morphospace. Colored numbers refer to index of bird species in
Supplementary Table S1. Large black numbers refer to group number in Table 2. Black lines indicate larger clusters for convergence
testing with C1 and C5, magenta lines indicate smaller clusters for convergence testing with C1. Solid lines indicate significant results,
dotted lines indicate insignificant results.
taper much faster than others (albatrosses), which in flight and travel long distances during migration
may be related to the specific aerodynamic require- (Cornell Lab of Ornithology 2015), seem to converge
ments for different foraging behaviors (aerial hunt- on WA distributions at the top of the WA morpho-
ing versus dabbling). Most other waterbird clades space (Fig. 7).
have a small range of AR slope (excluding charadrii- Wing loading (WL) is another key parameter
form outliers), suggesting that wing taper is a rela- yielding insight into the structure and function of
tively conservative trait in most birds. wings for flight (Vagasi et al. 2016). WL is not tied
Although wing area is the denominator in calcu- to a particular wing shape (Supplementary Fig. S10),
lating AR, wing area can be plotted separately. but rather to the functional demands of the bird.
Waterbirds that spend a lot of time flapping (either Within a study examining European species, some
forward/bounding or high-frequency) have a narrow birds are found to have a low WL that optimizes
range of lesser WA, suggesting that smaller wings cost of transport for long distances, whereas other
may be an adaptation for less stressful, repetitive birds have high WL that optimizes speed at the cost
movement. Gliding/soaring birds and undulating of energy efficiency (Vagasi et al. 2016). The birds
flappers have a higher average and range of WA s, with the highest wing loadings in our waterbird
underscoring the importance in higher WA and its dataset are ducks, loons, and grebes, birds that forage
variation. WA did not differ significantly between by dabbling and surface diving in lakes/ponds and
gliding/soaring waterbirds and those with undulating use high-frequency flapping to get aloft. Loons and
flight, and so wingbeat frequency may have less in- grebes are diving birds that have reduced skeletal
fluence over the WA. No specific WA seems optimal pneumaticity to increase skeletal density (O’Connor
for any particular variable, as WA morphospace 2009), which in turn increases WL during flight. In
overlap among variables is substantial. As an exam- contrast, birds that glide and soar have greater skel-
ple, procellariiforms occupy a very localized region etal pneumaticity (O’Connor 2009; Smith 2012), re-
of WA space, which may be the result of the con- ducing body mass and thus WL.
straints from aerial hunting or from the long bouts Wing kinematics and wing morphing during flight
of flight required by their oceanic habitat (Warham affects WL (Taylor et al. 2012; Harvey et al. 2019),
1977). On the other hand, the brent goose an important frontier in flight biomechanics.
(Anseriformes: Branta bernicla) and sandhill crane Although presented for uniformity in a single out-
(Gruiformes: Grus canadensis), which are relatively stretched pose, avian wings have a number of com-
large birds with long necks that remain extended ponents that may be adjusted during flight. Wing16 S. L. Baumgart et al.
shape changes at different flight speeds (Lentink et rounded wings than the migrant citril finch
al. 2007; Tobalske 2007). Feathers spread farther (C. citrinella ¼ C. citrinella citrinella) from the main-
apart at slower flight speeds, increasing WA and land (Förschler et al. 2008; Gill et al. 2020). Although
vice versa (Tobalske 2007). If one assumes a given the wing shape differences between these finches
bird has a constant body mass, the foregoing neces- match expectations given their migratory patterns,
sarily means that WL must vary with flight speed.In their daily locomotor needs may also explain this
our study, wing shape is static as in the studies we difference; the insular C. corsicanus must navigate
have extensively cited (Lockwood et al. 1998; Wang dense foliage compared to its mainland counterpart
and Clarke 2015; Pigot et al. 2020). How wing shape (Förschler et al. 2008). Among our rail species in the
varies during flight across birds is an intriguing genus Rallus, R. longirostris and R. elegans are similar
question for future research. in size and wing shape, but the former is nonmigra-
tory and the latter migratory (Cornell Lab of
Downloaded from https://academic.oup.com/iob/article/3/1/obab011/6276991 by guest on 10 October 2021
Wing shape and migration Ornithology 2015; BirdLife International 2020).
Most of the birds we sampled (120 species, 88%) are Some birds alter migratory habits over the course
regarded as full migrants; only 15 species are logged of a few generations (Berthold and Terrill 1991).
as nonmigrants and 1 as a partial migrant. We could Our results suggest that migratory behavior is one
not distinguish any patterns in wing shape that factor among many that influence wing shape as
would distinguish migratory versus nonmigratory shown in previous studies (Mönkkönen 1995;
waterbirds at this scale. The combination variable Baldwin et al. 2010; Huber et al. 2017).
migrationþlocation, however, shows weak signifi-
cance with respect to handwing index (HWI), which Evolutionary convergence across
is commonly used for wingtip shape (Wilks phylomorphospace
statistic ¼ 7.278, P ¼ 0.0510). The relationship be- Four general patterns emerge from our morphomet-
tween migratory behavior, morphology, and physiol- ric analysis of wing form across birds. First, phylo-
ogy is complex (Piersma et al. 2005). Migratory morphospace plots indicate the presence of a
patterns are known to vary within genera and some- significant phylogenetic component to many aspects
times within species (Berthold and Terrill 1991; of avian wing morphology (Wang and Clarke 2015;
Lockwood et al. 1998; Fernandez and Lank 2007). Pigot et al. 2020). Thus, clade membership has some
For example, the rail genus Rallus includes the non- predictive value with regard to wing morphology.
migrant Rallus longirostris as well as the full migrants Second, most sampled waterbirds cluster in the
Rallus elegans and R. limicola. Likewise, the cormo- centroid of distribution for a range of wing metrics.
rant genus Phalacrocorax includes the nonmigrants These waterbirds are characterized by a wide range
Phalacrocorax brasilianus and Phalacrocorax urile, of locomotor, foraging and migratory behaviors, and
the partial migrant (some populations migrate, ecological habitats. Thus, the sweet spot of wing
some do not) P. carbo, and the full migrants morphospace among waterbirds is occupied by dis-
Phalacrocorax auritus and Phalacrocorax pelagicus. tantly related taxa with disparate functional, behav-
Despite stark differences in migratory behavior, these ioral, and ecological traits. Similar to limb
birds occupy the same region of morphospace (Fig. morphospace for disparate clades among rodents,
6). outliers in morphospace are limited to extreme mor-
Many aspects of avian biology and behavior influ- phologies, such as the limbs of fossorial taxa
ence wing shape, introducing some plasticity in (Hedrick et al. 2020).
shape at all taxonomic levels. For example, the Third, a few avian subgroups did plot in relatively
wing shape of western sandpipers (Calidris mauri) extreme wing morphospace, such as the low AR
varies depending on sex and maturity (Fernandez wings of the probing jacanas and rails and the high
and Lank 2007). Females migrate longer distances AR wings of aerial and plunge diving specialists
than males, and males have to perform aerial dis- (terns, gannets, and petrels). In these cases, therefore,
plays to attract the females. Therefore, the female wing morphology seems strongly linked to their spe-
wing is longer and more pointed than the wing in cialized lifestyles, unlike the vast majority of birds
males. For rapid escape, immature sandpipers re- occupying the center of morphospace where aerody-
quire shorter, rounder wings than adults. Two spe- namic factors rather than disparate functional and
cies of the finch genus Carduelis exhibit different ecological traits govern wing morphology.
wing shapes, the insular nonmigrant Corsican finch Finally, these conclusions highlight the prevalence
(C. corsicanus ¼ C. citrinella corsicanus) with more of convergence in wing morphospace acrossAvian wing morphology and ecology 17
Table 3 “Group 4” waterbirds showing convergence in wing morphospace
Species Taxonomy Flight style Foraging behavior Habitat Body mass (kg) AR WL (Nm-2)
Pelecanus erythrorhynchos Pel. GS Surface dive Lake/pond 4.970 2.1 87.4
Pelecanus occidentalis Pel. GS Plunge dive Ocean 3.702 2.4 81.8
Aechmophorus occidentalis Pod. HF Surface dive Lake/pond 1.429 1.6 203.5
Podiceps grisegena Pod. HF Surface dive Lake/pond 1.023 3.3 167.2
Branta bernicla Ans. FF Dabble Marsh 1.370 1.7 153.7
Pod., Podicipediformes; Ans., Anseriformes; Pel., Pelecaniformes.
waterbirds. We identified and tested 12 likely instan- suggesting wing shapes may be employed in multiple
ces of wing shape convergence. The selected clusters behaviors and habitats with only extreme wing
Downloaded from https://academic.oup.com/iob/article/3/1/obab011/6276991 by guest on 10 October 2021
included areas with high and low AR wings in pairs shapes tied to extreme behaviors and habitats. For
and larger groups of taxa and sampled the majority example, two pelecaniforms (Pelecanus erythrorhyn-
of waterbird phylomorphospace. Ten out of 12 of chos and Pelecanus occidentalis), an anseriform (B.
these groups were highly significant examples of con- bernicla), and two podicipediforms (Aechmophorus
vergence on similar wing shape from distant ances- occidentalis and Podiceps grisegena) averaged 45.8%
tral starting points (Table 2). Convergence in form convergence on medium AR wings with rounded
among flapping appendages is a major evolutionary wingtips and a much larger armwing than handwing
pattern in organisms as diverse as birds (Norberg (Group 4: C1 P ¼ 0; Table 2 and Fig. 9). Swans, an
1986, 1990), bats (Norberg 1986), insects (Strauss auklet, and grebes averaged 50.1% convergence on
1990), and bony fish (Aiello et al. 2017). medium AR wings with a straighter leading edge, a
Several of the convergent clusters share foraging slightly rounded wingtip, and slightly larger armw-
behavior or habitat, supporting the hypothesis that ings than handwings (Group 5: C1 P ¼ 0; Table 2
there is an optimal wing shape for a given behavior and Fig. 9). Two anseriforms (Aythya valisineria
or habitat. Jacanas (Charadriiformes), rails, and the and Bucephala clangula) and a procellariiform
limpkin (Gruiformes) show an average of 62.5% (Pelecanoides urinatrix) averaged 33.5% convergence
convergence on very low AR wings with rounded on medium AR wings with slightly pointed wingtips
wingtips and a slightly larger handwing than armw- and a comparatively similar handwing to armwing
ing (Group 1: C1 P ¼ 0; Fig. 9 and Table 2). The (Group 7: C1 P ¼ 0.018; Table 2 and Fig. 9). A
species in this cluster transitioned into this space 6 ground-foraging charadriiform (Charadrius vociferus)
times, significantly more than would be expected by and an aerial-hunting procellariiform (Oceanodroma
chance (C5 P ¼ 0; Table 2). Loons (Gaviiformes) also furcata) averaged 49.5% convergence on medium AR
appear to converge in wing shape with gannets and wings with very pointed tips and a much larger
boobies (Suliformes: Sulidae) (Group 2: Fig. 9 and handwing than armwing (Group 8: C1 P ¼ 0.011;
Table 2) in a region of morphospace shared with a Table 2 and Fig. 9).
procellariiform (Fulmarus glacialis) and a few chara- Group 4 waterbirds (Table 3), which include two
driiforms (Brachyramphus marmoratus, Cerorhinca pelicans (Pelecanus), two grebes (A. occidentalis and
monocerata, and Larus marinus). This group averages P. grisegena) and the brent goose (B. bernicla), differ
45.8% convergence on high AR wings with some- markedly in behavior, habitat and overall morphol-
what pointy wingtips, a relatively straight edge and ogy. This disparate cluster of species is an example of
a relatively larger armwing than handwing (C1 convergence with no basis in the ecological or func-
P ¼ 0). The species in this cluster transitioned into tional variables examined in this study. The pelicans
this morphospace 10 times, significantly more than glide and soar, the grebes use high-frequency flap-
would be expected by chance (C5 P ¼ 0.009; Table ping, and the brent goose employs forward/bounding
2). Within this cluster, the charadriiform, the rhi- flapping flight. Regarding foraging behaviors, the
noceros auklet (C. monocerata), and red-footed pelicans plunge (P. occidentalis) and surface dive
booby (Sula sula) share 39.1% convergence (Group (P. erythrorhynchos), the grebes surface dive, and
12: C1 P ¼ 0.047; Table 2 and Fig. 9). Another clus- the brent goose dabbles. Regarding habitats, pelicans
ter of waterbirds with high AR wings (Group 6: live near lakes and ponds (P. erythrorhynchos) and
frigatebird, petrel, shearwater, and tern) averaged oceans (P. occidentalis), the grebes live near lakes and
55.4% convergence (C1 P ¼ 0; Fig. 9). ponds, and the brent goose prefers marshes. In size
Other convergent clusters are composed of water- they range from medium to the high end of body
birds with a range of behaviors and habitats, mass range (1–5 kg). Birds with similar WL are18 S. L. Baumgart et al.
present across wing morphospace (Supplementary Daniel Vidal, Jordan Gônet, and Romain Cottereau
Fig. S8). for the Spanish and French abstracts.
Very few regions of whole-wing morphospace are
truly dominated by a specific behavior or habitat. Funding
The highest AR wings characterize oceanic birds This work was supported by the US Department of
that glide and soar, and the lowest AR wings are Education’s Graduate Assistance in Areas of National
found in birds that hunt from the ground in more Need in Integrative Neuromechanics fellowship
enclosed habitats. In between these extremes, wing [grant number: P200A150077] to S.L.B., a generous
shapes have evolved convergently and are used in a donation from SC Johnson to P.C.S., and National
variety of behaviors and habitats. It appears water- Science Foundation grant DEB 1541547 to M.W.W.
birds are broadly adapted to more open habitats
Downloaded from https://academic.oup.com/iob/article/3/1/obab011/6276991 by guest on 10 October 2021
with wing shapes that serve multiple lifestyles and Declaration of competing interest
at least partially overlap in morphospace with birds The authors declare no competing or conflicting
in terrestrial habitats (Wang and Clarke 2015). interests.
Conclusions Data availability statement
Avian wings are appendages of great functional im- The wing image data underlying this article were
portance to birds and show great shape diversity, provided by the Wing and Tail Image Collection
ranging from those of high to low AR and those hosted by the University of Puget Sound’s Slater
with rounded or pointed wingtips. Yet, it has proved Museum of Natural History at https://digitalcollec-
challenging to find significant and regular correlation tions.pugetsound.edu/digital/collection/slaterwing,
across birds between wing shape and flight style or and the derived data are available in the article and
various ecological traits. In this study, we examined in its online supplementary material.
multiple functional and ecological variables, deter-
mining that wing shape and foraging behavior are Supplementary Data
significantly correlated in waterbirds. In contrast, Supplementary Data available at IOB online.
flight style, habitat, and migratory status are not cor-
related, although combining migratory status and lo- References
cation (continental versus oceanic) shows a weak
Adams DC, Collyer ML, Kaliontzopoulou A. 2021.
correlation. Phylogenetic signal, as shown in previ- Geomorph: software for geometric morphometric analyses.
ous studies, is prevalent, such that wing shape within R package version 3.2.2. (https://cran.r-project.org/packag-
clades exhibited similarity. Nevertheless, the central e¼geomorph) (accessed July 21, 2020).
morphospace for most traits shows broad overlap of Aiello BR, Westneat MW, Hale ME. 2017. Mechanosensation
unrelated taxa. This work highlights the complexity is evolutionarily tuned to locomotor mechanics. Proc Natl
in correlating wing shape to aerodynamic perfor- Acad Sci USA 114:4459–64.
Alexander D. 2015. On the wing: insects, pterosaurs, birds,
mance as well as a number of nonaerodynamic var-
bats and the evolution of animal flight. New York (NY):
iables. The current study and its forerunners are Oxford University Press.
based on static (spread) wing shape, leaving open Baldwin MW, Winkler H, Organ CL, Helm B. 2010. Wing
for future research considering wing shape as a dy- pointedness associated with migratory distance in
namic variable that changes with flight speed. common-garden and comparative studies of stonechats
(Saxicola torquata). J Evol Biol 23:1050–63.
Acknowledgments Baliga VB, Szabo I, Altshuler DL. 2019. Range of motion in
the avian wing is strongly associated with flight behavior
We thank the University of Puget Sound’s Slater and body mass. Sci Adv 5:eaaw6670.
Museum of Natural History for access to bird wing Barr A. 2017. ggphylomorpho. GitHub Ggphylomorpho.
images via the online Wing and Tail Image (https://github.com/wabarr/ggphylomorpho/) (accessed
Collection. Special thanks to Aaron Olsen, March 3, 2020).
Jacqueline Lungmus, Ryan Felice, Andrew George, Berthold P, Terrill SB. 1991. Recent advances in studies of
Matthew Kaufman, and Manabu Sakamoto for dis- bird migration. Annu Rev Ecol Syst 22:357–78.
Bhat SS, Zhao J, Sheridan J, Hourigan K, Thompson MC.
cussions of geometric morphometrics, comparative 2019. Aspect ratio studies on insect wings. Phys Fluid
methods, and R techniques. This manuscript was 31:121301.
greatly improved in review by John Bates, Michael BirdLife International. 2020. IUCN red lst for birds. http://
Coates, and the anonymous reviewers. We also thank www.birdlife.org/ (accessed May 14, 2020).You can also read