H3K9me3-mediated epigenetic regulation of senescence in mice predicts outcome of lymphoma patients - Nature
←
→
Page content transcription
If your browser does not render page correctly, please read the page content below
ARTICLE
                  https://doi.org/10.1038/s41467-020-17467-z                 OPEN

                  H3K9me3-mediated epigenetic regulation of
                  senescence in mice predicts outcome of lymphoma
                  patients
                  Kolja Schleich1,10, Julia Kase1,10, Jan R. Dörr1,10, Saskia Trescher2, Animesh Bhattacharya1, Yong Yu3,
                  Elizabeth M. Wailes1, Dorothy N. Y. Fan1,4, Philipp Lohneis5, Maja Milanovic 1, Andrea Lau1, Dido Lenze6,
                  Michael Hummel4,6, Bjoern Chapuy7, Ulf Leser2, Maurice Reimann1, Soyoung Lee 1,3,4 &
                  Clemens A. Schmitt 1,3,4,8,9 ✉
1234567890():,;

                  Lesion-based targeting strategies underlie cancer precision medicine. However, biological
                  principles – such as cellular senescence – remain difficult to implement in molecularly
                  informed treatment decisions. Functional analyses in syngeneic mouse models and cross-
                  species validation in patient datasets might uncover clinically relevant genetics of biological
                  response programs. Here, we show that chemotherapy-exposed primary Eµ-myc transgenic
                  lymphomas – with and without defined genetic lesions – recapitulate molecular signatures of
                  patients with diffuse large B-cell lymphoma (DLBCL). Importantly, we interrogate the murine
                  lymphoma capacity to senesce and its epigenetic control via the histone H3 lysine 9 (H3K9)-
                  methyltransferase Suv(ar)39h1 and H3K9me3-active demethylases by loss- and gain-of-
                  function genetics, and an unbiased clinical trial-like approach. A mouse-derived senescence-
                  indicating gene signature, termed “SUVARness”, as well as high-level H3K9me3 lymphoma
                  expression, predict favorable DLBCL patient outcome. Our data support the use of functional
                  genetics in transgenic mouse models to incorporate basic biology knowledge into cancer
                  precision medicine in the clinic.

                  1 Charité – University Medical Center, Department of Hematology, Oncology and Tumor Immunology, Virchow Campus, and Molekulares

                  Krebsforschungszentrum, Augustenburger Platz 1, 13353 Berlin, Germany. 2 Institute for Computer Science, Humboldt-Universität zu Berlin, Unter Den Linden
                  6, 10099 Berlin, Germany. 3 Max-Delbrück-Center for Molecular Medicine in the Helmholtz Association, Robert-Rössle-Straße 10, 13125 Berlin, Germany.
                  4 Deutsches Konsortium für Translationale Krebsforschung (German Cancer Consortium), Partner Site Berlin, Berlin, Germany. 5 University Hospital Cologne,

                  Pathology, Kerpener Straße 62, 50937 Cologne, Germany. 6 Charité – University Medical Center, Pathology, Charitéplatz 1, 10117 Berlin, Germany.
                  7 University Medical Center Göttingen, Department of Hematology and Medical Oncology, Robert-Koch-Straße 40, 37075 Göttingen, Germany. 8 Kepler

                  University Hospital, Department of Hematology and Oncology, Johannes Kepler University, Krankenhausstraße 9, 4020 Linz, Austria. 9 Berlin Institute of
                  Health, Anna-Louisa-Karsch-Straße 2, 10178 Berlin, Germany. 10These authors contributed equally: Kolja Schleich, Julia Kase, Jan R. Dörr. ✉email: clemens.
                  schmitt@charite.de

                  NATURE COMMUNICATIONS | (2020)11:3651 | https://doi.org/10.1038/s41467-020-17467-z | www.nature.com/naturecommunications                                1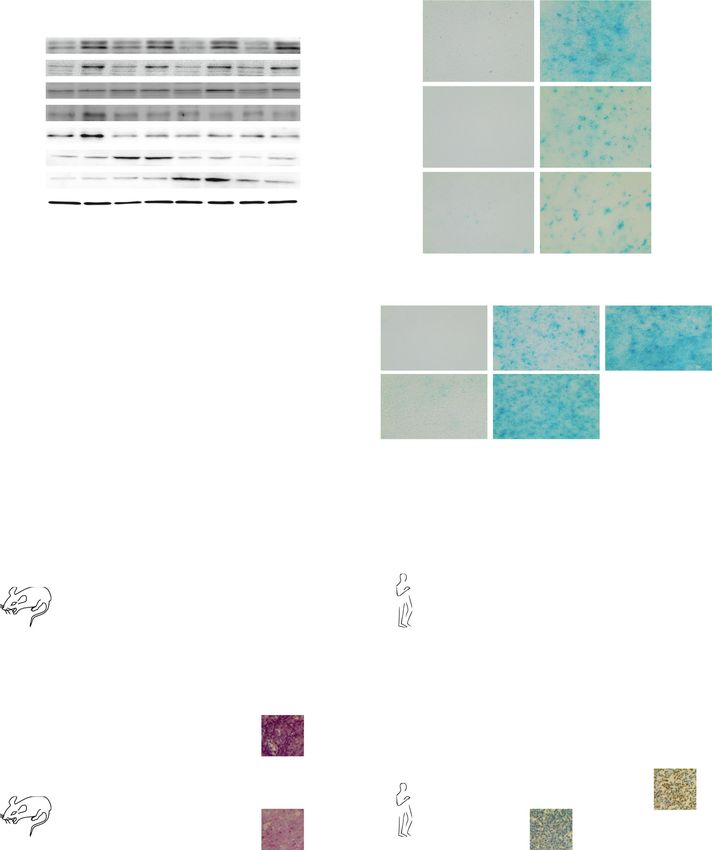
ARTICLE                                                                 NATURE COMMUNICATIONS | https://doi.org/10.1038/s41467-020-17467-z

A
         dvanced stage solid tumors that are no longer solely                contributor to long-term outcome, and, even more, anticipating
         surgically curable, and most hematological malignancies,            the senescence response to a future therapy are particularly dif-
         in principle, require systemic pharmacological anti-cancer          ficult in primary patient material, underscoring the need for
therapies1. Irrespective of their disseminated growth, some leu-             functional investigations in patient-predictive mouse models of
kemia and lymphoma entities are potentially curable by che-                  cancer35,36.
motherapy, with treatment resistance, in turn, representing the                 Hence, we explore here a transgenic mouse lymphoma model
key determinant of patient death in hematological malignancies.              in an unbiased forward genetics approach, dissect and compare
Although mostly developed on an empirical basis over many                    underlying genetics of drug (in)sensitivity across species, evaluate
decades, DNA-damaging agents have significant efficacy and will                cellular senescence as a drug effector program in the mouse, and
remain the backbone of anti-cancer therapies for many tumor                  probe mouse model-derived senescence mediators and related
entities in the future, and this especially applies to aggressive            genetic classifiers as biomarkers of DLBCL patient survival—
lymphoma such as diffuse large B-cell lymphoma (DLBCL).                      functional investigations technically and ethically virtually
While standard “R-CHOP” immune-chemotherapy (i.e., the anti-                 impossible to be solely conducted in cancer patients. In essence,
CD20 antibody rituximab plus cyclophosphamide [CTX], adria-                  our approach seeks to bioinformatically extract predictive sig-
mycin [ADR], vincristine, and prednisone2) achieves long-term                natures from outcome analyses in murine aggressive B-cell lym-
disease control in about 60% of the DLBCL patients3,4, the out-              phoma models to inform precision medicine in DLBCL patients.
come of failing patients is, despite intense salvage regimens,
dismal5. Since the beginning of the millennium, transcriptome-
and genome-based profiling of DLBCL has led to much deeper                    Results
molecular insights in this entity6–15, but virtually all recent ran-         Eµ-myc lymphomas recapitulate DLBCL treatment outcome.
domized phase III trials, intended to enhance R-CHOP efficacy                 To obtain array-based genome-wide gene expression profiles
by an additional agent and conducted in largely unselected                   (GEP) and document treatment responses of individual lym-
DLBCL patient populations, failed. Hence, the functional impact              phomas, a larger series (n = 39) of primary B-cell lymphomas
of distinct mutations, molecular subtypes, and, in particular,               that arose in Eµ-myc transgenic mice (hereafter referred to as
global therapy effector programs—namely apoptosis and senes-                 “control” lymphomas) were intravenously transplanted into two
cence—on patient long-term outcome remains, in general, rather               wild-type recipient mice each (Fig. 1a). At the time well-palpable
poorly understood and therapeutically underexploited.                        LN enlargements had formed, a single dose of the alkylating
   Predicting drug responses and deciphering treatment failure is            chemo-agent CTX was intraperitoneally administered, and
of pivotal importance to improve treatment outcome in oncology.              responses were monitored at least twice a week. Consistent with
Preclinical platforms for testing anti-cancer drug susceptibility            the high initial chemo-sensitivity of most lymphoma patients to
include cytotoxicity assays in established multi-passage cancer              their first-line induction therapy, all mice achieved a complete
cell lines, primary tumor cells grown in 2D- or 3D-cultures,                 remission (CR) by clinical criteria (see Methods for details)
patient-derived xenograft (PDX) models in immunocompro-                      within a few days after CTX application, collectively forming the
mised mice, or syngeneic, orthotopically transplantable tumor                treatment-sensitive [“SENS”] group of primary lymphomas at
models in mice with normal immune functions16–19. We inves-                  diagnosis (Fig. 1a). In the range of the progressing fraction of
tigated here the Eµ-myc transgenic mouse as a tractable and                  DLBCL patients treated with standard R-CHOP induction ther-
immune-competent model approximation to DLBCL that                           apy, 35 of the 78 mice presented with re-growing LN during the
allowed us to study treatment responses in a larger number of                100-day observation period (i.e. the “relapse-prone [RP]” group),
primary lymphomas in a clinical trial-like fashion. Specifically,             while about half of the cohort (i.e., the NR group) remained
Eµ-myc transgenic lymphomas exhibit clinical, histopathological              relapse-free (comparable to the 47% 5-year event-free survival for
and genetic features of aggressive human B-cell lymphoma, are                R-CHOP patients in major clinical trials37,38), and was con-
transplantable, and grow system-wide at natural sites—i.e., typi-            sidered cured, therefore designated “never relapse [NR]” lym-
cally in the lymph nodes (LN), the spleen, the BM, and the                   phomas (Fig. 1b, plateau of the green curve). Interestingly, time-
peripheral blood, sometimes also in visceral organs—where they               to-relapse (TTR) was very similar among most of those paired
shape their microenvironments and engage in host immune                      recipients that were transplanted with the same primary lym-
interactions20–23. Upon lymphoma manifestation and adminis-                  phoma (Supplementary Fig. 1a), indicating that the key infor-
tration of therapy, drug, or radiation responses can be easily               mation determining treatment outcome is encoded in the tumor
monitored by clinical palpation of LN sites or whole-body ima-               cell population, albeit not excluding an instructive impact the
ging techniques, especially if lymphoma cells (LC) are stably                tumor cells may have on other host components. When retreated
fluorescence- or bioluminescence-engineered24,25. In the past, we             at the time of relapse with a second application of CTX, all mice
utilized this model to investigate the impact of candidate genes or          entered a CR again, but none achieved long-term disease control
global effector programs, with particular interest in cellular               anymore (Fig. 1b, blue curve). Moreover, the recapitulation of the
senescence, on treatment outcome via reverse genetics20–22,25–28.            standard CHOP regimen in our lymphoma-bearing mouse cohort
   Stress response programs such as apoptosis and cellular                   produced the same long-term outcome: virtually every primary
senescence serve as important effector principles of anti-cancer             lymphoma that relapsed after CTX also recurred after CHOP, and
therapy29. Cellular senescence is an acutely stress-inducible cell-          lymphomas achieving lasting remissions in response to CHOP
cycle arrest condition that complements apoptosis as another                 were also cured by CTX alone (Supplementary Fig. 1b). Mice
ultimate cell-cycle exit program30–32. The firm G1-phase arrest of            reprogressing after two rounds of CTX were subjected to a third
oncogene- or therapy-induced senescent (OIS, TIS, respectively)              dose of the same agent, again resulting in even shorter durations
cells is executed through the Retinoblastoma protein (Rb)/E2F                of response and no lasting disease control (Fig. 1b, red curve).
transcription factor-guided trimethylation at the lysine-9 residue           Eventually, if exposed to additional rounds of CTX, mice exhib-
of histone H3 (H3K9me3), mediated, for instance, by the indir-               ited at best a “no change” situation or presented with “progressive
ectly Rb-bound H3K9 methyltransferase Suv39h1 (suppressor of                 disease”, i.e., no shrinkage or even continuous growth despite
variegation 3–9 homolog 1, briefly “suvar”), thereby creating a               therapy. In essence, we established a transgenic lymphoma
repressive chromatin environment in the vicinity of S-phase-                 treatment platform that resembles some clinical results observed
promoting E2F target genes33,34. However, dissecting TIS as a key            in DLBCL patient cohorts in response to CHOP-based therapies,

2                NATURE COMMUNICATIONS | (2020)11:3651 | https://doi.org/10.1038/s41467-020-17467-z | www.nature.com/naturecommunications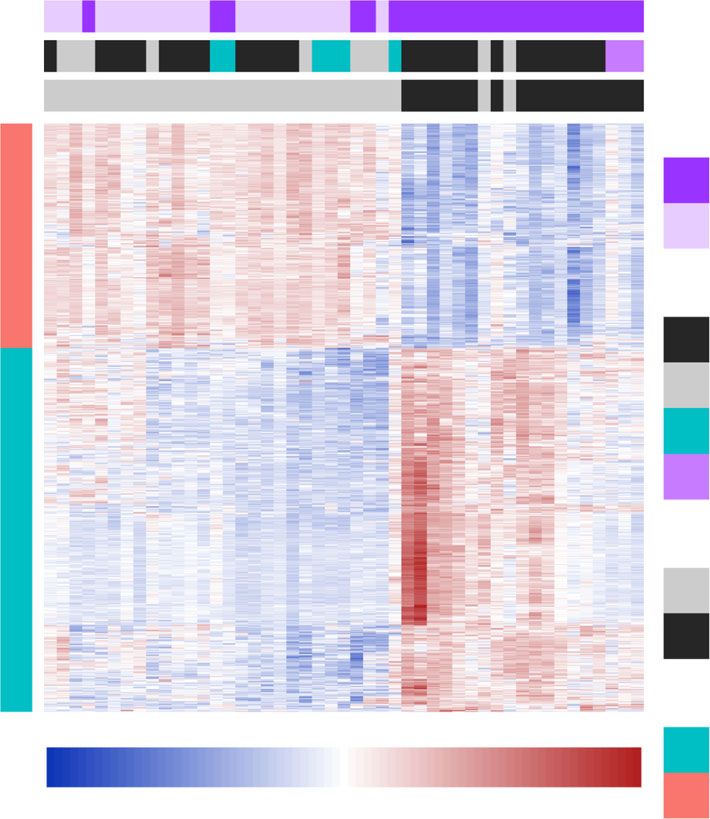
NATURE COMMUNICATIONS | https://doi.org/10.1038/s41467-020-17467-z ARTICLE
a Repetitive treatments b
1.00
First-line treatment
Anticancer
therapy Second-line treatment
myc ~50% 0.75 Third-line treatment
Tumor-free (%)
Therapy
Primary Eμ-myc lymphoma
untreated Remission Relapse 0.50
Never relapse NR Sensitive
(SENS) 0.25
Relapse prone RP
RES Resistant Full-blown 0.00 p = 2.10616e–15
clinically resistant
+/– 4-h drug challenge in vivo 0 25 50 75 100
Time (days)
c d
Dataset 1.00
5 ABC-like
Eμ-myc
GCB-like
GSE10846 0.75
Tumor-free (%)
Unclassified
PC2 (11.3%)
GSE31312
GSE4475
GSE4732 0.50
0
Type
0.25
Eμ-myc
DLBCL
mBL 0.00 p = 0.0036
–5
0 25 50 75 100
Time (days)
–10 –5 0 5 10
PC1 (25.3%)
e
BCR HR OxPhos
4
2
DLBCL
0
–2
BCR
NES
4 HR
OxPhos
2 Eμ−myc
0
–2
in
n
n
s
y
ay
R
R
r
P
SP
d
SE
N
T
ai
ho
io
io
bl
ha
le
_U
H
BC
EN
IO
w
p
at
at
m
SA
pi
N
xP
re
tc
th
AT
V1
lic
yl
se
EM
PO
om
pa
O
or
or
n
p
as
YL
P.
io
re
C
ES
ph
PL
p
g
_U
is
ns
R
x
lin
e
A
os
M
c
R
e
O
or
tra
N
ex
F1
pl
a
Y_
O
ph
H
ilm
D
gn
m
C
E2
SP
n
se
R
G
co
e
si
K_
tro
G
O
iv
ba
G
O
ic
or
kB
AT
AR
ec
t
n
KE
PH
da
en
ai
t
G
ep
el
F–
M
ch
LM
xi
og
G
E_
ec
AM
ry
O
N
KE
nc
ry
AL
IV
to
r
G
to
FL
O
ll
ra
AT
G
H
ce
ra
pi
B
IN
KE
D
pi
gD
s
B
K_
XI
re
es
G
Si
O
AR
lr
O
G
M
K_
G
ia
KE
LM
dr
AR
on
AL
LM
ch
H
AL
ito
H
m
O
G
Fig. 1 The Eµ-myc mouse lymphoma model recapitulates molecular signatures and some clinical features of human DLBCL. a Utilization of the Eµ-myc
model in a clinical trial-like fashion. Eµ-myc lymphomas were transplanted into wild-type recipients and treated with CTX upon lymphoma formation. After
initial remission, tumors that relapsed (RP, unlike those that did not [NR]) were retreated. Lymphomas were considered clinically resistant after a third
relapse (RES). b Tumor-free survival of CTX-treated mice after first(-line) treatment (n = 76, green line), after second treatment (n = 31, blue line), and
after third treatment (n = 28, red line). Two mice per lymphoma were monitored for response. c Principal components analysis based on signature genes
separating patients with Burkitt’s lymphoma (n = 98) from those with DLBCL (n = 1305) in different datasets and Eµ-myc lymphomas (n = 154). Each
dataset was separately row (gene) mean-centered and scaled to unit variance before being combined in a single dataset. The larger white-bordered points
denote the centroid of each lymphoma type. d Tumor-free survival of CTX-treated mice bearing ABC-like (n = 10), GCB-like (n = 24) or unclassified (n =
42) Eµ-myc lymphomas. Two mice per lymphoma were used. e Pattern comparison of multiple GSEA results of the three distinct CCC subgroups (as
indicated) with one compared against the two others for DLBCL cases and Eµ-myc lymphomas. Each column shows group-specific upregulated gene sets.
The color code denotes analyses of each CCC group against the rest. NES normalized enrichment score.
NATURE COMMUNICATIONS | (2020)11:3651 | https://doi.org/10.1038/s41467-020-17467-z | www.nature.com/naturecommunications 3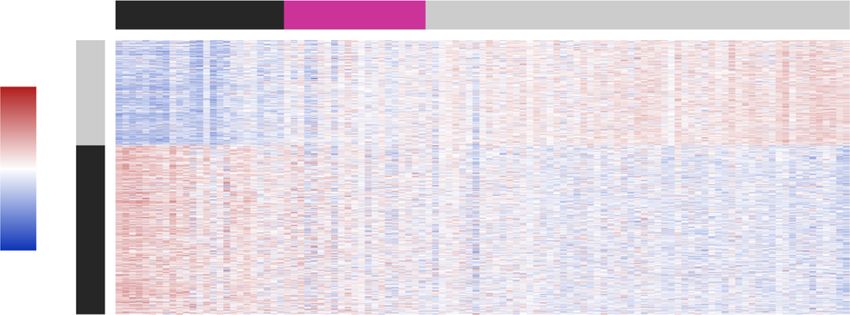
ARTICLE                                                                 NATURE COMMUNICATIONS | https://doi.org/10.1038/s41467-020-17467-z

and that culminates, if no cure is achieved, in a progressive                remissions from those failing therapy (Supplementary Fig. 2b).
shortening of response durations, ultimately leading to full-blown           Next, we selected genes which were commonly upregulated in
chemoresistance (“RES”; Fig. 1a).                                            matching response groups (i.e., progressors vs. nonprogressors)
                                                                             in both species. These genes were subsequently applied to the
                                                                             outcome-annotated expression data of murine and human lym-
DLBCL classifiers delineate corresponding murine subgroups.
                                                                             phomas, and two top-clusters (cluster 1 and 2) were identified in
Transcriptome analyses unveiled two distinct cell-of-origin
                                                                             each species by hierarchical cluster analysis (Fig. 2a, b; grey and
(COO) signatures in DLBCL, representing a germinal center B-
                                                                             black bars). These clusters were significantly correlated with the
cell (GCB) and an activated B-cell (ABC) subtype6,8, with an
                                                                             respective response groups (Fig. 2a, b; colored bars and Supple-
inferior outcome consistently reported for the ABC subtype in
                                                                             mentary Fig. 2c, d). Strikingly, the two clusters sharply separated
many trials applying CHOP or R-CHOP regimens to DLBCL
                                                                             both CTX-exposed Eµ-myc lymphomas for significantly different
patients8. We previously recapitulated COO-related differences in
                                                                             TTR (Fig. 2c), and R-CHOP-treated DLBCL patients regarding
NF-κB activity in Eµ-myc lymphomas27,39. To enhance statistical
                                                                             their progression-free and overall survival (PFS and OS, respec-
robustness and to increase biological diversity, we combined GEP
                                                                             tively; Fig. 2d). Hence, individual transcriptome data linked to
data from our 39 primary lymphomas with a published GEP set
                                                                             clinical response information can be utilized to generate gene
obtained from 115 additional primary Eµ-myc lymphomas40,
                                                                             stratifiers that discriminate good from poor risk lymphomas
comprising a total of 154 samples. Using principal component
                                                                             across species. However, transcriptome-based data not linked to
analysis and the murine homologue of a human gene classifier
                                                                             functional biological insights may not suffice to decipher the
built to distinguish DLBCL from Burkitt’s lymphoma (BL)41, we
                                                                             contribution of distinct treatment effector principles, especially
first verified that Eµ-myc lymphomas share transcriptional fea-
                                                                             cellular senescence, in long-term outcome after anticancer
tures with DLBCL and are distinct from molecular BL (Fig. 1c).
                                                                             therapies.
Based on cardinal molecular features of the respective COO
subtypes and applying the linear predictor score (LPS) classifi-
cation method presented by the Staudt group for DLBCL42, we
                                                                             Probing drug-induced senescence in the Eµ-myc lymphoma
developed a 21-gene murine version of the human 25-gene
                                                                             model. Accordingly, we seek here to specifically address senes-
classifier, which was instrumental to recognize distinct Eµ-myc
                                                                             cence as a drug-evoked response program, to link its genetic
lymphoma subtypes, i.e., a GCB-like, an ABC-like and a third,
                                                                             underpinnings to transcriptome-informed outcome data in
unclassified group with ABC/GCB-overlapping features (Supple-
                                                                             murine and human lymphoma settings, and to develop predictors
mentary Fig. 1c). Importantly, TTR stratified by the GCB-like vs.
                                                                             of the senescence contribution to patient survival. Starting from a
ABC-like COO status of SENS lymphomas demonstrated a sig-
                                                                             mouse model platform with defined senescence-compromising
nificantly superior long-term outcome to CTX in the GCB-like
                                                                             gene defects, primary Eµ-myc transgenic LC, stably over-
arm, thereby recapitulating the predictive role of the COO status
                                                                             expressing Bcl2 (as naturally detected at high levels in many
in human DLBCL8 (Fig. 1d). Thus, Myc-driven mouse lympho-
                                                                             lymphomas including DLBCL15) to block drug-induced apopto-
mas comprise biological features that resemble human GCB- and
                                                                             sis, enter TIS in vitro and in vivo, if senescence-essential gene loci
ABC-type DLBCL, in which high-level Myc expression is also a
                                                                             such as Suv39h1 or p53 alleles were not deleted22,25,28 (Fig. 3a,
prominent and widely detectable feature13,43.
                                                                             Supplementary Fig. 3a, b). When investigated in a trial-like
   Additional transcriptional DLBCL heterogeneity with asso-
                                                                             fashion in the absence of an intact apoptotic response, we
ciated distinct functional biological properties, albeit not
                                                                             observed a dramatically shortened OS of the mouse cohort
necessarily different outcomes to standard therapy, was captured
                                                                             bearing senescence-incapable Suv39h1-deficient (hereafter refer-
in the “comprehensive consensus cluster (CCC)” classification by
                                                                             red to as Suv39h1−) lymphomas, thereby suggesting a critical role
the Shipp group44. Hence, we asked whether the CCC subtypes
                                                                             for TIS in the long-term outcome to therapy (Fig. 3b).
“B-cell receptor (BCR)/proliferation” signaling, “oxidative phos-
                                                                                Next, we asked whether senescence would also affect outcome
phorylation (OxPhos)” metabolism, and “host response (HR)”
                                                                             when Bcl2 is not exogenously overexpressed. Importantly, non-
immunology would also be applicable to primary Eµ-myc
                                                                             Bcl2-engineered Suv39h1− LC presented—like control lympho-
lymphomas, separating them into these three distinct subclasses
                                                                             mas, but different from apoptosis-compromised p53null lym-
as well. Using a three-class extension of the LPS method on the
                                                                             phomas—with exquisite apoptotic drug sensitivity, thus
Eµ-myc GEP data, this was indeed the case (Supplementary
                                                                             highlighting their selective senescence defect while apoptosis
Fig. 1d). Remarkably, CCC class-specific upregulated gene sets,
                                                                             remains intact (Supplementary Fig. 3c). Accordingly, mice
selected by GSEA in human DLBCL comparing each subgroup
                                                                             harboring Suv39h1-deficient or proficient lymphomas typically
against the other two, were similarly enriched in the Eµ-myc
                                                                             entered a clinical CR in response to a single administration of
model (Fig. 1e; DLBCL vs. Eµ-myc patterns in each of the three
                                                                             CTX in vivo (i.e., all mice presented tumor-free at time-point 0
CCC subtypes). In essence, Eµ-myc transgenic lymphomas are
                                                                             post CTX; Fig. 3c). Interestingly, when we examined three
molecularly heterogeneous and share prominent biological
                                                                             lymphoma compartments—the bone marrow (BM), the LN and
features related to distinct subclasses of human DLBCL,
                                                                             the spleen (SP)—with respect to potentially remaining LC by Eµ-
suggesting their suitability as a faithful functional model for
                                                                             myc transgene-specific polymerase chain reaction (PCR) in a
certain features of the corresponding human disease.
                                                                             “minimal residual disease (MRD)”-like analysis 10 days after
                                                                             CTX, we found most of the control lymphoma mice-derived
Molecular data possess predictive power across species. We                   samples still positive, while none of the probes of the Suv39h1−
further sought to determine whether a strictly outcome-based                 group produced an MRD signal (Fig. 3d). Spleen sections were
(i.e., COO- or CCC-agnostic) DLBCL signature might also be                   obtained to visualize remaining LC in situ, and unveiled much
predictive for Eµ-myc lymphomas and vice versa. We first ana-                 smaller islands of persistent cells in the Suv39h1− cohort (Fig. 3e).
lyzed GEP data from our 39 primary SENS Eµ-myc lymphomas,                    Though, the vast majority of these cells scored Ki67+/H3K9me3−
and utilized the most strongly differentially expressed genes to             by co-immunostaining—in stark contrast to the virtually Ki67-
separate curable (i.e., NR) from relapsing (i.e., RP) lymphomas              negative but H3K9me3-positive, hence, senescent splenic lym-
(Supplementary Fig. 2a). A similar approach was used to distin-              phoma residues in the control group, indicating not only a
guish at diagnosis DLBCL patients that achieved lasting                      massive drop in overall tumor burden, but an important

4                NATURE COMMUNICATIONS | (2020)11:3651 | https://doi.org/10.1038/s41467-020-17467-z | www.nature.com/naturecommunications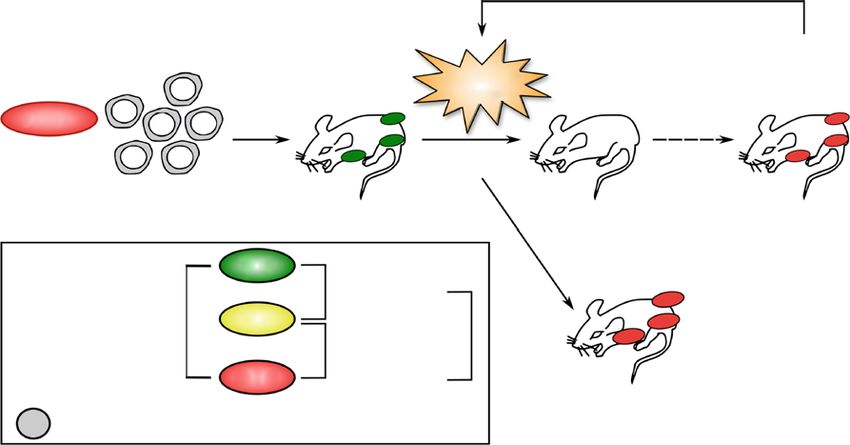
NATURE COMMUNICATIONS | https://doi.org/10.1038/s41467-020-17467-z                                                                                            ARTICLE

    a                              Mouse                                         c
                                                                                                        1.00

                                                                Cluster                                 0.75

                                                                                 Tumor-free (%)
                                                                Response
                                                                Cluster                                                                                     Cluster 1
                                                                                                        0.50                                                Cluster 2
                                                                      1
                                                                      2
                                                                                                        0.25

                                                                   Response
                                                                                                        0.00       p = 6.814558e–14
                                                                      NR
                                                                                                               0                25         50          75               100
                                                                      RP
                                                                                                                                        Time (days)

                                                                                 d
                                                                                                        1.00
                                                                                                                                                            Cluster 1
                                                                                                                                                            Cluster 2

                                                                                 Progression-free (%)
                                                                                                        0.75

                            –3 –2 –1 0 1 2 3
                                                                                                        0.50
    b                          Human
                                                                                                        0.25

                                                                                                        0.00         p = 6.684597e–07
                                                          Cluster
                                                          Response
                                                          Cluster
                                                               1                                        1.00
                                                                                                                                                            Cluster 1
                                                               2
                                                                                                                                                            Cluster 2
                                                                                                        0.75
                                                          Response
                                                                                 Alive (%)

                                                              No progression
                                                                                                        0.50
                                                              progression

                                                                                                        0.25

                                                                                                        0.00       p = 6.092808e–07
                                                                                                               0.0                2.5           5.0           7.5
                                                                                                                                        Time (years)
                         –4 –2     0    2   4

Fig. 2 DLBCL and Eµ-myc lymphoma share predictive genes sets. a Heatmap of 39 primary Eµ-myc lymphomas based on genes being commonly
differentially expressed in non-progressing vs. relapsing DLBCL patients. b Same as in (a), but for 470 DLBCL patients (GSE31312). Eµ-myc lymphomas
and DLBCL patients were separated into two clusters by hierarchical clustering using Pearson’s distance correlation and complete linkage. Because of little
very high and very low z-scores, they were restricted to the interval [−5,5] after hierarchical clustering for presentation purposes only. c Tumor-free
survival of CTX-treated Eµ-myc lymphomas stratified by two hierarchical clusters (ncluster 1 = 34, ncluster 2 = 42) as shown in (a). Two mice per lymphoma
were used. d Progression-free and overall survival of R-CHOP-treated DLBCL patients stratified by the two hierarchical clusters as shown in (b) (ncluster 1 =
297, ncluster 2 = 173).

qualitative state switch of the remaining Suv39h1-proficient LC                  senescence on the cellular level of control tumors, whose nature
(Fig. 3e). Matching the day-10 MRD data, mice of the Suv39h1−                   might be stochastic or controlled by yet to-be-determined
group scanned by whole-body luciferase imaging regarding their                  regulators. Importantly, when we compared clinical outcome in
tumor burden presented with virtually no remaining lymphoma                     the absence of an apoptotic block, mice bearing Suv39h1-deficient
load, while control lymphoma-bearing mice produced positive                     lymphomas had a much shorter TTR and a much higher fraction
signals at this time-point (Fig. 3f and Supplementary Fig. 3d).                 of lymphomas that relapsed within the observation period of
However, as shown for a day-30 comparison, Suv39h1−                             100 days (Fig. 3c). Thus, we conclude that cellular senescence
lymphomas rapidly progressed out of this complete molecular                     critically contributes to the long-term outcome after chemother-
response (i.e., below-detectability) situation, whereas mice of the             apy in both apoptotically compromised and competent lym-
control group rather turned, with slow kinetics, luminescence                   phoma settings.
imaging-negative (Fig. 3f, Supplementary Fig. 3d), thereby
pointing toward a potential clinical pitfall when utilizing MRD
or imaging diagnostics in a certain time slot of a senescence-                  Cross-species investigation of the H3K9 senescence relay.
dominated residual tumor load (further in line with the                         While the histone methyltransferase Suv39h1 operates as an
previously reported and equally unanticipated strong glucose                    essential mediator of OIS and TIS in mouse lymphoid
avidity of robustly growth-terminated senescent lymphoma-                       cells23,25,28,34, other H3K9-active methyltransferases may com-
bearing mice by positron emission tomography25). The data also                  pensate for loss of this moiety in different tissues and species.
imply a competition between the execution of apoptosis or                       Given the central role of the H3K9me3 mark in senescence, we

NATURE COMMUNICATIONS | (2020)11:3651 | https://doi.org/10.1038/s41467-020-17467-z | www.nature.com/naturecommunications                                                      5
ARTICLE NATURE COMMUNICATIONS | https://doi.org/10.1038/s41467-020-17467-z
a control;bcl2 Suv39h1¯;bcl2 b
1.00
control;bcl2
IHC GFP IHC GFP
Suv39h1¯;bcl2
83.8% ± 8.7 83.7% ± 7.8 0.75
Alive (%)
Ki67
0.50
untreated
0.25
11.7% ± 12.0 14.2% ± 11.1
H3K9me3
0.00 p = 4.479478e–11
0 30 60 90
Time (days)
32.7% ± 4.5 73.3% ± 7.1 c 1.00
control
Ki67
Suv39h1¯
0.75
Tumor-free (%)
5d CTX
0.50
51.4% ± 21.0 22.5% ± 7.1
H3K9me3
0.25
0.00 p = 0.0021
0 25 50 75 100
Time (days)
d untreated 10d CTX 10d CTX 10d CTX e
BM LN SP BM LN SP BM LN SP BM LN SP
Eμ-myc control Suv39h1¯
control
α-Tubulin 7.3% ± 2.5 56.8% ± 8.1
Eμ-myc
B220/Ki67
Suv39h1¯
α-Tubulin
f untreated 10d CTX 30d CTX
control
82.0% ± 9.4 6.5% ± 3.3
B220/H3K9me3
Suv39h1¯
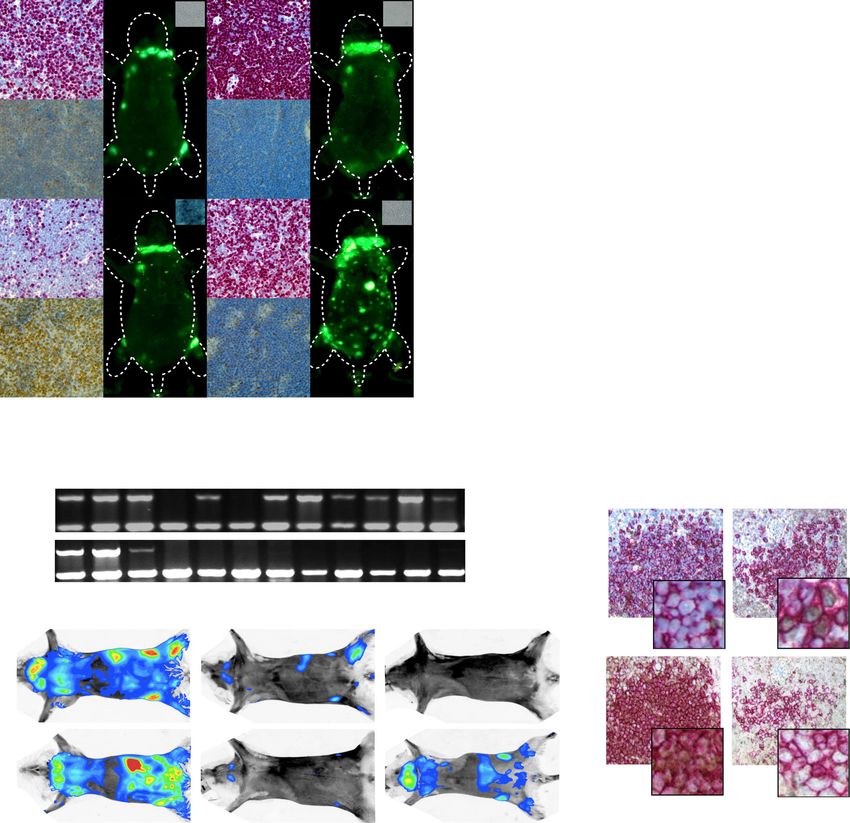
Fig. 3 Defective senescence but intact apoptosis accounts for temporarily deeper responses of Suv39h1-deficient lymphomas. a Ki67, SA-β-gal activity
and H3K9me3 IHC analyses of lymphoma sections, plus whole-body fluorescence scans of mice bearing GFP-tagged control;bcl2 or Suv39h1−;bcl2
lymphomas. Results show mean percentages of cells positive for the respective markers in situ after a 5-day CTX exposure or those that remained
untreated ± s.d. (n = 3 technical replicates per group). b Overall survival of mice bearing Suv39h1−;bcl2 (n = 21, red line) or control;bcl2 (n = 24, black line)
lymphomas after CTX treatment. c Tumor-free survival (i.e., TTR) of mice bearing Suv39h1− (n = 18, red line) or control (n = 27, black line) lymphomas
after CTX treatment. d Eµ-myc transgene-specific PCR in Suv39h1- and control Eµ-myc lymphomas prepared from bone marrow (BM), lymph-node (LN), or
spleen (SP) from untreated mice (as a positive control) and 10 days after CTX treatment. Shown are analyses in mice bearing n = 8 individual lymphomas.
Original photomicrographs are presented in Supplementary Fig. 7. e Spleen sections stained for Ki67 and H3K9 in B220-positive lymphomas from
Suv39h1− or control mice. Numbers indicate mean percentages of cells positive for the respective marker in situ 10 days after CTX administration ± s.d.
(shown are representative photomicrographs of n = 3 biological replicates per group). f Representative whole-body luciferase imaging of mice harboring
Suv39h1− vs. control lymphoma (not bcl2-engineered) before treatment as well as 10 and 30 days after CTX treatment (n = 3 biological replicates per
group [see also Supplementary Fig. 3d]). All scale bars in this figure represent 50 µm.
therefore asked, in turn, whether overexpression of two structurally inactivation of Suv39h1, resulted in sharply reduced levels of the
unrelated H3K9me3-active demethylases, namely LSD1 (a.k.a. H3K9me3 mark and the senescence-associated cyclin-dependent
AOF2 or KDM1A) and JMJD2C (a.k.a. GASC1 or KDM4C), kinase inhibitor p16INK4a by immunoblot analysis, and impaired
which we recently found to cancel OIS in melanomagenesis45, ADR-induced senescence in vitro, while leaving drug-induced
and which were detected at elevated levels in numerous tumor DNA damage response signaling via γ-H2AX and serine-18-
entities46–51, might also counter TIS. Stable transfer of LSD1 and phosphorylated p53 (p53-P-Ser18) intact (Fig. 4a, Supplementary
JMJD2C genes into control;bcl2 lymphomas, similar to Fig. 4a), resulting in demethylase-unaffected apoptotic death in
6 NATURE COMMUNICATIONS | (2020)11:3651 | https://doi.org/10.1038/s41467-020-17467-z | www.nature.com/naturecommunicationsNATURE COMMUNICATIONS | https://doi.org/10.1038/s41467-020-17467-z ARTICLE
a b untreated CTX
control LSD1 JMJD2C Suv39h1– 1.8% ± 0.9 81.9% ± 16.8
ADR – + – + – + – +
control
γ-H2AX
p53-P-Ser18
p53
4.0% ± 3.8 25.4% ± 21.8
JMJD2C
p16
H3K9me3
LSD1
JMJD2C 2.5% ± 1.6 26.2% ± 12.3
α-Tubulin
LSD1
c 1.00
d
control;bcl2
untreated CTX CTX + 2-PCPA-1a
H3K9-active demethylases
JMJD2C;bcl2
0.75 LSD1;bcl2 1.9% ± 0.7 56.0% ± 14.1 91.3% ± 2.7
high
Alive (%)
*
0.50 *
0.25 2.8% ± 1.1 86.4% ± 8.9
0.00 p = 2.418601e–05 low
0 25 50 75 100
Time (days)
e f R-CHOP (elderly patients)
1.00 above median 1.00 above median
below median below median
Progression-free (%)
0.75
Tumor-free (%)
0.75
0.50 0.50
0.25 0.25
0.00 p = 0.0011 0.00 p = 0.013
0 25 50 75 100 0 2 4 6 8
Time (days) Time (years)
g 1.00
h 1.00
above median above median
below median below median
Tumor-free (%)
0.75 0.75
Alive (%)
0.50 0.50
0.25 0.25
0.00 p = 0.056 0.00 p = 0.026
0 25 50 75 100 0 5 10 15 20
Time (days) Time (years)
non-Bcl2-protected lymphomas (Supplementary Fig. 4b). As β-gal activity reached much higher levels in ADR-exposed LSD1;
observed for mice bearing Suv39h1−;bcl2 lymphomas, those bcl2 lymphomas if co-treated with the LSD1 inhibitor 2-PCPA-1a
carrying control;bcl2 lymphomas engineered to stably over- in vitro (Supplementary Fig. 4d), similarly to the high SA-β-gal
express either LSD1 or JMJD2C presented with very modest activity induced by CTX exposure under 2-PCPA-1a co-
senescence induction, no significant enhancement of the treatment in vivo (Fig. 4d).
H3K9me3-positive cell fraction, and a dramatically shortened OS Next, we tested whether treatment responsiveness of Myc-
after CTX therapy when compared to the respective vector con- driven control lymphomas that formed in the absence of any
trol group, thus further underscoring the importance of an engineered H3K9me3-erasing moiety would relate to their
effective H3K9me3-governed senescence response for long-term endogenous H3K9 demethylase expression status. To investigate
disease control (Fig. 4b, c, Supplementary Fig. 4c). Moreover, SA- this, we focused on genes with H3K9-specific histone demethylase
NATURE COMMUNICATIONS | (2020)11:3651 | https://doi.org/10.1038/s41467-020-17467-z | www.nature.com/naturecommunications 7ARTICLE NATURE COMMUNICATIONS | https://doi.org/10.1038/s41467-020-17467-z
Fig. 4 The H3K9me3 mark operates as a central, outcome-relevant senescence relay. a Western blot analysis of senescence-related proteins in Bcl2-
protected LSD1- or JMJD2C-overexpressing, Suv39h1-deficient and control lymphomas after 5 days of ADR treatment in vitro or left untreated. Samples
are representative of each genotype (n > 3). Original photomicrographs are presented in Supplementary Fig. 8. b Lymphoma sections of CTX-treated mice
bearing Bcl2-protected JMJD2C- or LSD1-overexpressing vs. control lymphomas stained for SA-β-gal. Numbers indicate mean percentages of cells
positive ± s.d. (shown are representative photomicrographs of biological replicates, n = 4 primary lymphomas for control;untreated, n = 5 for control;CTX,
n = 3 for LSD1;untreated, n = 4 for LSD1;CTX, n = 4 for JMJD2C;untreated, n = 4 for JMJD2C;CTX). c Overall survival (OS) in CTX-treated mice bearing
Bcl2-protected JMJD2C (n = 11, orange line)-, LSD1 (n = 10, blue line)-overexpressing or control (n = 14, black line) lymphomas. d Tumor sections of CTX-
or CTX-plus-2-PCPA-1a-treated mice bearing lymphomas with low or high H3K9-active demethylases (GO:0032454) expression levels stained for SA-β-
gal. Numbers indicate mean percentages of cells positive ± s.d. (shown are representative photomicrographs of n = 3 biological replicates per group). “*”
represents statistical significance by unpaired t test, p = 0.0129 (high;CTX vs. high;CTX + 2-PCPA-1a) or p = 0.0339 (high;CTX vs. low;CTX). e Tumor-
free survival of CTX-treated mice stratified by median expression of genes that belong to the GO term “histone demethylase activity (H3-K9 specific)”
(GO:0032454). Two mice per lymphoma were used. Above median: n = 37 (black line), below median: n = 39 (grey line). f Progression-free survival (PFS)
of elderly (>63 years; with their aged and presumably more senescence-prone lymphoma cells) R-CHOP-treated DLBCL patients (GSE31312) stratified as
in (e). Above median: n = 116 (black line), below median: n = 117 (grey line). g Tumor-free survival of CTX-treated mice bearing Eµ-myc lymphomas with
high (n = 28, black line) or low (n = 31, grey line) levels of the H3K9me3 mark. h OS of R-CHOP-treated DLBCL patients bearing lymphoma with high (n =
18, black line) or low (n = 17, grey line) levels of the H3K9me3 mark. All scale bars in this figure represent 100 µm.
activity (GO:0032454). Indeed, we found TIS much weaker in as an approximation to their senescence susceptibility (Fig. 5b;
control lymphomas with globally high expression levels of H3K9- using the LPS classifier method and the in vitro-TIS dataset
active demethylases, while the senescence response, and, accord- (Fig. 5a) as training data). Although TIS manifests with slow
ingly, the fraction of H3K9me3-positive cells detected by kinetics as a full-featured biological condition in response to
immunostaining could be restored to an extent otherwise seen DNA-damaging therapy, we hypothesized that early, albeit subtle
in low-level H3K9 demethylase expressers by treatment with the senescence-reminiscent molecular changes might already become
LSD1 inhibitor 2-PCPA-1a in vivo (Fig. 4d, Supplementary detectable within hours after drug exposure. Indeed, GSEA
Fig. 4e). Moreover, a high endogenous H3K9 demethylase status, highlighted the proximity of 4-h-CTX-in vivo-challenged senes-
among others composed of LSD1 and JMJD2C expression levels, cence-capable Eµ-myc lymphomas without Bcl2 protection and
not only predicted senescence restoring-susceptibility to the LSD1 5d-ADR-in vitro-senescent bcl2-engineered lymphomas based on
inhibitor 2-PCPA-1a but equally to the JMJD2 inhibitor IOX1, similar ES of a large number of common gene sets in their
while neither inhibitor enhanced ADR-inducible senescence in expression profiles (Fig. 5c). If TIS contributes to superior long-
lymphomas with low endogenous H3K9me3 demethylase status term outcome, we further suspected that senescence inducibility
(Supplementary Fig. 4f). Notably, mice harboring individual might be more profound in curable lymphomas at diagnosis and
lymphomas with global H3K9 demethylases expression above selected against in relapsed lymphomas. Hierarchical cluster
median presented with a significantly shorter TTR (Fig. 4e). analysis from our clinical trial-like mouse model based on 4-hour-
Remarkably, when probing the transcriptome datasets of DLBCL CTX administration in vivo further supported our hypothesis that
patients for the humanized version of this H3K9 demethylase RES lymphomas were predicted to have a senescence-incapable
stratifier, a significantly shorter PFS was unveiled in elderly phenotype (Supplementary Fig. 5; note virtually no overlapping
DLBCL patients if H3K9 demethylases were expressed above red- and black-labeled cases). Importantly, when applying the LPS
median in their lymphoma samples (Fig. 4f). Since we expected classifier as a TIS score, we found RES lymphomas, unlike the
the activities of LSD1, JMJD2C and related demethylases to SENS lymphoma groups, to be strongly skewed toward a Suv39h1-
converge at the H3K9me3 mark, we explored the deficient, hence, senescence-defective pattern in response to the 4-
H3K9me3 status in situ as a putative biomarker of long-term h CTX challenge in vivo (Fig. 5d). Strikingly, when we next
outcome to treatment. Indeed, both the Eµ-myc cohort and classified each individual lymphoma in the CTX-exposed condi-
DLBCL patients with high H3K9me3 expression in their tion as either a “senescence responder” (TIS score > 0.8), a
lymphoma sections exhibited a significantly better long-term “senescence non-responder” (TIS score < 0.2) or “unclassifiable”
outcome to therapy when compared to those with H3K9me3 (0.8 ≤ TIS score ≥ 0.2), the LPS/TIS score unveiled a significantly
detectability below median (Fig. 4g, h). Hence, our data highlight superior long-term outcome (TTR) for yet-to-be-treated lym-
TIS as an H3K9me3-governed outcome-improving drug effector phomas belonging to the senescence responder group (Fig. 5e).
mechanism first discovered and functionally dissected in murine Moreover, our cross-species strategy also linked the GCB subtype
lymphomas, and subsequently confirmed in human large B-cell of DLBCL samples at diagnosis, i.e. prior to any drug encounter, to
lymphomas. Moreover, the endogenous H3K9 demethylase a set of TIS-upregulated genes, thereby matching our previous
genetics of DLBCL imply that different baseline expression levels experimental observation of a particularly strong TIS capacity in
of the H3K9me3 mark as a readout of alterations acquired during GCB-like and Bcl2-overexpressing, but not in ABC-like Eµ-myc
lymphomagenesis prior to any drug encounter may serve as a lymphomas with their enrichment of “TIS down-regulated” and
predictive biomarker of long-term outcome to therapy. proliferation-associated gene sets27 (Fig. 5f). Intriguingly, the more
senescence-prone GCB subtype also appeared to be tran-
Senescence impairment plays a role in treatment failure. To scriptionally skewed toward an adult tissue stem cell (ATSC)
approach our ultimate goal of a TIS-focused genetic predictor in signature in both murine and human lymphomas, thereby
lymphoma, we defined an in vitro-senescence signature based on expanding on our recently reported finding on senescence-
genes being differentially expressed between ADR-senescent associated stemness in DLBCL28. Thus, early molecular changes
control;bcl2 vs. equally ADR-exposed Suv39h1−;bcl2 and, hence, detectable in response to CTX treatment seem to anticipate a later
senescence-incapable, or untreated Bcl2-infected lymphomas biologically fully established senescence response.
(Fig. 5a). Next, we probed whether RES lymphomas typically
present with a molecular senescence defect by applying the in “SUVARness” predicts long-term outcome in mice and men.
vitro-senescence signature to our clinical trial-like mouse cohort Finally, we sought to utilize senescence-related transcript
8 NATURE COMMUNICATIONS | (2020)11:3651 | https://doi.org/10.1038/s41467-020-17467-z | www.nature.com/naturecommunicationsNATURE COMMUNICATIONS | https://doi.org/10.1038/s41467-020-17467-z ARTICLE
a b 100
Probability [%]
80
60
Treatment proliferating
40
TIS
Genetics 20
Phenotype 0
Treatment
ADR
native
4
Genetics 2
0
Suv39h1 WT
–2
Suv39h1– –4
SuvER
SuvER/4OHT
Phenotype
proliferating c TIS in vitro 4h CTX in vivo
TIS
Signature
G2/M Transition
TIS up Cell cycle
G1/S Transition
–4 –2 0 2 4 TIS down HALLMARK_E2F_TARGETS
d 1.00 p < 0.0001
KANNAN_TP53_TARGETS_UP
0.75
TIS Score
NF−kappa B signaling pathway
FRIDMAN_SENESCENCE_UP
0.50 SASP
0.25
0.00 –4 –2 0 2 4
CTX NR CTX RP CTX RES native NR native RP native RES
e 1.00
f
Non-responder
Responder 2
Unclassified
Tumor-free (%)
0.75 1
NES
0.50 0
–1
DLBCL
0.25
–2 Eμ-myc
0.00 p = 0.00096
up
n
s
SC
C
B
et
w
C
AB
do
rg
S
AT
G
0 25 50 75 100 TI
ta
S
TI
F
Time (days)
E2
Fig. 5 Senescence defects account for treatment failure. a Heatmap of differentially expressed genes (p value < 0.01, log-FC > 1) comparing in vitro-ADR-
treated control;bcl2 or ADR/4OHT-double-treated Suv39h1:ER;bcl2 senescent (TIS) to ADR-treated Suv39h1− or Suv39h1:ER;bcl2 senescence-incapable,
or untreated non-senescent lymphomas (collectively 47 lymphomas). b Heatmap and associated probability of TIS (black line) vs. no senescence (i.e.,
proliferating, grey line) in CTX-treated lymphomas based on LPS classification using data in (a), which had 85.1% overall accuracy in a tenfold cross
validation of the in vitro-training data. c Heatmap of GSEA Normalized Enrichment Scores (NES) compiled of overall 47 5d ADR-in vitro-treated senescent
control;bcl2 lymphomas vs. non-senescent untreated and Suv39h1−;bcl2 or non-4OHT-exposed Suv39h1:ER;bcl2 senescence-incapable lymphomas
compared to 54 4 h-in vivo-CTX-treated vs. 55 untreated lymphomas. Clustering was performed using Euclidean distance. Senescence-related gene sets
are shown, some of them specifically indicated70. d Probability of a TIS phenotype according to the LPS classification (cf. panel b, black line) of 4 h-CTX-
treated or untreated lymphomas belonging to the indicated response groups (n = 20 CTX NR, n = 19 CTX RP, n = 15 CTX RES, n = 20 native NR, n = 19
native RP, n = 16 native RES). Higher TIS scores represent a stronger senescence likelihood, while lower scores indicate a proliferating phenotype. Box-and-
whisker plot showing the median (black line inside the box), upper and lower quartile (box edges), minima and maxima (whiskers), and outliers (dots). The
p value was calculated using the Kruskal–Wallis rank-sum test. e Tumor-free survival (TTR) of mice bearing senescence responder (TIS score > 0.8; n =
42), non-responder (TIS score < 0.2; n = 38) or unclassified (0.8 ≤ TIS score ≥ 0.2; n = 22) Eµ-myc lymphomas as determined from the LPS classification
(based on the TIS status in the 4 h-CTX-exposed condition [cf. panel d]). Two mice per lymphoma were used. f GSEA NES results comparing ABC-like to
GCB-like subtypes in DLBCL patients (ABC/GCB training set from GSE10846, n = 150) and Eµ-myc lymphomas (dataset as used in Fig. 1, ABC/GCB
classified, n = 95).
information obtained in untreated lymphoma samples as a tool to composed here as a transcriptional signature), consisting of TIS
predict long-term outcome. Specifically, we generated a signature upregulated genes, thus marking the conceptual opposite of the
named “SUVARness” (in scientific proximity to the term senescence-compromising Suv39h1 deficiency in lymphoma
“BRCAness” invented for BRCA1/2 wild-type tumors that share (Fig. 5a). We found this gene set strongly enriched in TIS control;
molecular features of BRCA-mutant malignancies52, albeit bcl2 compared to proliferating mouse lymphomas in vitro
NATURE COMMUNICATIONS | (2020)11:3651 | https://doi.org/10.1038/s41467-020-17467-z | www.nature.com/naturecommunications 9ARTICLE NATURE COMMUNICATIONS | https://doi.org/10.1038/s41467-020-17467-z
a
FDR = 0.0053 0.2 FDR = 0.036 FDR = 0.0041 FDR = 0.013
0.75
NES = 4.5 NES = 1.3 NES = 2.5 NES = 3.1
Human in vivo (ES)
Human in vivo (ES)
Mouse in vitro (ES)
Mouse in vivo (ES)
0.4 0.4
0.50 0.1
0.25 0.2 0.2
0.0
0.00
TIS proliferating 0.1 NR RP 0.0 0.0
cured relapsed cured relapsed
0 10,000 20,000 0 10,000 20,000 0 10,000 20,000 0 10,000 20,000
Position in Gene List Position in Gene List Position in Gene List Position in Gene List
b 1.00
c 1.00
above median above median
below median below median
Progression-free (%)
Tumor-free (%)
0.75 0.75
0.50 0.50
0.25 0.25
0.00 p = 0.00018 0.00 p = 0.0015
0 25 50 75 100 0.0 2.5 5.0 7.5 10.0
Time (days) Time (years)
d e
1.00 4 79% 5y PFS PFS p = 0.002 49% 5y PFS
0.75
2
Alive (%)
NES
0.50
0
0.25
above median
below median 2
0.00 p = 0.00015
0 3 6 9 C0 C1 C4 C2 C3 C5
Time (years) Molecular DLBCL cluster subsets
f 100
Stratified by the
myc
Progression-free survival (%)
humanized murine classifier
75
50
25
0 +/– defined genetic defect
0 2.5 5.0 7.5
Time (years) Suv39 or
Cross-species analysis of
Functional interrogation of
clinically/molecularly co-annotated
genetically defined tumors
human dadasets
100
Stratified by a Anticancer
murine classifier therapy myc
Overall survival (%)
80
60
40
20
0
0 20 40 60 80 100 120
Time (years)
Clinical trial-like investigation of genetically unmanipulated primary tumors
(Fig. 6a, first panel), and, likewise, strongly up in treatment-naïve gene list to the enrichment score [ES] profile peak position),
NR Eµ-myc lymphomas in vivo (Fig. 6a, second panel), as well as consisting of 22, notably largely proliferation-independent and
in newly diagnosed DLBCL samples of two independent cohorts partly cell–cell/host immune interaction-relevant genes
of patients who achieved lasting remissions, when being com- (Table S1), which might serve as a biomarker that anticipates
pared to RP mouse or human relapsed/refractory lymphomas, treatment outcome (Fig. 6a). Accordingly, stratification of SENS
respectively (Fig. 6a, right panels). Based on these GSEA analyses, Eµ-myc lymphoma based on the average expression of this core
we defined a “core SUVARness” signature, commonly present in SUVARness signature predicted tumor-free survival, whereby
these GSEA’s leading edges (i.e., the region from the top of the mice bearing lymphomas with high-level expression experienced
10 NATURE COMMUNICATIONS | (2020)11:3651 | https://doi.org/10.1038/s41467-020-17467-z | www.nature.com/naturecommunicationsNATURE COMMUNICATIONS | https://doi.org/10.1038/s41467-020-17467-z ARTICLE
Fig. 6 The SUVARness gene signature is predictive for treatment outcome in DLBCL. a GSEA profiles of TIS up-regulated (SUVARness) genes as shown
in Fig. 5a probing Eµ-myc;bcl2 lymphomas TIS vs. untreated in vitro (outer left), SENS Eµ-myc lymphomas NR vs. RP (left), and DLBCL patients cured vs.
relapsed in two cohorts (GSE31312, GSE98588; right). b Tumor-free survival in SENS Eµ-myc lymphomas stratified by average expression levels (n = 38
each arm) of the 22 core SUVARness genes (cf. Table S1) commonly selected from the GSEA leading edges (region from the top of the gene list to the
enrichment score profile peak position) in (a). c Same as in (b), applying a fully humanized version of the core SUVARness classifier, showing PFS of R-
CHOP-treated DLBCL patients (GSE98588). Above median: n = 49 (black line), below median: n = 47 (grey line). d OS for patients stratified as in (c).
e GSEA results of core SUVARness-regulated genes in the recently reported newly defined molecular DLBCL cluster subtypes C0–C5 (ref. 14), comparing
each cluster vs. the others. According to Chapuy et al., patients in clusters C0/C1/C4, here marked as SUVARness-enriched, had a significantly better PFS
compared to patients in clusters C3/C5 (ref. 14). n = 137 (n = 6 C0, n = 29 C1, n = 32 C1, n = 28 C3, n = 21 C4, n = 21 C5). f Circular workflow of functional
interrogations in mouse models of cancer harboring defined genetic lesions, investigation of genetically unmanipulated mouse tumors in a clinical trial-like
setting in vivo, and cross-species application of the genetic determinants of novel biological functions and intervention-evoked dynamic state switches
learned therein in corresponding human cancer patient cohorts.
superior survival (Fig. 6b). Cross-species application of a huma- (C1), and elevated RAS/BRAF/MEK signaling (C4), while p53,
nized version of the core SUVARness senescence classifier to the INK4a/ARF, or Rb inactivation reflect senescence-incapable
treatment-naïve transcriptome datasets of two independent genotypes in the SUVARness-negative cluster 2 (ref. 22). Fur-
human cohorts comprising several hundreds of R-CHOP-treated ther senescence-focused investigations are needed regarding the
DLBCL patients also marked a much better PFS and OS of the role of MyD88–L265P mutations as one of the leading lesions in
higher-expressing half of these patients (Fig. 6c, d, Supplementary cluster 5 (C5), and the position of cluster C3, a strongly GCB
Fig. 6a, b). This was further validated in two independent CHOP- subtype-enriched cluster with frequent IgH enhancer/bcl2 trans-
treated DLBCL cohorts (Supplementary Fig. 6c, d). In essence, locations, the constellation for which we previously showed the
our results highlight the power of the Eµ-myc transgenic mouse NF-κB-hyperactive subset to be associated with senescence sus-
lymphoma model to unveil the importance of senescence, namely ceptibility27. Strikingly and further in support of the excellent
H3K9me3-governed SUVARness, in the course of human DLBCL outcome data presented here for various independent
treatment, equipping us with a molecular stratifier that unveils SUVARness-high DLBCL patient cohorts, grouped clusters 0, 1,
senescence susceptibility already at diagnosis in the patient sub- and 4 were just reported to achieve a superior outcome (PFS)
group that experiences significantly superior long-term outcome. when compared to clusters C3/C5 (79% vs. 49% 5y-PFS, p =
0.002; ref. 14).
Discussion Importantly, while this study pinpointed with SUVARness the
The molecular in-depth dissection of large sample numbers ability to execute senescence as a tumor-controlling feature that
across most cancer entities in general and DLBCL in particular accounts for improved long-term outcome to therapy when
has led to a variety of genetically determined subgroups6–15. With compared to tumors lacking such ability, TIS may also have
the approach presented here, we add a biological and dynamic detrimental implications. We recently discovered reprogramming
layer to the detailed but static profiling data obtained from of bulk tumor cells into cancer stem cells as the result of profound
patients at diagnosis. Demonstrating the genetic and clinical epigenetic remodeling in senescence28, and reported that senes-
proximity of primary Eµ-myc transgenic mouse lymphomas to cent cells may occasionally re-enter the cell-cycle by losing
DLBCL provided the basis to further interrogate them with expression of senescence-essential gene moieties or gaining suf-
defined genetic defects in the biological feature of interest, or as ficient expression of senescence-countering gene activities45.
unmanipulated samples in a clinical trial-like format, out of Undoubtedly, senescence serves as a beneficial acute response to
which we derived senescence-determining gene signatures whose stresses that put tissue integrity at risk, but lastingly persistent
humanized homologues proved predictive when applied to hun- senescent cells, for the reasons of pro-inflammatory SASP and
dreds of DLBCL patients’ data consisting of molecular profiles potential senescence escape of SAS + tumor cells, represent a
and the respective clinical outcome information post-standard dangerous population one would rather like to selectively elim-
therapy at resolution of the individual patient. Specifically, we inate, if not cleared by host immunity anyway53. Consistently, we
were able to show that these lymphomas recapitulate genetic found here the particularly senescence-susceptible GCB subtype
features of previously established DLBCL subtypes such as the to present with features of an ATSC signature, underscoring the
HR/OxPhos/BCR consensus clusters and the clinically routinely consideration of a “senolytic” approach at least in this subgroup.
utilized distinction by COO into ABC and GCB subtypes6,42,44. Since we reported the first successful, survival-prolonging
An important deliverable from this study is the humanized demonstration of a senolytic strategy in cancer, specifically in
version of the core TIS upregulated gene set that links senescence the Eµ-myc lymphoma model, in vivo a few years ago25, we are
susceptibility during subsequent therapy to improved long-term currently extending our DLBCL-focused studies to this question.
outcome in unselected DLBCL patients (cf. Fig. 6c, d, Supple- In essence, TIS serves as an important back-up cell-cycle exit
mentary Fig. 6a, b). We further applied this classifier of program especially in tumors where apoptosis is no longer
SUVARness, based on the original Suv39h1 liability of available, but long-term persistence of senescent cells may evoke
senescence25,34, to very recently reported novel DLBCL subsets, aggressive tumor properties if not effectively countered by a
termed clusters 0–5 (C0–C5), that were determined by a com- preventive senolytic intervention32.
prehensive in-depth genetic analysis of more than 300 primary By introducing a primary transgenic lymphoma model with
DLBCL cases14. When probing individual clusters regarding their defined genetic lesions to interrogate distinct biologies—as pre-
SUVARness, we found this outcome-predictive gene set to be sented here for the Suv39h1-dependent induction of cellular
specifically enriched for in C0, C1, and C4, while it was pro- senescence in response to therapy—followed by the exploration of
foundly downregulated in C2, C5, and to a lesser extent in C3 a genetically unbiased clinical trial-like mouse lymphoma cohort,
(Fig. 6e). Thereby, SUVARness is linked to senescence- all in a syngeneic, immune-competent context, we provide a
reminiscent features such as a SASP-like pro-inflammatory DLBCL-approximated test platform for functional investigations.
immune infiltrate (C0), enhanced NOTCH and NF-κB activity While a large body of literature underscores the successful
NATURE COMMUNICATIONS | (2020)11:3651 | https://doi.org/10.1038/s41467-020-17467-z | www.nature.com/naturecommunications 11ARTICLE NATURE COMMUNICATIONS | https://doi.org/10.1038/s41467-020-17467-z
exploration of functional lymphoma features in Eµ-myc mice and Cell culture, retroviral infection, and in vitro-treatments. LC were cultured on
the subsequent validation of these findings in human irradiated NIH3T3 fibroblasts serving as feeder cells20. Retroviral gene transfer was
carried out with infectious supernatant from murine stem cell retrovirus (MSCV)-
DLBCL23,27,28,40,54–56, we certainly acknowledge limitations of transfected Phoenix packaging cells24. Full-length cDNAs of Lsd1 and Jmjd2c were
this transgenic model as a reflection of DLBCL pathogenesis, purchased from GE Healthcare Dharmacon and subcloned into the MSCV back-
particularly in light of numerous mouse models developed to bone co-encoding a puromycin antibiotic resistance gene. Bcl2 was subcloned into
more faithfully recapitulate GCB- or ABC-subtype features of MSCV co-expressing GFP. In vitro drug assays were performed using adriamycin
human DLBCL57–68. However, while those models elegantly (ADR), a topoisomerase II inhibitor, at a concentration of 0.05 µg/ml, unless
otherwise indicated.
provide examples for distinct routes into GCB- or ABC-skewed
diffuse large B-cell lymphomagenesis, they are, in turn, selectively Analysis of cell viability, cell-cycle, and senescence. Viability and cell numbers
composed of complexity-reduced genetics out of the over- were analyzed by trypan blue dye exclusion. Cell-cycle status was measured via
whelming heterogeneity human DLBCL exhibit as a cardinal incorporation of BrdU and PI labeling by flow cytometry23,24. Ki67 was visualized
property. In contrast, initiated by a single myc transgene, it is by immunohistochemistry as an indicator of cell proliferation, and SA-β-gal
probably exactly this broad spectrum of early to rather mature B- activity at pH 5.5 was assessed as a senescence marker in cytospin preparations or
cryosections22,34. The JMJD2 inhibitor IOX1 came from Sigma, the LSD1 inhibitor
cell lymphomas and their diverse secondary hits which accounts 2-PCPA-1a was purchased from Uorsy, Ukraine (BBV27286962)45.
for a heterogeneity in the Eµ-myc model that seems to recapi-
tulate at least some critical features of the heterogeneous DLBCL Immunoblotting and immunohistochemistry. Immunoblotting (IB) and immu-
transcriptomes40,54. Those resulting Eµ-myc transgenics-derived nohistochemistry (IHC) were performed as described previously20,27. Antigen
genetic determinants can be faithfully re-applied to human detection by IB was carried out with antibodies against γ-H2AX (Cell Signaling
clinically and molecularly co-annotated datasets to identify Technology [CST], #9718, 1:1000 dilution), p53-P-Ser18 (CST, #9284S, 1:1000),
p53 (Leica Biosystems, #NCL-p53-CM5p, 1:1000), p16INK4a (Santa Cruz Bio-
hitherto unknown patient subgroups and to unveil the predictive technology, #sc-1661, 1:1000), H3K9me3 (Abcam, #ab8898, 1:1000), LSD1 (CST,
implication of a certain biological response that a (sizeable) #2184S, 1:1000), JMJD2C (Abcam, #ab85454, 1:1000) and α-Tubulin (Sigma,
fraction of the newly diagnosed patients will experience in the #T5168, 1:1000). Anti-mouse or anti-rabbit horseradish peroxidase-conjugated
course of their yet-to-start treatment (Fig. 6f). Of note, any gene antibodies were used as secondary antibodies (GE Healthcare, #RPN4301, 1:1000
and #NA931V, 1:2000, respectively). Antigen detection by IHC was performed
candidate emerging from the human data analysis can be re- with antibodies against Ki67 (Dako, TEC3, 1:1000) and H3K9me3 (Abcam,
fueled into the system to launch a next translational cycle of #ab8898, 1:1000).
functional studies in the mouse that will further deepen molecular
insights into the tumor-treatment interplay, and eventually refine Transcriptome profiling. RNA was isolated from LC using the RNAeasy Mini kit
patient strategies in the clinic. Taken together, our approach (Qiagen) and hybridized to Affymetrix Mouse Gene 1.0 ST or Genome 430 2.0
highlights how functional mouse models inform decision making microarrays according to the manufacturer’s instructions. Arrays were hybridized,
washed and scanned by standard Affymetrix protocols. Further processing of the
in cancer precision medicine beyond mutational analyses and raw microarray data is described below.
expression profiling of the patient material.
Statistics and data analysis. Based on previous experience with the Eµ-myc
transgenic mouse lymphoma model, sample sizes typically reflect three to five, in
Methods some experiments also much higher numbers of individual primary tumors as
For the list of primers, details of microarray data processing and subsequent gene biological replicates. For assessing long-term outcome after in vivo-treatments,
expression analysis, please see Supplementary methods. seven or more tumor-bearing animals per arm were used. Survival analysis (Figs. 1b,
d and 2c, d; 3b, c3; 4c and e–h; 5e; and 6b–d) was done using the survival package in
R. Statistical significance of differences in the survival times were assessed using the
Mouse strains and lymphoma generation. All animal protocols used in this study log-rank test. All quantifications from staining reactions were carried out by an
were approved by the governmental review board (Landesamt Berlin), and conform independent and blinded second examiner and reflect at least three samples with at
to the appropriate regulatory standards. All mice are in a C57BL/6 strain background. least 100 events counted (typically in three different areas) each, and a t test was
Eµ-myc transgenic lymphomas with defined genetic defects in the suv39h1 or p53 applied. Unless otherwise stated, a p value < 0.05 was considered statistically sig-
locus were generated by cross-breeding to suv39h1 or p53 knockout mice23,25,28. nificant. For multiple testing corrections the method by Benjamini and Hochberg
Genotyping and semiquantitative detection of the Eµ-myc transgene were carried by (BH) to control for false-discovery rate was applied69. Bioinformatics Analysis was
transgene-specific genomic PCR20 and primers are listed in the Supplementary performed in R 3.5.0 & Bioconductor 3.7 using various R packages as described in
Information. Inducible Suv39h1 Myc-driven lymphomas were generated from the Supplemental Experimental Procedures in greater detail. In order to ensure
Suv39h1− Eµ-myc lymphomas stably transduced with a 4-hydroxy-Tamoxifen (4- reproducible results, the R workspace was initiated with a random seed of 1.
OHT)-inducible Suv39h1/estrogen receptor fusion cDNA (Suv39h1:ER)28.
Reporting summary. Further information on research design is available in the Nature
Research Reporting Summary linked to this article.
In vivo-treatments and mouse imaging. Individual lymphomas were propagated
in up to two strain-matched, non-transgenic (i.e., genetically non-engineered wild-
type), fully immuno-competent 6–8-week-old mice each via tail vein injection of Data availability
106 viable cells (notably, in rare cases, discordant NR/RP responses of the two The mouse model-derived raw microarray data—from our previously published control;
same-lymphoma recipients may produce unequal medians of the stratified bcl2, Suv39h1−;bcl2 and Suv39h1−;bcl2 transduced with 4OHT-inducible Suv39h1
response groups). Recipient mice were treated with a single intraperitoneal dose of (Suv39h1:ER;bcl2) lymphomas25,28 – were deposited at the Gene Expression Omnibus
cyclophosphamide (CTX, Sigma, 300 mg/kg body weight) or CHOP (i.e., 150 (GEO) repository of the National Center for Biotechnology Information under accession
mg/kg CTX, 3.3 mg/kg ADR, 0.5 mg/kg Vincristine, and 200 µg/kg Prednisone) at number (GSE134753). Data from our clinical-trial like model were deposited under
the time well-palpable LN enlargements (i.e., about 8–10 mm in diameter) had accession number (GSE134751). Expression data of 39 primary Eµ-myc lymphomas from
formed. Regarding the CHOP regimen, each drug was administered on day 1, our clinical trial-like model were combined with expression profiles from publicly
followed by daily administration of Prednisone alone over the next 4 days, con- available primary Eµ-myc lymphoma (https://www.ncbi.nlm.nih.gov/geo/query/acc.cgi?
sistent with the schedule used in the clinic. Treatment responses were monitored acc=GSE40760). Expression data of DLBCL patients are publicly available from NCBI
during regular visits (at least twice a week; for a maximum of a 100-day observation GEO, comprising GSE10846, (GSE4475), (GSE4732) and (GSE31312). In addition, GEP
period), which always included a general inspection of the mice and palpation of of DLBCL patients from the Shipp lab for CCC DLBCL distinction were obtained from
the typically affected LN regions (i.e. cervical, pre-scapular/axillar and inguinal) as https://portals.broadinstitute.org/cgi-bin/cancer/publications/pub_paper.cgi?
time-to-relapse (TTR), i.e., progression-free survival (PFS), or reflect the time mode=view&paper_id=102 (ref. 44) and for GSE98588 from NCBI GEO14. Raw CEL
between treatment and unexpected death of the animal or a preterminal disease files were downloaded and processed using RMA implemented in the R package oligo
stage, collectively measured as overall survival (OS)20. After CO2 euthanasia, LN, and batch effects between scan dates reduced using ComBat in the sva package.
and in some experiments also the spleen or BM, were isolated to generate tissue
sections or single-cell suspensions20. In vivo-animal imaging was performed as
whole-body luciferase or GFP imaging using a LAS 4000 luminescence and Received: 7 August 2019; Accepted: 24 June 2020;
fluorescence live imaging system (Fujifilm)25.
12 NATURE COMMUNICATIONS | (2020)11:3651 | https://doi.org/10.1038/s41467-020-17467-z | www.nature.com/naturecommunicationsYou can also read