Polycomb complexes redundantly maintain epidermal stem cell identity during development
←
→
Page content transcription
If your browser does not render page correctly, please read the page content below
Downloaded from genesdev.cshlp.org on September 27, 2021 - Published by Cold Spring Harbor Laboratory Press
Polycomb complexes redundantly
maintain epidermal stem cell identity
during development
Idan Cohen,1,13 Carmit Bar,2,13 Hequn Liu,3,12 Victor J. Valdes,4 Dejian Zhao,3,5,6 Phillip M. Galbo Jr.,3
Jose M. Silva,7 Haruhiko Koseki,8,9 Deyou Zheng,3,10,11 and Elena Ezhkova2
1
The Shraga Segal Department of Microbiology, Immunology, and Genetics, Faculty of Health Science, Ben-Gurion University of
the Negev, Beer Sheva 84105, Israel; 2Black Family Stem Cell Institute, Department of Cell, Developmental, and Regenerative
Biology, Icahn School of Medicine at Mount Sinai, New York, New York 10029, USA; 3Department of Genetics, Albert Einstein
College of Medicine, Bronx, New York 10461, USA; 4Department of Cell Biology and Development, Instituto de Fisiología Celular,
Universidad Nacional Autónoma de México, Mexico City 04510, Mexico; 5Yale Center for Genome Analysis, Yale University,
New Haven, Connecticut 06510, USA; 6Department of Genetics, Yale School of Medicine, New Haven, Connecticut 06510, USA;
7
Department of Pathology, Icahn School of Medicine at Mount Sinai, New York, New York 10029, USA; 8Laboratory for
Developmental Genetics, RIKEN Center for Integrative Medical Sciences (RIKEN-IMS), Tsurumi-ku, Yokohama 230-0045, Japan;
9
AMED-CREST, Tsurumi-ku, Yokohama 230-0045, Japan; 10Department of Neurology, 11Department of Neuroscience, Albert
Einstein College of Medicine, Bronx, New York 10461, USA
Polycomb repressive complex 1 (PRC1) and PRC2 are critical epigenetic developmental regulators. PRC1 and PRC2
largely overlap in their genomic binding and cooperate to establish repressive chromatin domains demarcated by
H2AK119ub and H3K27me3. However, the functional contribution of each complex to gene repression has been a
subject of debate, and understanding of its physiological significance requires further studies. Here, using the de-
veloping murine epidermis as a paradigm, we uncovered a previously unappreciated functional redundancy between
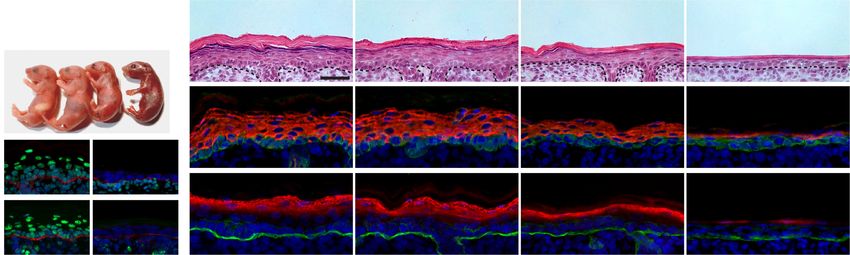
Polycomb complexes. Coablation of PRC1 and PRC2 in embryonic epidermal progenitors resulted in severe defects
in epidermal stratification, a phenotype not observed in the single PRC1-null or PRC2-null epidermis. Molecular
dissection indicated a loss of epidermal identity that was coupled to a strong derepression of nonlineage transcrip-
tion factors, otherwise repressed by either PRC1 or PRC2 in the absence of its counterpart. Ectopic expression of
subsets of PRC1/2-repressed nonepidermal transcription factors in wild-type epidermal stem cells was sufficient to
suppress epidermal identity genes, highlighting the importance of functional redundancy between PRC1 and PRC2.
Altogether, our studies show how PRC1 and PRC2 function as two independent counterparts, thereby providing a
repressive safety net that protects and preserves lineage identity.
[Keywords: Polycomb; PRC1; PRC2; skin; epidermis; stem cell; epigenetics; H2AK119ub; H3K27me3]
Supplemental material is available for this article.
Received October 1, 2020; revised version accepted January 4, 2021.
One of the main challenges in modern biology is to under- ered to be part of the paradigm for epigenetic regulation
stand the mechanisms by which stem cells and progenitor (Simon and Kingston 2009; Aloia et al. 2013). PcG proteins
cells control tissue development and homeostasis (Ge and are present in two multi-subunit complexes, Polycomb re-
Fuchs 2018). Epigenetic factors are critical regulators of pressive complex (PRC) 1 and PRC2 (Simon and Kingston
stem cells, exerting their function through the modifica- 2009; Schuettengruber et al. 2017). The canonical PcG
tion of DNA, histones, or nucleosome remodeling (Allis proteins function to repress transcription (Schuetten-
and Jenuwein 2016; Atlasi and Stunnenberg 2017). gruber et al. 2017), although PRC2-independent roles of
The Polycomb group (PcG) proteins are evolutionarily PRC1 in promoting gene expression have been reported
conserved chromatin modifiers that function in diverse (Frangini et al. 2013; Gao et al. 2014; Cohen et al. 2018,
systems ranging from plants to mammals and are consid- 2019). Mammalian PRC2 contains EED, SUZ12, and
EZH1/2 core subunits and establishes trimethylation on
12
Present address: U1036, Institut National de la Santé et de la Recherche © 2021 Cohen et al. This article is distributed exclusively by Cold Spring
Médicale (INSERM), 38000 Grenoble, France. Harbor Laboratory Press for the first six months after the full-issue publi-
13
These authors contributed equally to this work. cation date (see http://genesdev.cshlp.org/site/misc/terms.xhtml). After
Corresponding author: elena.ezhkova@mssm.edu six months, it is available under a Creative Commons License (Attribu-
Article published online ahead of print. Article and publication date are tion-NonCommercial 4.0 International), as described at http://creative-
online at http://www.genesdev.org/cgi/doi/10.1101/gad.345363.120. commons.org/licenses/by-nc/4.0/.
GENES & DEVELOPMENT 35:1–13 Published by Cold Spring Harbor Laboratory Press; ISSN 0890-9369/21; www.genesdev.org 1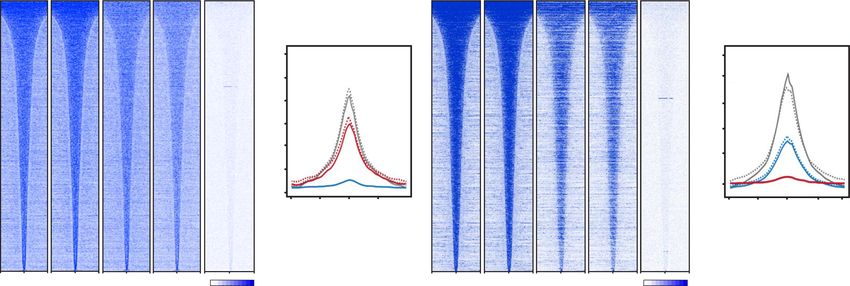
Downloaded from genesdev.cshlp.org on September 27, 2021 - Published by Cold Spring Harbor Laboratory Press

Cohen et al.

histone H3 lysine 27 (H3K27me3) (Cao et al. 2002; Czer-              redundantly in gene silencing, using the murine epider-
min et al. 2002; Kuzmichev et al. 2002; Healy et al.                 mis as a somatic stem cell developmental system. By an-
2019). Mammalian PRC1 complexes are diverse in their                 alyzing chromatin immunoprecipitation followed by
subunit composition (Gao et al. 2012). However, all                  deep sequencing (ChIP-seq) data for H2AK119ub and
PRC1 complexes contain an E3 ubiquitin ligase, RING1A                H3K27me3 in FACS-purified EpSCs from control new-
or RING1B, which catalyzes monoubiquitination on his-                born skins (Cohen et al. 2018), we defined a total of 2652
tone H2A lysine 119 (H2AK119ub) (de Napoles et al.                   genomic loci comarked by PRC1 and PRC2 (Supplemen-
2004; Wang et al. 2004a), a histone mark critical for Poly-          tal Table S1), as well as loci negative to these marks (Sup-
comb-mediated gene repression (Endoh et al. 2012; Cohen              plemental Fig. S1C, bottom). These regions varied in their
et al. 2018, 2020; Blackledge et al. 2020).                          epigenetic profiles and were divided using k-means clus-
   At silent genes, PRC1 and PRC2 largely overlap in their           tering into four distinct clusters (Supplemental Fig. S1C,
chromatin binding in many developmental systems (Boy-                top). Cluster 1 was characterized by abundant and broad
er et al. 2006; Tolhuis et al. 2006; Ku et al. 2008). This           ChIP-seq signals for H2AK119ub and H3K27me3,
overlap is thought to be a consequence of the ability of             low and diffused signals for H3K4me3 and for assay for
PRC1 to recognize the PRC2-mediated histone modifica-                transposase-accessible chromatin (ATAC)-seq, and no
tion and vice versa (Fischle et al. 2003; Min et al. 2003;           H3K27ac signal (Supplemental Fig. S1C, top). Cluster 2
Wang et al. 2004a,b; Blackledge et al. 2014; Cooper et al.           was similar to cluster 1 but had slightly narrower and low-
2014). This interplay and mutual recruitment of Poly-                er H2AK119ub and H3K27me3 signals than cluster 1.
comb complexes suggest that loss of one of these com-                Overall, clusters 1 and 2 share an epigenetic signature of
plexes would affect the stability of its counterpart’s               transcriptionally silent loci. Cluster 3 had focal ChIP-
binding, yielding similar phenotypes of PRC1 and PRC2                seq signals for H2AK119ub and H3K27me3, with moder-
mutants. Indeed, in flies, loss of either PRC1 or PRC2               ate H3K4me3 and ATAC-seq signals and low H3K27ac
leads to similar homeotic transformations through dere-              signal, indicative of bivalency (Bernstein et al. 2006;
pression of homeotic genes (Simon et al. 1992). In the de-           Zhou et al. 2011). Finally, cluster 4 had low and focal
veloping murine skin, loss of PRC2- or PRC1-mediated                 H2AK119ub and H3K27me3 ChIP-seq signals, weak and
H2AK119ub catalysis results in a similar phenotype of ec-            diffused H3K4me3 signal, and no H3K27ac or ATAC sig-
topic Merkel cell formation (Bardot et al. 2013; Dauber              nals (Supplemental Fig. S1C, top). Transcriptional analy-
et al. 2016; Cohen et al. 2018). However, studies in murine          sis of control EpSCs using high-throughput RNA
embryonic stem cells (mESCs) have shown that PRC1 and                sequencing (RNA-seq) showed that genes associated
PRC2 may also possess redundant functions. Indeed, the               with clusters 1–2 were typically silent with mean expres-
loss of both PRC1 and PRC2 complexes impaired mESC                   sion levels of less than one transcript per million (TPM).
self-renewal and differentiation, phenotypes that were               Genes in cluster 3, despite bivalency, were also expressed
not observed in single knockouts (Leeb et al. 2010). It is           at low levels, but their expression levels were slightly
not known whether functional redundancy between                      higher than that of genes of clusters 1 and 2. Genes in clus-
PRC1 and PRC2 in transcriptional repression exists in                ter 4 were expressed at slightly higher levels than genes in
vivo. Also unknown is the physiological significance of              clusters 1–3, with mean TPM
Downloaded from genesdev.cshlp.org on September 27, 2021 - Published by Cold Spring Harbor Laboratory Press

                                                                                           PRC functional redundancy in epidermal stem cells

    A                                      B                                                  C

Figure 1. Repressive marks of PRC1 and PRC2 are largely maintained in the absence of their counterparts in FACS-purified
EpSCs. (A) Read densities of H2AK119ub ChIP-seq peaks in P0 control, Eed cKO, and Ring1a/b 2KO FACS-purified EpSCs, ±10 kb from
peak centers. (B) Read densities of H3K27me3 ChIP-seq peaks in P0 control, Ring1a/b 2KO, and Eed cKO FACS-purified EpSCs, ±10 kb
from peak centers. (C) Integrative Genomics Viewer (IGV) browser view of ChIP-seq tracks for H2AK119ub and H3K27me3 in P0 control,
Eed cKO, and Ring1a/b 2KO FACS-purified EpSCs on the HoxA gene cluster. Y-axis normalized by sequencing depths.

with control EpSCs (Fig. 1B,C; Supplemental Fig. S1G).                  Collectively, these data show that in EpSCs, only a small
RNA-seq analysis revealed that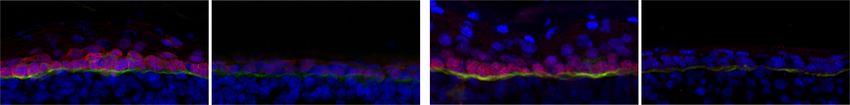
Downloaded from genesdev.cshlp.org on September 27, 2021 - Published by Cold Spring Harbor Laboratory Press
Cohen et al.
(KRT5) and the early suprabasal layer differentiation notation of Eed; Ring1a/b 3KO up-regulated genes showed
marker of KRT10 showed weak and dramatically reduced enrichment in GO terms related to nonepidermal lineage
expression in the suprabasal layers (Fig. 2E). IF staining for developmental genes and transcription factors (TFs) (Fig.
the late differentiation marker loricrin (LOR) was almost 3C; Supplemental Table S5). We observed a smaller over-
absent in the Eed; Ring1a/b 3KO epidermis (Fig. 2F), sug- lap between the three different mouse lines for the down-
gesting that the epidermal differentiation program was im- regulated genes. Only 89 genes were down-regulated in
paired in the absence of both PRC1 and PRC2 functions. Eed cKO EpSCs compared with 436 genes in Ring1a/b
These pronounced developmental defects were not ob- 2KO EpSCs and 1129 genes in Eed; Ring1a/b 3KO EpSCs
served in the Eed cKO or Ring1a/b 2KO epidermis, al- (Fig. 3D; Supplemental Tables S3, S4). The expression lev-
though a slight reduction in differentiated layers was also els of the down-regulated genes were lower in Eed;
apparent in the Ring1a/b 2KO epidermis (Fig. 2D–F). Cell Ring1a/b 3KO compared with Eed cKO and Ring1a/b
proliferation was reduced, but no aberrant apoptosis was 2KO (Supplemental Fig. S3B). Genes down-regulated in
observed in the Eed; Ring1a/b 3KO epidermis (Supplemen- Eed; Ring1a/b 3KO EpSCs were related to cell prolifera-
tal Fig. S2A–D). Interestingly, the Eed; Ring1a/b 3KO epi- tion and DNA repair, as well as skin and epidermis devel-
dermis also completely lacked Merkel cells (Supplemental opmental processes (Fig. 3E; Supplemental Table S5).
Fig. S2E,F). Altogether, we conclude that coablation of both PRC1
Transcriptional analysis of FACS-purified Eed; Ring1a/ and PRC2 activity in EpSCs exacerbates the molecular
b 3KO EpSCs using RNA-seq showed increased transcrip- and developmental phenotypes of the single PRC1-null
tional dysregulation compared with Eed cKO and Ring1a/ and PRC2-null EpSCs.
b 2KO EpSCs (Fig. 3A,B,D). Focusing on significantly up-
regulated genes, we observed 551 genes in Eed cKO,
1353 genes in Ring1a/b 2KO, and 2492 genes in Eed; Indirect PRC1 and PRC2 functions preserve epidermal
Ring1a/b 3KO versus control EpSCs (Fig. 3B; Supplemen- identity
tal Tables S3, S4). The majority of genes up-regulated in To gain insight into the observed PRC1/2-null epidermal
Eed cKO or Ring1a/b 2KO EpSCs were also up-regulated phenotype, we analyzed genes down-regulated in Eed;
in Eed; Ring1a/b 3KO EpSCs (Fig. 3A,B). The expression Ring1a/b 3KO EpSCs. By performing reverse transcrip-
levels of up-regulated genes were higher in Eed; Ring1a/ tion followed by qPCR (RT-qPCR), we confirmed our
b 3KO EpSCs compared with single complex knockouts, RNA-seq analysis and observed that deletion of both
suggesting that both Polycomb complexes contribute to Polycomb complexes had an additive effect on the expres-
their repression (Supplemental Fig. S3A). Functional an- sion levels of epidermal cell identity genes, epidermal
A B C
D E
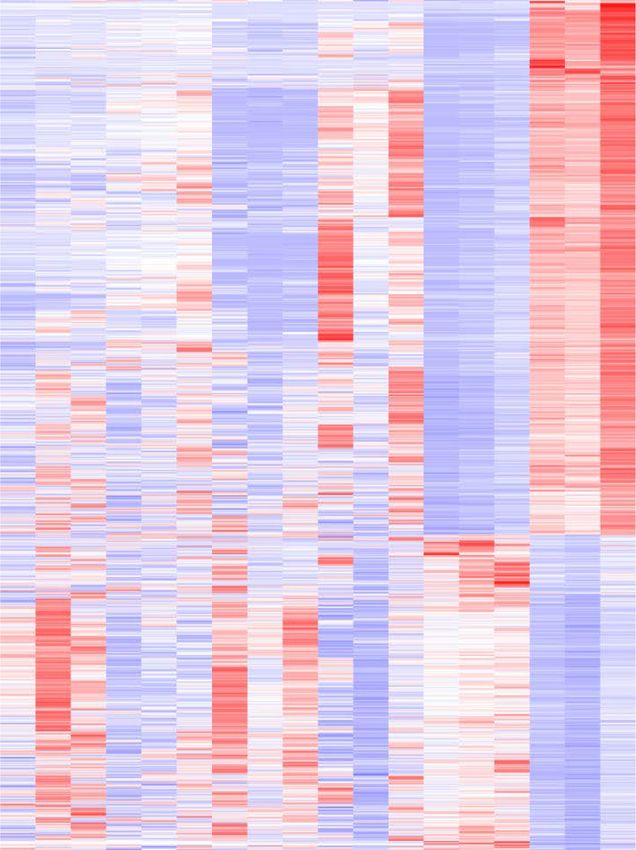
Figure 3. Loss of both PRC1 and PRC2 in EpSCs exacerbates transcriptional changes in single complex mutants. (A) Heat map showing that
the DEGs from 3KO were significantly less affected in Eed cKO or Ring1a/b 2KO. The DEGs from 3KO versus control were used. (B) Venn
diagram showing overlap of up-regulated genes in P0 Eed cKO, Ring1a/b 2KO, and Ring1a/b; Eed 3KO epidermis. (C) Gene ontology (GO)
analysis of up-regulated genes in the Eed; Ring1a/b 3KO epidermis. (D) Venn diagram showing overlap of down-regulated genes in P0 Eed
cKO, Ring1a/b 2KO, and Eed; Ring1a/b 3KO epidermis. (E) GO analysis of down-regulated genes in the Eed; Ring1a/b 3KO epidermis.
4 GENES & DEVELOPMENT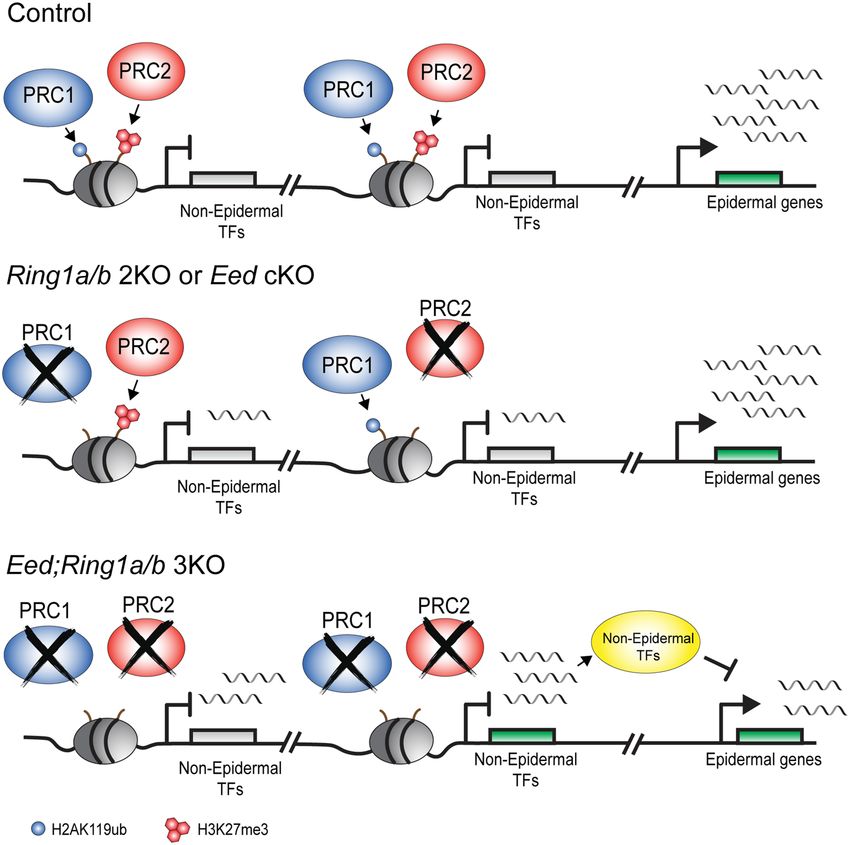
Downloaded from genesdev.cshlp.org on September 27, 2021 - Published by Cold Spring Harbor Laboratory Press

                                                                                            PRC functional redundancy in epidermal stem cells

TFs, and cell proliferation genes (Fig. 4A). Among epider-                cell identity in Eed; Ring1a/b 3KO EpSCs most likely
mal genes significantly down-regulated in Eed; Ring1a/b                   stem from indirect mechanisms.
3KO EpSCs, there were key epidermal lineage TFs such
as P63 and SATB1, as well as the signal transducer
FGFR2, essential for epidermal development (Fig. 4A–C;                    PRC1 and PRC2 act redundantly in transcriptional
Supplemental Fig. S4A; Mills et al. 1999; Petiot et al.                   repression
2003; Yang et al. 2010; Fessing et al. 2011). To test wheth-              We next investigated whether the pronounced transcrip-
er epidermal genes down-regulated in Eed; Ring1a/b 3KO                    tional changes observed in Eed; Ring1a/b 3KO EpSCs
EpSCs are directly coregulated by PRC1 and PRC2, we                       could be direct consequences of the loss of functional
analyzed our ChIP-seq data. There was practically no                      redundancy between PRC1 and PRC2 in transcriptional
overlap between PRC1/2 comarked loci and genes                            repression. Integration between RNA-seq and ChIP-seq
down-regulated in Eed; Ring1a/b 3KO EpSCs (Fig. 4D;                       data showed that >60% of the up-regulated genes were di-
Supplemental Fig. S4B), and the vast majority of down-                    rect targets of PRC1 and/or PRC2, with ∼65% of direct
regulated epidermal genes were not targeted by the                        targets comarked by both complexes (Fig. 5A). Among
PRC1 subunit RING1B (Fig. 4D; Supplemental Fig.                           PRC1/2 demarcated genes up-regulated in Eed; Ring1a/b
S4C). For the 18% of down-regulated genes that were                       3KO EpSCs, >35% remained silent in both Eed cKO and
bound by RING1B (Supplemental Fig. S4C), we did not                       Ring1a/b 2KO EpSCs (Fig. 5B), indicating that those genes
observe any significant changes in their expression be-                   were redundantly repressed by PRC1 and PRC2. Further
tween Ring1a/b 2KO and Eed; Ring1a/b 3KO EpSCs, sug-                      analysis also showed a higher level of gene derepression
gesting no additive effect between PRC1 and PRC2                          in Eed; Ring1a/b 3KO EpSCs compared with Eed cKO or
complexes in promoting their expression (Supplemental                     Ring1a/b 2KO EpSCs (Fig. 5C,D). Among PRC1/2
Fig. S4D,E). This is in line with previous observations                   comarked genes, we observed enrichment for nonepider-
that noncanonical PRC1 promotes gene expression inde-                     mal TFs that are normally silent in control EpSCs (Fig.
pendently of PRC2 (Gao et al. 2014; Cohen et al. 2018,                    5E). ChIP-seq and ChIP-qPCR analysis showed that these
2019). Taken together, we conclude that the changes in                    TF genomic loci maintained high levels of H2AK119ub in
epidermal gene expression and the loss of epidermal                       Eed cKO and high levels of H3K27me3 in Ring1a/b 2KO

           A

           B                                                          C

           D

Figure 4. Indirect PRC1 and PRC2 functions preserve EpSC identity. (A) Fold change in epidermal gene expression in P0 Eed cKO,
Ring1a/b 2KO, and Eed; Ring1a/b 3KO epidermis. (∗ ) P < 0.05, (∗∗ ) P < 0.01, (∗∗∗ ) P < 0.001. (B,C ) IF staining of the epidermal markers
p63 (B) and SATB1 (C ) in P0 control and Eed; Ring1a/b 3KO epidermis. The basement membrane is labeled by Integrin β4 (ITGB4; green).
Scale bars, 50 µm. (D) IGV browser view of Polycomb marks and subunits for PRC1/2 down-regulated genes. Arrows indicate transcription
start sites (TSSs) and transcription direction.

                                                                                                           GENES & DEVELOPMENT             5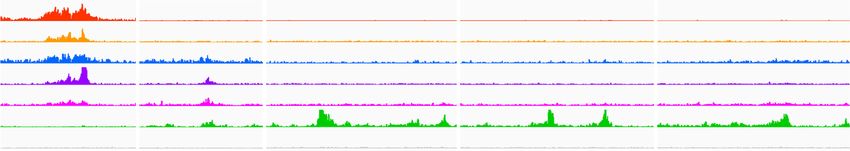
Downloaded from genesdev.cshlp.org on September 27, 2021 - Published by Cold Spring Harbor Laboratory Press

Cohen et al.

           A                                     B                               C

           D                                         E                            F

           G

Figure 5. PRC1 and PRC2 redundantly repress nonlineage transcription factors in EpSCs. (A) Distribution of H3K27me3 and
H2AK119ub marks on the up-regulated genes in Eed; Ring1a/b 3KO. (B) Distribution of PRC1 and PRC2 up-regulated direct target genes
among P0 Eed cKO, Ring1a/b 2KO, and Eed; Ring1a/b 3KO EpSCs. (C ) Expression levels of PRC1 and PRC2 direct target genes in P0 con-
trol, Eed cKO, and Eed; Ring1a/b 3KO EpSCs. (D) Expression levels of PRC1 and PRC2 direct target genes in P0 control, Ring1a/b 2KO, and
Eed; Ring1a/b 3KO EpSCs. (E) Proportion of up-regulated transcription factor (TF) genes marked by PRC1, PRC2, or PRC1/2. (F ) Relative
expression levels of nonepidermal TFs in P0 Eed cKO, Ring1a/b 2KO, and Eed; Ring1a/b 3KO EpSCs. (G) Relative expression levels of
epidermal genes in keratinocytes ectopically expressing combinations of nonepidermal TFs. Combination 1 included NR4A2, GATA2,
FOXA1, TBX3, NKX2-9, and TBX5. Combination 2 included PITX2, SIX2, HOXD13, SIX3, OTX2, and SATB2.

EpSCs (Supplemental Fig. S5A–C). Consistent with the                  analysis on the promoter and DNA regulatory regions
ChIP data, loss of both PRC1 and PRC2 resulted in stron-              with ATAC-seq and H3K27ac peaks present near epider-
ger up-regulation of those TFs in Eed; Ring1a/b 3KO                   mal genes that were down-regulated in Eed; Ring1a/b
EpSCs than in single complex KOs (Fig. 5F). Taken togeth-             3KO EpSCs (Supplemental Fig. S5D,E). We used the HO-
er, these data indicate that PRC1 and PRC2 function re-               MER software (Heinz et al. 2010) to find enriched tran-
dundantly to repress their cotargeted genes and that loss             scription factor binding motifs, and from the results, we
of both PRC1 and PRC2 leads to a massive derepression                 further selected a list of 19 transcription factors that
of nonlineage TFs in EpSCs.                                           were up-regulated in Eed; Ring1a/b 3KO EpSCs (Supple-
                                                                      mental Fig. S5F; Supplemental Table S6). This analysis re-
                                                                      vealed enrichment for TFs of the T-box (TBX) gene family,
Expression of nonlineage TFs suppresses epidermal cell
                                                                      the sine oculis homeobox (SIX) gene family, and several
identity
                                                                      additional TFs with known roles in the neural, cardiac,
Probing deeper into the molecular mechanisms of Poly-                 or mesodermal lineages (Supplemental Fig. S5F; Oliver
comb functional redundancy, we tested whether dere-                   et al. 1995; Bruneau 2002; Evseenko et al. 2010). To test
pression of nonlineage TFs led to the changes in                      the role of these nonepidermal TFs, we ectopically ex-
epidermal identity phenotype observed in Eed; Ring1a/b                pressed two different combinations of six TFs in wild-
3KO EpSCs. Many genes bound by PRC1 and PRC2 are                      type EpSCs and tested their effect on the expression of
central regulators of development, believed to be capable             epidermal genes. The combined expression of these non-
of modifying cell fates on their own (Mattick et al. 2010).           epidermal TFs was sufficient to suppress epidermal genes
To select the most prominent nonlineage TFs among a                   (Fig. 5G), similar to the suppressed epidermal identity ob-
list of ∼300 TFs significantly up-regulated in Eed;                   served in Eed; Ring1a/b 3KO epidermis (Figs. 3E, 4A).
Ring1a/b 3KO EpSCs, we performed motif enrichment                     Thus, functional redundancy between PRC1 and PRC2

6      GENES & DEVELOPMENT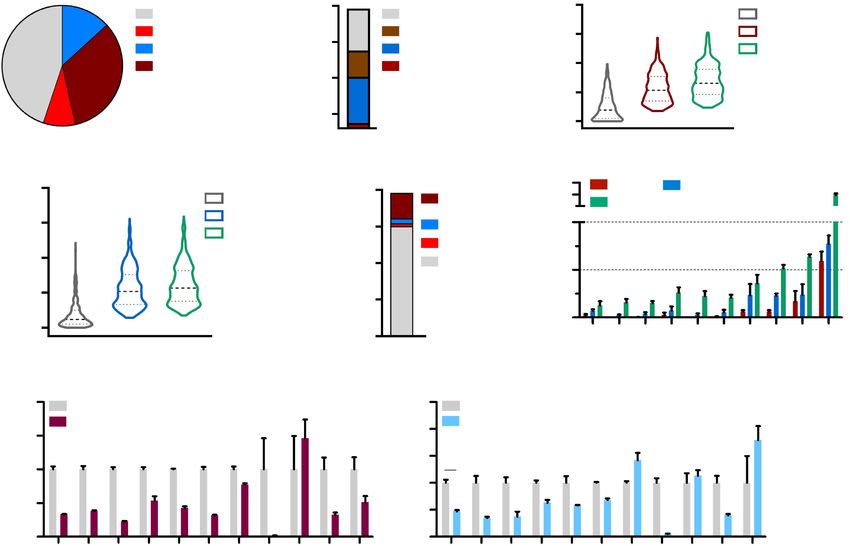
Downloaded from genesdev.cshlp.org on September 27, 2021 - Published by Cold Spring Harbor Laboratory Press

                                                                                       PRC functional redundancy in epidermal stem cells

in the repression of unwanted TFs preserves epidermal                   Genome-wide studies of Polycomb occupancy have
transcriptional identity (Fig. 6).                                   shown that PRC1 and PRC2 binding largely overlaps (Boy-
                                                                     er et al. 2006; Tolhuis et al. 2006; Ku et al. 2008). In line
                                                                     with these observations, loss-of-function studies in Dro-
Discussion                                                           sophila have shown similar homeotic transformations in
                                                                     PRC1 and PRC2 mutants, leading to a model of interde-
Maintenance of specific gene expression patterns has a               pendent function of PRC1 and PRC2, both genetically
central role in the establishment of cell differentiation            and biochemically (Simon et al. 1992; Cao et al. 2002;
programs during development. In this study, we provide               Min et al. 2003; Wang et al. 2004b). In contrast, studies
evidence for the importance of functional redundancy be-             in mammalian tissues revealed surprising independent
tween repressive functions of PRC1 and PRC2 in the                   and even opposing functions of PRC1 and PRC2 in multi-
maintenance of somatic stem cell identity, differentia-              ple tissues, including the skin, the tongue, the intestine,
tion, and tissue development. We show that genetic abla-             and the hematopoietic system. In many of these studies,
tion of both PRC1 and PRC2 in EpSCs impairs epidermal                the phenotype of PRC1 loss was often more severe than
stratification and tissue development, a phenotype that is           that of PRC2 loss (Lessard et al. 1999; Majewski et al.
not observed upon ablation of individual complexes.                  2010; Chiacchiera et al. 2016a,b; Koppens et al. 2016; Lou-
Analysis of gene expression indicates a loss of epidermal            biere et al. 2016; Cohen et al. 2018, 2019; Bar et al. 2019;
identity in Eed; Ring1a/b 3KO EpSCs that is coupled                  Fursova et al. 2019), suggesting a dominant role for
with a strong up-regulation of nonlineage TFs that is re-            PRC1 in gene repression. Overall, mammalian Polycomb
dundantly repressed by both Polycomb complexes. Ex-                  loss-of-function studies indicate that Polycomb regula-
pression of these nonlineage TFs drives loss of epidermal            tion of gene expression is more complex than originally
identity, highlighting the importance of functional redun-           suggested by the Drosophila studies.
dancy between repressive functions of PRC1 and PRC2 in                  Studies in mESCs started to explore functional redun-
preserving cellular identity in vivo (Fig. 6).                       dancy between PRC1 and PRC2 in gene repression. Indeed,
                                                                     mESCs in which Ring1b and Eed were ablated failed to dif-
                                                                     ferentiate into the three germ layers, a phenotype not ob-
                                                                     served in the single Ring1b or Eed knockouts (Leeb et al.
                                                                     2010). Moreover, developmental genes were strongly dere-
                                                                     pressed in the double knockout cells compared with single
                                                                     knockouts, where they largely remained repressed (Leeb
                                                                     et al. 2010). Similarly, a later study revisiting the function-
                                                                     al redundancy between Polycomb complexes has shown
                                                                     that deletion of both complexes results in a stronger up-
                                                                     regulation compared with individual complex ablation
                                                                     (King et al. 2018). However, the significance of functional
                                                                     redundancy between Polycomb complexes in vivo re-
                                                                     mains to be explored. Our studies in the epidermis show
                                                                     that ablation of a single Polycomb complex (either PRC1
                                                                     or PRC2) results in the retention of the other complex’s
                                                                     histone mark. Also, ablation of single Polycomb complex-
                                                                     es results in mild gene derepression of PRC1/2 core-
                                                                     pressed genes, and robust derepression is achieved only
                                                                     when both Polycomb complexes are ablated, in line
                                                                     with the mESCs studies (Leeb et al. 2010; King et al.
                                                                     2018). Furthermore, loss of both PRC1/2 complexes re-
                                                                     sulted in a severely impaired epidermal stratification, a
                                                                     phenotype not observed in single knockouts lacking ei-
                                                                     ther PRC1 or PRC2 activity. To the best of our knowledge,
Figure 6. Redundant repressive functions of PRC1 and PRC2            our results provide the first in vivo evidence of functional
promote epidermal cell fate in EpSCs. (Top) In control EpSCs,        redundancy between PRC1 and PRC2 in transcriptional
PRC1 and PRC2 repressive marks are present on the promoters          repression, which is required for proper development of
of nonepidermal genes. Epidermal genes are expressed. (Middle)       the epidermis, a tissue essential for our survival.
In Eed cKO or Ring1a/b 2KO EpSCs, loss of either PRC complex            The observed functional redundancy between PRC1
results in mild derepression of nonepidermal genes. Epidermal
                                                                     and PRC2 transcriptional repression in the epidermis rais-
gene expression is not suppressed. (Bottom) In Eed; Ring1a/b
3KO EpSCs, loss of both complexes results in a robust derepres-
                                                                     es questions about the physiological significance of this
sion of nonepidermal transcription factor (TF) genes, highlighting   coregulation. Eed; Ring1a/b 3KO EpSCs displayed down-
that PRC1 and PRC2 redundantly repress these genes. Epidermal        regulation in expression of key epidermal lineage identity
genes are suppressed in Eed; Ring1a/b 3KO EpSCs, emphasizing         genes such as the TF Trp63 (Mills et al. 1999; Koster et al.
the physiological importance of PRC1 and PRC2 functional re-         2004) and the chromatin regulator Satb1 (Fessing et al.
dundancy in cell identity maintenance.                               2011), as well as the signaling pathway component

                                                                                                      GENES & DEVELOPMENT             7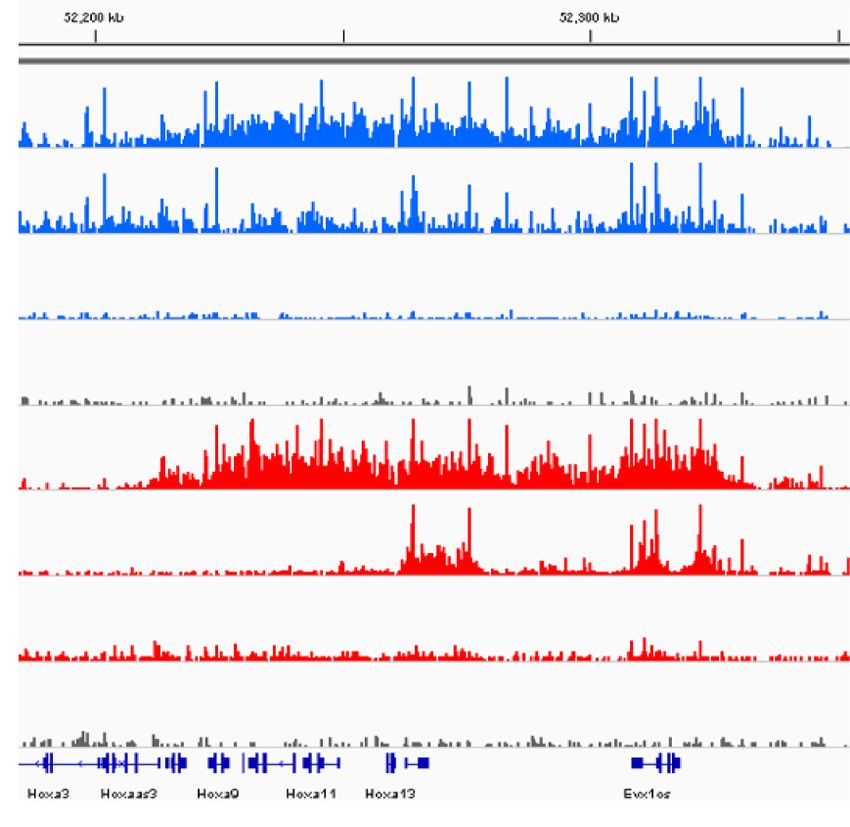
Downloaded from genesdev.cshlp.org on September 27, 2021 - Published by Cold Spring Harbor Laboratory Press

Cohen et al.

Fgfr2, which also plays a role in mechanosensory Merkel              PRC2 has physiological significance in the protection of cel-
cell formation (Nguyen et al. 2018, 2019). Interestingly,            lular identity, which is essential for proper tissue develop-
these genes are not direct targets of Polycomb complexes,            ment, regeneration, and organ function.
indicating that the changes in epidermal gene expression
in Eed; Ring1a/b 3KO EpSCs are likely indirect. We ob-
                                                                     Materials and methods
served a strong up-regulation of nonepidermal genes in
Eed; Ring1a/b 3KO EpSCs compared with single knock-                  Mice
outs or control cells, including many developmental mas-
ter regulator TFs that are direct targets of PRC1 and PRC2           All mice used in this study were housed at the Center of Compar-
in EpSCs. Remarkably, overexpression of small combina-               ative Medicine and Surgery (CCMS), Icahn School of Medicine at
                                                                     Mount Sinai (ISMMS), according to the Institutional Animal Care
tions of these nonepidermal TFs resulted in significant
                                                                     and Use Committee (IACUC) guidelines (protocol no. LA11-
down-regulation of epidermal lineage genes, highlighting             0020). Eedflox/flox mice were kindly provided by Dr. Weipeng
the role of redundant PRC1 and PRC2 repression in pre-               Mu and Dr. Terry Magnuson (Mu et al. 2014). Ring1a −/− and
serving lineage identity. Studies of Polycomb complexes              Ring1bflox/flox mice were previously described (del Mar Lorente
in multiple systems have shown that loss of either                   et al. 2000), and were kindly provided by Dr. Miguel Vidal. Both
PRC1 or PRC2 leads to up-regulation of nonlineage genes              male and female mice were used in this study. Primer sequences
(Calés et al. 2008; Chiacchiera et al. 2016a; Ikawa et al.           used for genotyping are available in Supplemental Table S7.
2016; von Schimmelmann et al. 2016; Yakushiji-Kaminat-
sui et al. 2016; Vidal and Starowicz 2017; Jadhav et al.             Cell cultures
2019). It would be intriguing to investigate whether func-
tional redundancy is similarly critical for preserving the           HEK293T cells were cultured in DMEM, supplemented with
                                                                     10% heat-inactivated fetal bovine serum (R&D Systems) and
identity of those tissues. Notably, coablation of PRC1
                                                                     1% pen/strep solution (Life Technologies). Primary epidermal
and PRC2 in the tongue epithelium did not result in exac-
                                                                     progenitors were isolated from newborn mouse epidermis as pre-
erbation of the phenotype of the PRC1-null tongue epithe-            viously described (Cohen et al. 2018) and cultured in E-media
lium as seen in the skin epidermis (Bar et al. 2019). This is        (Rheinwald and Green 1977) supplemented with 15% serum
somewhat in line with the observation made in mESCs,                 and 0.05 mM CaCl2.
where nucleosome occupancy is controlled predominant-
ly by PRC1 (King et al. 2018). These variabilities suggest
                                                                     Ectopic expression of nonepidermal TFs in primary epidermal progenitors
that the importance of functional redundancy between
PRC1 and PRC2 may be tissue specific or context depen-               HEK293T cells were transfected with the 20 µg of lentiviral
dent or both.                                                        construct (Horizon Discovery lentiviral library), 2.5 µg of packing
   The discovery of functional redundancy between PRC1               plasmids (pPAX2, pMD2.G, AddGene plasmids 12260 and 12259,
                                                                     a kind gift from Didier Trono), 100 mM CaCl2, and 1× HBS
and PRC2 in vivo has multiple translational implications.
                                                                     (2× HBS stock solution: 280 mM NaCl, 10 mM KCl, 1.5 mM Na2-
First, proteins of both Polycomb complexes, in particular
                                                                     HPO4, 12 mM dextrose, 50 mM HEPES) in a total volume of 1 mL,
EZH2 and BMI1, are often overexpressed in epithelial can-            diluted into 7 mL of DMEM media supplemented with 10% heat-
cers, including skin cancers (Balasubramanian et al. 2008;           inactivated fetal bovine serum (R&D Systems) and 1% pen/strep
Eckert et al. 2011; Adhikary et al. 2015; Ferretti et al. 2016;      solution (Life Technologies). Media were changed 8 h post trans-
Fisher et al. 2016). These studies suggest specific roles of         fection, and cells were cultured for an additional 48 h to produce
Polycomb subunits in tumorigenesis; however, how their               lentiviral particles. Lentivirus-containing media were collected,
overexpression affects the function of PRC1 and PRC2 re-             filtered with a 0.45-µm strainer, and concentrated with Amicon
pression in cancer cells remains unclear. The therapeutic            ultracentrifuge concentration units (Sigma-Millipore), producing
use of EZH2 inhibitors has been clinically studied (Comet            total of 2.5 mL of high-titer virus.
                                                                        Fifty thousand cells were plated for lentiviral combinations (six
et al. 2016), with one inhibitor recently approved for hu-
                                                                     viruses per combination). Plasmids used in this study include
man use (Mullard 2020). Understanding whether function-
                                                                     pLVX304-Blast-LacZ (control) and TF-expressing vectors, all are
al redundancy between PRC1 and PRC2 exists in cancer                 pLVX304-Blast, each expressing one TF. Combo 1 consisted of
cells may help improve cancer therapy by simultaneous                pLX304-NR4A2, GATA2, FOXA1, TBX3, TBX5, and NKX2-9.
targeting of both complexes. Second, functional redundan-            Combo 2 consists of PLVX304-SIX2, HOXD13, SIX3, OTX2,
cy between PRC1 and PRC2 in the repression of develop-               PITX2, and SATB2. Cells were infected twice with 100 µL of
mental genes may also be relevant for reprogramming.                 each virus in a total volume of 3 mL of E-media and 5 µg/mL poly-
Pluripotent cells can be isolated either from the inner              brene and spun for 30 min at 32°C. Media were changed 8 h after
cell mass of the blastocyst or from the epiblast of a post-im-       each infection, and cells were cultured for an additional 48 h in E
plantation embryo (Marks et al. 2012; Gafni et al. 2013;             media and were then were selected with 0.4 µg/mL blasticidin for
                                                                     48 h. After selection, cells were cultured until confluent in E-me-
Weinberger et al. 2016). One molecular difference between
                                                                     dia and collected in RLT plus buffer (Qiagen) for RNA extraction.
these two pluripotent cell types is deposition of H3K27me3
on lineage genes in the epiblast cells (Weinberger et al.
2016). The physiological significance of PRC1 and PRC2               Fluorescence-activated cell sorting
functional redundancy raises the question whether loss of            Isolation of epidermal progenitors from control, Eed cKO,
both the PRC1 and PRC2 complexes can facilitate the re-              Ring1a/b 2KO, and Eed; Ring1a/b 3KO mice was done as previ-
programming of somatic cells to a pluripotent state. Here            ously described (Cohen et al. 2019). P0 back skins were collected
we show that functional redundancy between PRC1 and                  and incubated for 4–6 h in 1.26 U/mL dispase (Invitrogen) at 4°C.

8      GENES & DEVELOPMENT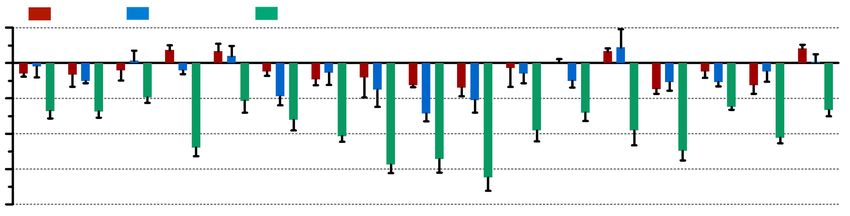
Downloaded from genesdev.cshlp.org on September 27, 2021 - Published by Cold Spring Harbor Laboratory Press

                                                                                              PRC functional redundancy in epidermal stem cells

The epidermis was gently peeled from the underlying dermis, fol-          (Buenrostro et al. 2015). Briefly, cells were precipitated by centri-
lowed by 0.25% trypsin treatment for 15 min at 37°C. The cell             fugation and resuspended in lysis buffer (10 mM Tris-HCl at pH
suspension was washed twice with 1× PBS; stained with 1:200               7.4, 10 mM NaCl, 3 mM MgCl2, 0.1% IGEPAL CA-630). Cell ly-
Sca1-PerCP-Cy5.5 (Biolegend), 1:100 α6-integrin-FITC (eBio-               sate was precipitated, and pellets were incubated with a Tn5
sciences), and 1:200 EpCAM-APC (Biolegend) for 30 min on ice;             transposase kit (Nextra) for 30 min at 37°C. The transposition re-
and washed twice with 1× HBSS before cell sorting. Interfollicular        action was stopped by addition of ATAC clean-up buffer (900 mM
epidermis, enriched for epidermal progenitors, was sorted as              NaCl, 300 mM EDTA) and cleaned using Qiagen MinElute kit.
EpCAM(+), Sca1(+), and α6-integrin(high). For ChIP and ChIP-              Transposed DNA fragments were amplified using a NEBNext
seq analyses, cell suspensions were stained for cell viability and        high-fidelity library construction kit (New England Biolabs).
cross-linked before staining and FACS sorting as described above.         The ATAC-seq library was prepared as previously described
All cell isolations were performed on a FACS Influx instrument            (Buenrostro et al. 2015) with the following modifications: Trans-
(BD) in the Flow Cytometry Core Facility at Icahn School of Med-          posed DNA was amplified by PCR with a common forward prim-
icine at Mount Sinai.                                                     er and barcoded reverse primer, using a NEBNext high fidelity kit,
                                                                          for 10 cycles. The number of cycles required for final amplifica-
                                                                          tion (N) was determined by a qPCR side reaction. Final amplifica-
Chromatin immunoprecipitation, ChIP-qPCR, and library                     tion was performed with N cycles, using 20 µL of each sample.
preparation                                                               The amplified library was cleaned using AMPure XP beads ac-
                                                                          cording to the manufacturer’s instructions.
Chromatin immunoprecipitation (ChIP) was performed on FACS-
sorted populations using materials and methods as previously de-
scribed (Bar et al. 2020). A total of 0.4 × 10⁶ cells was used for each   RNA purification, RT-qPCR, and library preparation
histone mark per ChIP. Before cell sorting, cells were stained for
viability using Zombie violet (Biolegend) and then cross-linked           FACS-purified cells were collected directly into RLT Plus buffer
using fresh solution with a final concentration of 1% formalde-           (Qiagen), and total RNA was isolated with the RNeasy Plus micro
hyde (Thermo Fisher Scientific) for 10 min at room temperature.           kit (Qiagen). Complimentary DNA was reverse-transcribed from
Cross-linking was stopped by the addition of glycine (final con-          total RNA using qScript cDNA SuperMix (Quanta Biosciences)
centration 125 mM) for 5 min of incubation at room temperature,           according to the manufacturer’s instructions. Samples were ana-
followed by two washes with 1× PBS. Cells were incubated in ly-           lyzed by RT-qPCR using LightCycler 480 SYBR Green I master
sis buffer 1 (50 mM HEPES at pH 7.5, 140 mM Nacl, 1 mM EDTA,              mix (Roche Diagnostics) on a LightCycler 480 instrument
10% glycerol, 0.5% NP-40, 0.25% Triton X-100, protease inhibi-            (Roche). Results were normalized to Ppib mRNA levels. Primer
tor cocktail [Roche]) for 10 min on ice and then incubated for            sequences are available in Supplemental Table S7. Before library
10 min with lysis buffer 2 (10 mM Tris-HCl at pH 7.5, 200 mM              construction, the sample quality was measured using an Agilent
NaCl, 1 mM EDTA, 0.5 mM EGTA). Before ChIP, cells were re-                Bioanalyzer, and samples with RNA integrity numbers greater
suspended in lysis buffer 3 (10 mM Tris-HCl at pH 8.0, 200 mM             than eight were used. Ten nanograms of total RNA was reverse
NaCl, 1 mM EDTA, 0.5 mM EGTA, 0.1% Na-deoxycholate,                       transcribed and amplified using the Ovation RNA-seq system
0.5% N-laurylsarcosine, 1% Triton X-100) and sonicated using              V2 (Nugen). Libraries were constructed from 100 ng of sonicated
a Bioruptor sonicator (Diagenode UCD-200) according to a 25×              cDNA (Covaris) using the Ovation ultralow DR multiplex system
regimen of 30 sec of sonication followed by 90 sec of rest at             (Nugen). The concentration and quality of the libraries were de-
2.7°C. Chromatin was incubated overnight at 4°C with antibod-             termined using Qubit (Invitrogen) and Bioanalyzer (Agilent). Con-
ies as indicated in Supplemental Table S7. To detect changes in           structed RNA-seq libraries were sequenced at GENEWIZ on the
H2AK119ub and H3K27me3 levels between control, Eed cKO,                   Illumina HiSeq platform, obtaining 150-nt paired-end reads.
and Ring1a/b 2KO samples, we used Drosophila spike-in chroma-
tin and antibody (Active Motif) as normalization controls, as pre-
viously described (Egan et al. 2016). DYNAL protein G magnetic            Immunofluorescence staining and microscopy
beads (Invitrogen) were added the next day and incubated for 4            Back skin tissues were collected from newborn mice, embedded in
h. The beads were sequentially washed with low-salt, high-salt,           OCT compound (Tissue-Tek) and subsequently cut into 7-µm sec-
LiCl, and Tris-EDTA buffers for 10 min each at 4°C. Bound chro-           tions using a Leica cryostat. Slides were then prefixed in 4% PFA
matin was eluted, and cross-linking was reversed by overnight in-         for 10 min at room temperature and blocked overnight at 4°C in
cubation at 65°C, followed by RNase A (Sigma-Aldrich) and                 blocking solution (1× PBS supplemented with 0.1% Triton X-
proteinase K (Roche Diagnostics) treatments. Samples were puri-           100, 1% BSA, 0.25% normal donkey serum, 0.01% gelatin). Pri-
fied using a ChIP DNA Clean and Concentrator kit (Zymo Re-                mary antibodies were diluted in blocking solution and incubated
search). Samples were analyzed by qPCR using LightCycler 480              for 1 h, followed by 1-h incubation with secondary antibodies.
SYBR Green I master mix (Roche Diagnostics) on a LightCycler              Slides were counterstained with DAPI to visualize nuclei. For
480 instrument (Roche). Primer sequences are available in Sup-            FGFR2 staining, slides were incubated with 100% methanol for
plemental Table S7. For high-throughput ChIP sequencing, librar-          15 min after PFA fixation for tissue permeabilization. TUNEL ap-
ies were constructed from 3 ng of purified DNA using the DNA              optosis detection assay was performed using the in situ cell death
SMART ChIP-seq kit (Clontech) according to the manufacturer’s             detection kit, fluorescein (Roche). All antibodies and dilutions are
instructions. Constructed ChIP-seq libraries were sequenced on            available in Supplemental Table S7. Slides were imaged using a
the Illumina HiSeq 4000 or the Illumina NextSeq 500 platform,             Leica DM5500 slide microscope using 10× or 20× objectives. For
and two biological replicates were used.                                  each immunofluorescence assay, at least three animals from at
                                                                          least two independent litters were analyzed per mutant genotype.

ATAC-seq and library preparation
                                                                          ChIP-seq analysis and data visualization
Skin was harvested as previously described in “Fluorescence-
Activated Cell Sorting.” Sorted cells were collected in PBS               The generation, data processing, and peak calling of the
+10%FBS. ATAC-seq was performed as previously described                   H3K27me3, H2AK119ub, H3K4me3, H3K27ac, SUZ12, and

                                                                                                             GENES & DEVELOPMENT             9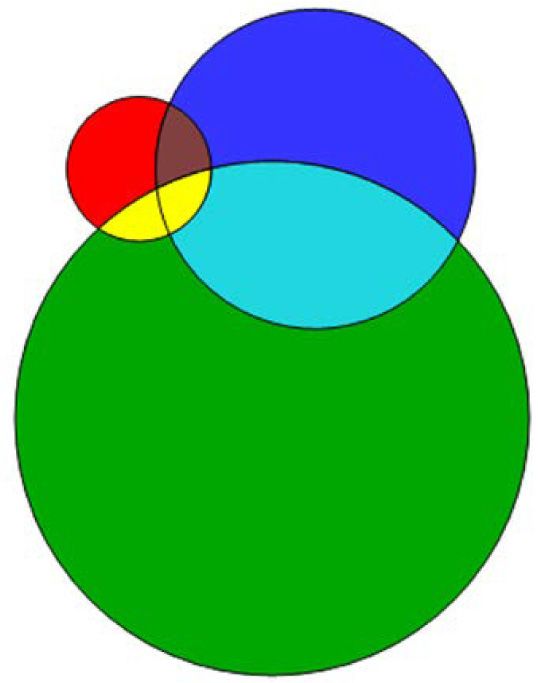
Downloaded from genesdev.cshlp.org on September 27, 2021 - Published by Cold Spring Harbor Laboratory Press

Cohen et al.

RYBP ChIP-seq data were described previously (Cohen et al. 2018;      Quantification of KRT8(+) Merkel cells
Zhao and Zheng 2018). Those data were used to cluster the ChIP-
                                                                      Merkel cells were quantified by the number of KRT8(+) cells per
seq peaks shared between H3K27m3 and H2AK119ub by random-
                                                                      millimeter of skin. Sections had a typical skin length ranging be-
ly sampling 15 million reads from each sample and using the soft-
                                                                      tween 7 and 14 mm. At least 100 mm of total skin length was an-
ware seqMINER (v1.3.4) (Ye et al. 2011). The new H3K27me3 and
                                                                      alyzed per condition from at least three animals (n ≥ 3) of two
H2AK119ub ChIP-seq data were analyzed by the same method,
                                                                      independent litters. Comparisons and statistics were performed
but the reads were also aligned to the fly genome, which was
                                                                      between matching knockout and control littermates.
used as a spike-in control (Active Motif) to adjust for potential
read-depth differences and other ChIP factors in different samples
as previously described (Egan et al. 2016). The H3K27me3 or           Motif enrichment analysis
H2AK119ub peaks called in the CTL samples were sorted by
peak sizes and then used by the seqMINER to generate the read         To perform motif enrichment analysis, the DNA sequences
density heat maps and aggregated profiles in Figure 1. For visual-    within the ±1-kb promoter region, ATAC-seq, or H3K27ac peaks
ization, we also used the Integrative Genomics Viewer (IGV; http      associated with differentially expressed genes that were down-
://software.broadinstitute.org/software/igv) and TDF files from       regulated in Eed; Ring1a/b 3KO versus control EpSCs were ex-
the igvtools (v2.3.57; https://software.broadinstitute.org/           tracted, and the HOMER software (v4.7, default parameters)
software/igv/igvtools).                                               was used to find enriched transcription factor binding motifs.
                                                                      From the results, 19 transcription factors were selected whose ex-
                                                                      pression was up-regulated in Eed; Ring1a/b 3KO EpSCs, and HO-
                                                                      MER was rerun to obtain the enrichment scores shown in
RNA-seq data analysis
                                                                      Supplemental Figure S5F.
The RNA-seq reads were aligned to the mouse transcriptomes
corresponding to the Gencode annotation (vM20) (Harrow et al.
                                                                      Statistics
2012) using the software Kallisto (v0.42.5) (Bray et al. 2016).
The genes with an average TPM (transcripts per million reads          To determine the statistical significance between two groups, a
mapped) > 1 in either control or 3KO were used for differentially     two-sided t-test was performed. To determine the statistical sig-
gene expression analysis with the software DESeq2 (Love et al.        nificance between more than two groups, comparisons were
2014) at the significance level of adjust P-value < 0.05 and more     made using one-way ANOVA with the Tukey post-hoc test cor-
than twofold changes. To compare the gene expression changes          rection for multiple comparisons. For box-and-whisker box plots
across different genotypes and their controls (Eed cKO vs. CTL,       in Supplemental Figure S1, K and M and violin plots in Supple-
Ring1a/b 2KO vs. CTL, and Eed;Ring1a/b 3KO vs. CTL), we               mental Figures S1D, S3, and S4D and Figure 5, C and D, the mid-
used ComBat (v3.36.0) (Johnson et al. 2007) to remove batch           line represents the median. Box limits and colored dashed lines in
effects.                                                              violin plots represent the 25th percentile (lower quartile) and
                                                                      75th percentile (upper quartile). The upper whisker represents
                                                                      the 75th–95th percentiles, and the lower whisker represents the
ATAC-seq data analysis and data visualization                         5th–25th percentiles. All data in bar graphs are presented as
                                                                      mean ± SEM. The number of biological replicates used for com-
The ATAC-seq reads were aligned to the mouse genome (mm10),
                                                                      parison is indicated in each figure. For each comparison, at least
and peaks were called by the software MACS2 (Feng et al. 2012),       three animals for each group from two independent litters were
otherwise analyzed the same as ChIP-seq data.
                                                                      used. Significance levels were defined as P < 0.05 (∗ ), P < 0.01 (∗∗ ),
                                                                      P < 0.001 (∗∗∗ ), and not significant (NS). For statistical analyses,
                                                                      GraphPad Prism 8 was used.
Gene ontology enrichment analysis                                        No randomization or blinding was performed in this study.
Identification of significantly overrepresented functional catego-    Sample size is indicated in figure legends, and statistical methods
ries was done using the DAVID tool with default setting (Huang        are indicated in the quantification and statistical analysis
da et al. 2009). For PRC1/2-marked clusters, the combined gene        paragraph.
list of clusters 1 + 2 and the entire gene list for clusters 3 and
4 were functionally annotated for biological processes. Selected      Data availability
GO terms were considered significant with P < 0.05 and are
shown in Supplemental Figure S1E and Supplemental Table S2.           The accession number for the sequencing data reported here is
Genes significantly down-regulated or up-regulated in Eed;            GSE158324.
Ring1a/b 3KO versus control epidermal progenitors were anno-
tated using the same significance parameters, and selected GO
terms are shown in Figure 3, C and E, and Supplemental Table S5.      Competing interest statement

                                                                      The authors declare no competing financial interests.
Cell proliferation analysis quantification

Ki67(+) cells in the basal layer of the epidermis were quantified     Acknowledgments
using the Leica LAS AF software. Nuclear DAPI staining was
used to quantify the total number of cells in the basal layer, and    We thank Sergei Ezhkov, Venu Pothula, and all Ezhkova laborato-
the data are shown as the percentage of Ki67(+) cells in the basal    ry members for help and critical suggestions. We thank Miguel
layer. At least 50 random epidermal regions were measured for         Vidal for the Ring1a −/− and Ring1b flox/flox mice and Weipeng
each animal group, from three animals (n = 3) of two independent      Mu and Terry Magnuson for the Eed flox/flox mice. C.B. is a Merk-
litters. Comparisons and statistics were performed between            samer Fund scholar. Research reported here was supported by the
matching knockout and control littermates.                            National Institutes of Health (NIH)/National Institute of

10       GENES & DEVELOPMENT
Downloaded from genesdev.cshlp.org on September 27, 2021 - Published by Cold Spring Harbor Laboratory Press
PRC functional redundancy in epidermal stem cells
Arthritis and Musculoskeletal and Skin Diseases under award embryonic stem cells. Nature 441: 349–353. doi:10.1038/
numbers R01AR069078 and R01AR063724 to E.E., NIH/Nation- nature04733
al Heart, Lung, and Blood Institute grants R01HL148128 and Bray NL, Pimentel H, Melsted P, Pachter L. 2016. Near-optimal
R01HL1 53920 to D. Zheng, and the Tisch Cancer Institute P30 probabilistic RNA-seq quantification. Nat Biotechnol 34:
Cancer Support Grant to E.E. 525–527. doi:10.1038/nbt.3519
Author contributions: I.C., C.B., and E.E. conceived and de- Bruneau BG. 2002. Transcriptional regulation of vertebrate cardi-
signed the experiments. I.C., C.B., and V.J.V. performed the exper- ac morphogenesis. Circ Res 90: 509–519. doi:10.1161/01.RES
iments. J.M.S provided the Horizon Discovery lentiviral library. .0000013072.51957.B7
H.L., P.M.G., D. Zhao, and D. Zheng performed the bioinformatic Buenrostro JD, Wu B, Chang HY, Greenleaf WJ. 2015. ATAC-seq:
analyses. H.K. provided the Ring1a −/− and Ring1bflox/flox mice. a method for assaying chromatin accessibility genome-wide.
I.C., C.B., D. Zhao, H.L., P.M.G. Jr., J.M.S, D. Zheng, and E.E. an- Curr Protoc Mol Biol 109: 21 29 21–21 29 29. doi:10.1002/
alyzed the data. I.C., C.B., and E.E. wrote the manuscript with in- 0471142727.mb2129s109
put from all of the other authors. Calés C, Román-Trufero M, Pavón L, Serrano I, Melgar T, Endoh
M, Pérez C, Koseki H, Vidal M. 2008. Inactivation of the poly-
comb group protein Ring1B unveils an antiproliferative role in
References hematopoietic cell expansion and cooperation with tumori-
genesis associated with Ink4a deletion. Mol Cell Biol 28:
Adhikary G, Grun D, Balasubramanian S, Kerr C, Huang JM, Eck- 1018–1028. doi:10.1128/MCB.01136-07
ert RL. 2015. Survival of skin cancer stem cells requires the Cao R, Wang LJ, Wang HB, Xia L, Erdjument-Bromage H, Tempst
Ezh2 polycomb group protein. Carcinogenesis 36: 800–810. P, Jones RS, Zhang Y. 2002. Role of histone H3 lysine 27 meth-
doi:10.1093/carcin/bgv064 ylation in Polycomb-group silencing. Science 298: 1039–1043.
Allis CD, Jenuwein T. 2016. The molecular hallmarks of epige- doi:10.1126/science.1076997
netic control. Nat Rev Genet 17: 487–500. doi:10.1038/nrg Chiacchiera F, Rossi A, Jammula S, Piunti A, Scelfo A, Ordóñez-
.2016.59 Morán P, Huelsken J, Koseki H, Pasini D. 2016a. Polycomb
Aloia L, Di Stefano B, Di Croce L. 2013. Polycomb complexes in complex PRC1 preserves intestinal stem cell identity by sus-
stem cells and embryonic development. Development 140: taining Wnt/β-catenin transcriptional activity. Cell Stem
2525–2534. doi:10.1242/dev.091553
Cell 18: 91–103. doi:10.1016/j.stem.2015.09.019
Atlasi Y, Stunnenberg HG. 2017. The interplay of epigenetic
Chiacchiera F, Rossi A, Jammula S, Zanotti M, Pasini D. 2016b.
marks during stem cell differentiation and development.
PRC2 preserves intestinal progenitors and restricts secretory
Nat Rev Genet 18: 643–658. doi:10.1038/nrg.2017.57
lineage commitment. EMBO J 35: 2301–2314. doi:10.15252/
Balasubramanian S, Lee K, Adhikary G, Gopalakrishnan R, Rorke
embj.201694550
EA, Eckert RL. 2008. The Bmi-1 polycomb group gene in skin
Cohen I, Zhao D, Bar C, Valdes VJ, Dauber-Decker KL, Nguyen
cancer: regulation of function by (-)-epigallocatechin-3-gal-
MB, Nakayama M, Rendl M, Bickmore WA, Koseki H, et al.
late. Nutr Rev 66: S65–S68. doi:10.1111/j.1753-4887.2008
2018. PRC1 fine-tunes gene repression and activation to safe-
.00071.x
guard skin development and stem cell specification. Cell Stem
Bar C, Cohen I, Zhao D, Pothula V, Litskevitch A, Koseki H,
Cell 22: 726–739.e7. doi:10.1016/j.stem.2018.04.005
Zheng D, Ezhkova E. 2019. Polycomb repressive complex 1
Cohen I, Zhao D, Menon G, Nakayama M, Koseki H, Zheng D,
controls maintenance of fungiform papillae by repressing
Ezhkova E. 2019. PRC1 preserves epidermal tissue integrity
sonic hedgehog expression. Cell Rep 28: 257–266.e5. doi:10
independently of PRC2. Genes Dev 33: 55–60. doi:10.1101/
.1016/j.celrep.2019.06.011
Bar C, Valdes VJ, Ezhkova E. 2020. Chromatin immunopre- gad.319939.118
cipitation of low number of FACS-purified epidermal cells. Cohen I, Bar C, Ezhkova E. 2020. Activity of PRC1 and histone
Methods Mol Biol 2154: 197–215. doi:10.1007/978-1-0716- H2AK119 monoubiquitination: revising popular misconcep-
0648-3_17 tions. Bioessays 42: e1900192. doi:10.1002/bies.201900192
Bardot ES, Valdes VJ, Zhang J, Perdigoto CN, Nicolis S, Hearn SA, Comet I, Riising EM, Leblanc B, Helin K. 2016. Maintaining cell
Silva JM, Ezhkova E. 2013. Polycomb subunits Ezh1 and Ezh2 identity: PRC2-mediated regulation of transcription and can-
regulate the Merkel cell differentiation program in skin stem cer. Nat Rev Cancer 16: 803–810. doi:10.1038/nrc.2016.83
cells. EMBO J 32: 1990–2000. doi:10.1038/emboj.2013.110 Cooper S, Dienstbier M, Hassan R, Schermelleh L, Sharif J, Black-
Bernstein BE, Mikkelsen TS, Xie X, Kamal M, Huebert DJ, Cuff J, ledge NP, De Marco V, Elderkin S, Koseki H, Klose R, et al.
Fry B, Meissner A, Wernig M, Plath K, et al. 2006. A bivalent 2014. Targeting polycomb to pericentric heterochromatin in
chromatin structure marks key developmental genes in em- embryonic stem cells reveals a role for H2AK119u1 in PRC2
bryonic stem cells. Cell 125: 315–326. doi:10.1016/j.cell recruitment. Cell Rep 7: 1456–1470. doi:10.1016/j.celrep
.2006.02.041 .2014.04.012
Blackledge NP, Farcas AM, Kondo T, King HW, McGouran JF, Czermin B, Melfi R, McCabe D, Seitz V, Imhof A, Pirrotta V.
Hanssen LL, Ito S, Cooper S, Kondo K, Koseki Y, et al. 2014. 2002. Drosophila enhancer of Zeste/ESC complexes have a
Variant PRC1 complex-dependent H2A ubiquitylation drives histone H3 methyltransferase activity that marks chromo-
PRC2 recruitment and polycomb domain formation. Cell 157: somal Polycomb sites. Cell 111: 185–196. doi:10.1016/
1445–1459. doi:10.1016/j.cell.2014.05.004 S0092-8674(02)00975-3
Blackledge NP, Fursova NA, Kelley JR, Huseyin MK, Feldmann Dassule HR, Lewis P, Bei M, Maas R, McMahon AP. 2000. Sonic
A, Klose RJ. 2020. PRC1 catalytic activity Is central to Poly- hedgehog regulates growth and morphogenesis of the tooth.
comb system function. Mol Cell 77: 857–874.e9. doi:10 Development 127: 4775–4785.
.1016/j.molcel.2019.12.001 Dauber KL, Perdigoto CN, Valdes VJ, Santoriello FJ, Cohen I, Ezh-
Boyer LA, Plath K, Zeitlinger J, Brambrink T, Medeiros LA, Lee kova E. 2016. Dissecting the roles of Polycomb repressive
TI, Levine SS, Wernig M, Tajonar A, Ray MK, et al. 2006. Poly- complex 2 subunits in the control of skin development. J In-
comb complexes repress developmental regulators in murine vest Dermatol 136: 1647–1655. doi:10.1016/j.jid.2016.02.809
GENES & DEVELOPMENT 11Downloaded from genesdev.cshlp.org on September 27, 2021 - Published by Cold Spring Harbor Laboratory Press
Cohen et al.
del Mar Lorente M, Marcos-Gutierrez C, Perez C, Schoorlemmer 2013. Derivation of novel human ground state naive pluripo-
J, Ramirez A, Magin T, Vidal M. 2000. Loss- and gain-of-func- tent stem cells. Nature 504: 282–286. doi:10.1038/
tion mutations show a polycomb group function for Ring1A in nature12745
mice. Development 127: 5093–5100. Gao Z, Zhang J, Bonasio R, Strino F, Sawai A, Parisi F, Kluger Y,
de Napoles M, Mermoud JE, Wakao R, Tang YA, Endoh M, Appa- Reinberg D. 2012. PCGF homologs, CBX proteins, and RYBP
nah R, Nesterova TB, Silva J, Otte AP, Vidal M, et al. 2004. Pol- define functionally distinct PRC1 family complexes. Mol
ycomb group proteins Ring1A/B link ubiquitylation of histone Cell 45: 344–356. doi:10.1016/j.molcel.2012.01.002
H2A to heritable gene silencing and X inactivation. Dev Cell Gao Z, Lee P, Stafford JM, von Schimmelmann M, Schaefer A,
7: 663–676. doi:10.1016/j.devcel.2004.10.005 Reinberg D. 2014. An AUTS2–Polycomb complex activates
Eckert RL, Adhikary G, Rorke EA, Chew YC, Balasubramanian S. gene expression in the CNS. Nature 516: 349–354. doi:10
2011. Polycomb group proteins are key regulators of keratino- .1038/nature13921
cyte function. J Invest Dermatol 131: 295–301. doi:10.1038/jid Ge Y, Fuchs E. 2018. Stretching the limits: from homeostasis to
.2010.318 stem cell plasticity in wound healing and cancer. Nat Rev Ge-
Egan B, Yuan CC, Craske ML, Labhart P, Guler GD, Arnott D, net 19: 311–325. doi:10.1038/nrg.2018.9
Maile TM, Busby J, Henry C, Kelly TK, et al. 2016. An alterna- Harrow J, Frankish A, Gonzalez JM, Tapanari E, Diekhans M,
tive approach to ChIP-seq normalization enables detection of Kokocinski F, Aken BL, Barrell D, Zadissa A, Searle S, et al.
genome-wide changes in histone H3 lysine 27 trimethylation 2012. GENCODE: the reference human genome annotation
upon EZH2 inhibition. PLoS One 11: e0166438. doi:10.1371/ for the ENCODE project. Genome Res 22: 1760–1774. doi:10
journal.pone.0166438 .1101/gr.135350.111
Endoh M, Endo TA, Endoh T, Isono K, Sharif J, Ohara O, Toyoda Healy E, Mucha M, Glancy E, Fitzpatrick DJ, Conway E, Neikes
T, Ito T, Eskeland R, Bickmore WA, et al. 2012. Histone H2A HK, Monger C, Van Mierlo G, Baltissen MP, Koseki Y, et al.
mono-ubiquitination is a crucial step to mediate PRC1-depen- 2019. PRC2.1 and PRC2.2 synergize to coordinate H3K27 tri-
dent repression of developmental genes to maintain ES cell methylation. Mol Cell 76: 437–452.e6. doi:10.1016/j.molcel
identity. PLoS Genet 8: e1002774. doi:10.1371/journal.pgen .2019.08.012
.1002774 Heinz S, Benner C, Spann N, Bertolino E, Lin YC, Laslo P, Cheng
Evseenko D, Zhu Y, Schenke-Layland K, Kuo J, Latour B, Ge S, JX, Murre C, Singh H, Glass CK. 2010. Simple combinations of
Scholes J, Dravid G, Li X, MacLellan WR, et al. 2010. Mapping lineage-determining transcription factors prime cis-regulato-
the first stages of mesoderm commitment during differentia- ry elements required for macrophage and B cell identities.
tion of human embryonic stem cells. Proc Natl Acad Sci Mol Cell 38: 576–589. doi:10.1016/j.molcel.2010.05.004
107: 13742–13747. doi:10.1073/pnas.1002077107 Huang da W, Sherman BT, Lempicki RA. 2009. Systematic and in-
Feng J, Liu T, Qin B, Zhang Y, Liu XS. 2012. Identifying ChIP-seq tegrative analysis of large gene lists using DAVID bioinfor-
enrichment using MACS. Nat Protoc 7: 1728–1740. doi:10 matics resources. Nat Protoc 4: 44–57. doi:10.1038/nprot
.1038/nprot.2012.101 .2008.211
Ferretti R, Bhutkar A, McNamara MC, Lees JA. 2016. BMI1 in- Ikawa T, Masuda K, Endo TA, Endo M, Isono K, Koseki Y, Naka-
duces an invasive signature in melanoma that promotes me- gawa R, Kometani K, Takano J, Agata Y, et al. 2016. Conver-
tastasis and chemoresistance. Genes Dev 30: 18–33. doi:10 sion of T cells to B cells by inactivation of polycomb-
.1101/gad.267757.115 mediated epigenetic suppression of the B-lineage program.
Fessing MY, Mardaryev AN, Gdula MR, Sharov AA, Sharova TY, Genes Dev 30: 2475–2485. doi:10.1101/gad.290593.116
Rapisarda V, Gordon KB, Smorodchenko AD, Poterlowicz K, Jadhav U, Cavazza A, Banerjee KK, Xie H, O’Neill NK, Saenz-
Ferone G, et al. 2011. P63 regulates Satb1 to control tissue- Vash V, Herbert Z, Madha S, Orkin SH, Zhai H, et al. 2019. Ex-
specific chromatin remodeling during development of the epi- tensive recovery of embryonic enhancer and gene memory
dermis. J Cell Biol 194: 825–839. doi:10.1083/jcb.201101148 stored in hypomethylated enhancer DNA. Mol Cell 74: 542–
Fischle W, Wang Y, Jacobs SA, Kim Y, Allis CD, Khorasanizadeh 554.e5. doi:10.1016/j.molcel.2019.02.024
S. 2003. Molecular basis for the discrimination of repressive Johnson WE, Li C, Rabinovic A. 2007. Adjusting batch effects in
methyl-lysine marks in histone H3 by Polycomb and HP1 microarray expression data using empirical Bayes methods.
chromodomains. Genes Dev 17: 1870–1881. doi:10.1101/gad Biostatistics 8: 118–127. doi:10.1093/biostatistics/kxj037
.1110503 King HW, Fursova NA, Blackledge NP, Klose RJ. 2018. Polycomb
Fisher ML, Adhikary G, Grun D, Kaetzel DM, Eckert RL. 2016. repressive complex 1 shapes the nucleosome landscape but
The Ezh2 polycomb group protein drives an aggressive pheno- not accessibility at target genes. Genome Res 28: 1494–
type in melanoma cancer stem cells and is a target of diet de- 1507. doi:10.1101/gr.237180.118
rived sulforaphane. Mol Carcinog 55: 2024–2036. doi:10.1002/ Koppens MA, Bounova G, Gargiulo G, Tanger E, Janssen H,
mc.22448 Cornelissen-Steijger P, Blom M, Song JY, Wessels LF, van
Frangini A, Sjöberg M, Roman-Trufero M, Dharmalingam G, Lohuizen M. 2016. Deletion of polycomb repressive
Haberle V, Bartke T, Lenhard B, Malumbres M, Vidal M, Dil- complex 2 from mouse intestine causes loss of stem cells.
lon N. 2013. The aurora B kinase and the polycomb protein Gastroenterology 151: 684–697.e12. doi:10.1053/j.gastro
ring1B combine to regulate active promoters in quiescent .2016.06.020
lymphocytes. Mol Cell 51: 647–661. doi:10.1016/j.molcel Koster MI, Kim S, Mills AA, DeMayo FJ, Roop DR. 2004. P63 is
.2013.08.022 the molecular switch for initiation of an epithelial stratifica-
Fursova NA, Blackledge NP, Nakayama M, Ito S, Koseki Y, Farcas tion program. Genes Dev 18: 126–131. doi:10.1101/gad
AM, King HW, Koseki H, Klose RJ. 2019. Synergy between .1165104
variant PRC1 complexes defines Polycomb-mediated gene re- Ku M, Koche RP, Rheinbay E, Mendenhall EM, Endoh M, Mikkel-
pression. Mol Cell 74: 1020–1036.e8. doi:10.1016/j.molcel sen TS, Presser A, Nusbaum C, Xie X, Chi AS, et al. 2008.
.2019.03.024 Genomewide analysis of PRC1 and PRC2 occupancy identi-
Gafni O, Weinberger L, Mansour AA, Manor YS, Chomsky E, fies two classes of bivalent domains. PLoS Genet 4:
Ben-Yosef D, Kalma Y, Viukov S, Maza I, Zviran A, et al. e1000242. doi:10.1371/journal.pgen.1000242
12 GENES & DEVELOPMENTYou can also read