Sunlight-absorbing aerosol amplifies the seasonal cycle in low-cloud fraction over the southeast Atlantic
←
→
Page content transcription
If your browser does not render page correctly, please read the page content below
Atmos. Chem. Phys., 21, 11179–11199, 2021
https://doi.org/10.5194/acp-21-11179-2021
© Author(s) 2021. This work is distributed under
the Creative Commons Attribution 4.0 License.

Sunlight-absorbing aerosol amplifies the seasonal cycle in low-cloud
fraction over the southeast Atlantic
Jianhao Zhang1,2,3 and Paquita Zuidema1
1 Rosenstiel School of Marine and Atmospheric Sciences, University of Miami, Miami, FL, USA
2 Chemical  Sciences Laboratory, National Oceanic and Atmospheric Administration (NOAA), Boulder, CO, USA
3 National Research Council, National Academies of Sciences, Engineering, Medicine (NASEM), Washington DC, USA

Correspondence: Jianhao Zhang (jianhao.zhang@noaa.gov, jzhang@miami.edu)

Received: 31 March 2021 – Discussion started: 1 April 2021
Revised: 11 June 2021 – Accepted: 1 July 2021 – Published: 23 July 2021

Abstract. The mean altitude of the smoke loading over the          crease and are more stratiform in October when the smoke
southeast Atlantic moves from the boundary layer in July           loadings are higher. The increased free tropospheric moisture
to the free troposphere by October. This study details the         can help sustain the clouds through a reduction in evapora-
month-by-month changes in cloud properties and the large-          tive drying during cloud-top entrainment. Enhanced subsi-
scale environment as a function of the biomass burning             dence above the coastal upwelling region, increasing cloud
aerosol loading at Ascension Island (8◦ S, 14.5◦ W) from           droplet number concentrations, may further prolong cloud
July to October, based on island measurements, satellite re-       lifetime through microphysical interactions. Reduced subsi-
trievals, and reanalysis. In July and August, the smoke load-      dence underneath stronger free tropospheric winds at Ascen-
ing predominantly varies within the boundary layer. Dur-           sion Island supports slightly higher cloud tops during smok-
ing both months, the low-cloud fraction is less and is in-         ier conditions. Overall, the monthly changes in the large-
creasingly cumuliform when more smoke is present, with             scale aerosol and moisture vertical structure act to amplify
the exception of a late morning boundary layer deepening           the seasonal cycle in low-cloud amount and morphology.
that encourages a short-lived cloud development. The me-           This is climatically important, as cloudiness changes dom-
teorology varies little, suggesting aerosol–cloud interactions     inate changes in the top-of-atmosphere radiation budget.
explain the cloudiness changes. September marks a transi-
tion month during which midlatitude disturbances can in-
trude into the Atlantic subtropics, constraining the free tropo-
spheric aerosol closer to the African coast. Stronger bound-       1   Introduction
ary layer winds on cleaner days help deepen, dry, and cool
much of the marine boundary layer compared to that on              The impact of absorbing aerosol on marine boundary layer
days with high smoke loadings, with stratocumulus reduc-           clouds is governed by the relative location of the aerosol
ing everywhere but at the northern deck edge. The Septem-          layer to the cloud layer, with aerosol embedded within the
ber free troposphere is better mixed on smoky days com-            cloud layer, giving rise to local aerosol–cloud microphysi-
pared to October. Longwave cooling rates, generated by a           cal and radiative interactions, while aerosol above a cloud
sharp water vapor gradient at the aerosol layer top, encour-       layer can only be radiatively active until it is entrained into
age a small-scale vertical mixing that could help maintain the     the cloud (Johnson et al., 2004; Johnson, 2005; Costantino
well-mixed smoky September free troposphere. The October           and Bréon, 2013; Yamaguchi et al., 2015; Zhou et al., 2017;
meteorology primarily varies as a function of the strength of      Zhang and Zuidema, 2019; Kacarab et al., 2020; Herbert
the free tropospheric winds advecting aerosol offshore. The        et al., 2020; Che et al., 2021). Many studies focusing on the
free tropospheric aerosol loading is less than in September,       southeastern Atlantic region apply a seasonal averaging to
and the moisture variability is greater. Low-level clouds in-      improve the robust detection of absorbing aerosol impacts
                                                                   (e.g., Wilcox, 2010, 2012; Adebiyi and Zuidema, 2018; Mal-

Published by Copernicus Publications on behalf of the European Geosciences Union.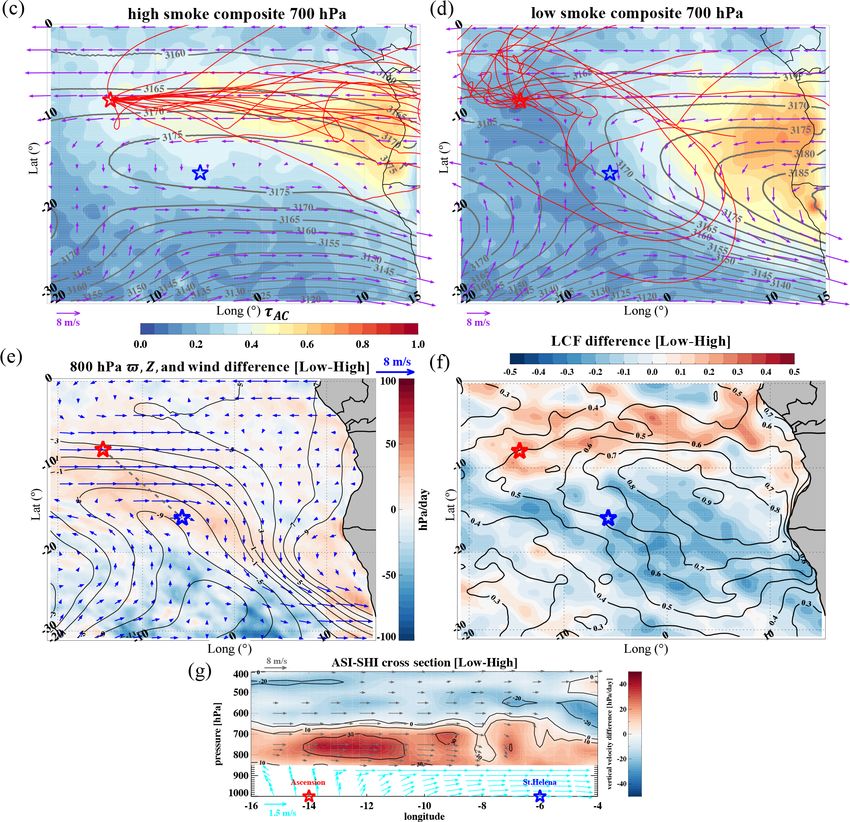
11180                        J. Zhang and P. Zuidema: Sunlight-absorbing aerosol amplifies the low-cloud seasonal cycle

let et al., 2020). This averages, over a noticeable rise in the    tions capable of supporting new insights than were possible
smoke layer mostly from within the boundary layer in July          prior to 2016.
(Zuidema et al., 2018) to a mixture of boundary layer and             This study characterizes the subseasonal evolution in low-
free tropospheric smoke in August (Zhang and Zuidema,              cloud properties and thermodynamic structures as a function
2019; Redemann et al., 2021; Haywood et al., 2021), which          of the aerosol loading from July–October in 2016 and 2017.
is mostly above and distinctly separated from the cloud layer      LASIC field measurements are combined with space-based
by September and October (Shinozuka et al., 2020; Rede-            retrievals of aerosol and low-cloud properties that can distin-
mann et al., 2021; Haywood et al., 2021).                          guish the above-cloud aerosol optical depth (Meyer et al.,
   Zhang and Zuidema (2019, hereafter ZZ19) character-             2015), diurnally resolved geostationary satellite cloud re-
ized the diurnal behavior of the cloudy boundary layer             trievals, and the newer ERA5 reanalysis (Hersbach et al.,
thermodynamic structure as a function of the near-surface          2020). Compositing methods and data sets are introduced in
smoke loading during August over Ascension Island (8◦ S,           Sect. 2. Sections 3–6 present an overview of the seasonal cy-
14.5◦ W). This was motivated by the observation that the           cle and the observed differences by month for high and low
near-surface refractory black carbon (rBC) mass concentra-         smoke loading. Section 7 illustrates how sharp water vapor
tions are largest during August, based on measurements from        gradient in the free troposphere can help maintain a well-
2 years gathered through the Layered Atlantic Smoke Inter-         mixed free troposphere. Section 8 summarizes the key find-
actions with Clouds (LASIC; Zuidema et al., 2015, 2018)            ings.
campaign. When more smoke is present within the marine
boundary layer (MBL) in August, low clouds are fewer, with
lower liquid water paths and lower precipitation frequen-          2   Data sets and compositing approach
cies and intensities compared to clouds occupying a cleaner
MBL. The reduction in cloudiness, which often spans mul-           Ground-based measurements were collected by the Depart-
tiple days, is consistent with a boundary layer semi-direct        ment of Energy (DOE) Atmospheric Radiation Measurement
effect (Ackerman et al., 2000) wherein the relative humidity       (ARM) Mobile Facility 1 (AMF1; Miller et al., 2016). Ra-
is reduced within a warmer boundary layer and less able to         diosonde measurements of temperature, water vapor mixing
sustain cloud. The August analyses also support a novel find-      ratio (qv ), relative humidity (RH), and wind characterize the
ing in which the boundary layer is more coupled in the late        thermodynamic and dynamic vertical structure above Ascen-
morning (after sunrise) under smokier conditions, facilitating     sion Island and St. Helena (5◦ W, 15◦ S; southeast of Ascen-
the cloud vertical development and deepening the boundary          sion Island; hereafter Ascension). Cloud capping inversion
layer. Boundary layer decoupling from afternoon to predawn         base and top heights are derived from the radiosonde poten-
encourages the trapping of subcloud moisture that is then          tial temperature (θ ) and qv profiles following Yin and Al-
ventilated upwards in the morning. The coupling is short-          brecht (2000), with corrections made to profiles that fail the
lived, and most of the cloudiness reduction occurs in the af-      identification algorithm based on visual inspections. An in-
ternoon.                                                           tensive observation period in 2016 deployed eight radioson-
   Here we build on ZZ19 and extend the analyses to the            des per day in August–September and otherwise four per day.
other months with biomass burning aerosol, straddling July         A Ka band 35 GHz zenith-pointing cloud radar (KAZR) pro-
through October. Already known is that the free tropospheric       vides the diurnal cycle of the cloud vertical structure. Mi-
transport of smoke to the remote part of the southeast At-         crowave radiometers at both the AMF1 site and the airport
lantic is related to variability in the strength of the southern   (∼ 5 km away from the AMF1) provide a measure of the
African easterly jet (AEJ-S; Adebiyi and Zuidema, 2016),           cloud liquid water path (LWP). Surface rain frequencies and
primarily during September–October, and that the AEJ-S             intensities were measured by a disdrometer and a tipping
can also advect water vapor (Adebiyi et al., 2015; Deaconu         bucket rain gauge at the AMF1 site. No radar or disdrom-
et al., 2019; Pistone et al., 2021). The meteorology govern-       eter data are available for October 2017. The near-surface
ing aerosol transport in July–August is less well known, al-       rBC mass concentrations are derived from a single-particle
though case studies indicate that lower-level easterlies bring     soot photometer (SP2). A micropulse lidar underpins verti-
aerosol in closer contact with the cloud layer then, easing en-    cally resolved extinction profiles (Delgadillo et al., 2018) for
trainment (Diamond et al., 2018; Zuidema et al., 2018). Also       the radiative transfer calculations. Surface observers from the
less well known is how the cloud properties are influenced         United Kingdom’s Meteorological Office at Ascension Is-
solely by meteorology, separate from the aerosol transport,        land, trained to look away from the island, report cloud types
and by the co-varying moisture loading. This affects our un-       following the World Meteorological Organization’s (WMO)
derstanding of how much synoptics could also be imprinting         protocol (WMO, 1974) every 3 h. These reports inform the
into possible aerosol–cloud interactions. The unique island-       frequency of occurrence of cumuliform and stratiform clouds
based field measurements, combined with specifically devel-        over Ascension. Cumuliform clouds include low-cloud type
oped satellite data sets, provide more detailed characteriza-      1 (CL = 1; cumulus with little vertical extent) and CL = 2
                                                                   (cumulus with moderate or strong vertical extent). Stratiform

Atmos. Chem. Phys., 21, 11179–11199, 2021                                          https://doi.org/10.5194/acp-21-11179-2021
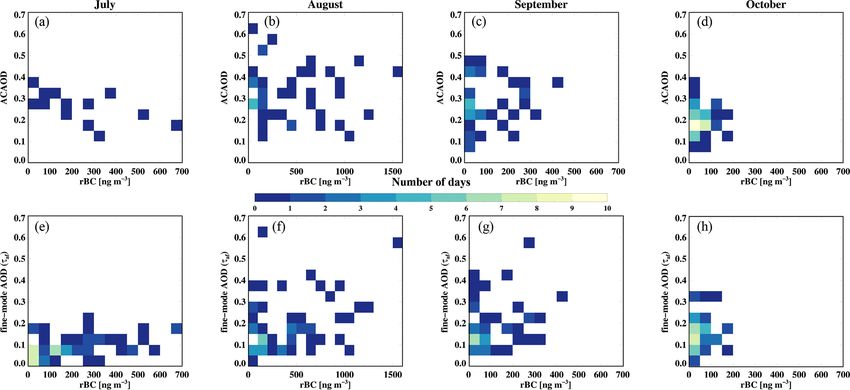
J. Zhang and P. Zuidema: Sunlight-absorbing aerosol amplifies the low-cloud seasonal cycle                                11181

clouds include CL = 4 (stratocumulus formed by the spread-        on the Atmospheric and Environmental Research Rapid Ra-
ing out of cumulus), CL = 5 (stratocumulus), CL = 6 (stratus      diative Transfer Model for Global Climate Models (RRTMG;
but not of bad weather), and CL = 8 (stratocumulus and cu-        Clough et al., 2005), using version 4.84 of the longwave
mulus with bases at different levels). Detailed descriptions      (LW) code and version 3.8 of the shortwave (SW) code.
of LASIC observations, including quality control and post-           The basic approach is to construct composites of the more
processing information, can be found in Sect. 2 of ZZ19.          and less smoky conditions for each month and to analyze the
   The MODerate resolution Imaging Spectroradiometer              differences in cloud properties with an eye on the accompa-
(MODIS) on board the Terra and Aqua satellites supported          nying meteorology and aerosol. Composites can identify rep-
collection 6 retrievals of liquid cloud properties (Platnick      resentative conditions more robustly than case studies and are
et al., 2003) and fine-mode aerosol optical depths at 550 nm      more forgiving of anomalies as long as the anomalies do not
(τaf ; Levy et al., 2013) at 1◦ resolution (level 3). The fine-   dominate. A difficulty rests with what to call smoky in each
mode distinction is chosen to exclude contributions from          month; surface-based measurements may not be indicative
large nonsmoke particles, primarily from sea spray. Above-        of the free tropospheric aerosol loading and vice versa. Joint
cloud aerosol optical depth at 550 nm (ACAOD) from the            histograms of daily ACAOD and rBC mass concentrations
same platforms, at 0.1◦ resolution, are available from Meyer      over Ascension, by month, indicate that smoke is predomi-
et al. (2015, hereafter MODIS–Meyer). Cloud droplet num-          nantly present in the boundary layer during July, equally fre-
ber concentrations (Nd ) are calculated based on cloud effec-     quent in the boundary layer and free troposphere in August,
tive radius (re ) and cloud optical thickness (τcld ) from the    and mostly in the free troposphere in September and October
MODIS–Meyer product, following Painemal and Zuidema               (Fig. 1a–d). This is consistent with aircraft in situ and lidar
(2011). MODIS–Meyer cloud and aerosol retrievals are ag-          assessments, when available (Haywood et al., 2021; Rede-
gregated to 1◦ resolution to match the level 3 MODIS re-          mann et al., 2021), and with the surface-based lidar assess-
trievals, if the former can provide an areal coverage of at       ments, although the latter can be obscured by lower cloud,
least 20 %. Daily mean MODIS-based retrievals rely on av-         and, as a point measurement, may not be representative of
erages between the Terra and Aqua retrievals weighted by          a larger region. Yet, ACAOD is only available when there
their frequency, subsequently averaged spatially over 2◦ by       is cloud underneath (Meyer et al., 2015), allowing free tro-
2◦ , 3◦ by 3◦ , and 4◦ by 4◦ domains centered on Ascension.       pospheric smoke in clear conditions to go undetected. The
Low-cloud fractions across the diurnal cycle are retrieved us-    ACAOD measure may be most suspect in July, when there is
ing the visible infrared solar-infrared split window technique    less low-cloud compared to other months (ZZ19). To better
(VISST; Minnis et al., 2008) from the Spinning Enhanced           detect all smoke, the daily mean clear-sky τaf is also exam-
Visible and Infrared Imager (SEVIRI) on board the geosta-         ined. The joint histogram of τaf and rBC mass concentrations
tionary Meteosat-10 satellite. These are averaged over a 4◦       in July confirms that the free troposphere is frequently clean
by 4◦ domain latitudinally centered on Ascension but cen-         and that smoky periods primarily consist of high loading of
tered slightly to the island’s east (6–10◦ S, 15–11◦ W) to bet-   near-surface rBC mass concentrations (Fig. 1e). Later in the
ter capture the upwind clouds more typical of the island. All-    season, in September and October, the level of agreement be-
sky albedos at the top of atmosphere (TOA), at Terra and          tween the joint histograms of rBC–ACAOD and rBC–τaf fur-
Aqua overpass times, are the ratio of the reflected shortwave     ther supports the interpretation of a shift in smoke vertical
fluxes at TOA to the incoming solar radiation measured by         distribution towards the free troposphere over time (Fig. 1g
the Clouds and the Earth’s Radiant Energy Systems (CERES;         and h). That said, ACAOD and τaf are not entirely inter-
Wielicki et al., 1996) sensors, drawing on the CERES Single       changeable, with a correlation of only ∼ 0.55 over a 3◦ by 3◦
Scanner Footprint (SSF; resolution of 20 km; edition 4) prod-     domain average in September and October and with ACAOD
uct (Su et al., 2015).                                            often exceeding τaf (Fig. 2). Comparisons to aircraft-derived
   Geopotential height, temperature, and wind velocity maps       above-cloud aerosol optical depths reveal a genuinely high
are based on the European Centre for Medium-Range                 bias to the satellite ACAOD estimates (Chang et al., 2021)
Weather Forecasts (ECMWF) fifth-generation atmospheric            which is thought to reflect too high a single-scattering albedo
reanalysis (ERA5; Hersbach et al., 2020), available every         assumption within the retrieval (Peers et al., 2021).
hour and gridded to 0.25◦ spatial resolution. Back trajecto-         Elevated smoke layers are rarely present over Ascension
ries from Ascension at 2000 m, or just above the cloud tops,      in July (Fig. 1a). A few days exist with high ACAOD (above
help indicate the transport of aerosol most likely to entrain     0.2), with those in 2017 coinciding with high near-surface
into the boundary layer near Ascension. The back trajecto-        rBC mass concentrations, but this is not so in early July 2016
ries rely on the NOAA Hybrid Single-Particle Lagrangian           (Fig. 3) and is confirmed by lidar observations (not shown).
Integrated Trajectory (HYSPLIT; Draxler and Hess, 1998)           Variations in column τaf track the near-surface rBC varia-
model, initialized by the NOAA National Center for Envi-          tions, except for early July 2016 (Fig. 3). This suggests that
ronmental Prediction (NCEP) Global Data Assimilation Sys-         the surface-based rBC values can reasonably indicate when
tem (GDAS) at 0.5◦ spatial resolution and relying on the          aerosol exists within the atmospheric column, most of the
model vertical velocity. Radiative transfer calculations rely     time, for July. In August, τaf and ACAOD variations are in-

https://doi.org/10.5194/acp-21-11179-2021                                       Atmos. Chem. Phys., 21, 11179–11199, 2021
11182                        J. Zhang and P. Zuidema: Sunlight-absorbing aerosol amplifies the low-cloud seasonal cycle

Figure 1. Joint histogram of (a–d) MODIS–Meyer above-cloud aerosol optical depth (ACAOD; Meyer et al., 2015) and near-surface rBC
mass concentrations and a joint histogram of (e–h) MODIS-retrieved fine-mode AOD (τaf ) and rBC mass concentrations for July through
October, by month, for 2016 and 2017 combined. Note that the x axis range is larger for August than the other months.

stead more similar when they are both available within a
3◦ by 3◦ domain. High ACAODs / τaf s appear to anticipate
high near-surface smoke loadings by up to a week (Fig. 3).
As an elevated smoke layer is almost always present above
Ascension during August (Fig. 1b and visual inspections
of island-based lidar profiles), surface-based rBC variations
are deemed to better represent the variability in total col-
umn aerosol loading than ACAOD. Therefore, for August,
the composite classifications follow those of ZZ19, which
are based on the near-surface smoke loading. Occasionally,
an increase in the free tropospheric smoke loadings is evi-
dent over the larger (3◦ by 3◦ ) domain before it is perceived
by the island-based rBC measurement, for example, during
the third week in August 2016. In September and October,
the near-surface smoke loadings are much less than in July–
August (Fig. 1), and τaf and ACAOD vary more similarly
instead (Fig. 3). The τaf confirm that those days with missing      Figure 2. MODIS–Meyer ACAOD versus MODIS fine-mode AOD
ACAODs indeed correspond to days with little free tropo-            (τaf ), for September and October, using 3◦ by 3◦ domain averages.
spheric aerosol (e.g., early September 2016; second week of
October 2016 and 2017).
   We use approximate daily mean thresholds to establish the        ues (Fig. 2) is left as is, with ACAOD primarily used as a
more or less smoky composites for each month, relying pri-          sanity check on τaf . Threshold values account for differences
marily on the rBC values for July and August, and τaf (pri-         in biomass burning activity between the months and are re-
marily) and ACAOD (secondarily) for September and Oc-               laxed to whole numbers for ease in interpretation. Visual
tober. The latter choice is because the τaf values vary more        inspections of spatial maps of ACAOD and τaf ensure the
smoothly with time than the ACAOD values do. Although               classification into more or less smoky days is representative
the τaf and ACAOD values over Ascension mostly rely on 2◦           of a larger region around Ascension. The thresholds applied
by 2◦ domain averages, when that information is limited, it         are rBC mass concentrations of 100 and 300 ng m−3 , respec-
is supplemented by averages over larger domains (3◦ by 3◦           tively, for low and high smoke loadings in July; similarly,
and 4◦ by 4◦ ). The bias between the τaf and ACAOD val-             100 and 500 ng m−3 thresholds are applied for the smok-

Atmos. Chem. Phys., 21, 11179–11199, 2021                                            https://doi.org/10.5194/acp-21-11179-2021
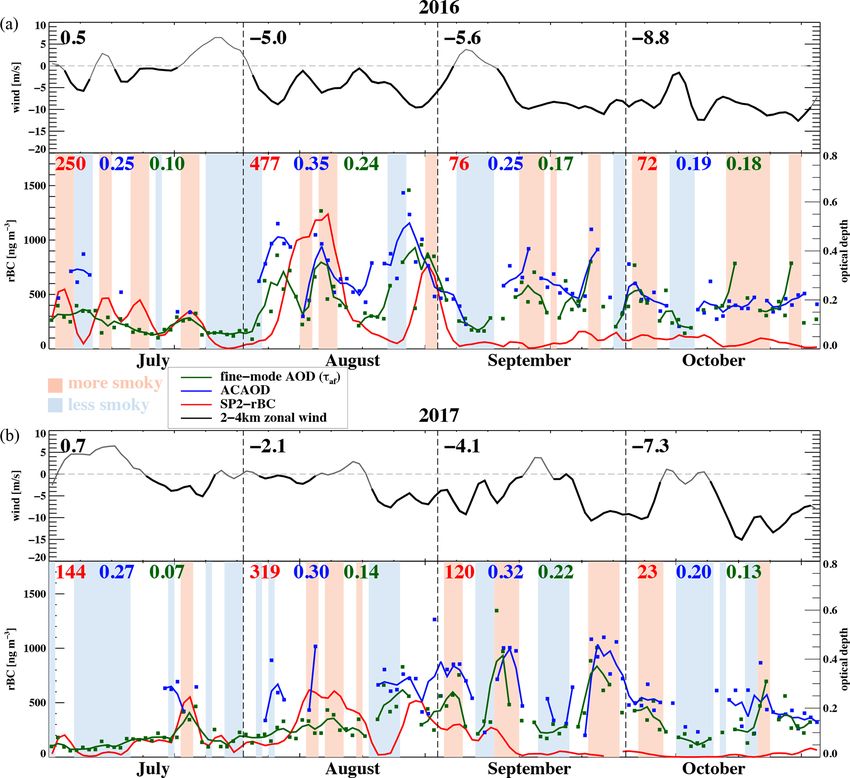
J. Zhang and P. Zuidema: Sunlight-absorbing aerosol amplifies the low-cloud seasonal cycle                                             11183

Figure 3. Time series of daily rBC mass concentrations (red), ACAOD (blue), τaf (dark green), and 2–4 km mean zonal winds (gray or black)
from July through October for (a) 2016 and (b) 2017. A 3 d running mean is applied to all, easterlies lasting at least 5 d are highlighted with
a thicker black line, and monthly mean values are indicated. More (less) smoky composites are indicated by light red (light blue) shading.

ier month of August. In September, optical depths of 0.15                 strength in September and October (Adebiyi and Zuidema,
and 0.26, respectively, indicate low and high smoke load-                 2018). A compositing based on aerosol conditions will also
ings, decreasing to 0.11 and 0.19 for October. These thresh-              be selected for the representative synoptic regime, indepen-
olds lead to 14 (25) d which are selected for the high (low)              dent of differences between the 2 years. Although the clas-
smoke loading composite for July, 13 (13) d for August, 19                sifications can be wrong on occasion, composites are more
(16) d for September, and 19 (13) d for October from the 2                statistically robust and can prevent unique time periods from
years combined. The larger clean composite size in July of                dominating perceptions of the representative aerosol–cloud
25 d, produces results similar to those for the cleanest 13 d             interaction behavior. An example is the time period from
(which would be more balanced with the number of high                     early July 2016, classified as less smoky despite relatively
smoke loading days) but are more robust. The number of                    high satellite-derived optical depths. This classification is not
high and low smoke loading days is not necessarily evenly                 completely correct, but the composite is nevertheless domi-
distributed between the 2 years; for example, more smoky                  nated by those days for which the full atmospheric column is
days are identified in October 2016 than in 2017, owing to                truly clean (e.g., early July 2017) because there are more of
interannual variabilities in biomass burning activities over              them.
the southern African continent and in the seasonally shift-
ing large-scale circulation pattern (Redemann et al., 2021;
Ryoo et al., 2021). Prior work establishes that the variability
in aerosol loading is primarily governed by the zonal wind

https://doi.org/10.5194/acp-21-11179-2021                                                 Atmos. Chem. Phys., 21, 11179–11199, 2021
11184 J. Zhang and P. Zuidema: Sunlight-absorbing aerosol amplifies the low-cloud seasonal cycle
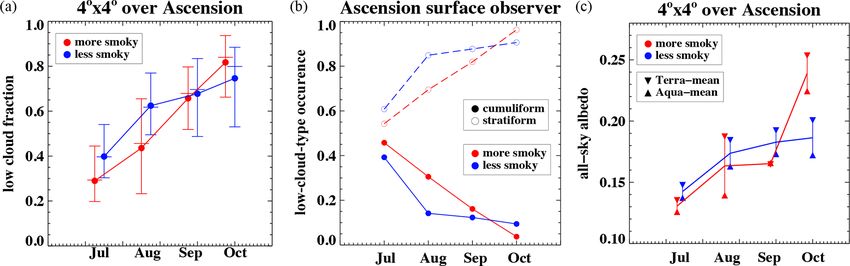
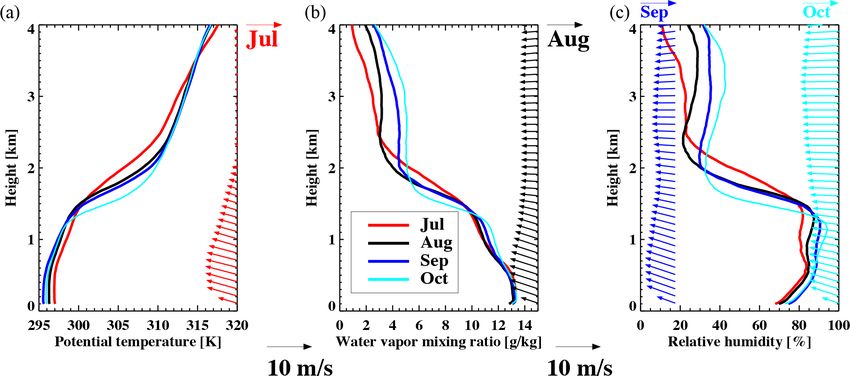
3 July–October overview pronounced diurnal amplitude can be related to the after-
noon clearing of stratiform clouds under smokier conditions
The boundary layer cools, shoals, and moistens over As- (ZZ19). Overall, the modulation of the cloudiness seasonal
cension from July to October (Fig. 4), with the free tro- cycle by the presence (or lack of) smoke is important be-
posphere warming more quickly than the surface, increas- cause the cloudiness changes ultimately dominate the change
ing the lower tropospheric stability from July to October to the TOA shortwave radiation balance (Fig. 5c). The all-sky
(Fig. 4). The boundary layer is most likely to be decoupled albedo decreases or increases, depending on the first order of
in July, although the mean thermodynamic profiles indicate the changes in the cloudiness fraction.
some decoupling between the subcloud and cloud layer for
all 4 months. The free tropospheric wind speeds increase
from July to October (Fig. 3). These are primarily east- 4 July: smoke reduces cloud fraction
erly winds above 2 km and affect the timing of free tropo-
For more smoky conditions in July, low cloud is less fre-
spheric smoke arriving above Ascension. The easterly wind
quent throughout the day (Fig. 6a), cloud bases are higher
episodes become more frequent beginning in August (Fig. 3).
by 50–90 m, and cloud tops are typically lower, by up to
In September, the amount of smoke in the boundary layer re-
150 m, compared to less smoky conditions. An exception is
duces abruptly (Haywood et al., 2021, see also). In October,
the morning (06:00–12:00 LST – local sidereal time), when
as convection moves southward over the African continent
the cloud-top heights and liquid water paths do not vary with
and biomass burning activity reduces (Adebiyi et al., 2015;
the smoke loading (Fig. 6a, b), and precipitation frequencies
Redemann et al., 2021), less smoke is present both below
almost match (Fig. 6c). This is reminiscent of the morning
and above the low clouds, despite continuing strong east-
cumulus invigoration documented for August (see Fig. 8b
erlies, reflecting the southward movement of convection. In
in ZZ19) when more boundary layer smoke is present. Rain
September and October, the more smoky periods correlate
frequency is otherwise reduced throughout the day (Fig. 6c)
well with the strength of the 2–4 km easterlies (Fig. 3), re-
in smokier July conditions and most pronounced in the af-
flecting the critical role of the free tropospheric zonal jet in
ternoon when the cloud LWP is also substantially reduced
transporting biomass burning smoke over the remote ocean.
(Fig. 6b). The low-cloud fraction is reduced over a larger area
The August–September transitions in synoptic regimes occur
than just at Ascension when the boundary layer is smokier
earlier in 2016 than 2017, which is evident in the time series
(Fig. 6d).
of the various aerosol measures (Fig. 3) and consistent with
When more smoke is present, the entire boundary layer
larger-scale spatial distributions (Redemann et al., 2021).
is warmer by ∼ 0.3 K (Fig. 6e). The boundary layers are
Consistent with the strengthening and lowering of the
more decoupled, with a more moist subcloud layer and a
trade wind temperature inversion from July to October
drier cloud layer (Fig. 6e), consistent with the reduction in
(Fig. 4), the satellite-derived low cloud cover increases
cloudiness. The cloud-top inversions are weaker (by ∼ 1 K),
around Ascension from July to October (Fig. 5a), regardless
lower (by ∼ 200 m), and thinner (by ∼ 40 m), compared to
of the smoke loading. Stratiform clouds become more com-
less smoky conditions (Figs. 6e and S1). Given that smokier
mon, and cumuliform clouds less so, according to the surface
conditions last for a few days (Fig. 3), the shortwave absorp-
observer reports (Fig. 5b). Ascension is slightly downstream
tion can warm the subcloud layer over multiple days, with the
of the main southeastern Atlantic stratocumulus region (10–
warmer subcloud layer persisting through the night (shown
0◦ E, 10–20◦ S, as per Klein and Hartmann, 1993), and the
for August in ZZ19), supporting a boundary layer semi-direct
gross aspects of the seasonal cycle in a low-cloud fraction,
effect. An aerosol–cloud microphysical interaction is also ap-
so that the properties and meteorology appear similar (Fuchs
parent in the doubling of the satellite-derived Nd (see values
et al., 2017; Scott et al., 2020).
printed on Fig. 6e; left panel). The radiosonde-derived wind
The striking feature of Fig. 5 is that when more absorbing
speeds indicate slightly weaker free tropospheric winds when
aerosol is present over the remote southeastern Atlantic, the
the boundary layer is more smoky, but the atmospheric cir-
seasonal cycle in low-level cloudiness and cloud morphol-
culation patterns are not significantly different (not shown).
ogy becomes amplified. The low-cloud fraction reduces in
The lack of strong synoptic variations suggests the observed
July and August, favoring more cumuliform and less strat-
low-cloud variability is mostly driven by the presence of the
iform cloud, whereas in October, the low cloud cover in-
shortwave-absorbing smoke.
creases, with stratiform clouds occurring more frequently
compared to cleaner time periods (Fig. 5). A compositing
on smaller domains (2◦ × 2◦ within the 4◦ × 4◦ domain; not 5 September: midlatitude disturbances reduce
shown) does not affect this result. A spatial gradient exists, stratocumulus cloud and raise boundary layer
with more cloud to the southeast and less to the northwest, heights on cleaner days
but the cloud fraction evolutions agree between the domains.
The amplitude of the diurnal cycle (Fig. 5a) is mostly unaf- Previous studies assessing the impact of above-cloud ab-
fected by the smoke loading, except in August, when a more sorbing aerosol on the boundary layer height are not in full
Atmos. Chem. Phys., 21, 11179–11199, 2021 https://doi.org/10.5194/acp-21-11179-2021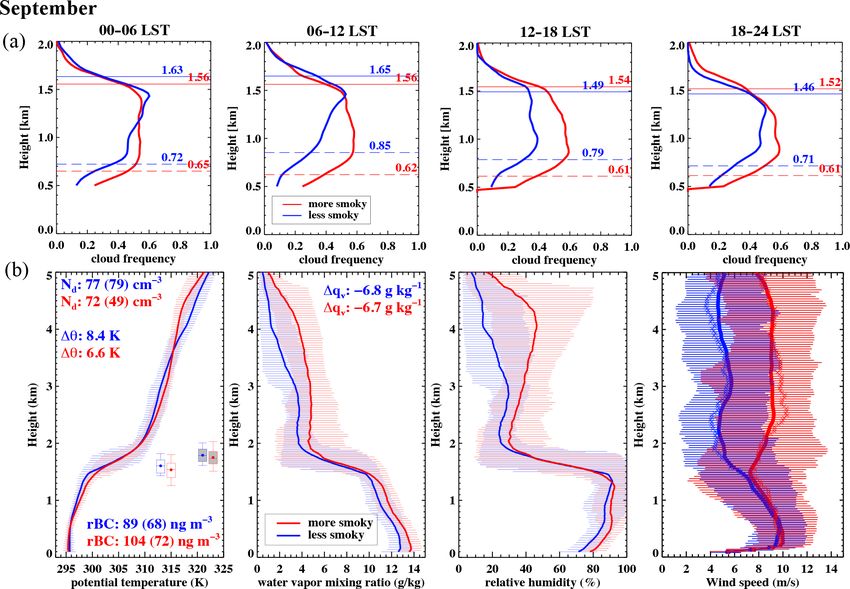
J. Zhang and P. Zuidema: Sunlight-absorbing aerosol amplifies the low-cloud seasonal cycle                                           11185

Figure 4. Monthly mean radiosonde profiles (0–4 km above sea level) of (a) potential temperature, (b) water vapor mixing ratio, (c) relative
humidity, and winds (colored vectors), by month, for 2016 and 2017 combined.

Figure 5. (a) SEVIRI-derived diurnally averaged areal mean (4◦ × 4◦ ) low-cloud fraction, with the diurnal range and median values also
indicated, together with the (b) surface-observed cloud type frequency of occurrence (stratiform and cumuliform; empty and filled circles,
respectively) and (c) all-sky areal mean CERES albedo for both Terra and Aqua. All are composited by high and low smoke (red and blue)
loadings, as a function of the month.

agreement. The regional modeling studies of Sakaeda et al.              2020; Yamaguchi et al., 2015; Zhou et al., 2017) impose
(2011) and Lu et al. (2018) report an increase in cloud-top             a free tropospheric model velocity, disallowing an aerosol
heights when biomass burning aerosols are present above                 feedback. The change in boundary layer height accompany-
clouds, attributed to a reduced free tropospheric subsidence            ing free tropospheric aerosol is important to clarify because
caused by aerosol heating. This can increase the contact with           more shallow boundary layer heights tend to be better cou-
the smoke layer, enhancing entrainment of aerosol into the              pled to the surface (Zuidema et al., 2009), with the surface
cloud, increasing Nd and further increasing the cloud-top               moisture fluxes better able to sustain higher cloud fractions.
height (Lu et al., 2018). In contrast, observational studies re-        On the other hand, if the cloud base remains invariant while
port a reduction in the cloud-top height (Wilcox, 2010, 2012;           the MBL shoals, the clouds should thin.
Adebiyi et al., 2015), which could be because an enhanced                  The radar-derived cloud-top height varies little with smoke
lower-tropospheric stability reduces cloud-top entrainment.             loading, with a slight increase in the afternoon and after sun-
A climate-scale modeling study (Gordon et al., 2018) also               set, by up to 60 m, on days with more smoke (Fig. 7a). More
produces a decrease in boundary layer depth under a plume               clear is that cloud frequencies, particularly in the lower lev-
of biomass burning smoke when the model free tropospheric               els, increase with the smoke loading, by up to ∼ 20 %. This
conditions are nudged to reanalysis. Most higher-resolution             is because the cloud bases lower, by up to 230 m, when more
process modeling studies (Johnson et al., 2004; Herbert et al.,         smoke is present (Fig. 7a). The island-based cloud frequency

https://doi.org/10.5194/acp-21-11179-2021                                               Atmos. Chem. Phys., 21, 11179–11199, 2021
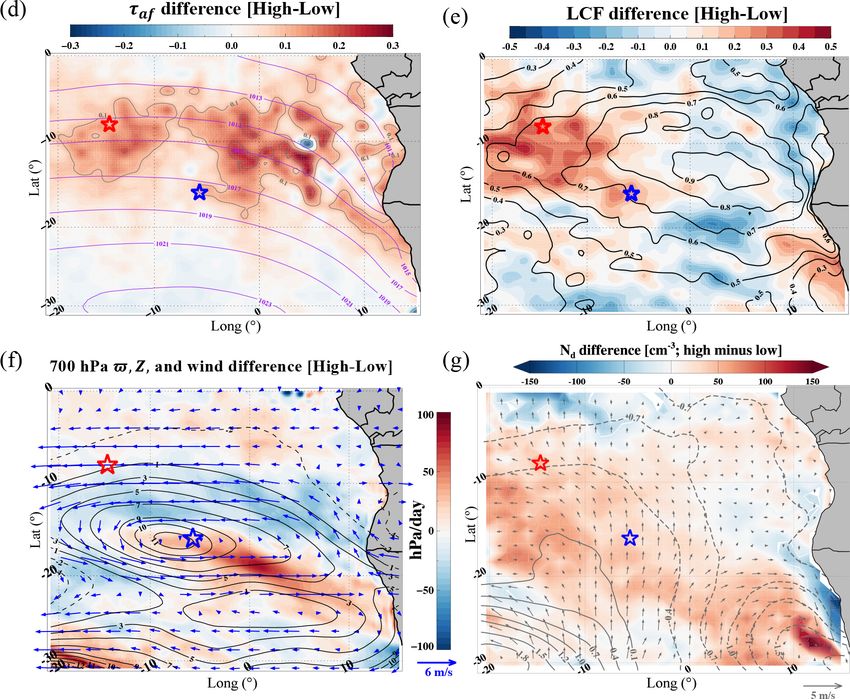
11186                           J. Zhang and P. Zuidema: Sunlight-absorbing aerosol amplifies the low-cloud seasonal cycle

Figure 6. (a) Diurnal cycle in the mean cloud frequencies derived using the Ka band zenith-pointing cloud radar (KAZR) reflectivities >
−35 dBZ at their vertical resolution of 30 m. Composite mean KAZR-derived (cloud frequency > 0.05) cloud-top heights (solid line) and
cloud base heights (long dash) are overlain. (b) Diurnal cycle of liquid water paths at the airport for July 2017, shown as medians (filled
circles) and interquartile ranges (vertical bars). (c) Disdrometer-derived rain frequencies, at the AMF1 site, shown as 3 h aggregations of 1 min
samples, with rain rates exceeding 0 mm/h. (d) Difference in MODIS daily liquid cloud fraction (LCF; filled contours; high smoke minus
low smoke), overlain with July mean sea level pressure (hectopascals; purple) and LCF (black). Ascension and St. Helena island locations
are indicated with red and blue stars, respectively. (e) Radiosonde profiles (0–5 km above sea level) of potential temperature (θ ), water vapor
mixing ratio (qv ), relative humidity, and wind speed (horizontal bars indicate the 10th and 90th percentile values). Composite mean (median)
MODIS–Meyer cloud droplet number concentrations (Nd ; 2◦ by 2◦ means centered over Ascension) and statistics of inversion base height
(unfilled box and whisker plots), inversion top height (filled box and whisker plots), mean change in θ , and qv across inversion are included
in the two left panels. Panels (a)–(c) and (e) are composited by high smoke (red) and low smoke (blue) conditions. The 2016 and 2017 data
are combined, unless specified otherwise.

Atmos. Chem. Phys., 21, 11179–11199, 2021                                                    https://doi.org/10.5194/acp-21-11179-2021
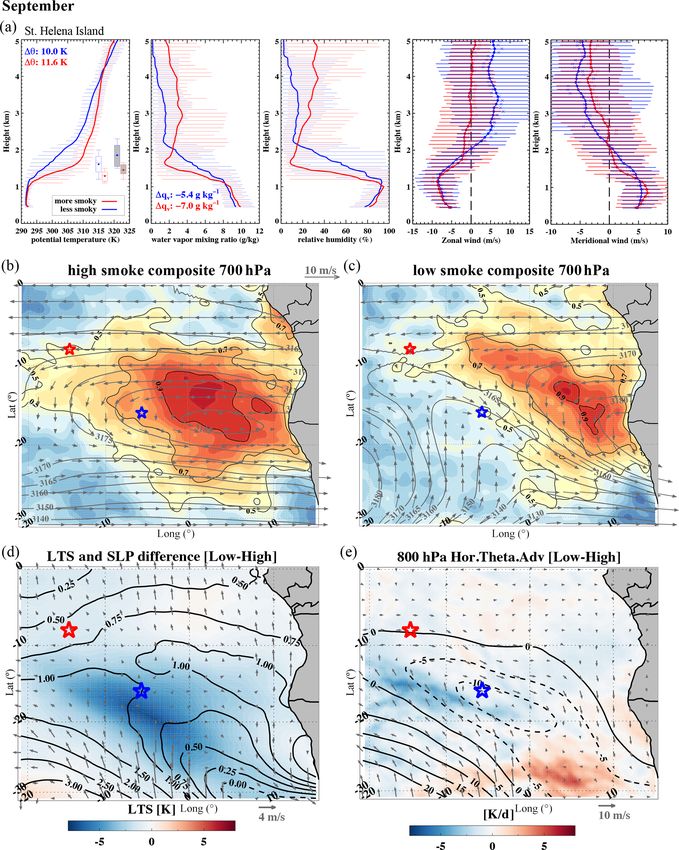
J. Zhang and P. Zuidema: Sunlight-absorbing aerosol amplifies the low-cloud seasonal cycle                                 11187

profiles can be limited in interpreting cloud cover over a        gional atmospheric circulation correlate with a pronounced
larger area, due to a systemic island orographic effect and       cloudiness reduction within the main southeastern Atlantic
subsampling by the relatively short time series of point mea-     stratocumulus deck, except at the northern edge of the deck
surements, but diurnal cycle composites of SEVIRI-derived         encompassing Ascension (Fig. 7f).
low-cloud fraction also indicate an increase in afternoon            St. Helena is located approximately 2 d upwind within the
cloud cover, if weak (Fig. S2). Cloud occurrence increases        boundary layer flow, with Lagrangian forward trajectories
just above lifting condensation level when more smoke is          from St. Helena placing boundary layer air near, if slightly
present (more pronounced in the morning; Fig. 7a), while          west of, Ascension (Fig. 7 within Zuidema et al., 2015).
surface observers only report a subtle shift in low-cloud type    A height cross section between Ascension and St. Helena
as a function of smoke loading (Fig. 5b).                         (16◦ S, 6◦ W; gray dashed line in Fig. 7e), indicates a con-
   A focus on the cleaner conditions provides a useful alter-     sistent increase in the 700–800 hPa subsidence on days with
native perspective. When the free troposphere is less aerosol     less free tropospheric smoke loadings (Fig. 7g). As such, the
laden, the boundary layer is less humid (qv decreases by          radiosondes at St. Helena can provide insight into the 24–
1 g kg−1 ; RH decreases by ∼ 5 %), and the cloud layer is         48 h adjustment of clouds to their large-scale environmen-
cooler (∼ 1 K at inversion base), with a stronger and slightly    tal conditions (Klein et al., 1995; Mauger and Norris, 2010;
higher cloud-top inversion (1.8 K and 70 m; Figs. 7b and S3).     Eastman et al., 2016) for the clouds characterized at Ascen-
The changes in the free troposphere are equally dramatic,         sion.
with much weaker winds, less moisture, and a more sta-               A 2 d lead is incorporated into the St. Helena compar-
ble thermodynamic structure. Differences between the com-         isons between low or high smoke days in Fig. 8. A total of
posite mean Nd s and rBC mass concentrations are statisti-        2 d prior to the less smoky days at Ascension, the boundary
cally insignificant (numbers printed on Fig. 7b), indicating      layer heights are much higher at St. Helena (by 320 m com-
negligible aerosol–cloud microphysical interactions (as ex-       pared to more smoky days), with a weaker temperature and
pected, given the small amount of boundary layer aerosol).        moisture cloud-top inversion gradient (1.6 K and 1.6 g kg−1 ;
The 700 hPa atmospheric circulation differs significantly be-     Figs. 8a and S4). This indicates that the cloud tops at As-
tween days with low and high free tropospheric smoke load-        cension are higher, despite stronger subsidence, because the
ings at Ascension (Fig. 7c and d). On days with more smoke,       boundary layer is deeper upstream. The potential tempera-
the AEJ-S extends further westward, and back-trajectories         ture, qv , and RH vertical structure differences as a function
from Ascension near the cloud-top clearly trace back to con-      of smoke loading are qualitatively similar to those at Ascen-
tinental Africa (Fig. 7c). On days with little smoke, the cir-    sion (Fig. 8a). The boundary layer is deeper and less humid
culation is anticyclonic about a deeper land-based pressure       near the surface (Fig. 8a), and the lower tropospheric stability
high, with the aerosol remaining closer to the coast and fur-     is substantially reduced on days with less smoke overhead.
ther south. The above-cloud air at Ascension is more likely       The boundary layer southerlies extend up to 2 km (Fig. 8a)
to come from the north and west on these days (Fig. 7d).          before reversing in response to the deeper land-based heat
   The primary distinction between the two composite cir-         low. Spatial climatologies indicate that the radiosonde com-
culations is a disruption of the midlatitude eastward flow in     posites are representing a larger pattern (Fig. 8b–e). Impor-
which a high-pressure ridge at 700 hPa, associated with baro-     tant for the boundary layer cloud characteristics, the strength-
clinic activity from further south, counteracts the free tropo-   ened surface Atlantic high encourages advection of air off
spheric zonal jet at 10◦ S. The subsidence above the cloud        the Southern Ocean by near-surface winds (Fig. 8d; black
top is stronger on the less smoky days when the boundary          contours and gray vectors). A pronounced decrease in lower
layer at Ascension is also higher (Fig. 7a, b, e, and g). The     tropospheric stability near and south of St. Helena (Fig. 8d;
increased subsidence also reflects the midlatitude intrusion;     colored contours) is in full agreement with the radiosonde
the anomalous westerlies weakening the free tropospheric          profiles sampled over St. Helena (Fig. 8a) for low smoke
winds also create an anomalous convergence, supporting an         loading days. This can be explained by anomalous negative
anomalous subsidence (Fig. 7e). This is most pronounced           horizontal temperature advection at 800 hPa (Fig. 8e, colored
east of the 700 hPa pressure ridge (right above the region        contours), as a result of anomalous southerly flows (gray vec-
bounded by Ascension and St. Helena), where the flow shifts       tors) corresponding to negative geopotential height anoma-
from cyclonic to anti-cyclonic, and the AEJ-S is most weak-       lies at 800 hPa (black contours). The MODIS-derived low-
ened (Fig. 7d). At the surface, the midlatitude disturbance       level cloudiness is substantially reduced and disrupted west
strengthens the south Atlantic high and shifts it slightly to     of the prime meridian (Fig. 8c; colored contours), compared
the southwest (not shown), strengthening the southerlies in       to days dominated by free tropospheric flow off of the conti-
the boundary layer, although weakly felt over the Ascension       nent (Fig. 8b).
region (Fig. 7g; cyan vectors). Closer to St. Helena, the pre-       September is a transitional month when the continent is
vailing southeasterly boundary layer flow is weakened by          warming up but the ocean is still cool, and the midlatitude
the anomalous westerlies, corresponding to the upper-level        westerlies are positioned further north, similar to the south-
(700 hPa) midlatitude disturbance. These changes in the re-       eastern Pacific (Painemal and Zuidema, 2010). These At-

https://doi.org/10.5194/acp-21-11179-2021                                       Atmos. Chem. Phys., 21, 11179–11199, 2021
11188 J. Zhang and P. Zuidema: Sunlight-absorbing aerosol amplifies the low-cloud seasonal cycle
Figure 7.
lantic midlatitude disturbances, also discussed in Baró Pérez the African continent reduces aerosol transport but increases
et al. (2021), are most frequent in September in our study and moisture transport, compared to September.
are consistent with the climatologies of Fuchs et al. (2017) At Ascension, the radar-derived cloud frequency profiles
and Gaetani et al. (2021). Other examples are documented (October 2016 only) emphasize a more persistent stratiform
in Diamond et al. (2018), Adebiyi and Zuidema (2018), and cloud structure through the linear increase in cloud frequency
Abel et al. (2020). Pennypacker et al. (2020) also document with height, lasting throughout the diurnal cycle and invari-
that ultra-clean days at Ascension are most common during ant of the smoke loading (Fig. 9a). Cloud occurs more fre-
September, although they only partially attribute these to a quently when it is less smoky (Fig. 9a; confirmed through
Southern Ocean origin. a Student’s t test), consistent with the satellite-derived low-
cloud fraction covering a larger area (Fig. 5a), except in the
afternoon (12:00–18:00 LST). There is some indication that
the cloud layer rises under smokier conditions, with higher
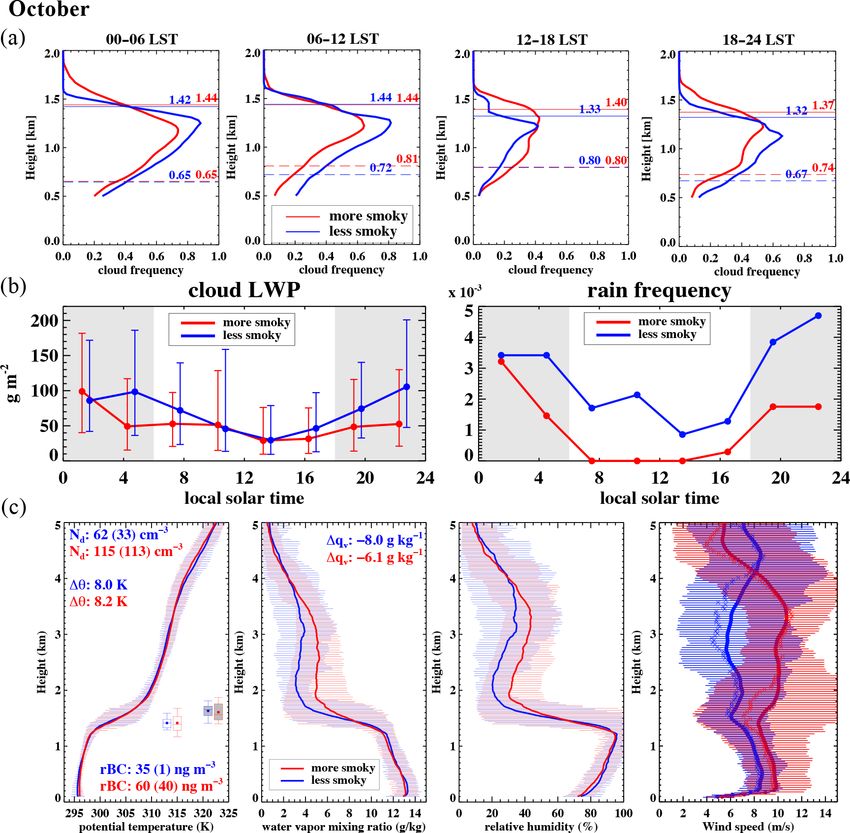
6 October: increased cloud cover on smokier days
cloud bases by up to 90 m in the late morning, a reduced
subcloud relative humidity (Fig. 9c), and higher cloud tops
In October, the temperature gradient between the continen-
by up to 70 m in the afternoon (Fig. 9a). Surface observa-
tal heat low in southern Africa and equatorial convection
tions indicate more stratiform clouds under smokier condi-
continues to encourage stronger free tropospheric easterlies
tions (Fig. 5b), but cloud liquid water paths are also less,
(Tyson et al., 1996; Nicholson and Grist, 2003; Adebiyi
and rain is less frequent (Fig. 9b). When combined, these ob-
and Zuidema, 2016) capable of transporting biomass burn-
servations suggest that smokier conditions correspond with
ing smoke far westward at altitudes reaching up to 5–6 km.
thinner stratiform cloud layers near the trade wind inversion.
This encourages smoke to stay predominantly in the free tro-
Figure 9c indicates slightly warmer and drier subcloud layers
posphere over the southeastern Atlantic (Figs. 1 and 3). Nev-
in smokier conditions. The moisture and wind profiles clearly
ertheless, reduced burning and increased moist convection on
Atmos. Chem. Phys., 21, 11179–11199, 2021 https://doi.org/10.5194/acp-21-11179-2021J. Zhang and P. Zuidema: Sunlight-absorbing aerosol amplifies the low-cloud seasonal cycle 11189 Figure 7. Panels (a) and (b) are as in Fig. 6a and e but for September. Composite mean cloud-top heights and bases included in (a) in kilometers. Composite mean (median) rBC mass concentrations are shown in left panel of (b). (c, d) HYSPLIT 7 d back trajectories initialized at 2 km over Ascension at noon for September (red lines) for days with (c) more and (d) less smoke, overlain on composite mean ACAOD (colored contours), 700 hPa ERA5 geopotential heights (meters; gray contours) and winds (purple vectors). (e) Low-high smoke composite difference in 800 hPa geopotential heights (m; black contours), winds (blue vectors) and vertical velocity (hectopascals per day; hereafter hPa d−1 ; colored background). (f) Low–high smoke composite difference in MODIS daily liquid cloud fraction (LCF; filled-contours), overlain with September mean LCF (black contours). (g) Height cross section of the vertical velocity low–high smoke composite difference (colored background) and zonal or meridional winds (vectors; free tropospheric differences < 2 m s−1 are omitted) between St. Helena and Ascension (red and blue stars, respectively, in c–g). https://doi.org/10.5194/acp-21-11179-2021 Atmos. Chem. Phys., 21, 11179–11199, 2021
11190                          J. Zhang and P. Zuidema: Sunlight-absorbing aerosol amplifies the low-cloud seasonal cycle

Figure 8. (a) Similar to Fig. 7b but for St. Helena from 2 d prior to those with high and low smoke loadings at Ascension. Zonal and
meridional components of the winds are shown instead of wind speed. (b, c) Corresponding composite mean MODIS daily liquid cloud
fraction (colored contours), 700 hPa ERA5 geopotential heights (meters; gray contours), and winds (gray vectors). (d) Difference (low–
high) in composite mean lower tropospheric stability (LTS; defined as θ800 hPa − θ1000 hPa ; colored contours), sea level pressure (SLP;
hectopascals; black contours), and 10 m winds (gray vectors). (e) Low–high smoke composite difference in 800 hPa horizontal temperature
advection (colored contours), geopotential heights (meters; black contours) and winds (gray vectors). Locations of Ascension and St. Helena
are indicated in red and blue stars, respectively, in panels (b–e).

Atmos. Chem. Phys., 21, 11179–11199, 2021                                                https://doi.org/10.5194/acp-21-11179-2021
J. Zhang and P. Zuidema: Sunlight-absorbing aerosol amplifies the low-cloud seasonal cycle                                     11191

differ, with more moisture overhead between 1.5 and 3.5 km           enough precipitation to reduce Nd near the shore, although
and stronger winds from the surface to 4 km on days with             that remains speculation.
more free tropospheric smoke. The increase in free tropo-
spheric moisture immediately above the cloud tops reduces
the gradients of RH and qv across the inversion by ∼2 g kg−1         7   September: longwave cooling by water vapor
(Figs. 9c and S5). This should help sustain the stratiform               maintains a well-mixed free troposphere
cloud layer through suppressing evaporative drying by cloud-
top entrainment. Figure 9d indicates a broad, zonally oriented       In comparison to October, the September thermodynamic
band of elevated τaf , also seen in ACAOD (not shown). The           profile is better mixed, to a higher altitude, over the southeast
satellite-derived low-cloud fraction is enhanced west of 5◦ W        Atlantic (Figs. 7a and 8a) when more absorbing aerosol is
by up to 0.35 (including at Ascension) and is slightly reduced       present. Individual profiles often indicate clear collocations
to the south, east of 0◦ E by at most 0.1 (Fig. 9e), indicating a    between the elevated humid layer and the aerosol layer (see
more zonally oriented, westward extending cloud deck when            examples in the Supplement of ZZ19; Adebiyi et al., 2015;
more smoke is present overhead.                                      Deaconu et al., 2019; Pistone et al., 2021). The aerosol or
   An anomalous anti-cyclonic October circulation at                 humidity layer may already be well mixed when leaving the
700 hPa offshore of continental Africa indicates a strength-         African continent; here we show that longwave cooling at
ening of the dominating large-scale circulation on the days          the top of the humidity layers can help maintain their vertical
when the smoke loading is elevated over Ascension (Fig. 9f),         structure through encouraging downward small-scale mix-
consistent with the measured stronger winds. The free tropo-         ing. The individual free tropospheric humidity layers typi-
spheric subsidence is reduced underneath the strengthened            cally include a stability cap at the top, ensuring a sharp gra-
easterlies centered on 10◦ S, consistent with a secondary cir-       dient to the water vapor mixing ratio, with qv reductions to
culation (Adebiyi and Zuidema, 2016) and explaining the              near 0 g kg−1 above the aerosol layer reflecting the large-
slight increase in cloud-top heights at Ascension on smok-           scale subsidence. The extremely dry overlying atmosphere
ier days. Also notable in Fig. 9f is the enhancement in the          provides a strong exposure of the underlying water vapor
subsidence just off of the coast of Namibia (17–28◦ S) to            to outer space, creating a longwave radiative cooling profile
the southwest of the strengthened anticyclonic high, corre-          that is maximized at the top of the moisture layer and helps
lating with a local increase in Nd on days with more smoke           maintain a stability cap (Mapes and Zuidema, 1996). A neg-
(Fig. 9g). A broad expanse of increased Nd , stretching from         ative buoyancy, generated at the top of these layers, can aid
near the Namibian coast to beyond Ascension, is evident. At          downward mixing. Although the longwave cooling from the
Ascension, the composite mean MODIS–Meyer-derived Nd                 additional water vapor transported within the aerosol layers
and surface-based rBC almost double between the high ver-            is typically small compared to that from the aerosol short-
sus low smoke conditions (Fig. 9c). Christensen et al. (2020)        wave absorption (Marquardt Collow et al., 2020), the vertical
select days with enhanced clear-sky τa to the south of the           structure of the radiative heating is also altered, with most of
main stratocumulus deck and find an increase in cloud frac-          the longwave cooling occurring above the maximum in the
tion or lifetime far downwind, within Lagrangian trajectories,       shortwave heating from aerosol. It is this displacement that
consistent with the increased low-cloud fraction to the west         helps maintain a better mixed aerosol or humidity layer.
in Fig. 9e. This, along with the rain suppression occurring             An example is made of a characteristic profile over Ascen-
on smokier days and little change in the lower tropospheric          sion, from 2 September 2017, in which well-mixed aerosol
stability (Fig. 9b and c), supports the idea that an aerosol life-   extinction (derived from the micropulse lidar according to
time effect (Albrecht, 1989) is active, consistent with Chris-       Delgadillo et al., 2018, and constrained to an aerosol opti-
tensen et al. (2020). To this we can add that the increase           cal depth of 0.35) and humidity vertical structures are clearly
in free tropospheric moisture also helps maintain the cloud          well colocated (Fig. 10). Instantaneous radiative transfer cal-
against entrainment-driven cloud thinning. The elevated Nd           culations are based on a noon solar zenith angle, a spec-
on more smoky days can also contribute to the significant            trally dependent single scattering albedo (SSA) of 0.8 at
brightening of the cloudy scene near Ascension in October,           529 nm based on Zuidema et al. (2018), and an asymmetry
despite the reduction in the cloud liquid water path (all told,      parameter of 0.67, loosely based on Cochrane et al. (2021).
there is a net ∼ 0.05 increase in TOA all-sky albedo; Fig. 5c).      The spectral dependence of SSA relies on an absorption
   We lack an explanation for the smaller reduction in cloud         Ångström exponent of 1 and a mean Ångström exponent of
fraction to the south of the main stratocumulus deck. The            1.9 (Zuidema et al., 2018), with no humidity dependence. A
contrasting decrease in Nd over a narrow region, confined            cloud layer consists of cloud water content calculated from
within ∼ 2◦ along the coast of Namibia on more smoky days            the radiosonde profiles using the adiabatic assumption, with
(Fig. 9g), correlates with anomalous near-surface northerly          cloud optical properties calculated assuming a cloud droplet
winds (gray vectors; Fig. 9g). This circulation pattern advects      number concentration of 40 cm−3 following Painemal and
moist, warm air along the coast of Namibia, encouraging an           Zuidema (2011). These yield a sharply defined longwave
inland fog (Andersen et al., 2020). Perhaps this produces            cooling profile, maximized at ∼ −28 K d−1 over a 50 m dis-

https://doi.org/10.5194/acp-21-11179-2021                                          Atmos. Chem. Phys., 21, 11179–11199, 2021
11192                       J. Zhang and P. Zuidema: Sunlight-absorbing aerosol amplifies the low-cloud seasonal cycle

Figure 9.

tance at the top of the free tropospheric aerosol or moisture   Although such mixing is not deep, based on a simple dia-
layer (Fig. 10). The noontime shortwave heating produced        batic heating or static stability calculation, it does help ex-
by the smoke is larger, with a maximum of ∼ 34 K d−1 over       plain why the free troposphere is often stratified into indi-
a 50 m layer. A key feature is that the maximum shortwave       vidually well-mixed layers (Redemann et al., 2021; Pistone
heating occurs lower in the atmosphere than the maximum         et al., 2021). In October, more of the convection over land
longwave cooling does (Fig. 10; insert). As a result, a net     is moist (Ryoo et al., 2021), which will produce more com-
cooling (∼ −5 K d−1 50 m−1 ) pervades the top 100 m of the      plex thermodynamic profiles from, e.g., microphysical melt-
layer, even during the time of day when the shortwave warm-     ing and downdrafts. This may also help explain why the ther-
ing is strongest. The net heating profile encourages a small-   modynamic profiles are less well mixed in October, also ev-
scale downward vertical mixing that can allow aerosol to        ident in Pistone et al. (2021), and do not reach as high (be-
move vertically more freely, regardless of the time of day.     cause surface land heating is reduced).

Atmos. Chem. Phys., 21, 11179–11199, 2021                                       https://doi.org/10.5194/acp-21-11179-2021
J. Zhang and P. Zuidema: Sunlight-absorbing aerosol amplifies the low-cloud seasonal cycle                                           11193

Figure 9. (a) As in Fig. 7a but for the high–low smoke composite difference in October 2016 only. (b) As in Fig. 6b and c but for October,
with 3 h rain frequencies derived from the tipping bucket. (c) As in Fig. 7b but for October. (d) MODIS daily τaf (color-filled contours),
overlain with October mean sea level pressure (hectopascals; purple), (e) MODIS daily liquid cloud fraction (LCF; color-filled contours),
overlain with October mean LCF (black), (f) ERA5 geopotential heights (meters; black contours), subsidence (color-filled contours), and
horizontal winds (blue vectors) at 700 hPa, and (g) daily MODIS–Meyer Nd , overlain on differences in sea level pressure (hectopascals; gray
contours) and 10 m winds (gray vectors). Ascension and St. Helena island locations are indicated with red and blue stars, respectively, in
panels (d–g). Panels (b)–(f) are for October 2016 and 2017 combined, representing high–low smoke composite differences.

8   Concluding remarks                                                  rise in altitude of the aerosol mass centroid from July to Oc-
                                                                        tober over the southeastern Atlantic. Smoke episodes arriv-
                                                                        ing at Ascension mainly occupy the boundary layer in July,
This study characterizes the subseasonal evolution of marine
                                                                        with the boundary layer smoke loading reaching a maxi-
boundary layer clouds over the remote southeastern Atlantic,
                                                                        mum in August. Smoke within the free troposphere becomes
from July to October during 2016 and 2017, as a function
                                                                        more frequent in September, and that within the boundary
of the aerosol loading and its vertical distribution. We ex-
                                                                        layer reduces dramatically. In October, the free tropospheric
tend the work of ZZ19, which focused on August only, and
                                                                        zonal winds reaching Ascension remain strong but trans-
distinguish this from previous studies that apply a longer
                                                                        port more moisture than aerosol. This synoptic evolution
timescale averaging over the biomass burning season (e.g.,
                                                                        occurs approximately 2 weeks later in 2017 compared to
Wilcox, 2010, 2012; Costantino and Bréon, 2013; Adebiyi
                                                                        2016 (Figs. 1–3). This aerosol–meteorological co-evolution
and Zuidema, 2018; Deaconu et al., 2019). The monthly
                                                                        affects which aerosol–cloud interactions are likely to dom-
timescale is emphasized primarily because of the dramatic

https://doi.org/10.5194/acp-21-11179-2021                                               Atmos. Chem. Phys., 21, 11179–11199, 2021
11194 J. Zhang and P. Zuidema: Sunlight-absorbing aerosol amplifies the low-cloud seasonal cycle
land-based heat low to the coastal region, reducing the
westward extent of the free tropospheric zonal winds
at 10◦ S that normally disperse the aerosol (Fig. 7). A
stronger surface anticyclone over the Atlantic strength-
ens boundary layer southerlies more likely to advect
cleaner Southern Ocean air. The lower tropospheric sta-
bility is reduced, despite stronger synoptically aided
subsidence, helping to raise the boundary layer top,
which is particularly noticeable at St. Helena (Fig. 8).
This provides an alternative explanation as to why the
observed cloud-top heights are lower on the smokier
days despite the weakened subsidence.
4. In October, the free tropospheric zonal winds are
stronger when more aerosol is present over Ascension.
The same winds enhance the humidity above the cloud
top, reducing entrainment-driven evaporative drying.
This helps support the increased occurrence of strat-
iform clouds and satellite-derived low-cloud fraction.
Cloud tops are slightly higher at Ascension when the
smoke loading is higher, which is consistent with re-
Figure 10. (a) Calculated instantaneous shortwave (red), longwave
duced subsidence from the secondary circulation in-
(blue), and net (black) heating rate profiles at noon on 2 Septem- duced by the strong zonal winds (Fig. 9). A possible
ber 2017. The insert magnifies to the 4.2–4.5 km range, centered aerosol indirect effect is indicated, in that the Nd dou-
on the layer top. (b) θ (red) and qv (blue) profiles from the noon ble when more smoke is present overhead. Enhanced
sounding, and the MBL-derived extinction profile (black; following subsidence off the coast of Namibia may provide an-
Delgadillo et al., 2018). The corresponding column-integrated AOD other pathway for aerosol to enter the boundary layer
and cloud water path are indicated. and, ultimately, reach Ascension. The additional aerosol
may help prolong the cloud lifetime and enhancing their
brightness (Fig. 5c; Christensen et al., 2020). These two
inate, since changes in meteorology potentially dominating effects (an additional moisture source and an aerosol
the cloud response. Our key findings are as follows: cloud lifetime effect) help explain why the low-cloud
fraction is higher, despite a lower liquid water path,
1. When smoke is present, the seasonal evolution in compared to the southeast Pacific stratocumulus deck
low-cloud amount is amplified. The low-cloud amount during this time of year (Zuidema et al., 2016).
first reduces in July–August but then increases and
becomes more stratiform in October. The cloudiness 5. The September free tropospheric thermodynamic pro-
changes dominate the TOA all-sky albedo changes asso- file is better mixed than in October. The sharp gradient
ciated with the smoke (Fig. 5), although the cloudiness in water vapor mixing ratio at the top of a September
changes are not necessarily attributable to the aerosol. free tropospheric aerosol layer generates a net cooling
at the layer top, even at solar noon, that is offset verti-
2. In July, the cloud cover, LWP, and rain occurrence are cally from the larger shortwave warming occurring be-
reduced when more smoke is present, particularly in low through aerosol absorption. The negative buoyancy
the afternoon. The thermodynamic and wind vertical can facilitate a downward vertical mixing and vertical
structures are similar, regardless of the smoke loading, dispersion of the free tropospheric aerosol over small
suggesting that the variability in the cloud response is distances (Fig. 10). A greater prevalence of moist con-
primarily driven by the aerosol rather than synoptics vection over land in October, for which microphysical
(Fig. 6). A morning increase in LWP, even under smok- and dynamical processes produce more complex ther-
ier conditions, is similar to a recoupling of the cloud modynamic vertical structures, may help explain why
layer to the subcloud layer detailed more comprehen- the thermodynamic profiles are less well-mixed in Oc-
sively for August in ZZ19. tober (Fig. 9c; Ryoo et al., 2021).
3. In September, the days with less free tropospheric Previous studies applying a seasonal averaging success-
smoke over Ascension are distinguished by midlati- fully isolate a cloud thickening when more aerosol is present
tude synoptic intrusions into the subtropics. An upper- in the free troposphere but typically overlook a cloud reduc-
level pressure ridge constrains the circulation around the tion when more smoke is present in the boundary layer. It
Atmos. Chem. Phys., 21, 11179–11199, 2021 https://doi.org/10.5194/acp-21-11179-2021You can also read