Observation of absorbing aerosols above clouds over the south-east Atlantic Ocean from the geostationary satellite SEVIRI - Part 2: Comparison ...
←
→
Page content transcription
If your browser does not render page correctly, please read the page content below
Atmos. Chem. Phys., 21, 3235–3254, 2021
https://doi.org/10.5194/acp-21-3235-2021
© Author(s) 2021. This work is distributed under
the Creative Commons Attribution 4.0 License.

Observation of absorbing aerosols above clouds over the south-east
Atlantic Ocean from the geostationary satellite SEVIRI – Part 2:
Comparison with MODIS and aircraft measurements from the
CLARIFY-2017 field campaign
Fanny Peers1,a , Peter Francis2 , Steven J. Abel2 , Paul A. Barrett2 , Keith N. Bower3 , Michael I. Cotterell1,2,b ,
Ian Crawford3 , Nicholas W. Davies1,2 , Cathryn Fox2 , Stuart Fox2 , Justin M. Langridge2 , Kerry G. Meyer4 ,
Steven E. Platnick4 , Kate Szpek2 , and Jim M. Haywood1,2
1 College of Engineering, Mathematics, and Physical Sciences, University of Exeter, Exeter, UK
2 Met Office, Fitzroy Road, Exeter, UK
3 Centre for Atmospheric Science, School of Earth and Environmental Science, University of Manchester, Manchester, UK
4 NASA GSFC, Maryland, USA
a now at: Laboratoire d’Optique Atmosphérique, Université de Lille, Villeneuve-d’Ascq, France
b now at: School of Chemistry, University of Bristol, Bristol, UK

Correspondence: Fanny Peers (fanny.peers@univ-lille.fr)

Received: 19 December 2019 – Discussion started: 5 March 2020
Revised: 8 December 2020 – Accepted: 8 December 2020 – Published: 3 March 2021

Abstract. To evaluate the SEVIRI retrieval for aerosols           craft platform during the CLARIFY-2017 campaign. Around
above clouds presented in Part 1 of the companion paper,          Ascension Island, the column water vapour used to correct
the algorithm is applied over the south-east Atlantic Ocean       the SEVIRI signal is overestimated by 3.1 mm in the fore-
during the CLARIFY-2017 field campaign period. The first          cast compared to that measured by dropsondes. However, the
step of our analysis compares the retrieved aerosol and cloud     evidence suggests that the accuracy of the atmospheric cor-
properties against equivalent products from the MODIS             rection improves closer to the African coast. Consistency is
MOD06ACAERO retrieval (Meyer et al., 2015). While the             observed between the SEVIRI above-cloud AOT and in situ
correlation between the two satellite retrievals of the above-    measurements (from cavity ring-down spectroscopy instru-
cloud aerosol optical thickness (AOT) is good (R = 0.78), the     ments) when the measured single-scattering albedo is close
AOT retrieved by SEVIRI is 20.3 % smaller than that ob-           to that assumed in the retrieval algorithm. On the other hand,
tained from the MODIS retrieval. This difference in AOT is        the satellite retrieval overestimates the AOT when the as-
attributed mainly to the more absorbing aerosol model as-         sumed aerosol model is not absorbing enough. Consistency is
sumed for the SEVIRI retrieval compared to MODIS. The             also found between the cloud properties retrieved by SEVIRI
underlying cloud optical thickness (COT) derived from the         and the CER measured by a cloud droplet probe and the liq-
two satellites is in good agreement (R = 0.90). The cloud         uid water path derived from a microwave radiometer. Despite
droplet effective radius (CER) retrieved by SEVIRI is con-        the instrumental limitations of the geostationary satellite, the
sistently smaller than MODIS by 2.2 µm, which is mainly           consistency obtained between SEVIRI, MODIS and the air-
caused by the use of different spectral bands of the satellite    craft measurements demonstrates the ability of the retrieval
instruments. In the second part of our analysis, we compare       in providing additional information on the temporal evolu-
the forecast water vapour profiles used for the SEVIRI atmo-      tion of the aerosol properties above clouds.
spheric correction as well as the aforementioned aerosol and
cloud products with in situ measurements made from the Fa-
cility for Airborne Atmospheric Measurements (FAAM) air-

Published by Copernicus Publications on behalf of the European Geosciences Union.
3236                                            F. Peers et al.: Observation of absorbing aerosols above clouds with SEVIRI

1   Introduction                                                    tographY; de Graaf et al., 2012), MODIS (MODerate resolu-
                                                                    tion Imaging Spectroradiometer; Jethva et al., 2013; Meyer
To accurately predict future climate, it is essential to re-        et al., 2015; Sayer et al., 2016) and POLDER (POLariza-
duce the uncertainty in the representation of aerosols, clouds      tion and Directionality of the Earth’s Reflectances; Waquet
and their radiative impacts in climate models (Myhre et al.,        et al., 2013; Peers et al., 2015) satellite instruments have
2013). Therefore, new in situ and remote sensing strate-            already demonstrated the potential of retrieving both cloud
gies are needed to improve our understanding of aerosol–            properties and above-cloud aerosol optical thickness (AOT)
cloud–radiation interactions and to constrain models (Sein-         from passive sensors or deriving the direct radiative effect
feld et al., 2016). The south-east Atlantic Ocean (SEAO) is         of aerosols above clouds. These new observations have been
an ideal region to analyse the effects of partially absorbing       used in recent satellite-based studies on the direct radiative
aerosols on the radiative budget, the atmospheric stability,        effect of aerosols above clouds in the SEAO region (Wilcox,
clouds and precipitation. The biomass burning aerosols emit-        2012; Peers et al., 2015; Zhang et al., 2016b; de Graaf et
ted from July to October in southern Africa are mostly trans-       al., 2019; Kacenelenbogen et al., 2019). However, validation
ported westward in the residual continental boundary layer          exercises are needed to evaluate the accuracy of these new
in the free troposphere (Abel et al., 2020). These absorbing        methodologies. Intercomparisons of the results from the A-
biomass burning particles are frequently observed above the         train constellation have been performed to evaluate the con-
extensive stratocumulus deck covering the SEAO. For this            sistency among satellite retrievals (Jethva et al., 2014; Dea-
reason, the region has been the focus of much work over             conu et al., 2017). De Graaf et al. (2020) have compared the
the past few years. Using aircraft and surface-based instru-        direct radiative effect of aerosols above clouds obtained from
mentation, large-scale field campaigns have been deployed           SCIAMACHY, OMI/MODIS and POLDER and have shown
in 2016–2018 (Zuidema et al., 2016), within the NASA OR-            that differences can be expected from instruments with dif-
ACLES (ObseRvations of Aerosols above CLouds and their              ferent spatial resolution due to 3D effects of clouds. Despite
intEractionS; Redemann et al., 2020), the US DOE LASIC              independent techniques and/or instruments being compared,
(Layered Atlantic Smoke Interactions with Clouds; Zuidema           this type of analysis cannot be considered a “true” valida-
et al., 2016), the French AEROCLO-sA (AErosol RadiatiOn             tion exercise. To provide an independent validation of the
and CLouds in Southern Africa; Formenti et al., 2019) and           above-cloud AOT from the MODIS “colour-ratio” method,
the UK CLARIFY-2017 (CLouds and Aerosol Radiative Im-               Jethva et al. (2016) used airborne measurements from previ-
pacts and Forcing for Year 2017; Haywood et al., 2021)              ous aircraft measurement campaigns. However, more direct
programmes. Airborne in situ instruments, active and pas-           comparison of aerosol and cloud properties is now possible
sive remote sensing instruments, and radiosondes as well as         with the measurements made during the latest field experi-
continuous ground-based measurements have been deployed             ments. Data collected during the ORACLES campaign have
to characterize biomass burning aerosols, clouds and radia-         recently been used to evaluate the above-cloud AOT retrieved
tion. In addition to improving our knowledge about aerosol–         by the updated Deep Blue algorithm that is used in aerosol
cloud–radiation interaction processes and constraining nu-          retrievals from the MODIS and the VIIRS (Visible Infrared
merical weather forecast and climate models, this dataset           Imaging Radiometer Suite) instruments (Sayer et al., 2019).
provides, for the first time, direct observations of aerosol           In the companion paper (Part 1; Peers et al., 2019), an
above clouds for validating emerging satellite retrievals.          algorithm to retrieve aerosols above clouds from the geo-
   Until recently, aerosol retrievals from passive satellites       stationary SEVIRI instrument was presented. The first step
were limited to cloud-free skies, and their validation was per-     of the method consists of correcting the SEVIRI-measured
formed against the widely available datasets from ground-           reflectances for the large impact of the transmittance of at-
based measurements such as aerosol optical depth from               mospheric gases. This correction uses water vapour concen-
the AERONET (Aerosol Robotic NETwork) sun-photometer                tration profiles from the Met Office Unified Model fore-
network. There has been a growing interest in developing            cast. Then, the above-cloud AOT, the cloud optical thick-
methods to quantify aerosols above clouds from space be-            ness (COT) and the cloud droplet effective radius (CER)
cause absorbing aerosols above cloud have long been recog-          are simultaneously retrieved from the spectral dependence
nized to exert a significant, but poorly quantified, positive ra-   of the signal in the visible to short-wave infrared (SWIR) re-
diative effect (e.g. Keil and Haywood, 2003). While lidar re-       gion; this retrieval method is similar to those used to assess
trievals of aerosols above cloud have been available for some       aerosol and cloud properties from OMI and MODIS satellite
time from the active CALIOP (Cloud-Aerosol Lidar with Or-           data. The benefit from using data from the SEVIRI instru-
thogonal Polarization) instrument (Hu et al., 2007; Chand           ment is the high temporal frequency of acquisition. With an
et al., 2008; Liu et al., 2015), retrievals of aerosols from        observation every 15 min, the satellite instrument on board
passive instrumentation have also been developed. Studies           the geostationary platform MSG (Meteosat Second Genera-
based on the OMI (Ozone Monitoring Instrument; Torres et            tion) allows the tracking of the transport of biomass burning
al., 2012; de Graaf et al., 2019), SCIAMACHY (SCanning              plumes above clouds and monitoring of the evolution of the
Imaging Absorption SpectroMeter for Atmospheric CHar-               cloud cover (Chang and Christopher, 2016; Seethala et al.,

Atmos. Chem. Phys., 21, 3235–3254, 2021                                              https://doi.org/10.5194/acp-21-3235-2021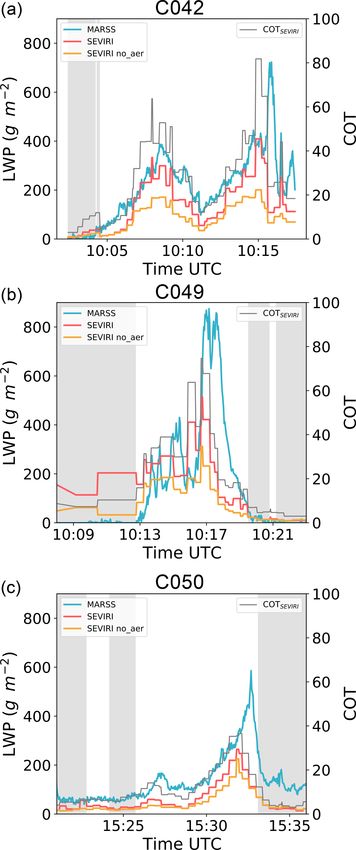
F. Peers et al.: Observation of absorbing aerosols above clouds with SEVIRI 3237
2018). In Sect. 2 of this paper, the SEVIRI retrieval will be creases. Secondly, the forward radiative transfer models used
compared against the aerosol and cloud products from the for the retrievals are 1D radiative transfer codes and can be-
MODIS retrieval developed by Meyer et al. (2015) to assess come unstable at cloud edges and for inhomogeneous or sub-
the consistency of the two retrievals over space and time. pixel clouds because the independent pixel approximation is
Section 3 is dedicated to the validation of the atmospheric not strictly valid and the plane-parallel bias is not negligi-
correction scheme, in addition to benchmarking the retrieved ble (e.g. Marshak and Davis, 2005). The MODIS algorithm
aerosol and cloud properties against the in situ measurements provides pixel-level estimates of the retrieval uncertainty.
made from an aircraft platform during CLARIFY-2017. Sec- When the retrieval uncertainty is larger than 100 % and/or
tion 4 presents discussion and conclusions. the COTMODIS is lower than 4, the above-cloud AOTMODIS
is rejected. Note that the filter on the AOT uncertainty partly
removes the lowest AOTs. Pixels identified as partly cloudy
2 Comparison with MODIS and/or associated with cloud edges are not processed by the
MOD06ACAERO retrieval. For SEVIRI, the retrieval is per-
2.1 Dataset and methodology formed for COTSEVIRI larger than three, and poorly fitted
measurements and observations in the glory backscattering
The first part of this analysis consists of evaluating the region are removed. Cloud edges, fractional cloud coverage
consistency (or lack thereof) between the aerosol and and heterogeneous clouds are also rejected from the SEVIRI
cloud products retrieved from SEVIRI and MODIS. The results using observations aggregated at a 0.1◦ × 0.1◦ grid
MODIS MOD06ACAERO algorithm developed by Meyer resolution. Readers are referred to Meyer et al. (2015) and
et al. (2015) relies on the colour-ratio effect to retrieve the Peers et al. (2019) for a complete description of the MODIS
above-cloud AOT, the COT and the CER using six channels and the SEVIRI filters. Note that those filters have been ap-
from the visible to the SWIR. The measurements are com- plied to the satellite data used in both Sects. 2 and 3. Compar-
pared with precomputed look-up tables (LUTs) via an opti- isons at the native resolution of the instruments is challeng-
mal estimation method. The cloud properties are the same ing, notably because of the rapid temporal evolution and ad-
as those assumed for the MODIS operational cloud retrieval vection of the clouds. In Sect. 2, the aerosol and cloud prop-
MOD06 (Platnick et al., 2003), and the aerosol model corre- erties from both methods are aggregated onto a 0.1◦ × 0.1◦
sponds to the absorbing model used for the MODIS Dark Tar- grid. Each MODIS overpass is compared with the closest
get Land Aerosol Product MOD04 (Levy et al., 2009). The SEVIRI slot in time, which means that there is never more
retrieval is run for both the Terra and Aqua satellites, provid- than 8 min between the two satellite observations. Through-
ing retrievals in the morning and afternoon respectively. out this study, intrinsic optical parameters and derived extrin-
Although the SEVIRI and the MODIS retrievals are based sic properties such as optical thickness refer to values at an
on the same approach, there are inherent differences between optical wavelength of 0.55 µm.
the two satellite instruments. For instance, the SEVIRI algo-
rithm uses three spectral bands from 0.64 to 1.64 µm while 2.2 Results
MODIS uses six channels, which cover a wider range (0.47
to 2.10 µm). The SEVIRI channels are also more affected by 2.2.1 Case study
absorption from atmospheric gases than the MODIS chan-
nels because of their bandwidth and their position in the so- The consistency between the MODIS and SEVIRI retrievals
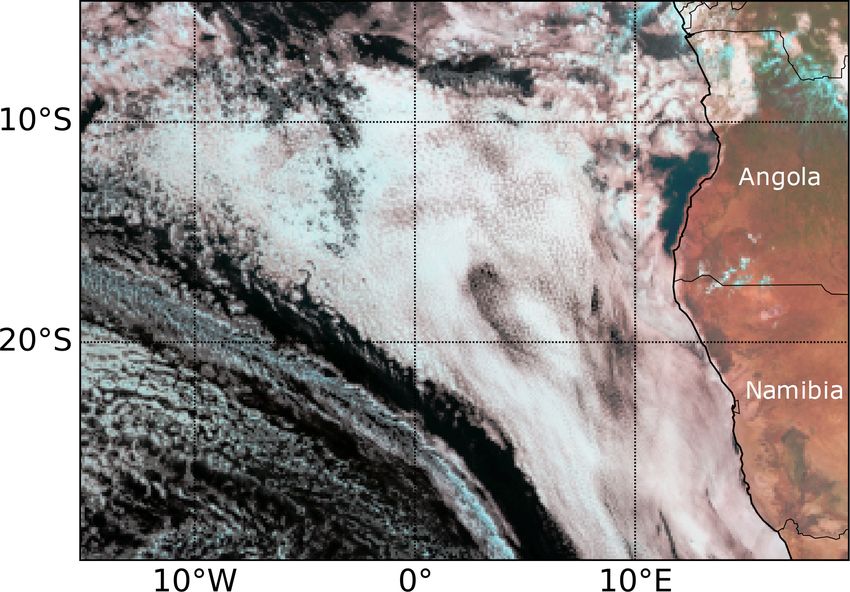
lar spectrum. Finally, the visible channels of SEVIRI have is first assessed for a single case study. The RGB compos-
a sampling distance of 3 km at nadir, as opposed to the ite of the SEVIRI slot on 4 September 2017 at 10:15 UTC
1 km spatial resolution of MODIS. These factors suggest that is shown in Fig. 1. The aerosol and cloud properties ob-
MODIS retrievals of above-cloud aerosol absorption might served by SEVIRI are presented in Fig. 2 together with the
be more sensitive and accurate compared to those from SE- MODIS products from the Terra overpasses at 10:00 UTC
VIRI. Therefore, it is reasonable to assess the performance (east) and 11:40 UTC (west). The spatial distribution of the
of the SEVIRI algorithm by comparing retrieved properties above-cloud AOT detected by SEVIRI (Fig. 2a) is typical of
against those from MODIS. Note that, throughout this paper, the SEAO during the fire season. A biomass burning plume
the subscripts MODIS and SEVIRI refer to the quantity rel- is observed close to the source, from 13 to 30◦ S along
ative to the MOD06ACAERO and the SEVIRI above-cloud- the African coast. The above-cloud AOT is largest close to
aerosol retrievals respectively. Angola, with values up to 1.5. A second plume of moder-
For both sensors, filters have been implemented to en- ate intensity (AOTSEVIRI ≈ 0.5) is detected offshore, around
sure that the measurements have been performed in opti- [10◦ S, 10◦ W]. Between those plumes, the AOT retrieved
mum conditions for the retrieval of aerosol and cloud prop- above clouds by SEVIRI is relatively low at between 0.0
erties. Firstly, colour-ratio-based techniques do not perform and 0.3. A very good spatial agreement is observed with
well over optically thin clouds as the difficulty in sepa- the MOD06ACAERO product (Fig. 2d), but the values are
rating the scattering from the clouds and the aerosols in- slightly larger than the SEVIRI AOT. For instance, the local
https://doi.org/10.5194/acp-21-3235-2021 Atmos. Chem. Phys., 21, 3235–3254, 2021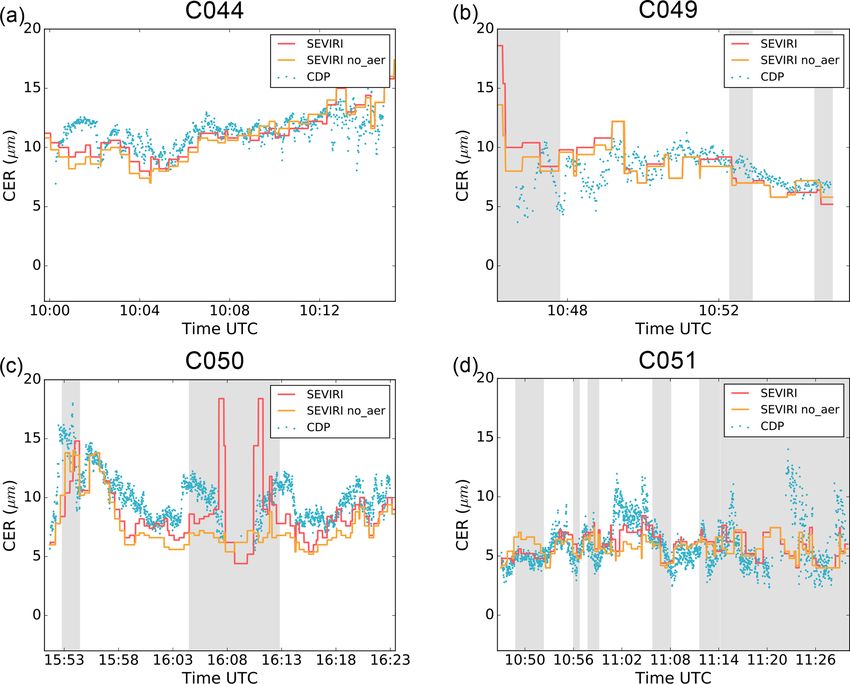
3238                                           F. Peers et al.: Observation of absorbing aerosols above clouds with SEVIRI

                                                                  associated with CERSEVIRI > 30 µm are removed to be con-
                                                                  sistent with the upper limit of the MODIS retrieval. Figure 3
                                                                  shows the correlation between the SEVIRI and MODIS re-
                                                                  trievals of aerosol and cloud properties. The mean, median
                                                                  and standard deviation of the collocated data have been cal-
                                                                  culated for each satellite product and are summarized in Ta-
                                                                  ble 1.
                                                                     Similar to the single case study reported in the previous
                                                                  section, a correlation (Pearson’s correlation coefficient R of
                                                                  0.78) is evident between the SEVIRI and the MODIS above-
                                                                  cloud AOT. The error bars in Fig. 3a represent the uncertainty
                                                                  associated with the retrieved AOT. In Peers et al. (2019),
                                                                  the uncertainty of the AOT retrieved by SEVIRI due to the
Figure 1. RGB composite obtained from the SEVIRI 0.64 (blue),     aerosol, the cloud model, the Rayleigh scattering (i.e. the al-
0.81 (green) and 1.64 µm (red) channels for 4 September 2017 at   titude of the aerosol and the cloud layer) and the water vapour
10:15 UTC over the SEAO.                                          correction has been estimated to be 40 %, 0.3 %, 2.5 % and
                                                                  10 % respectively. The uncertainty due to the measurements
                                                                  has been estimated by calculating the standard deviation of
average next to the coast is 0.8 for MODIS against 0.7 for        the SEVIRI AOT in Fig. 3a for each AOT bin. The total un-
SEVIRI. A strong visual agreement is also observed between        certainty is obtained by combining the uncertainties listed
the cloud properties retrieved with SEVIRI (Fig. 2b and c)        above, assuming they are independent (i.e. using the square
and MODIS (Fig. 2e and f). Both satellites detect shallow         root of the sum of squares). The MODIS uncertainty, which
clouds with small droplets off the coast of Namibia and opti-     is provided by the algorithm, accounts for the above-cloud
cally thicker clouds with larger droplets on the north-western    column two-way transmittance errors, the Rayleigh scatter-
part of the map. However, the CERs retrieved by SEVIRI are        ing errors, the measurement errors and the errors due to the
smaller than the MODIS CER by 2 µm on average over the            aerosol and the cloud model. As with SEVIRI, the aerosol
map. One can also see that the SEVIRI retrieval rejects more      model assumption is typically the largest source of uncer-
cloudy pixels than the MODIS one, especially in the more          tainty in the MODIS retrieval (Meyer et al., 2015). Figure 3a
broken cloud regions in the south-western part of the region.     shows that smaller values are retrieved by SEVIRI, with
For methods based on the colour-ratio effect, the above-cloud     the straight-line fit of SEVIRI versus MODIS retrievals of
AOT can only be retrieved when the cloud is bright enough.        AOT having a slope of 0.71. However, a non-linear relation-
The SEVIRI algorithm rejects both the aerosol and cloud           ship can be observed in Fig. 3a between the two retrieved
products when the COT is lower than 3, whereas the thresh-        AOTs. A difference of 20.3 % is obtained in the mean val-
old of 4 on the COT of the MOD06ACAERO retrieval is               ues observed by the two satellites. This can be explained
used to reject the above-cloud AOT product only. This dif-        mainly by the differences in the aerosol model assumed for
ference in the cloud sampling between the two methods can         the retrieval. In the companion paper (Peers et al., 2019), it
lead to a significant difference when comparing the regional      is shown that the assumed aerosol single-scattering albedo
mean of the above-cloud direct radiative effect (Zhang et al.,    (SSA) can have a large impact on the retrieved above-cloud
2016b). However, the 0.1◦ × 0.1◦ grid resolution used here is     AOT. For the MOD06ACAERO algorithm, the assumed mi-
close to the typical resolution of global operational numeri-     crophysical properties of aerosols are a function of the AOT
cal weather prediction models that can examine the impact of      (Levy et al., 2009). This results in an SSA at 0.55 µm of
clouds. Therefore, when comparing to global climate models        0.86, 0.87 and 0.88 for an AOT of 0.1, 0.5 and 1.5 respec-
(e.g. as per the model/POLDER comparison detailed in Hay-         tively. The aerosol model assumed for the SEVIRI retrieval
wood et al., 2021), users are advised to use a similar screen-    is based on high-quality aerosol size distribution data and
ing procedure to the satellite retrieval.                         high-accuracy cavity ring-down (CRD) and photoacoustic
                                                                  spectrometer (PAS) data (Davies et al., 2019; Taylor et al.,
2.2.2   Statistical comparisons                                   2020; Wu et al., 2020) measured by the FAAM aircraft in
                                                                  the vicinity of Ascension Island. This aerosol model has a
In this section, we extend our comparison of SEVIRI and           fixed SSA of 0.85 (see Sect. 3), which is more absorbing
MODIS retrievals of aerosol and cloud properties to 9 d           than the MODIS aerosol model. To reduce the influence of
of observations between 28 August and 5 September 2017            the assumed SSA on the results, the absorbing AOT (AAOT)
(i.e. during the CLARIFY-2017 deployment of the BAe146            has been compared and is shown in Fig. 3b. A better agree-
FAAM aircraft). During this time period, there were 34            ment is observed in the AAOT, with a slope of 0.87 and a
MODIS overpasses between 0◦ N–30◦ S and 20◦ W–15◦ E.              correlation coefficient of 0.78. A slightly non-linear relation-
In addition to the filters described in Sect. 2.1, observations   ship is still observed between the two AAOTs, with the SE-

Atmos. Chem. Phys., 21, 3235–3254, 2021                                             https://doi.org/10.5194/acp-21-3235-2021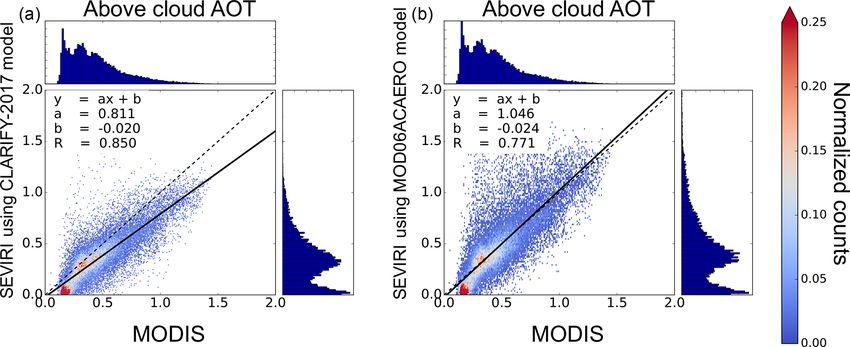
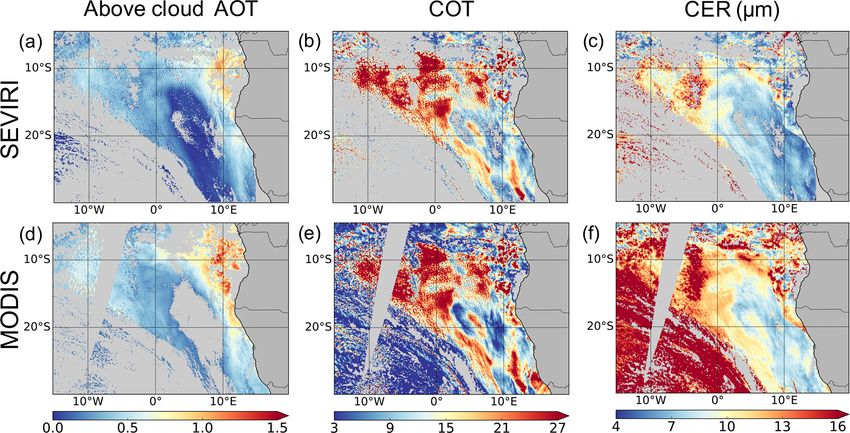
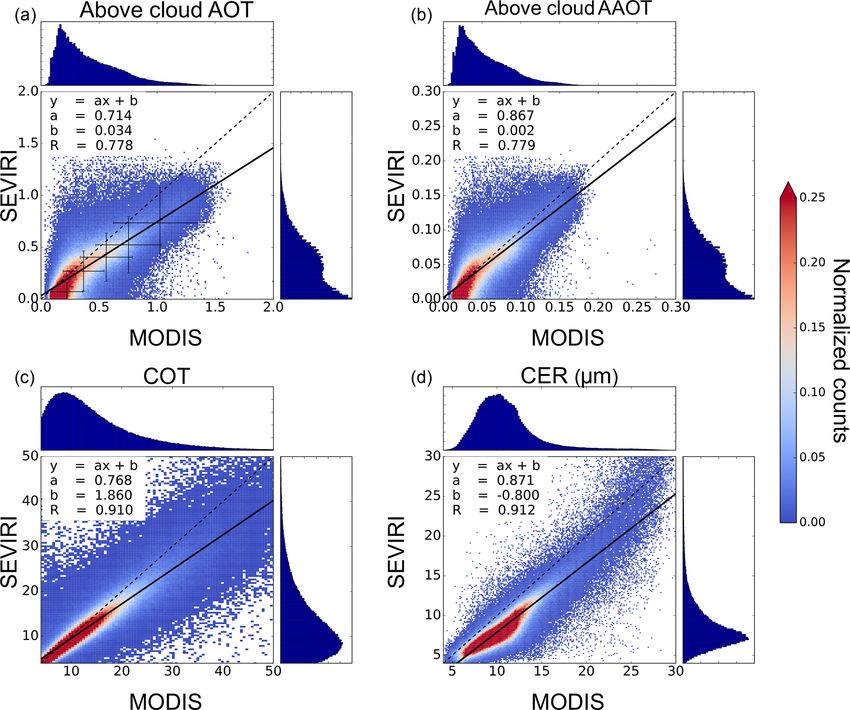
F. Peers et al.: Observation of absorbing aerosols above clouds with SEVIRI                                                            3239

Figure 2. Above-cloud AOT at the 0.55 µm optical wavelength and cloud properties retrieved from SEVIRI measurements on 4 September
2017 at 10:15 UTC over the SEAO (a–c) and corresponding Terra MODIS observations (10:00 UTC for the east overpass and 11:40 UTC for
the west overpass) from the MOD06ACAERO algorithm (d–f).

Figure 3. Scatterplots and data distributions for the comparison of the above-cloud AOT (a), AAOT (b), COT (c) and CER (d) from SEVIRI
and MODIS MOD06ACAERO retrieval between 28 August and 5 September 2017 over the area between 0◦ N–30◦ S and 20◦ W–15◦ E. The
solid lines represent the linear regression and the dashed lines are the 1 : 1 lines. R corresponds to the Pearson’s correlation coefficient.

VIRI AAOT smaller than the MODIS retrieval by 7.5 % on                   try factor assumption for the MOD06ACAERO retrieval is
average. The SSA assumption not only has a large impact                  AOT dependent (with the asymmetry factor taking values of
on the scattering AOT, it also influences, to a lesser extent,           0.60 and 0.62 at a wavelength of 0.55 µm for AOT values
the AAOT. Peers et al. (2019) also showed that the AAOT                  of 0.5 and 1.5 respectively) and is smaller than the asym-
is sensitive to the assumed asymmetry factor. The asymme-                metry factor assumed for the SEVIRI algorithm (i.e. 0.65 at

https://doi.org/10.5194/acp-21-3235-2021                                                   Atmos. Chem. Phys., 21, 3235–3254, 2021
3240                                              F. Peers et al.: Observation of absorbing aerosols above clouds with SEVIRI

Table 1. Summary statistics of the aerosol and cloud properties retrieved by SEVIRI and MODIS compared in Fig. 3.

                                                         SEVIRI                           MODIS
                                              Mean     Median     Standard     Mean     Median     Standard
                                                                  deviation                        deviation
                                AOT           0.329      0.295        0.243    0.413      0.342        0.264
                                AAOT          0.049      0.044        0.036    0.053      0.045        0.032
                                COT           13.12      11.26         7.66    14.66      12.30         9.08
                                CER (µm)       8.79       7.91         3.37    11.01      10.39         3.53

Figure 4. Comparison of the above-cloud AOT retrieved by SEVIRI and MODIS (MOD06ACAERO) in the morning of 4 September 2017
over the area between 0◦ N–30◦ S and 20◦ W–15◦ E. Panel (a) corresponds to the SEVIRI retrieval using the CLARIFY-2017 aerosol model,
and panel (b) shows the SEVIRI retrieval using the same aerosol model as the MODIS retrieval. The solid lines represent the linear regression,
and the dashed lines are the 1 : 1 lines. R corresponds to the Pearson’s correlation coefficient.

0.55 µm). To confirm that the aerosol model assumptions are              the SEVIRI and MODIS distributions at low values can be
the primary cause of differences in retrieved AOT, the SE-               partly explained by the MODIS filter on the AOT uncertainty.
VIRI retrieval has been run using both the CLARIFY-2017                  With the signal-to-noise ratio being smaller at low AOT, the
and the MOD06ACAERO aerosol models for the case study                    near-zero AOTMODIS values are typically associated with an
described in Sect. 2.2.1. The comparison of the both sets of             uncertainty larger than 100 % and are discarded. Although
AOT with MODIS is plotted in Fig. 4. The slope of the re-                no filters are applied to remove those results in the SEVIRI
gression line between SEVIRI and MODIS is 0.81 with the                  dataset, their contribution to the total direct radiative effect
CLARIFY-2017 model, and it is 1.05 when the same model                   over the south-east Atlantic is expected to be small.
(i.e. MOD06ACAERO model) is used. Moreover, the mean                        Figure 3c and d show the COT and CER comparisons
AOT for this case study is 0.44 for MODIS, 0.33 for SEVIRI               and confirm the strong correlation (R = 0.91) observed in
using the CLARIFY-2017 model and 0.44 for SEVIRI using                   the case study. The CER linear regression is characterized
the MOD06ACAERO model. This confirms that, for AOT                       by a slope of 0.87 and an intercept of −0.8 µm, which in-
larger than 0.25, the differences between the SEVIRI and                 dicates that the SEVIRI CER is generally smaller than the
the MODIS retrieval are mainly due to the assumed aerosol                MODIS observations. On average, the CER values retrieved
properties. While the CLARIFY-2017 and ORACLES ob-                       by SEVIRI and MODIS differ by 2.2 µm. For passive satel-
servations provide a thorough and comprehensive analysis                 lite sensors, the CER is typically retrieved from measure-
of the biomass burning aerosol optical properties, which are             ments in a water-absorbing spectral band in the SWIR re-
adopted by the SEVIRI and MODIS satellite retrievals, rep-               gion. Here, the SEVIRI algorithm uses the 1.64 µm channel
resenting the level of complexity of the variation in opti-              while the MODIS retrieval relies primarily on the 2.10 µm
cal properties owing to evolution of flaming to smoulder-                channel. Because of the different penetration depth of the
ing combustion during the biomass burning season (Eck et                 reflected photons (Platnick, 2000), the MODIS retrieval of
al., 2003) and the complexity of aerosol ageing processes                CER at 2.10 µm is sensitive to the upper-cloud microphysics
(e.g. Wu et al., 2020; Taylor et al., 2020) is beyond cur-               while the CER retrieved by SEVIRI at 1.64 µm is representa-
rent observational capabilities. The non-linearity of the AOT            tive of the droplets lower down in the cloud. Therefore, as
and AAOT comparison as well as the differences between                   the droplet size increases from the base to the top of the

Atmos. Chem. Phys., 21, 3235–3254, 2021                                                     https://doi.org/10.5194/acp-21-3235-2021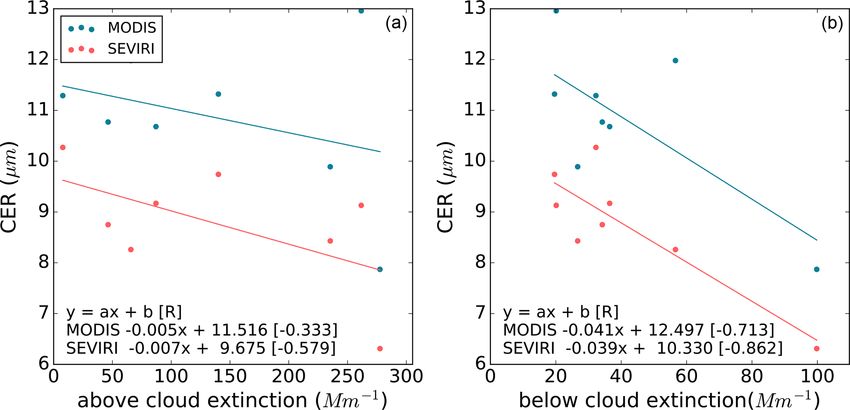
F. Peers et al.: Observation of absorbing aerosols above clouds with SEVIRI                                                   3241

cloud, the CER retrieved from the 2.10 µm channel should           3     Comparison with CLARIFY-2017 measurements
be larger than the CER retrieved from the 1.64 µm channel.
To assess the impact of the difference of spectral band, the       3.1     Instruments
MOD06 CERs retrieved from the 1.6 and 2.1 µm channels
from MODIS (Platnick et al., 2015) have been compared              3.1.1    EXtinction, SCattering and Absorption of Light
when the above-cloud AOT is lower than 0.5 for the case                     for AirBorne Aerosol Research (EXSCALABAR)
study presented earlier. The CER retrieved from the 1.6 µm
channel is lower than the one retrieved from the 2.1 µm by         EXtinction, SCattering and Absorption of Light for Air-
0.5 µm, which is consistent with the analysis from Platnick        Borne Aerosol Research (EXSCALABAR) is a state-of-
(2000). Differences in the cloud parameterization, such as         the-art suite of spectrometers for measuring in situ aerosol
the refractive index and the effective variance, also affect the   optical properties aboard the UK research aircraft (FAAM
CER retrieval (Arduini et al., 2005; Painemal and Zuidema,         BAe-146, https://www.faam.ac.uk, last access: 15 Febru-
2011; Platnick et al., 2019), although the impact is expected      ary 2021). EXSCALABAR includes cavity ring-down spec-
to depend on the observed scattering angle. Biases could also      troscopy (CRDS) and photoacoustic spectroscopy (PAS) in-
arise from an offset in the absolute calibration of the SEVIRI     struments for the measurement of extinction and absorp-
1.64 µm band compared to MODIS (Meirink et al., 2013).             tion coefficients at several wavelengths respectively. We now
   A strong linear relationship is obtained between the SE-        briefly describe the measurement capabilities of EXSCAL-
VIRI and the MODIS COT, and a difference of only 1.5               ABAR and how it was operated during CLARIFY-2017,
(10.5 %) is observed between the two mean values, with the         while the reader is referred to previous publications for com-
MODIS COT being larger on average. The agreement be-               plete details on calibration, operating principles and instru-
tween the two satellites is better at lower COT and the dif-       ment descriptions (Davies et al., 2018, 2019; Cotterell et al.,
ferences increase with the COT. The spatial resolution of the      2019a). In particular, Davies et al. (2019) outlined the same
instrument has an impact on the COT retrieval via the plane-       sample conditioning and operation of the spectrometers dur-
parallel bias (Cahalan et al., 1994; Szczap et al., 2000; Zhang    ing the airborne measurements used in this work.
et al., 2016a). The relationship between the top-of-cloud re-         Four CRDS channels measured extinction at wavelengths
flectance and the COT is convex, which means that the COT          of 405 and 658 nm, with three 405 nm channels measur-
derived from the mean reflectance of a pixel is smaller than       ing the extinction for aerosol at relative humidities (RH) of
the COT calculated from the mean COTs within the pixel.            < 10 %, 70 % and 90 % and the 658 nm channel operating un-
Zeng et al. (2012) have shown that subpixel inhomogeneities        der dry conditions (< 10 % RH) only. The CRDS instruments
cause satellite sensors with a coarser spatial resolution, such    use high-finesse optical cavities formed from two highly re-
as SEVIRI, to retrieve a smaller COT. Also, as the clouds be-      flective mirrors separated by ∼ 40 cm to achieve total opti-
comes thicker, the visible and the near-infrared (NIR) mea-        cal path lengths of the order of 5–11 km through the aerosol
surements become less sensitive to the COT for both instru-        sample. Intensity-modulated laser light is passively coupled
ments. Using a radiative transfer code to simulate the SE-         into each optical cavity and a photodetector used to moni-
VIRI signal, we estimate that an error of +1.5 µm on the CER       tor the decay of light exiting the rear mirror following each
retrieved by SEVIRI causes a bias of +0.3 for a COT of 5.0         on–off laser cycle. The signal exiting the cavity decays expo-
and +4.9 for a COT of 45. Therefore, differences in the re-        nentially and is fitted to extract the 1/e-folding time, referred
trieved CER could partly explain the low bias on the SEVIRI        to as the ring-down time. The change in ring-down time be-
COT compared to MODIS at a large COT.                              tween an empty cavity (i.e. a sample devoid of any light-
   Note that the cloud properties from SEVIRI and MODIS            scattering and light-absorbing aerosols) and a cavity filled
have also been compared for low above-cloud AOT                    with aerosol sample enables the aerosol extinction coeffi-
(AOT < 0.05) to separate the impact of the aerosol correc-         cient αext to be calculated (Davies et al.,2018). The long path
tion from the cloud retrieval itself. Figure S1 in the Supple-     lengths achieved in CRDS provide measurements of aerosol
ment shows that similar relationships are obtained with and        extinction to a sensitivity better than 0.2 Mm−1 for 1 s sam-
without aerosol above clouds.                                      pling.
                                                                      EXSCALABAR also included five PAS instruments that
                                                                   measured aerosol absorption coefficients under dry condi-
                                                                   tions (< 10 % RH). Three PAS instruments sampled the
                                                                   dried aerosol directly, with each spectrometer operating at a
                                                                   different visible wavelength (405, 515 or 658 nm). Two fur-
                                                                   ther 405 and 658 nm spectrometers sampled aerosol that had
                                                                   additionally passed over a thermal denuder (a heated car-
                                                                   bon catalyst) and are used to remove semi-volatile organic
                                                                   aerosol components that can act to enhance light absorption
                                                                   by refractory components. However, the 658 nm spectrome-

https://doi.org/10.5194/acp-21-3235-2021                                            Atmos. Chem. Phys., 21, 3235–3254, 2021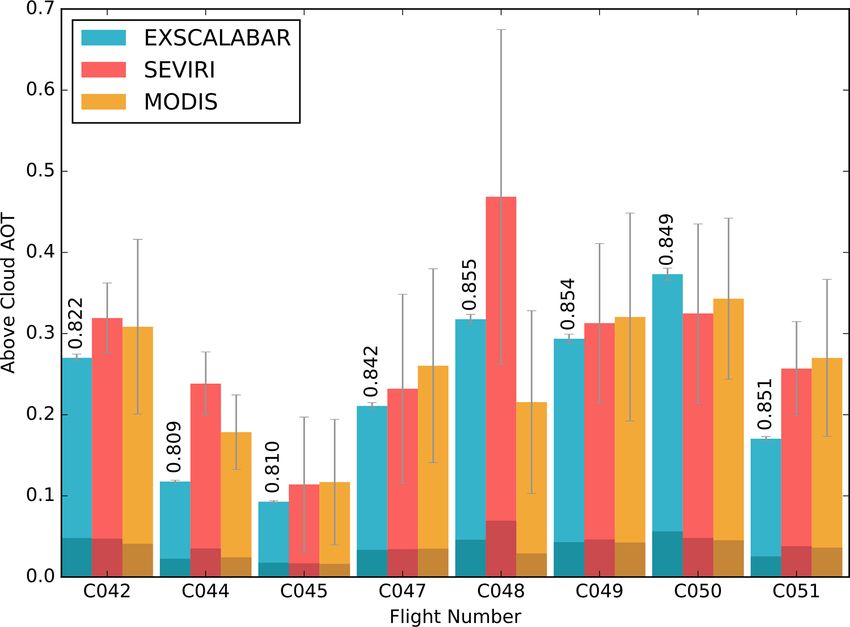
3242                                           F. Peers et al.: Observation of absorbing aerosols above clouds with SEVIRI

ter that sampled thermally denuded aerosol did not provide        emissivity is calculated using the fast ocean surface emissiv-
data during CLARIFY-2017 due to a faulty laser. Briefly,          ity model FASTEM (Liu et al., 2010), with the surface tem-
PAS measures light absorption coefficients for in situ aerosol    perature taken from infrared measurements during below-
in a non-contact manner (i.e. not using filter collection).       cloud runs and wind speed taken from the dropsondes. The
Laser light is intensity-modulated to heat aerosol particles      cloud liquid water content is assumed to increase linearly
within an acoustic resonance cell, leading to the generation      from cloud base to cloud top, and the altitudes of the cloud
and amplification of a sound wave as particles liberate their     base and top are estimated from aircraft profiles through the
heat to surrounding air. This sound wave is measured using        cloud layer. Cloud liquid water absorption is calculated us-
a microphone and is directly proportional to the aerosol ab-      ing the Ellison (2007) model. The retrieved parameters are
sorption coefficient, with the constant of proportionality de-    the liquid water path (LWP) and the column-integrated water
termined by calibrating each PAS instrument using ozone-          vapour, which are used to scale the background profiles of
laden air with a known absorption coefficient. Again, we          liquid water content and water vapour in the forward model
refer the reader to previous work on the principles of pho-       to provide the closest match to the observed brightness tem-
toacoustic spectroscopy (Davies et al., 2018; Cotterell et al.,   peratures.
2019b), assessment of the accuracy of PAS aerosol absorp-            Errors in the MARSS LWP retrievals arise from several
tion measurements (Davies et al., 2018) and calibration of        sources, including errors in the forward model used in the
PAS instruments with ozone (Cotterell et al., 2019a).             retrieval, the instrument noise and calibration errors. Instru-
   EXSCALABAR operated behind a 1 µm diameter im-                 ment noise and calibration errors are estimated to be less than
pactor to remove supermicron aerosols and sampled from            1 K, and the combined instrument and forward-model error
the aircraft via a modified Rosemount inlet. It extracted an      in the retrieval is assumed to be uncorrelated with a stan-
aerosol-laden sample from this inlet at a rate of 7 L min−1 .     dard deviation of 2 K. The overall uncertainty in the retrieved
The sample underwent flow conditioning that included pass-        LWP is estimated by combining the posterior error covari-
ing the sample through a Nafion dryer to dry the sample           ance from the retrieval with sensitivity estimates derived by
to < 10 % RH and then through an NOx / O3 scrubber to             perturbing fixed input parameters such as the sea surface tem-
remove gas phase species that would have otherwise con-           perature, wind speed, cloud-top and cloud-base heights, and
tributed to the measured light extinction and absorption. The     water vapour profile within plausible ranges. The total un-
conditioned sample was split using a series of Brechtel pre-      certainty is estimated to be approximately 40 g m−2 at low
cision flow splitters to provide samples to each spectrometer.    LWP (< 200 g m−2 ), and it increases with increasing LWP,
                                                                  becoming about 10 %–12 % at large LWP (> 400 g m−2 ).
3.1.2   Microwave Airborne Radiometer Scanning
        System (MARSS)                                            3.1.3   Cloud Droplet Probe (CDP)

Previous studies (e.g. English 1995; Zuidema et al., 2012)        The Droplet Measurement Technologies Cloud Droplet
have demonstrated that airborne millimetre-wave radiome-          Probe (CDP) is a forward-scattering optical particle counter
ters can be used to retrieve liquid water path (LWP) in stra-     which can detect particles over the nominal size range of 3
tocumulus clouds. Such microwave retrievals are not con-          to 50 µm. Light from a 658 nm diode laser illuminates the
taminated by the presence of absorbing biomass burning            sample volume, and scattered light is collected over a 1.7 to
aerosol above clouds (e.g. Haywood et al., 2004). In this         14◦ solid angle. The incoming beam is split using a 50 : 50
study, we use downward-looking views from the 89 and              optical beam splitter, where one beam is focused through an
157 GHz channels on the Microwave Airborne Radiometer             optical mask before being sampled by a so-called qualifier
Scanning System (MARSS) (McGrath and Hewison, 2001).              photodetector and the other by the sizer detector. This detec-
Over the ocean, the downward-looking measurements are             tion configuration is used to qualify the depth of field (DOF)
sensitive to absorption and emission by cloud liquid wa-          where the signal from the qualifier detector multiplied by 2
ter as the sea surface provides a relatively cold radiative       must exceed the signal from the sizer for the particle to reg-
background due to its low emissivity at these frequencies.        ister as being measured within the DOF. Particles which do
LWP retrievals using downward-looking MARSS observa-              not meet this criterion are rejected. The signal pulses from
tions on the FAAM aircraft have been used previously by           DOF-accepted particles are digitized from their raw analogue
Abel et al. (2017) in their study of a cold-air outbreak. Our     voltages; the peak value corresponding to the scattering cross
retrieval method is based on the optimal estimation method        section is then segregated into one of 30 bins, and the sum
(Rodgers, 1976) and is broadly similar to that described by       of counts in each bin over the sampling integration period
English (1995). Radiative transfer simulations are performed      is transmitted to a logging computer running PADS (ver-
using the Atmospheric Radiative Transfer Simulator (ARTS)         sion 3.11) software.
model (Buehler et al., 2018), with background profiles of            A 10-point glass bead calibration spanning the instru-
temperature and humidity taken from dropsondes released           ment’s detection range was performed before each day of fly-
close to the location of the above-cloud runs. The surface        ing throughout the CLARIFY-2017 campaign. The nominal

Atmos. Chem. Phys., 21, 3235–3254, 2021                                            https://doi.org/10.5194/acp-21-3235-2021
F. Peers et al.: Observation of absorbing aerosols above clouds with SEVIRI 3243 bead size is corrected for the differences between the refrac- tive indices of glass and water, and the water-corrected size is used to calibrate the instrument’s sizing response. The cal- ibration was found to be consistent across the campaign, re- sulting in an approximate 7 % under-sizing correction being applied to the instrument’s sizing response. 3.2 Atmospheric profile The atmospheric correction is an essential step of the SEVIRI above-cloud-aerosol retrieval. The spectral contrast between the 0.6 and the 0.8 µm channels, which is used to retrieve the Figure 5. Map showing the geographical location of the dropsonde above-cloud AOT, is especially sensitive to the absorption observations used in Sect. 3. The cross corresponds to Ascension from water vapour (Peers et al., 2019). To remove the con- Island. tribution of water vapour from the signal, the transmittances from the cloud top to the top of the atmosphere are calculated using the humidity profiles from the operational forecast con- used, the amount of water vapour used for the atmospheric figuration of the global Met Office Unified Model (Brown et correction is strongly correlated with the dropsonde observa- al., 2012) and the cloud-top height retrieved from the SEVIRI tions (R = 0.89 in Fig. S3), but the integrated water vapour infrared channels (Francis et al., 2008; Hamann et al., 2014). path is larger by 3.1 mm on average compared to the drop- The humidity and temperature profiles used in the correction sonde measurements. On the other hand, the full column wa- scheme are evaluated against those from the dropsondes de- ter vapour from the forecast and the observations follows the ployed during the CLARIFY-2017 flights. Figure 5 shows the same trend with a mean absolute difference of 1.5 mm in in- location of the flights analysed in this paper. Note that owing tegrated water vapour path. Much of this difference is ex- to difficulties in transmitting data from such a remote loca- plained by the underestimation of the altitude of the cloud top tion, the dropsonde measurements from the campaign have retrieved by SEVIRI, with a mean bias of −265 m. When the not been assimilated in the model forecasts. The above-cloud cloud-top height from the dropsonde is used to calculate the and the full-column integrated water vapour are calculated integrated water vapour above cloud from the forecast, the from the sondes and the forecast profiles. For both the model absolute difference to the measurements is reduced to 0.7 mm and the measurements, the highest altitude is considered to on average, which indicates a reasonable performance of the be the altitude at which the sonde has been dropped and, for model in forecasting the vertical profile of humidity. The SE- the full-column integration, the bottom altitude corresponds VIRI cloud-top height retrieval is derived by conversion of to the lowest altitude measured by the sonde. To be consis- the observed brightness temperature to a cloud-top height as- tent with the atmospheric correction scheme, the above-cloud suming the temperature profile from the Met Office forecasts. water vapour from the forecast is calculated using the cloud- Therefore, a reasonable consistency is observed between the top height from SEVIRI. For the dropsondes, the cloud-top retrieved cloud-top height and the altitude of the tempera- height is defined at the altitude of the temperature inversion, ture inversion from the model, with an absolute difference of which is consistent with lidar and in situ observations from 88 m. The individual profiles shown in Fig. S2 in the Supple- the aircraft (e.g. Haywood et al., 2021). To assess the added ment show that the model does not quite capture the depth value brought by the forecast model, the water vapour con- of the boundary layer. However, no evidence of a correla- tent has been calculated for the tropical atmospheric profile tion between the cloud-top height error and the presence of from McClatchey et al. (1972) using the cloud-top height re- absorbing aerosols in the boundary layer has been observed. trieved with SEVIRI. Figure 6 shows the integrated water While identifying the causes of these biases is complex and vapour comparison of the dropsondes, the forecast and the beyond the scope of this paper, it is worth mentioning that McClatchey atmospheric model. The dew point and temper- the boundary layer depth in the model is highly influenced ature profiles from the dropsonde, the numerical weather pre- by the balance between the subsidence and the entrainment diction (NWP) model and the McClatchey model are shown rate. for each flight in Fig. S2 of the Supplement. The NWP and The overestimation of the water vapour in the atmospheric the McClatchey integrated column water vapour above cloud correction, which disproportionately affects the 0.8 µm chan- are plotted against the measurements from the dropsonde in nel where water vapour absorption is stronger (see Fig. 3 in Fig. S3 of the Supplement. The problem in assuming a sin- Peers et al., 2019), indicates that an overestimation of the gle profile for water vapour from McClatchey climatologies above-cloud AOT retrieved by SEVIRI may be expected due is evident from the gross overestimation of water vapour and to an artificially enhanced spectral contrast between 0.6 and the limited variability which comes only from changes in the 0.8 µm. In Fig. 5, one can see that the dropsondes have been cloud height (R = 0 in Fig. S3). When NWP model data are launched in a small region around Ascension Island. Its re- https://doi.org/10.5194/acp-21-3235-2021 Atmos. Chem. Phys., 21, 3235–3254, 2021
3244                                               F. Peers et al.: Observation of absorbing aerosols above clouds with SEVIRI

                                                                        Figure 7. Longitudinal variation in the above-cloud AAOT from
                                                                        SEVIRI (black solid line), MODIS (black dashed line) and the dif-
                                                                        ference 1AAOT in percentage (blue line) for the data used in Fig. 3,
Figure 6. Comparison of the water vapour integrated over the full       removing AAOTSEVIRI lower than 0.03. The dashed vertical lines
column (lighter shades) and above clouds (darker shades) from the       correspond to the location of the dropsondes used in Fig. 6.
dropsondes, the forecast and the McClatchey tropical atmospheric
profile. For the McClatchey and the forecast, the top of the cloud is
based on the cloud-top height retrieved by SEVIRI.
                                                                        SEVIRI and MODIS may therefore be related to a trend in
                                                                        the accuracy of the atmospheric correction scheme. As ex-
mote location implies that the number of highly accurate                plained in Sect. 2.2.2, the AAOT from SEVIRI is expected
measurements available for model assimilations is limited to            to be slightly smaller than MODIS because of the differ-
the radiosonde releases from Ascension Island and therefore             ent assumptions on the SSA and the asymmetry factor. The
relies heavily on vertically integrated atmospheric state vari-         small low bias on the SEVIRI AAOT compared to MODIS
ables retrieved from satellites. Therefore, it might reasonably         suggests a good performance of the forecast model and the
be expected that the performance of the forecast model and              cloud-top height retrieval next to the coast. From the coast
the cloud-top height retrieval could vary with the distance             to 9◦ W, the difference between the SEVIRI and the MODIS
from the African continent where radiosonde launches are                AAOT is lower than 10 %. In Fig. 7, the longitudes associ-
less sparse. In the absence of in situ atmospheric sounding             ated with the dropsonde measurements are indicated by the
between Ascension Island and the African coast, the com-                grey lines and correspond to the region where 1AAOT is
parison of the above-cloud-aerosol properties retrieved from            the largest. Therefore, the overestimation of humidity in the
SEVIRI and MODIS can be considered an indirect evalua-                  forecast model (as demonstrated in Fig. 6) is likely a major
tion of the atmospheric correction scheme, since the MODIS              contributor to biases in SEVIRI retrievals of AAOT, partic-
channels used for the retrieval are barely impacted by the ab-          ularly at remote locations where very few observation data
sorption from water vapour, provided that the differences due           for humidity are available for assimilation into model fore-
to the assumptions on the aerosol microphysical properties              casts. While our analysis suggests that errors in humidity in
are accounted for. To minimize the influence of the aerosol             the model may well be the cause of the zonal discrepancy be-
model differences between the two retrievals, we have cho-              tween the AAOT in MODIS and SEVIRI, we cannot defini-
sen to compare the AAOT. The SEVIRI and the MODIS col-                  tively conclude this is the case. More detailed comparisons of
located observations from Sect. 2.2.2 (i.e. from 28 August              atmospheric moisture fields from other high quality observa-
to 5 September 2017 and over 0◦ N–30◦ S and 20◦ W–15◦ E)                tions such as from the ORACLES or AEROCLO-sA vertical
have been used, removing AAOTSEVIRI lower than 0.03. Fig-               profiles against those from the Unified model would be nec-
ure 7 shows the difference 1 of the mean AAOT as a function             essary, but this is beyond the scope of the present work.
of the longitude, with 1AAOT defined as
                                                                        3.3   Aerosol layer
1AAOT = (AAOTSEVIRI − AAOTMODIS ) /
            AAOTMODIS × 100 %.                                   (1)    To survey the full column of aerosols and characterize the
                                                                        aerosol–radiation interactions, a series of manoeuvres de-
An increase in 1AAOT can be observed from east to west.                 scribed as a “Z” pattern were performed on multiple flights
The AAOTSEVIRI is 8.3 % smaller than the AAOTMODIS                      during the campaign (Haywood et al., 2021). These patterns
close to the continent. The sign of the difference changes              start at an altitude of about 7 km with a straight level run
at 2.7◦ E. From west of 5◦ W, a sharp increase in 1AAOT                 and dropsonde deployment above the aerosol plume, fol-
is observed, reaching 28.8 % at 15◦ W. This trend between               lowed by a 180◦ turn and a profile descent through the main

Atmos. Chem. Phys., 21, 3235–3254, 2021                                                    https://doi.org/10.5194/acp-21-3235-2021
F. Peers et al.: Observation of absorbing aerosols above clouds with SEVIRI 3245
aerosol layers to an altitude of around a couple hundred me-
tres above the cloud top. Then, a level 180◦ turn and another
straight level run was performed along the same ground po-
sition as the upper run. Finally, subsequent to a further re-
ciprocal turn, a profile descent was made through the cloud
to 15 m above sea level. The extinction and absorption mea-
sured from EXSCALABAR during the two-part descent pro-
files have been used to calculate the total and absorption AOT
above clouds at the wavelengths of the instrument and inter-
polated to 0.55 µm. The above-cloud AOT from SEVIRI has
been obtained by averaging the observations acquired during
the descent (i.e. four to five 15 min time slots) over an area
within a 60 km radius from the position of the aircraft in the
middle of the profile descent, which covers roughly the dis-
tance travelled by the aircraft. Additionally, the above-cloud
AOT retrieved from the closest MODIS overpass (i.e. Terra
in the morning and Aqua in the afternoon) has been aver- Figure 8. Comparison of the above-cloud AOT (lighter shades) and
aged over the same area as SEVIRI. The impact of the time AAOT (darker shades) retrieved by SEVIRI and MODIS and mea-
difference between the MODIS and the aircraft observations sured by EXSCALABAR during descent profiles. The error bars
represent the uncertainties of the EXSCALABAR measurements
(lower than 2.5 h) on the AOT comparison is assumed to be
and the standard deviation of the satellite product within a 60 km ra-
negligible as the time and space variation in the aerosol dis-
dius around the aircraft measurements for SEVIRI and MODIS. The
tribution is expected to be small over this timescale. SSA has been calculated at 0.55 µm from the EXSCALABAR ob-
The comparison of the above-cloud AOT from the in situ servations and included as an annotation over the EXSCALABAR
and the satellite measurements is presented in Fig. 8. The above-cloud AOT.
darker colours represent the AAOT contribution to the AOT
and the error bars correspond to the standard deviation cal-
culated for each flight of the MODIS and SEVIRI AOT re- CALABAR and MODIS are in agreement while the AAOT
trieved within the 60 km radius. The (nominally dry aerosol) from SEVIRI is larger. Contrary to SEVIRI, the MODIS
SSAs obtained at 0.55 µm from EXSCALABAR for each channels used for the retrieval are barely impacted by the
flight are indicated above the in situ measurement bars. Note absorption from above-cloud water vapour. The AOT differ-
however that in the free troposphere above the marine bound- ences observed for this flight are consistent with the large
ary layer, the relative humidity is typically around 30 %, and overestimation of the water vapour by the SEVIRI atmo-
hence any hygroscopic growth is likely to be small (i.e. lower spheric correction scheme in this case, as observed in Fig. 6.
than 2 % according to Magi and Hobbs, 2003). For clarity, For C048, the AOTs retrieved from MODIS and SEVIRI
the AAOT bar chart comparison is also shown in Fig. S4 are associated with especially large standard deviations. Al-
in the Supplement. Given the limited size of the dataset, the though the in situ AOT is within the spread of the satellite
consistency observed between the SEVIRI above-cloud AOT retrievals, AOTSEVIRI is about 47 % larger than EXSCAL-
and the in situ measurements, which is shown in Fig. S5 of ABAR while AOTMODIS is about 32 % smaller. As confirmed
the Supplement, is promising (R = 0.75). Except for flights by the satellite images, broken cloud cover was observed
C044 and C051, the above-cloud AOT measured by EXS- during this flight. Additionally, the SEVIRI and MODIS ob-
CALABAR is within the standard deviation of the mean servations indicate that the in situ measurements were per-
AOT retrieved from both SEVIRI and MODIS. The SSA formed at the south-western edge of an aerosol plume where
derived from EXSCALABAR ranges from 0.798 to 0.858, strong aerosol gradients were present. The low cloud frac-
suggesting some variations in the level of aerosol absorp- tion together with the strong above-cloud AOT gradient in
tion. The SSAs assumed for both satellite retrievals (i.e. this region could explain the differences observed between
SSAMODIS ≈ 0.87 and SSASEVIRI ≈ 0.85) are in the upper the satellite retrievals and the in situ measurements. Finally,
bound of this range. As shown in Peers et al. (2019), colour- both satellite retrievals overestimate the above-cloud AOT
ratio-based retrieval method is sensitive to the aerosol ab- measured by the aircraft during C051. The overestimation
sorption above clouds, which means that the retrieval of the from SEVIRI cannot be totally attributed to the atmospheric
AAOT above cloud is less sensitive to the assumed SSA than correction scheme because the AOT from SEVIRI is consis-
the AOT. This could explain why a better agreement is ob- tent with MODIS.
tained between the in situ measurements and the satellite Information on the vertical profile of aerosols can be used
products on the AAOT than on the AOT for all flights except to further investigate the differences between satellite obser-
C044, C048 and C051. Both satellite AOTs for flight C044 vations and in situ measurements. After the descent profile
are larger than AOTEXSCALABAR , but the AAOTs from EXS- through the aerosol layer, a profile descent through the cloud
https://doi.org/10.5194/acp-21-3235-2021 Atmos. Chem. Phys., 21, 3235–3254, 20213246 F. Peers et al.: Observation of absorbing aerosols above clouds with SEVIRI
Table 2. Dry extinction (ext) measured by EXSCALABAR at 405 nm averaged over 100 m above and below the cloud (Mm−1 ) and collocated
CER (µm) retrieved by SEVIRI and MODIS.
Flights C042 C044 C045 C047 C048 C049 C050 C051
extabove 235.27 140.12 7.78 65.67 87.01 46.33 261.61 277.55
extbelow 26.68 19.61 32.26 56.60 36.47 34.21 20.13 99.80
CERSEVIRI 8.43 9.74 10.27 8.26 9.17 8.75 9.13 6.31
CERMODIS 9.89 11.32 11.29 11.98 10.68 10.77 12.96 7.87
was typically performed, which allowed sampling of ma-
rine boundary layer aerosols directly underneath the clouds.
Table 2 summarizes the extinction measured by EXSCAL-
ABAR directly above and under the stratocumulus cloud
layer as well as the collocated CER retrieved by SEVIRI and
MODIS. Note that the MODIS observations do not tempo-
rally correspond to the SEVIRI and EXSCALABAR mea-
surements and that the purpose here is to illustrate the dif-
ferences in the cloud properties between the flights. The
collocated CER averaged over the CDP transect for flights
C042 to C050 is around 9.1 µm for SEVIRI and 11.3 µm
for MODIS. For C051, both satellites retrieve significantly Figure 9. CER (µm) retrieved by SEVIRI (red) and MODIS (blue)
as a function of the dry extinction (Mm−1 ) measured by EXSCAL-
smaller droplets, with a difference of 2.8 and 3.4 µm for
ABAR at 405 nm and averaged over 100 m directly above (a) and
SEVIRI and MODIS respectively, which could potentially
below the cloud (b). The linear regression fits are defined by the
be caused by aerosol–cloud interactions. In addition, in situ slope a, the intercept b and the Pearson’s correlation coefficient R.
measurements indicate that the air directly underneath the
stratocumulus cloud is 3.2 times more polluted for flight
C051 than for the other flights, suggesting a significant en- SWIR range due to pollution within the cloud layer could be
trainment of biomass burning aerosol into the marine bound- interpreted by colour-ratio-based retrievals as an additional
ary layer. Figure 9a and b show the CER retrieved by SEVIRI aerosol signal, leading to an overestimation of the above-
and MODIS as a function of the extinction measured respec- cloud AOT.
tively directly above and below the cloud. While the corre-
lation obtained with the above-cloud extinction is moderate 3.4 Cloud layer
(R = 0.58), there is a convincing relationship between below-
cloud extinction and the CER (R = 0.86). Although these re- 3.4.1 Cloud droplet effective radius (CER)
sults are far from robust considering the limited number of
measurements available, this is consistent with the observa- The cloud droplet size distribution has been measured with
tions from Diamond et al. (2018). Using data from the OR- a CDP during straight level runs at about 100 m below the
ACLES campaign, they observed a correlation between the cloud top. Figure 10 shows the time series of the CER mea-
presence of smoke in the marine boundary layer and changes sured by the aircraft (blue dot) with the closest SEVIRI re-
in the cloud microphysics. They have also reported that the trieval in space and time (red line). In addition to the above-
presence of smoke directly above cloud is not necessarily an cloud-aerosol algorithm, the CER has been retrieved consid-
indicator of aerosol–cloud interactions because the mixing ering an above-cloud AOT of zero and is plotted in orange.
of elevated smoke into the boundary layer typically takes a The grey areas represent the pixels that have been rejected by
couple of days. Pollution within clouds tends to increase the the algorithm’s filters, which include measurements poorly
cloud albedo by acting as cloud condensation nuclei but can fitted by the algorithm, observations in the backscattering
also increase their absorption coefficient (Twomey, 1977). glory region, COT lower than 3, cloud edges and inhomo-
Although the brightening of the clouds is typically the domi- geneous clouds (Sect. 2.1). The CER retrieved from SEVIRI
nant effect, the presence of absorbing smoke within the cloud is plotted against the CDP measurements in Fig. S6 of the
could have an impact on the spectral variation in the cloud Supplement. The consistency observed between the in situ
reflectance. Both the SEVIRI and the MODIS algorithms as- measurements and the satellite retrievals is good (R = 0.77
sume that the entire aerosol layer is located above an unpol- in Fig. S6), with both the variation in CER during a single
luted cloud and do not account for aerosols within the cloud. flight and the inter-flight differences being well represented.
Therefore, a reduction in the cloud albedo in the visible– The range and the variation in the CER are well reproduced
Atmos. Chem. Phys., 21, 3235–3254, 2021 https://doi.org/10.5194/acp-21-3235-2021You can also read