On the drivers of droplet variability in alpine mixed-phase clouds
←
→
Page content transcription
If your browser does not render page correctly, please read the page content below
Atmos. Chem. Phys., 21, 10993–11012, 2021
https://doi.org/10.5194/acp-21-10993-2021
© Author(s) 2021. This work is distributed under
the Creative Commons Attribution 4.0 License.

On the drivers of droplet variability in alpine mixed-phase clouds
Paraskevi Georgakaki1 , Aikaterini Bougiatioti2 , Jörg Wieder3 , Claudia Mignani4 , Fabiola Ramelli3 , Zamin A. Kanji3 ,
Jan Henneberger3 , Maxime Hervo5 , Alexis Berne6 , Ulrike Lohmann3 , and Athanasios Nenes1,7
1 Laboratory   of Atmospheric Processes and their Impacts, School of Architecture, Civil & Environmental Engineering,
École Polytechnique Fédérale de Lausanne, Lausanne 1015, Switzerland
2 Institute for Environmental Research & Sustainable Development, National Observatory of Athens, P. Penteli 15236, Greece
3 Department of Environmental Systems Science, Institute for Atmospheric and Climate Science,

ETH Zurich, Zurich 8092, Switzerland
4 Department of Environmental Sciences, University of Basel, Basel 4056, Switzerland
5 Federal Office of Meteorology and Climatology, MeteoSwiss, Payerne 1530, Switzerland
6 Environmental Remote Sensing Laboratory, School of Architecture, Civil & Environmental Engineering,

École Polytechnique Fédérale de Lausanne, Lausanne 1015, Switzerland
7 Center for Studies of Air Quality and Climate Change, Institute of Chemical Engineering Sciences,

Foundation for Research and Technology Hellas, Patras 26504, Greece

Correspondence: Athanasios Nenes (athanasios.nenes@epfl.ch)

Received: 5 October 2020 – Discussion started: 30 November 2020
Revised: 10 May 2021 – Accepted: 23 May 2021 – Published: 20 July 2021

Abstract. Droplet formation provides a direct microphysical       tical velocity variations can be appropriately described as a
link between aerosols and clouds (liquid or mixed-phase),         function of the standard deviation of the distribution of up-
and its adequate description poses a major challenge for          draft velocities, σw , as the droplet number never exceeds a
any atmospheric model. Observations are critical for eval-        characteristic limit, termed the “limiting droplet number”,
uating and constraining the process. To this end, aerosol size    of ∼ 150–550 cm−3 , which depends solely on σw . We also
distributions, cloud condensation nuclei (CCN), hygroscop-        show that high aerosol levels in the valley, most likely from
icity, and lidar-derived vertical velocities were observed in     anthropogenic activities, increase the cloud droplet number,
alpine mixed-phase clouds during the Role of Aerosols and         reduce cloud supersaturation (< 0.1 %), and shift the clouds
Clouds Enhanced by Topography on Snow (RACLETS) field             to a state that is less susceptible to changes in aerosol concen-
campaign in the Davos, Switzerland, region during Febru-          trations and very sensitive to vertical velocity variations. The
ary and March 2019. Data from the mountain-top site of            transition from an aerosol to velocity-limited regime depends
Weissfluhjoch (WFJ) and the valley site of Davos Wolfgang         on the ratio of cloud droplet number to the limiting droplet
are studied. These observations are coupled with a state-of-      number, as droplet formation becomes velocity limited when
the-art droplet activation parameterization to investigate the    this ratio exceeds 0.65. Under such conditions, droplet size
aerosol–cloud droplet link in mixed-phase clouds. The mean        tends to be minimal, reducing the likelihood that large drops
CCN-derived hygroscopicity parameter, κ, at WFJ ranges be-        are present that would otherwise promote glaciation through
tween 0.2–0.3, consistent with expectations for continental       rime splintering and droplet shattering. Identifying regimes
aerosols. κ tends to decrease with size, possibly from an         where droplet number variability is dominated by dynami-
enrichment in organic material associated with the vertical       cal – rather than aerosol – changes is key for interpreting
transport of fresh ultrafine particle emissions (likely from      and constraining when and which types of aerosol effects on
biomass burning) from the valley floor in Davos. The pa-          clouds are active.
rameterization provides a droplet number that agrees with
observations to within ∼ 25 %. We also find that the suscep-
tibility of droplet formation to aerosol concentration and ver-

Published by Copernicus Publications on behalf of the European Geosciences Union.
10994                              P. Georgakaki et al.: On the drivers of droplet variability in alpine mixed-phase clouds

1   Introduction                                                      Cloud-scale updraft velocity (i.e., the part of the vertical
                                                                   velocity spectrum with positive values) is the major driver
Orographic clouds and the precipitation they generate play         of droplet formation, owing to the supersaturation gener-
a major role in alpine weather and climate (e.g., Roe, 2005;       ated from adiabatic expansion and cooling (e.g., Nenes et al.,
Grubisic and Billings, 2008; Saleeby et al., 2013; Vosper et       2001; Ghan et al., 2011). Despite its importance, the sim-
al., 2013; Lloyd et al., 2015). The formation and evolution of     ulation of updraft velocity by atmospheric models is rarely
orographic clouds involves a rich set of interactions at differ-   constrained by observations, which can lead to large uncer-
ent spatial and temporal scales encompassing fluid dynamics,       tainties in climate and numerical weather prediction models
cloud microphysics, and orography (Roe, 2005; Rotunno and          (Sullivan et al., 2016, 2018). Reutter et al. (2009) pointed
Houze, 2007). Atmospheric aerosol particles modulate the           out that droplet formation in clouds can be limited by the
microphysical characteristics of orographic clouds by serv-        amount of CCN present (called the “aerosol-limited” regime)
ing as cloud condensation nuclei (CCN) that form droplets          or by the vertical velocity that generates supersaturation in
or ice nucleating particles (INPs) that form ice crystals (e.g.,   the cloudy updrafts (called the “velocity-limited” regime).
Pruppacher and Klett, 1980; Muhlbauer and Lohmann, 2009;           Over the complex alpine terrain, vertical motions can be sig-
Zubler et al., 2011; Saleeby et al., 2013).                        nificantly shaped by the effects of orography (Lohmann et
   Emissions of aerosol particles acting as CCN and INPs can       al., 2016). Orographic MPCs have been frequently observed
affect the microphysical and radiative properties of clouds        in the Swiss Alps under high updraft velocity conditions,
with strong (but highly uncertain) effects on local and re-        where supersaturation with respect to liquid water is formed
gional climate (IPCC, 2013; Seinfeld et al., 2016). Aerosol        faster than it is depleted by diffusional and collisional ice
interactions with orographic clouds are subject to even larger     growth processes (Korolev and Isaac, 2003) leading to per-
uncertainties, owing in part to the complex flows generated        sistent MPCs (Lohmann et al., 2016).
by the interaction of the large-scale flow with the mesoscale         Given the importance of droplet number for the radia-
orographic lifting and condensation and complex anisotropic        tive cloud properties and microphysical evolution of alpine
turbulent air motions that arise (Roe, 2005; Smith, 2006;          MPCs, it is essential to understand the main aerosol and
Rotunno and Houze, 2007). Most importantly, orographic             dynamics properties that drive droplet formation. A limited
clouds are often mixed-phase clouds (MPCs), which are              number of studies exist that discuss this very important topic,
characterized by the simultaneous presence of supercooled          although they focus on liquid-phase clouds (Hammer et al.,
liquid water droplets and ice crystals (Lloyd et al., 2015;        2014, 2015; Hoyle et al., 2016). Hoyle et al. (2016) showed
Farrington et al., 2016; Lohmann et al., 2016; Henneberg et        that 79 % of the variance in droplet number in warm clouds
al., 2017). MPCs remain one of the least understood cloud          formed at the high-altitude research station of Jungfraujoch
types, due to the multiple and highly nonlinear cloud micro-       in the Swiss Alps (3450 m a.s.l.) is driven by variations in
physical pathways that can affect their properties and evo-        potential CCN concentration (i.e., aerosol particles with a
lution. MPCs tend to glaciate (i.e., transition to pure ice        dry diameter > 80 nm). Using a cloud parcel model, Ham-
clouds) over time because of the Bergeron–Findeisen pro-           mer et al. (2015) also investigated the influence of updraft
cess, which is the rapid growth of ice crystals at the expense     velocity, particle concentration, and hygroscopicity on liquid
of the evaporating cloud droplets, owing to the higher sat-        cloud formation in the alpine region and found that variations
uration vapor pressure of liquid water over ice (Bergeron,         in vertical wind velocity have the strongest influence on the
1935; Findeisen, 1938). Aerosol concentrations may also            aerosol activation. We are not aware of existing in situ studies
alter the microphysical pathways active in MPCs and ulti-          assessing cloud droplet closure in MPCs where the existence
mately drive their glaciation state. For instance, an increase     of ice crystals can deplete supersaturation or the low temper-
in CCN concentrations leads to more numerous and smaller           atures may decrease CCN activity through the formation of
cloud droplets, reducing the riming efficiency of ice crystals     glassy aerosols.
and therefore the hydrometeor crystal mass and the amount             Here we analyze observational data collected as part of
of precipitation (Lohmann and Feichter, 2005; Lance et al.,        the Role of Aerosols and Clouds Enhanced by Topography
2011; Lohmann, 2017). This mechanism counters the glacia-          on Snow (RACLETS) field campaign, which was held in the
tion indirect effect, where increases in INP concentrations        region of Davos, Switzerland, during February and March
elevate ice crystal number concentration (ICNC) and pro-           2019. This intensive field campaign aims to address ques-
motes the conversion of liquid water to ice and therefore          tions related to the modulators of orographic precipitation,
the amount of ice-phase precipitation (Lohmann, 2002). In-         the drivers of the enhanced ice-crystal number concentrations
creases in CCN can also decrease cloud droplet radius and          observed in MPCs, as well as the human-caused pollution ef-
impede cloud glaciation, owing to reductions in secondary          fects on cloud microphysical and optical properties. In this
ice production (SIP), which includes rime splintering, col-        study we focus on a two-week period and seek to unravel the
lisional break-up, and droplet shattering (Field et al., 2017;     complex aerosol–droplet–updraft velocity interactions that
Sotiropoulou et al., 2020, 2021).                                  occur in the orographic MPCs. For this, we combine CCN
                                                                   number concentrations with the particle size distributions to

Atmos. Chem. Phys., 21, 10993–11012, 2021                                          https://doi.org/10.5194/acp-21-10993-2021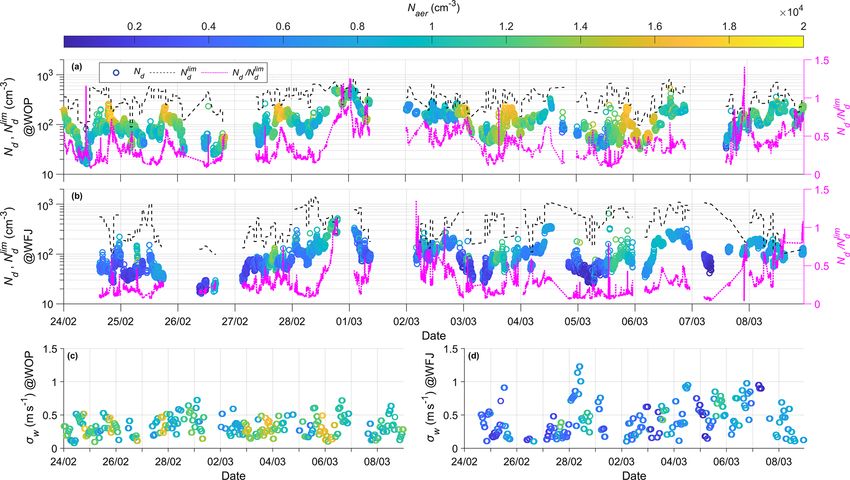
P. Georgakaki et al.: On the drivers of droplet variability in alpine mixed-phase clouds                                    10995

understand the variations in hygroscopicity over time and for     both stations, the systems consisted of a differential mobility
sites located in the valley and a nearby mountain-top site. The   analyzer (Model 3081, TSI Inc., US), a soft X-ray neutral-
in situ measurements are subsequently coupled with a state-       izer (Model 3088, TSI Inc., US), and a water-based conden-
of-the-art droplet parameterization to determine the potential    sation particle counter (Model 3787 at WOP, Model 3788
droplet numbers and the corresponding maximum supersat-           at WFJ, TSI Inc., US). Running the particle counters in low-
uration achieved in cloudy updrafts. The predicted droplet        flow mode (0.6 L min−1 ), using a sheath flow of 5.4 L min−1 ,
numbers are evaluated against direct observations and the de-     and applying a total scanning time of 2 min (scan time: 97 s;
gree to which droplet formation is velocity or aerosol limited    retrace time: 3 s; purge time: 10 s), particle size distributions
is determined for the whole time series.                          between 11.5 and 469.8 nm diameter were monitored.

                                                                  2.1.2   CCN measurements
2     Methods
                                                                  A Droplet Measurement Technologies (DMT) single-column
2.1     Observational datasets                                    continuous-flow streamwise thermal gradient chamber (CF-
                                                                  STGC; Roberts and Nenes, 2005) was used to carry out in
This analysis utilizes measurements collected during the          situ measurements of CCN number concentrations for differ-
RACLETS campaign, which took place from 8 Febru-                  ent supersaturations (SS). The CFSTGC consists of a cylin-
ary to 28 March 2019 (https://www.envidat.ch/group/about/         drical flow tube with wetted walls, inside which SS is devel-
raclets-field-campaign, last access: 17 December 2020)            oped by applying a linear streamwise temperature gradient
(Mignani et al., 2021; Ramelli et al., 2021a, b; Lauber           between the column top and bottom. Owing to the greater
et al., 2021). This joint research project offers a unique        mass diffusivity of water vapor than the thermal diffusiv-
dataset of orographic clouds, precipitation, and snow mea-        ity of air, a constant and controlled SS is generated with
surements in an effort to shed light on some fundamen-            a maximum at the centerline of the flow tube. The SS is
tal microphysical processes present in subsequent stages of       mainly dependent on the applied temperature gradient, flow
the life cycle of clouds (i.e., cloud formation, precipita-       rate and pressure (Roberts and Nenes, 2005). An aerosol
tion onset, and cloud dissipation). All measurements pre-         sample flow is introduced at the column centerline and those
sented in this paper were performed at two distinct obser-        particles having a critical supersaturation lower than the in-
vation stations near Davos, Switzerland (Fig. S1 in the Sup-      strument SS will activate to form droplets and will afterward
plement). A measurement site is located at Davos Wolf-            be counted and sized by an optical particle counter (OPC)
gang, which is the pass between Davos (1560 m a.s.l.) in          located at the base of the CFSTGC column. The SS de-
the south and Klosters (1200 m a.s.l.) in the north and is        veloped within the instrument responds linearly to changes
otherwise known as Wolfgang Pass (WOP; 1630 m a.s.l.,             in pressure, since its operation relies on the difference be-
46◦ 500 08.07600 N, 9◦ 510 12.93900 E). Measurements were also    tween heat and mass diffusivity. Calibration of the instru-
conducted at the mountain-top station Weissfluhjoch (WFJ;         ment, which determines the output supersaturation, was per-
2700 m a.s.l., 46◦ 490 58.67000 N, 9◦ 480 23.30900 E), which is   formed by the manufacturer at ∼ 800 mbar, while throughout
located ∼ 1 km above the valley floor in Davos, in the east-      the campaign the CFSTGC was operating at a lower pres-
ern part of the Swiss Alps. The current study primarily fo-       sure ∼ 735 mbar, therefore the SS reported by the instrument
cuses on data collected during a two-week period of inter-        is adjusted by a factor of 735/800 = 0.92, which accounts
est, which spans from 24 February to 8 March 2019. Dur-           for the difference between the ambient and the calibration
ing the RACLETS campaign, a defective sheath air filter af-       pressure (Roberts and Nenes, 2005). CCN concentrations
fected the CCN measurements collected at WFJ, thus inhibit-       were measured at a specific SS for approximately 10 min;
ing data usage from the instrument for a large duration of the    the instrument was cycled between six discrete values rang-
campaign. Therefore, we limit our analysis to the abovemen-       ing from 0.09 % to 0.74 % supersaturations, producing a full
tioned period when the CCN counter was fully operational.         spectrum every hour. Each 10 min segment of the raw CCN
In addition, during the selected period two distinct weather      data is filtered to discount periods of transient operation (dur-
patterns were observed (fair weather conditions interrupted       ing supersaturation changes) and whenever the room temper-
by a precipitating period), allowing for a contrasting analysis   ature housing the instrument changed sufficiently to induce
of the observed scenarios. The following description refers       a reset in column temperature (the instrument control soft-
to the measurements that provided the basis for the present       ware always sets the column temperature to be at least 1.5◦
analysis (see Table 1).                                           above the room temperature to exclude spurious supersatura-
                                                                  tion generation in the column inlet). The CFSTGC was de-
2.1.1    Aerosol particle size distribution measurements
                                                                  ployed on the mountain-top site of WFJ with the intention
Particle size distributions were continuously monitored at        of relating the CCN measurements directly to the size distri-
WOP and WFJ using commercially available scanning mo-             bution and total aerosol concentration data measured by the
bility particle sizers (SMPS; Model 3938, TSI Inc., US). At       SMPS instrument at the same station.

https://doi.org/10.5194/acp-21-10993-2021                                       Atmos. Chem. Phys., 21, 10993–11012, 2021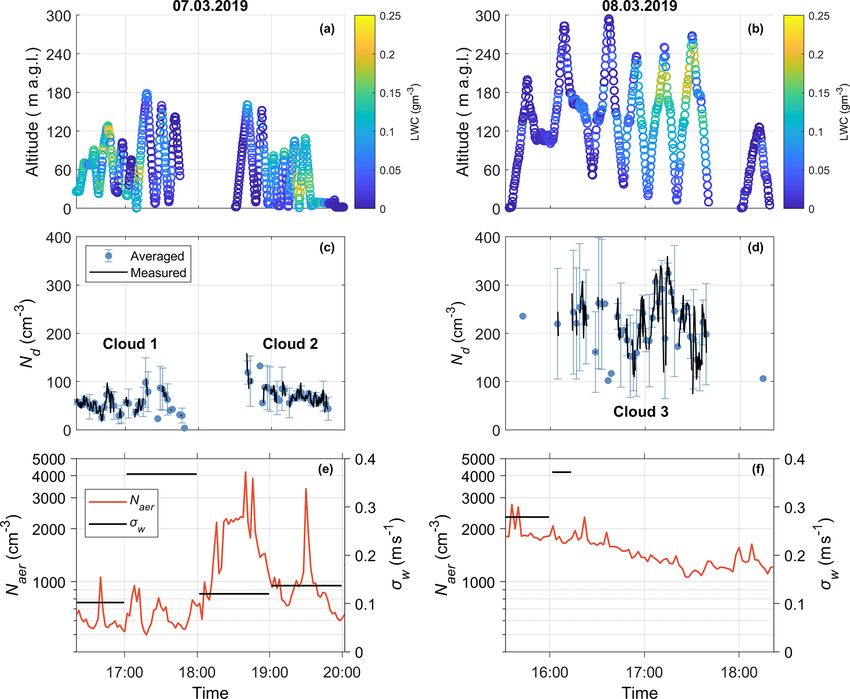
10996                                P. Georgakaki et al.: On the drivers of droplet variability in alpine mixed-phase clouds

Table 1. Overview of data sources from the RACLETS campaign used for this study. Along with the observed parameters, the corresponding
instrumentation, measurements range, and time resolutions are listed.

              Measured parameter        Measurement     Instrument                Measurement range    Time resolution
                                        site
              Aerosol number size       WOP/WFJ         Scanning mobility         11.5–469.8 nm        2 min
              distribution                              particle sizer
              CCN number concen-        WFJ             Continuous flow           SS = 0.09 %–0.74 %   1s
              tration                                   streamwise thermal
                                                        gradient CCN
                                                        counter
              Cloud droplet number      WOP             Holographic cloud         6 µm–2 mm            10–20 s
              concentration and liq-                    imager HOLIMO
              uid water content
              Precipitation             WOP/WFJ         Parsivel disdrometer/     0.2–25 mm            30 s
                                                        MeteoSwiss weather
                                                        station
              Horizontal wind           WOP/WFJ         MeteoSwiss weather        –                    10 min averages
              speed and direction                       station
              Profiles of vertical      WOP             Wind Doppler              200–8100 m a.g.l.    5 s max
              wind speed                                lidar

2.1.3   Cloud microphysical measurements                             2.1.4      Meteorological data

In situ observations of the cloud microphysical properties           During the measurement period, meteorological parame-
were obtained with the tethered balloon system HoloBalloon           ters (e.g., pressure, temperature, precipitation, and horizontal
(Ramelli et al., 2020). The main component of the measure-           wind speed and direction) were continuously monitored by
ment platform is the holographic cloud imager HOLIMO 3B,             the permanent MeteoSwiss observation station at WFJ. Addi-
which uses digital in-line holography to image an ensemble           tionally, a weather station was installed on the OceaNet con-
of cloud particles in the size range from 6 µm to 2 mm di-           tainer (Griesche et al., 2020) deployed at WOP, which also
ameter in a three-dimensional detection volume. Note that            hosted several remote sensing instruments (e.g., cloud radar,
particles smaller than 6 µm are not detected by HOLIMO,              Raman lidar, and microwave radiometer) and a particle size
which means that the droplet number concentration may be             velocity (Parsivel) disdrometer (Parsivel2, OTT HydroMet
underestimated. Based on a set of two-dimensional images,            GmbH, Germany; Tokay et al., 2014) to measure precipita-
information about the particle position, size, and shape can         tion. As there was no wind sensor included in the weather
be obtained. The detected particles can be classified as cloud       station on the OceaNet container, we utilized the horizontal
droplets and ice crystals using supervised machine learn-            wind speed and direction measurements from the nearby Me-
ing (Fugal et al., 2009; Touloupas et al., 2020). The differ-        teoSwiss station in Davos, assuming that they provide a good
entiation between cloud droplets (circular) and ice crystals         proxy for the wind regime in the valley. Vertical wind speed
(non-circular) is done for particles exceeding 25 µm diame-          profiles were obtained with a wind Doppler lidar (WindCube
ter based on their shape (Henneberger et al., 2013). From the        100S, manufactured by Leosphere) at WOP. Throughout the
classification, the phase-resolved size distribution, concen-        campaign the wind lidar measured from 200 to 8100 m above
tration, and content can be derived (Henneberger et al., 2013;       ground level (a.g.l.) with high temporal (5 s max) and verti-
Ramelli et al., 2020). The HoloBalloon platform was flying           cal resolution (50 m). The wind lidar operated following the
at WOP and provided vertical profiles of the cloud properties        Doppler beam switching technique with an elevation of 75◦ .
within the lowest 300 m of the boundary layer (BL). The cur-         More information about the remote sensing measurements
rent analysis utilizes the cloud droplet number concentration        can be found in Ramelli et al. (2021a).
and liquid water content (LWC) measurements. Note that the
LWC is calculated based on the size distribution of the cloud        2.2     Aerosol hygroscopicity
droplets using a liquid water density (ρw ) of 1000 kg m−3
and is therefore dominated by large cloud particles.
                                                                     The aerosol hygroscopicity parameter, κ, encompasses the
                                                                     impact of particle chemical composition on its subsatu-

Atmos. Chem. Phys., 21, 10993–11012, 2021                                              https://doi.org/10.5194/acp-21-10993-2021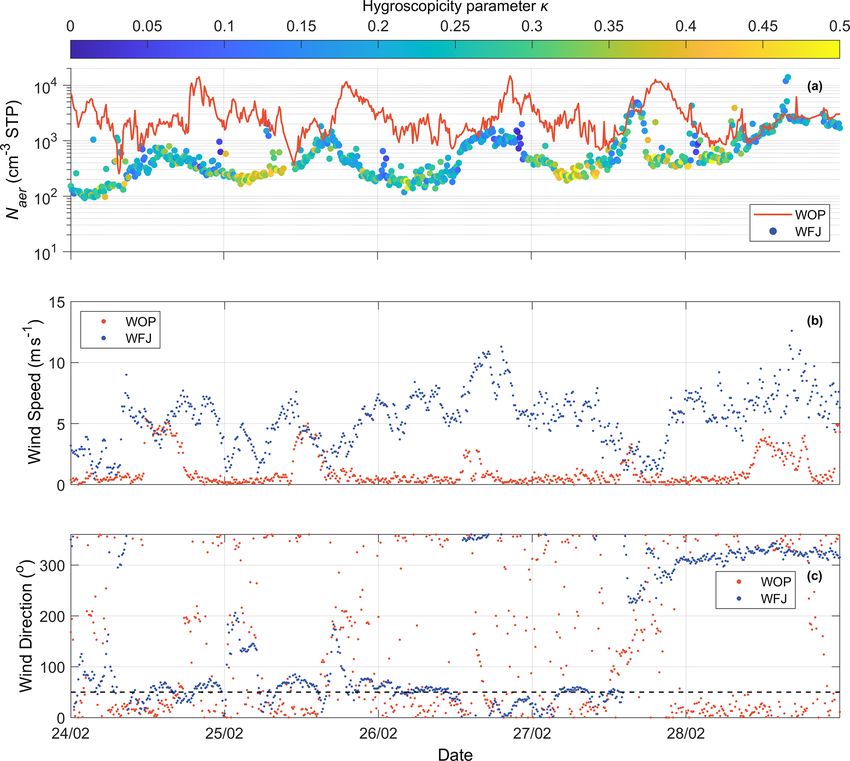
P. Georgakaki et al.: On the drivers of droplet variability in alpine mixed-phase clouds                                     10997

rated water uptake and CCN activity (Petters and Kreiden-          2.3   Cloud droplet number and cloud maximum
weis, 2007). Here, we determine κ similarly to the approach              supersaturation
of Moore et al. (2011), Jurányi et al. (2011), Lathem et
al. (2013), Kalkavouras et al. (2019), Kacarab et al. (2020),      Here, we apply adiabatic cloud parcel theory to the obser-
and others by combining the CCN measurements with the              vational datasets to determine the maximum in-cloud super-
SMPS aerosol size distribution data as follows. For each           saturation (Smax ) and cloud droplet number (Nd ) that would
SMPS scan, the particle size distribution is integrated back-      form over both measurement sites throughout the observation
ward starting from the bin with the largest-size particles,        period. Droplet calculations are carried out with the physi-
which corresponds to the CCN with the lowest critical super-       cally based aerosol activation parameterization of Nenes and
saturation, Scr . We then successively add bins with smaller       Seinfeld (2003), with extensions introduced by Fountoukis
and smaller diameters until the aerosol number matches the         and Nenes (2005), Barahona et al. (2010) and Morales Betan-
CCN concentration observed for the same time period as the         court and Nenes (2014). Each Nd calculation requires knowl-
SMPS scan. The particles in the smallest size bin, which we        edge of the observed pressure, temperature, vertical winds,
call critical dry diameter, Dcr , correspond to the CCN with       aerosol size distribution, and hygroscopicity. For the WFJ
the highest Scr possible, which is the instrument supersatu-       site, all data are available as described in the sections above.
ration (SS). From Dcr and SS we determine κ from Köhler            For the WOP site, CCN (hence hygroscopicity) data are not
theory (Petters and Kreidenweis, 2007) assuming the particle       available so we carry out Nd calculations at two κ values, 0.1
chemical composition is internally mixed:                          and 0.25, which are the upper and the lower limit determined
                                                                   from the WFJ analysis (Sect. 3.1). The ability to reproduce
         4A3                                                       observed cloud droplet number concentrations (Sect. 3.2.1)
κ=                ,                                         (1)
        3 SS2
     27Dcr                                                         further supports the selection of these values.
                                                                      The wind lidar measurements conducted at WOP
where A = 4M    wσ
             RT ρw is the Kelvin parameter, in which Mw
                                                                   (Sect. 2.1.4) are used to determine the prevailing vertical ve-
(kg mol ) is the molar mass of water, σ (J m−2 ) is the sur-
        −1                                                         locities at both sites. Data extracted from the first bin of the
face tension of the solution droplet, R is the universal gas       lidar at 200 m a.g.l. are considered representative for WOP
constant, and T (K) is the ambient temperature. Here, we           as the wind lidar has no values very close to the ground,
assume the surface tension of the solution droplet is equal        while measurements extracted for 1100 m a.g.l. are used as a
to that of pure water (σ = σw ) by convention. The κ deter-        proxy for the vertical velocities at WFJ. The high-resolution
mined above represents the composition of particles with di-       wind lidar data are grouped by hour and each fitted to half-
ameter Dcr (large particles can have a different κ but still       Gaussian probability density functions (PDFs) with zero
activate given that their Scr is lower than the prevailing SS      mean and standard deviation σw . An hourly PDF of updraft
in the CCN chamber). This means that over the course of            velocities is provided in the Supplement as an example of
an hour, over which a full SS cycle is completed, κ is deter-      the calculation method we followed here (Fig. S2 in the Sup-
mined for a range of Dcr , which in our case were in the range     plement). Employing the “characteristic velocity” approach
of 50–200 nm (Sect. 3.1). This size-resolved κ information         of Morales and Nenes (2010), the PDF-averaged values of
provides insights on the possible origin and chemical com-         Nd and Smax are calculated by applying the parameterization
ponents of the aerosol, which is important given that there is     using a single characteristic velocity, w ∗ = 0.79σw . This ap-
no other measurement available to constrain chemical com-          proach has been shown to successfully predict cloud-scale
position during RACLETS. From κ, we infer an equivalent            values of Nd in field studies for cumulus and stratocumu-
organic mass fraction, εorg , assuming that the aerosol is com-    lus clouds (e.g., Conant et al., 2004; Meskhidze et al., 2005;
posed of an organic–inorganic mixture:                             Fountoukis et al., 2007; Kacarab et al., 2020). The droplet
                                                                   closure carried out in this study is also used to support the va-
         (κ − κi )                                                 lidity of this approach for alpine MPCs. To determine the σw
εorg =              ,                                       (2)
         (κo − κi )                                                values used in the closure study (Sect. 3.2.1), we isolated the
                                                                   segments of the wind lidar measurements that correspond to
where κi = 0.6 and κo = 0.1 are characteristic hygroscopic-        each cloud event observed by the HoloBalloon platform. The
ity values for the inorganic fraction of an aerosol (represented   subsequent fitting of the measured updraft velocities to half-
by ammonium sulfate) and organic aerosol, respectively (Pet-       Gaussian PDFs revealed a σw value representative of each
ters and Kreidenweis, 2007; Wang et al., 2008; Dusek et al.,       cloud. The accuracy of the wind lidar products is affected
2010). Note that these values for a continental aerosol are        by precipitation, as the measured updraft velocities might be
supported by observations and analyses (e.g., Andreae and          masked by the terminal fall velocity of the hydrometeors. We
Rosenfeld, 2008; Rose et al., 2008; Pringle et al., 2010).         therefore use disdrometer measurements to identify and ex-
                                                                   clude precipitating periods from our analysis. Aiming to ex-
                                                                   amine how Nd responds to different vertical velocity–aerosol
                                                                   situations, potential Nd for both sites are calculated at 10 val-

https://doi.org/10.5194/acp-21-10993-2021                                        Atmos. Chem. Phys., 21, 10993–11012, 2021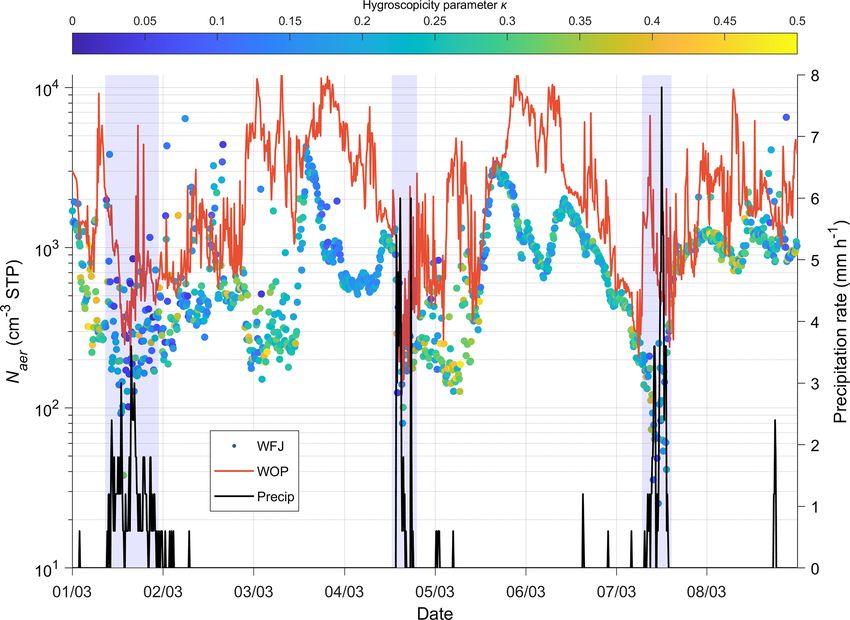
10998                              P. Georgakaki et al.: On the drivers of droplet variability in alpine mixed-phase clouds

ues of σw between 0.1 and 1.0 m s−1 (Sect. 3.2.4). Note that       of less hygroscopic aerosols observed in the afternoon. The
we use the term “potential” droplet number throughout this         situation reverses during nighttime, when cold air descends
study, as its calculation is performed regardless of the actual    from the slopes (downslope winds) and flows out of the val-
existence of clouds over the measurement sites.                    ley (down-valley winds) due to the radiative cooling of the
                                                                   surface. The less polluted air observed during the early hours
                                                                   of the day before sunrise indicates that the WFJ station re-
3     Results and discussion                                       mained in the free troposphere (FT), with lower Naer and
                                                                   more aged air (i.e., larger κ) with a more prominent accumu-
3.1    Particle number, CCN concentration, and κ at                lation mode (Baltensperger et al., 1997; Seinfeld and Pandis,
       WOP and WFJ                                                 2006, pp. 376–378; Kammermann et al., 2010; Jurányi et al.,
                                                                   2011).
The total aerosol number concentration (Naer ) time series (in-       Another consideration is that the upslope flow that “con-
tegrated aerosol size distribution) together with horizontal       nects” the valley and the mountain-top site may not only
wind speed and direction measurements are depicted for both        be driven by thermal convection but also from mechanically
sites in Fig. 1. The Naer data points of WFJ are colored by κ      forced lifting. The latter mechanism is caused by the deflec-
(Sect. 2.2), while the orange solid line is used as a trace for    tion of strong winds by a steep mountain slope and it can
WOP time series, as κ was not determined for the site owing        be of great importance depending mainly on the height of
to a lack of corresponding CCN measurements. Aiming to in-         the mountain and the mean speed of the wind (Kleissl et
terpret the aerosol variations and the potential differences ob-   al., 2007). The local wind effects can be further interpreted
served between valley and high-altitude measurements, the          looking at the MeteoSwiss time series of wind speed and di-
two-week period of interest is divided into two different sub-     rection for both stations (Fig. 1b, c). Wind measurements at
periods. During 24 and 28 February, a high-pressure system         the WFJ station recorded a strong wind speed reaching up
was dominant over Europe with clear skies and elevated tem-        to ∼ 11 m s−1 from the easterly–northeasterly directions be-
peratures (Fig. S3 in the Supplement). During this first sub-      tween 24 and 28 February. The wind direction measured at
period, the Naer varies considerably and tends to follow a di-     WFJ coincides with the relative location of WOP site (see
urnal cycle that anticorrelates between the two sites (Fig. 1a).   black dashed line in Fig. 1c). The steep orography over the
As expected, most of the time the concentrations at WOP are        Alps would transform part of this strong horizontal motion
elevated with respect to WFJ because the Naer in the valley        into vertical motion and transport air from WOP to WFJ, as
is influenced by local sources, which during this time of the      seen in other alpine locations like Jungfraujoch (e.g., Hoyle
year includes emissions from biomass burning (BB) (Lanz            et al., 2016). A detailed analysis, however, is out of the scope
et al., 2010). Naer at WOP peaks in the evening, reaching up       of this study.
to ∼ 104 cm−3 , presumably because of BB emissions in the             Similar to Fig. 1a, Fig. 2 illustrates the Naer time se-
valley, which seem to stop around midnight (Fig. 1a). Up to        ries measured at both sites along with the precipitation rate
2 orders of magnitude lower Naer is measured at the same           recorded by the MeteoSwiss station at WFJ during the time
time at the WFJ site. In the afternoon, Naer at WFJ approach       period between 1 and 8 March 2019. Meteorological obser-
those observed at WOP, indicating that the two sites are pos-      vations show the pressure and temperature dropping (Fig. S3
sibly experiencing similar air masses. The κ for WFJ seems         in the Supplement) together with intense snow and rain
to follow a clear temporal pattern as well, ranging between        events, associated with the passage of cold fronts over the
∼ 0.1–0.4 with a minimum in the afternoon when the two             region. Three intense precipitation events are visible in our
sites experience the same air masses. Low Naer values are ac-      dataset occurring on 1, 4, and 7 March 2019 (blue shaded
companied by higher κ, while at higher Naer conditions less        areas in Fig. 2) creating up to 7.8 mm h−1 of precipitation.
hygroscopic aerosols are recorded (Fig. 1a).                       The most intense drop in Naer is seen to occur during and
   The above diurnal cycles and their relationships can be         after the precipitation events, with the aerosol concentrations
understood in terms of BL dynamics typically occurring in          dropping to less than 200 cm−3 (100 cm−3 ) at WOP (WFJ).
mountain–valley systems (Chow et al., 2013). During day-           This is not the case for the last event, where a big “spike” of
time under clear sky conditions, the slopes and the valley         Naer is observed before the precipitation event in the WOP
itself are warmed by solar radiation, causing rising of the        time series, which is in contrast with the concurrent sharp
BL and additionally the production of buoyant air masses           decrease in Naer (< 20 cm−3 ) observed at WFJ. This could
that rise up the slope toward the summit (through “upslope”        be an indication of a local source affecting the Naer recorded
and “up-valley” winds) (Okamoto and Tanimoto, 2016). This          in the valley. During dry weather conditions, we can notice
hypothesis can be further supported by the fair weather            again the aerosol time series correlating during the afternoon
recorded by the weather station at WFJ until 28 February           and anticorrelating later in the evening and early morning
(Fig. S3 in the Supplement). The buoyant upslope flow could        hours. On 3 March, a steep increase in Naer is seen in the
then transport polluted air masses originating from the BL         WFJ time series reaching up to ∼ 4000 cm−3 , which is fol-
of the valley up to the WFJ site, elevating the concentrations     lowed by a period of several hours with low hygroscopicity

Atmos. Chem. Phys., 21, 10993–11012, 2021                                          https://doi.org/10.5194/acp-21-10993-2021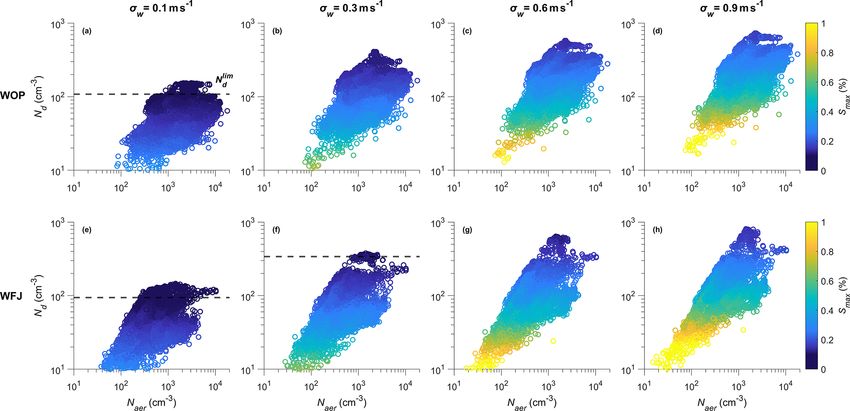
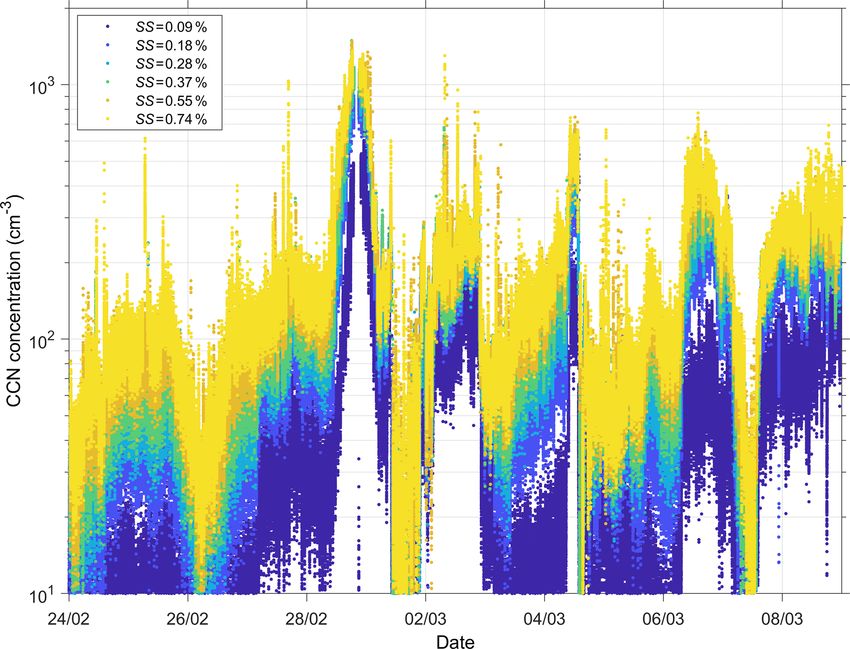
P. Georgakaki et al.: On the drivers of droplet variability in alpine mixed-phase clouds                                          10999

Figure 1. (a) Naer under standard temperature and pressure conditions (cm−3 STP) at WOP (orange line) and at WFJ (circles colored by
κ), (b) wind speed (m s−1 ), and (c) wind direction (in degrees) obtained from the MeteoSwiss observation stations at WFJ (blue dots) and
Davos (orange dots) between 24 and 28 February 2019. The black dashed line indicates the relative direction of WOP to WFJ. Each day is
referenced to 00:00 UTC.

values (κ < 0.2) indicating once more the influence of freshly         most of the winter. According to Fig. 3, the observed CCN
emitted particles arriving at WFJ from the BL of lower alti-           concentrations tend to be low (∼ 102 cm−3 ) even at the high-
tudes. Additionally, between 1 and 8 March, the diurnal cy-            est SS (0.74 %), which is expected given that WFJ is a remote
cle of particle hygroscopicity is less pronounced compared             continental measurement site with CCN concentrations that
to the period between 24 and 28 February. Especially on 1              are typical of free tropospheric continental air (Jurányi et al.,
and 7 March, less hygroscopic aerosols (κ < 0.1) – hence               2010, 2011; Hoyle et al., 2016; Fanourgakis et al., 2019).
less effective CCN particles – are found at WFJ (Fig. 2). This         This is again in line with the measured monthly median val-
is likely from either precipitation removing aerosol particles         ues of CCN (at SS = 0.71 %) reported by Jurányi et al. (2011)
through diffusive and impaction processes or the removal of            being equal to 79.1 and 143.4 cm−3 for February and March
aerosol particles that first activate and then are removed by          2009, respectively. Some local CCN spikes are, however,
precipitation. Also, because Naer drops, fresh local emissions         recorded during the evening of 28 February and at the begin-
become more important, further justifying the predominance             ning of March (e.g., on 2, 4 and 6 March), with the observed
of low κ values.                                                       values of CCN reaching up to 650 cm−3 at SS = 0.09 % (low-
   Figure 3 presents the CCN number concentration time se-             est SS) and 1361 cm−3 at SS = 0.74 % (highest SS). Consid-
ries measured at ambient conditions at WFJ for all six super-          ering that WFJ is a site frequently located in the FT, sudden
saturations. Throughout the two-week measurement period                fluctuations in the CCN concentrations could be related to
the recorded CCN number concentrations do not seem to fol-             the vertical transport of freshly emitted particles (e.g., wood
low a clear temporal pattern. The absence of a diurnal cycle           burning or vehicle emissions) from the valley floor in Davos.
in CCN properties measured at Jungfraujoch during winter               It is also worth noting that some aerosol spikes observed on
was also pointed out in the study by Jurányi et al. (2011) be-         the 3 March (∼ 3350 cm−3 ) and the 5 March (∼ 2100 cm−3 )
cause the site is mainly in free tropospheric conditions during        in the WFJ time series (Fig. 2) are not accompanied by a cor-

https://doi.org/10.5194/acp-21-10993-2021                                             Atmos. Chem. Phys., 21, 10993–11012, 2021
11000                                P. Georgakaki et al.: On the drivers of droplet variability in alpine mixed-phase clouds

Figure 2. Naer (cm−3 STP) at WOP (orange line) and at WFJ (circles colored by κ). The black solid line represents the precipitation rate
(mm h−1 ) recorded from the MeteoSwiss observation station for each 10 min interval at WFJ between 1 and 8 March 2019. The blue shaded
areas represent the periods when precipitation recorded at the WFJ site is most intense.

Figure 3. Time series of in situ CCN number concentrations (cm−3 ) at WFJ for different levels of supersaturation (SS) with respect to water
between 24 February and 8 March 2019.

Atmos. Chem. Phys., 21, 10993–11012, 2021                                                 https://doi.org/10.5194/acp-21-10993-2021
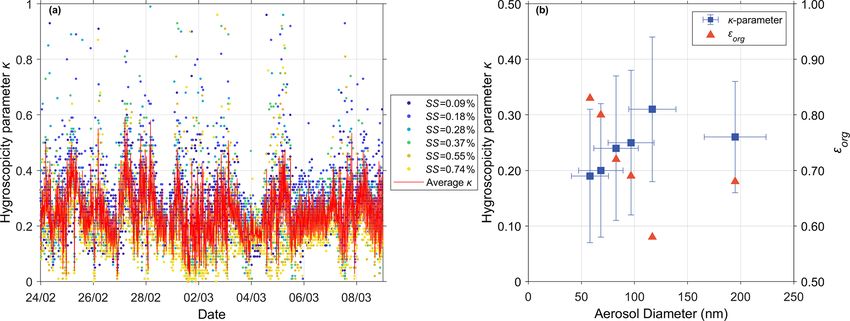
P. Georgakaki et al.: On the drivers of droplet variability in alpine mixed-phase clouds                                     11001

Table 2. Average κ and Dcr values at WFJ for each SS measured          The hygroscopicity parameter κ along with the inferred
between 24 February and 8 March 2019. Uncertainty for each value    εorg (Eq. 2) are shown in Fig. 4b as a function of particle
is expressed by the standard deviation.                             size. Compared to smaller particles, the higher κ of larger
                                                                    particles (> 100 nm) is consistent with them being more aged
            SS (%)          κmean          Dcr,mean                 and with a lower fraction of organics. The smaller particles
            0.09      0.26 ± 0.10    193.54 ± 29.58                 are possibly enriched in organic species, which is consistent
            0.18      0.31 ± 0.13    116.80 ± 22.20                 with the notion that air masses in the valley can contain large
            0.28      0.25 ± 0.13     96.69 ± 21.62                 amounts of freshly emitted BB smoke with lower κ. Aerosol
            0.37      0.24 ± 0.13     82.67 ± 20.93                 particles in the FT are considerably more aged (Seinfeld and
            0.55      0.20 ± 0.12     68.30 ± 20.95                 Pandis, 2006, pp. 376–378) and exhibit higher values of κ
            0.74      0.19 ± 0.11     58.11 ± 17.54                 and consequently lower values of εorg . The chemical com-
                                                                    position of sub-100 nm particulate matter was therefore pre-
                                                                    sumably dominated by organic material transported from the
responding peak in the CCN time series. This indicates the          valley, while the higher κ values characterizing the larger
presence of small aerosol particles that activate above 0.74 %      particles are consistent with the more aged character of free
supersaturation (i.e., particles with a diameter smaller than       tropospheric aerosols (e.g., Jurányi et al., 2011). The higher
∼ 25 nm). This case could also be associated with new parti-        εorg inferred for the smaller particles suggests that mixing be-
cle formation (NPF) events. A previous study by Herrmann            tween fresh emissions in the valley and the free tropospheric
et al. (2015) reported the aerosol number size distribution         aerosols might also be taking place at WFJ.
at Jungfraujoch over a 6-year period indicating that NPF was
observed during 14.5 % of the time without a seasonal prefer-       3.2     Droplet formation in the alpine region
ence. Tröstl et al. (2016) also showed that NPF significantly
adds to the total aerosol concentration at Jungfraujoch and is      3.2.1    Method evaluation against direct observations
favored only under perturbed FT conditions (i.e., BL injec-
tions). Finally, during the three intense precipitation events      During the RACLETS campaign, planar and dendritic ice
(on 1, 4 and 7 March) we can identify again that the wet re-        particles were collected from supercooled clouds at WFJ
moval of the more hygroscopic aerosols (Fig. 2) suppresses          aiming to examine their refreezing ability. A detailed descrip-
the presence of cloud-activating particles, at times depleting      tion of the sampling methodology can be found in Mignani
the atmosphere almost completely from CCN (Fig. 3). This            et al. (2019). Between 1 and 7 March, images of single den-
is clearly shown on 1 and 7 March, when the CCN number              drites were taken and analyzed visually for the degree of rim-
measured at 0.74 % supersaturation drops below 10 cm−3 ,            ing (Fig. S4 in the Supplement). The estimated riming degree
which is extremely low for BL concentrations.                       varies from 1 (lightly rimed) to 4 (heavily rimed) following
   The aerosol hygroscopicity parameter derived from all            the categorization of Mosimann et al. (1994). Some represen-
CCN data collected between 24 February and 8 March is pre-          tative images of each measured riming degree are shown in
sented in Fig. 4a. The red solid line represents the hourly av-     Fig. S4b in the Supplement. Although images were captured
eraged hygroscopicity values over one complete instrument           intermittently, they were taken within all three intense pre-
supersaturation cycle. The hygroscopic properties of the par-       cipitating events occurring during the period of interest (blue
ticles at WFJ vary as a function of supersaturation, exhibiting     shaded areas in Fig. 2). All dendrites captured were at least
on average lower values (∼ 0.1) at high SS and higher values        lightly rimed (i.e., riming degree = 1), which provides direct
(∼ 0.3) at the lower SS. Since the supersaturation inversely        evidence for the co-existence of supercooled droplets and ice
depends on particle size, Fig. 4a indicates that the hygroscop-     in clouds. Except the indirect evidence of the presence of
icity of the particles drops by almost 60 % as the particles are    MPCs over WFJ, Fig. 5 provides an overview of the direct
getting smaller (i.e., as the supersaturation increases). Table 2   microphysical measurements carried out by the HoloBalloon
summarizes the mean values of κ and Dcr and their standard          at WOP (Sect. 2.1.3). Three cloud events are sampled dur-
deviations, as calculated for each measured SS. The anticor-        ing 7 and 8 March, a more detailed description of which
relation seen between the instrument SS and Dcr is reason-          can be found in Ramelli et al. (2021a, b). The observed low-
able if we consider that the latter represents the minimum ac-      level clouds are likely produced by orographic lifting when
tivation diameter in a population of particles; therefore, only     the low-level flow is forced to ascent over the local topog-
the particles with a Dcr > 193.54 nm are able to activate into      raphy from Klosters to WOP producing local updrafts and
cloud droplets at low SS values (0.09 %). The hourly aver-          thus water supersaturated conditions. The cloud LWC mea-
aged κ at each SS slot falls within a range of ∼ 0.2 and ∼ 0.3,     surements from the holographic imager display significant
which is a representative value of continental aerosols (An-        temporal variability that is also related to variations in the
dreae and Rosenfeld, 2008; Rose et al., 2008).                      altitude of the tethered balloon system, as it tends to fol-
                                                                    low an adiabatic profile (Fig. 5a, b). Deviations from the
                                                                    adiabatic LWC profile are likely caused by entrainment of

https://doi.org/10.5194/acp-21-10993-2021                                          Atmos. Chem. Phys., 21, 10993–11012, 2021
11002 P. Georgakaki et al.: On the drivers of droplet variability in alpine mixed-phase clouds Figure 4. (a) Time series of the hygroscopicity parameter κ at WFJ at different levels of SS (0.09 %–0.74 %) throughout the period of interest. The red solid line indicates the hourly averaged κ time series over a complete SS cycle. (b) Size-resolved aerosol hygroscopicity (blue squares) and the respective εorg (orange triangles) calculated for the WFJ site. dry air within the low-level clouds. During the mixed-phase brought precipitation (Ramelli et al., 2021b). During the pas- conditions recorded on 8 March (Fig. 5b), such deviations sage of the cloud system, the in situ measurements collected could also be attributed to the depletion of Nd through riming at WOP revealed the presence of a persistent low-level feeder and depositional growth. These two processes are frequently cloud confined to the lowest 300 m of the cloud. The mixed- found to enhance orographic precipitation in feeder clouds. phase low-level cloud that is shown in Fig. 5d turned into an Indeed, a large fraction of rimed ice particles and graupel ice-dominated low-level cloud after 18:00 UTC (not shown). were observed that day with HOLIMO between 17:00 and Throughout this event, Nd seems to range between ∼ 100– 17:40 UTC (Ramelli et al., 2021b). Throughout the two-day 350 cm−3 (Fig. 5d), while the observed ICNC was in the dataset presented in Fig. 5, the HoloBalloon system samples range of ∼ 1–4 L−1 (see Fig. 6b in Ramelli et al., 2021b). at altitudes lower than 300 m a.g.l., providing observations According to Fig. 5e and f, low Naer (< 103 cm−3 ) that are representative of BL conditions. and highly variable σw values (∼ 4 times higher σw af- The observed Nd time series collected at WOP are il- ter 17:00 UTC) are representative of the period throughout lustrated in Fig. 5c and d. The measurements correspond- which the first cloud formed, while up to 4 times higher Naer ing to LWC < 0.05 g m−3 are filtered out from the analy- is observed during the following two cloud events, with rel- sis, assuming that they do not effectively capture in-cloud atively low σw values characterizing the second cloud com- conditions. A similar criterion for LWC was also applied in pared to the third one. On 8 March, the disdrometer recorded Lloyd et al. (2015) to determine the periods when clouds rainfall over WOP, starting a few minutes after the develop- were present over the alpine station of Jungfraujoch. Since ment of the observed cloud system, which is reflected in the the measured cloud properties have finer resolution (10–20 s) removal of updraft velocity measurements after 16:15 UTC than the predicted ones, the observed dataset is averaged (Fig. 5f). Note that the concentration measurements pre- every 2 min. On 7 March, the balloon-borne measurements sented in Fig. 5 correspond to ambient temperature and pres- were taken in a post-frontal air mass (i.e., passage of a cold sure conditions. The contrasted aerosol and vertical veloc- front in the morning) and indicated the formation of two low- ity regimes, in which the observed clouds are formed, offer level liquid layers (Fig. 5c) over WOP, which is attributed a great opportunity to test how the proposed methodology to low-level flow blocking (Ramelli et al., 2021a). Note that performs under a wide range of aerosol and velocity con- small droplets (< 6 µm) cannot be detected by HOLIMO ditions. Indeed, the mean cloud droplet diameters exhibit a (Sect. 2.3.1) and therefore the reported Nd should be consid- wide range of values, which for WOP range between 10 and ered a lower estimate. However, the influence of small cloud 17 µm on 7 March and 8 to 12 µm on 8 March (not shown). droplets on the reported LWC is minor, since the contribu- The Nd closure performed for the three cloud events ob- tion of the larger cloud droplets dominates. During the first served over WOP during the last two days of the period of cloud event, an Nd of up to ∼ 100 cm−3 was recorded, while interest is presented in Fig. 6. Note that the predicted Nd slightly increased Nd in the range of ∼ 50–120 cm−3 is visi- is evaluated using the updraft velocity PDF calculated for ble during the second cloud event. On 8 March, a small-scale each cloud period, rather than the hourly σw data shown in disturbance passed the measurement location Davos, which Fig. 5e and 5f (Sect. 2.3). Owing to the precipitation occur- Atmos. Chem. Phys., 21, 10993–11012, 2021 https://doi.org/10.5194/acp-21-10993-2021
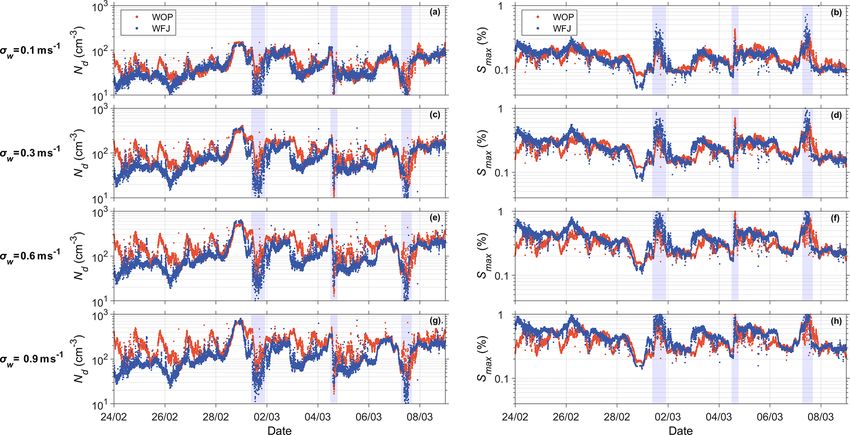
P. Georgakaki et al.: On the drivers of droplet variability in alpine mixed-phase clouds                                              11003

Figure 5. Time series of 7 March (a, c, e) and 8 March (b, d, f) showing the vertical profiles of the LWC (g m−3 ) in panels (a) and (b), the
filtered (black lines) and the 2 min averaged (cyan circles) Nd (cm−3 ) measured at WOP with the HoloBalloon platform in panels (c) and
(d), and the corresponding SMPS aerosol concentrations (cm−3 ) (orange line) and the hourly wind lidar derived σw values (m s−1 ) (black
line) in panels (e) and (f). Error bars represent the standard deviation of Nd during the averaging period.

rence during 8 March, we focused on the 15 min time pe-                  sure study corresponds to the measured Nd averaging time
riod between 16:00 and 16:15 UTC to determine a relevant                 period and, therefore, we do not expect the degree of closure
updraft velocity from the wind lidar measurements repre-                 to be affected.
sentative of Cloud 3. The Gaussian fit to the updraft veloc-                The good agreement between measurements and predic-
ities gave a distribution with σw = 0.24 and 0.16 m s−1 for              tions – even under mixed-phase conditions – reveals that pro-
the first two clouds present on 7 March and σw = 0.37 m s−1              cesses like condensation freezing and the removal of cloud
for the cloud system observed on 8 March. The w∗ values                  droplets through riming and collision coalescence do not dis-
used to apply the droplet parameterization are therefore be-             turb the Smax and hence the Nd predicted by the parameter-
tween 0.1–0.4 m s−1 (Sect. 2.3). Figure 6 indicates that the             ization, at least for the given clouds. That said, it is known
parameterization predictions agree to within 25 % with the in            that pre-existing liquid and ice hydrometeors falling to the
situ cloud droplet number concentrations. A similar degree of            activation region of clouds can deplete the supersaturation
closure is frequently obtained for other in situ studies (e.g.,          affecting the number of the activated droplets; such supersat-
Meskhidze et al., 2005; Fountoukis et al., 2007; Morales et              uration depletion effects can be included in the droplet ac-
al., 2011; Kacarab et al., 2020); however, these focused on              tivation parameterization (Sud et al., 2013; Barahona et al.,
liquid-phase clouds. Here we show that the methodology can               2014) if needed. Furthermore, the parameterization predic-
also work for MPCs (i.e., Cloud 3 in Fig. 6). It is important            tions indicate that the best fit is achieved using a κ of ∼ 0.1
to note here that part of the discrepancy between prediction             (Fig. 6). Naer at WOP is likely dominated by lower κ values,
and measurement could also be related to the underestima-                indicating that the particles are getting richer in organic ma-
tion of the measured Nd (Sect. 2.1.3). Hence, an even better             terial, compared to WFJ, which supports the aerosol analysis
degree of closure is likely. Also, the derived σw value used to          carried out in Sect. 3.1. These results are robust, indicating
calculate the predicted Nd for Cloud 1 might be biased low               that for non-precipitating BL clouds the proposed calculation
by the lower σw values recorded before 17:00 UTC (Fig. 5e).              method captures cloud droplet formation at WOP and WFJ.
Nevertheless, the updraft averaging used in the droplet clo-

https://doi.org/10.5194/acp-21-10993-2021                                               Atmos. Chem. Phys., 21, 10993–11012, 2021
11004                                 P. Georgakaki et al.: On the drivers of droplet variability in alpine mixed-phase clouds

                                                                       draft velocities that are indicative of the observed σw range
                                                                       (Sect. 3.4), namely 0.1, 0.3, 0.6, and 0.9 m s−1 . The same
                                                                       behavior is seen for all four σw values selected while, as ex-
                                                                       pected, larger values of Nd and Smax are achieved at higher
                                                                       σw . During the first days of the period of interest, the calcu-
                                                                       lated Nd at WOP (Fig. 7a, c, e, g) is up to 10 times larger
                                                                       than at WFJ, despite the lower κ values characterizing its
                                                                       aerosol population. WFJ tends to have lower Nd due to the
                                                                       lower Naer recorded. It is also important to highlight the an-
                                                                       ticorrelation between Smax and Nd values arising from the
                                                                       nonlinear response of droplet number and maximum cloud
                                                                       parcel supersaturation to fluctuations in the available aerosol
                                                                       and CCN concentrations (Reutter et al., 2009; Bougiatioti et
                                                                       al., 2016; Kalkavouras et al., 2019). Higher Naer elevates the
                                                                       potential Nd values. The available condensable water is then
                                                                       shared among more growing droplets, depleting the supersat-
                                                                       uration. Even more interesting is the fact that until 28 Febru-
                                                                       ary the calculated Nd time series at WOP show a pronounced
Figure 6. Comparison between average predicted Nd (cm−3 ) with         diurnal cycle, similar to the total Naer time series (Sect. 3.1).
the droplet activation parameterization and observed Nd (cm−3 )        Lower Nd values are visible after midnight, presumably due
during the three cloud events on 7 March (blue and cyan circles) and   to a paucity of BB activities in the valley. Droplet concentra-
8 March (orange circles) 2019. For all three cloud events, droplet     tions at WFJ do not follow a diurnal pattern in contrast to the
closure is performed assuming a κ parameter of 0.1 (filled circles)    aerosol data (Fig. 1a). However, the activation fraction (i.e.,
and 0.25 (empty circles). The error bars represent the standard de-    Nd /Naer ) at WFJ displays a clear diurnal variability until the
viation of Nd during each cloud event.                                 end of February (Fig. S5 in the Supplement).
                                                                          Through comparison with the MeteoSwiss precipitation
                                                                       measurements at WFJ (Fig. 2), it should be emphasized again
3.2.2   Potential droplet formation at WOP and WFJ                     that during the second sub-period of interest the occurrence
                                                                       of precipitation is followed by a depression in Nd (Fig. 7a,
According to the methodology proposed in Sect. 2.3, using              c, e, g) and a concurrent increase in Smax reaching up to
the in situ measured Naer , the estimated chemical composi-            ∼ 1 % (Fig. 7b, d, f, h). Especially at WFJ, Nd drops almost
tion, and the observed updraft velocity range, we determine            to zero on 1, 4, and 7 March, when precipitation is most in-
the potential Nd and Smax that would form over both mea-               tense (blue shaded areas in Figs. 2 and 7). These trends are
surement sites. At WOP, clouds are formed locally due to the           related to the washout of hygroscopic material observed at
local topography (Ramelli et al., 2021a, b), supporting the            WFJ (Fig. 2) leading to the extremely low CCN concentra-
use of surface measured aerosol to estimate the potential Nd           tions (∼ 10 cm−3 ) measured during these 3 d (Fig. 3). During
over this site. This is further supported by the good agree-           the first two intense precipitation events, the Naer is relatively
ment between predicted and measured Nd (Sect. 3.2.1). A                high compared to the third event, with concentrations reach-
similar closure study could not be repeated for WFJ owing to           ing up to ∼ 300 cm−3 at both stations (Fig. 2). The small ac-
a lack of in situ data; however, the air masses sampled (i.e.,         tivation fraction (Fig. S5 in the Supplement) combined with
those given as input to the parameterization) are often in the         the high Smax values indicate once more that small particles
FT, so they should contain the same aerosol as the one used to         that activate into cloud droplets only above 0.3 % to 0.5 %
form the clouds. This does not apply under perturbed FT con-           of supersaturation are present at both stations. However, this
ditions, which are, however, accompanied by the presence of            behavior is not seen on 7 March at WFJ.
less hygroscopic particles over the mountain-top site and are
less likely related to cloud formation (Sect. 3.1). Here we as-        3.2.3   Droplet behavior under velocity-limited
sume a κ of 0.25 to calculate the potential droplets for WFJ                   conditions
according to our CCN-derived hygroscopicity values (Ta-
ble 2) and given that Smax usually ranges between ∼ 0.1 %–             Combining the potential Nd and the corresponding Smax with
0.3 %. In estimating the potential droplets for WOP, we use            the Naer data yields important information on whether clouds
a κ of 0.1 given that the aerosol is likely strongly enriched          are sensitive to vertical velocity or aerosol changes. Cloud
in organics; the good degree of closure supports its selection         studies (e.g., Jensen and Charlson, 1984; Twomey, 1993;
(Sect. 3.2.1). Figure 7 depicts the potential Nd and the cor-          Ghan et al., 1998; Nenes et al., 2001; Reutter et al., 2009)
responding Smax time series calculated at ambient conditions           have long recognized the role of water vapor competition on
for WOP (orange dots) and WFJ (blue dots) using cloud up-              droplet formation, while the success of mechanistic parame-

Atmos. Chem. Phys., 21, 10993–11012, 2021                                               https://doi.org/10.5194/acp-21-10993-2021
P. Georgakaki et al.: On the drivers of droplet variability in alpine mixed-phase clouds 11005 Figure 7. Calculated time series of Nd (cm−3 ) (left panels) and Smax (%) (right panels) for updraft velocities of σw = 0.1 m s−1 in panels (a) and (b), 0.3 m s−1 in panels (c) and (d), 0.6 m s−1 in panels (e) and (f), and 0.9 m s−1 in panels (g) and (h) during the period of interest at WOP (orange dots) and WFJ (blue dots). The blue shaded areas represent the intense precipitating periods shown in Fig. 2. terizations for climate models relies on the ability to capture Building upon these findings, we used the calculated Smax this effect accurately (e.g., Ghan et al., 2011; Morales Betan- as an indicator for aerosol- or velocity-limited conditions court and Nenes, 2014). Twomey (1993) discusses this con- prevailing over the Alps. The horizontal dashed lines plotted ceptually and states that competition may be fierce enough in Fig. 8a, e, and f illustrate a plateau, where Smax < 0.1 % to reduce Nd with increasing Naer , which was later demon- and the modulation of the Nd is driven mostly by the cloud strated by Ghan et al. (1998) to occur for mixtures of sul- dynamics, hence the updraft velocity variability, rather than fate aerosol and sea spray. Reutter et al. (2009) did not fo- aerosol variations. This plateau is termed the limiting droplet cus on such extreme conditions of water vapor competition, number (Ndlim ), following Kacarab et al. (2020), and is essen- but rather situations that are consistent with dominance of tially the maximum Nd that can be formed under these verti- anthropogenic pollution in clouds. Indeed, for high Naer , cal velocity conditions. The vertical-velocity regime is there- droplets in clouds become insensitive to aerosol perturba- fore strictly defined as whenever Smax drops below 0.1 % and tions, giving rise to the so-called “velocity-limited cloud for- Nd approaches Ndlim . Conversely, when Smax in clouds ex- mation”. Figure 8 displays this by presenting the response ceeds 0.1 %, droplet formation in the BL of both measure- of the calculated Nd to changes in Naer for a representa- ment sites is in the aerosol-limited regime, as the Smax is high tive range of updraft velocities prevailing over WOP (top enough for clouds to be responsive to aerosol changes. panels) and WFJ (bottom panels). The data are colored by An alternative way of examining the Ndlim response to the respective Smax achieved in cloudy updrafts. For low σw changes in σw is shown in Fig. 9. It should be noted that the values (Fig. 8a, d) we can identify that above an Naer of Ndlim values shown on this figure are determined by calcu- ∼ 300 cm−3 , the Nd at both stations reaches a plateau where lating the averaged Nd achieved whenever Smax < 0.1 % for it becomes insensitive to further aerosol changes. At WFJ, each examined σw value. At WOP, droplet formation is in the the same behavior is seen for intermediate σw values and velocity-limited regime only for low σw values, namely 0.1 Naer 1000 cm−3 (Fig. 8f). Kacarab et al. (2020) and Bougia- and 0.2 m s−1 , when the activated particles have more time tioti et al. (2020) examined a wide range of ambient size to deplete the gas phase and the Smax reached is that required distributions and proposed that clouds became velocity lim- to activate only the largest particles. At WFJ the prevailing ited when Smax dropped below 0.1 %. This reflects the in- dynamics create velocity-limited conditions even for more creasingly fierce competition for water vapor during droplet turbulent boundary layers when σw reaches up to 0.5 m s−1 . formation, which allows only a few particles to activate into Ndlim (cm−3 ) is linearly correlated with σw (m s−1 ), which cloud droplets. can be described as Ndlim = 1137.9σw − 17.1 (Fig. 9). As https://doi.org/10.5194/acp-21-10993-2021 Atmos. Chem. Phys., 21, 10993–11012, 2021
You can also read


