Stable water isotopes and accumulation rates in the Union Glacier region, Ellsworth Mountains, West Antarctica, over the last 35 years
←
→
Page content transcription
If your browser does not render page correctly, please read the page content below
The Cryosphere, 14, 881–904, 2020
https://doi.org/10.5194/tc-14-881-2020
© Author(s) 2020. This work is distributed under
the Creative Commons Attribution 4.0 License.

Stable water isotopes and accumulation rates in the Union Glacier
region, Ellsworth Mountains, West Antarctica, over the last 35 years
Kirstin Hoffmann1,2 , Francisco Fernandoy3 , Hanno Meyer2 , Elizabeth R. Thomas4 , Marcelo Aliaga3 ,
Dieter Tetzner4,5 , Johannes Freitag6 , Thomas Opel2,7 , Jorge Arigony-Neto8 , Christian Florian Göbel8 , Ricardo Jaña9 ,
Delia Rodríguez Oroz10 , Rebecca Tuckwell4 , Emily Ludlow4 , Joseph R. McConnell11 , and Christoph Schneider1
1 Geographisches   Institut, Humboldt-Universität zu Berlin, Unter den Linden 6, 10099 Berlin, Germany
2 Alfred  Wegener Institute, Helmholtz Centre for Polar and Marine Research, Research Unit Potsdam,
Telegrafenberg A45, 14473 Potsdam, Germany
3 Facultad de Ingeniería, Universidad Nacional Andrés Bello, Quillota 980, Viña del Mar, 2531015, Chile
4 Ice Dynamics and Paleoclimate, British Antarctic Survey, High Cross, Madingley Road, Cambridge, CB3 0ET, UK
5 Department of Earth Sciences, University of Cambridge, Downing Street, Cambridge, CB2 3EQ, UK
6 Alfred Wegener Institute, Helmholtz Centre for Polar and Marine Research, Am Alten Hafen 26,

27568 Bremerhaven, Germany
7 Department of Geography, Permafrost Laboratory, University of Sussex, Falmer, Brighton, BN1 9QJ, UK
8 Instituto de Oceanografia, Laboratório de Monitoramento da Criosfera, Universidade Federal do Rio Grande, Avenida Itália,

km 8, CEP 96203-900, Rio Grande, RS, Brazil
9 Departamento Científico, Instituto Antártico Chileno, Plaza Muñoz Gamero 1055, Punta Arenas, 6200965, Chile
10 Facultad de Ingeniería, Universidad del Desarrollo, Avenida Plaza 680, San Carlos de Apoquindo, Las Condes, Santiago,

7610658, Chile
11 Division of Hydrologic Sciences, Desert Research Institute, 2215 Raggio Parkway, Reno, NV 89512, USA

Correspondence: Kirstin Hoffmann (kirstin.hoffmann@awi.de)

Received: 8 August 2018 – Discussion started: 4 October 2018
Revised: 26 November 2019 – Accepted: 16 December 2019 – Published: 9 March 2020

Abstract. Antarctica is well known to be highly susceptible       source regions for the study site throughout the year. We
to atmospheric and oceanic warming. However, due to the           found that mean annual δ 18 O (δD) values in the UG region
lack of long-term and in situ meteorological observations,        are negatively correlated with sea ice concentrations (SICs)
little is known about the magnitude of the warming and the        in the northern Weddell Sea but not influenced by large-scale
meteorological conditions in the intersection region between      modes of climate variability such as the Southern Annular
the Antarctic Peninsula (AP), the West Antarctic Ice Sheet        Mode (SAM) and the El Niño–Southern Oscillation (ENSO).
(WAIS) and the East Antarctic Ice Sheet (EAIS). Here we           Only mean annual d-excess values show a weak positive cor-
present new stable water isotope data (δ 18 O, δD, d excess)      relation with the SAM.
and accumulation rates from firn cores in the Union Glacier          On average annual snow accumulation in the UG region
(UG) region, located in the Ellsworth Mountains at the north-     amounts to 0.245 m w.e. a−1 in 1980–2014 and has slightly
ern edge of the WAIS. The firn core stable oxygen isotopes        decreased during this period. It is only weakly related to sea
and the d excess exhibit no statistically significant trend for   ice conditions in the Weddell Sea sector and not correlated
the period 1980–2014, suggesting that regional changes in         with SAM and ENSO.
near-surface air temperature and moisture source variability         We conclude that neither the rapid warming nor the large
have been small during the last 35 years. Backward trajec-        increases in snow accumulation observed on the AP and in
tory modelling revealed the Weddell Sea sector, Coats Land        West Antarctica during the last decades have extended inland
and Dronning Maud Land (DML) to be the main moisture              to the Ellsworth Mountains. Hence, the UG region, although

Published by Copernicus Publications on behalf of the European Geosciences Union.
882                        K. Hoffmann et al.: Stable water isotopes and accumulation rates in the Union Glacier region

located at the northern edge of the WAIS and relatively close     Steig et al. (2009) reported slight but statistically significant
to the AP, exhibits rather stable climate characteristics simi-   warming in East Antarctica at a rate of +0.10 ± 0.07 ◦ C per
lar to those observed in East Antarctica.                         decade (1957–2006) similar to the continent-wide trend. A
                                                                  positive and significant near-surface air temperature trend
                                                                  has also been found for Dronning Maud Land (DML) for
                                                                  the last 100 years (Stenni et al., 2017) and in particular for
1   Introduction                                                  the period 1998–2016 (+1.15 ± 0.71 ◦ C per decade; Medley
                                                                  et al., 2018). Snowfall and accumulation rates on the EAIS
Antarctic temperature change has been a major research fo-        are usually considered to show no significant changes (Mon-
cus in the past decades. Despite the scarcity and short dura-     aghan et al., 2006) or clear overall trends due to the coun-
tion of the observations, it shows a contrasting regional pat-    terbalancing of increases and decreases in different regions
tern between the Antarctic Peninsula (AP), the West Antarc-       (van den Broeke et al., 2006; Schlosser et al., 2014; Alt-
tic Ice Sheet (WAIS) and the East Antarctic Ice Sheet (EAIS;      nau et al., 2015; Philippe et al., 2016). However, more re-
Stenni et al., 2017).                                             cent studies provide a different picture: based on an ice core
   Both the AP and the WAIS have experienced significant          from western DML, Medley et al. (2018) derived a signifi-
atmospheric and oceanic changes during recent decades.            cant increase in snowfall since the 1950s, which is unprece-
The WAIS is considered to be one of the fastest-warming           dented in the past two millennia. Furthermore, Medley and
regions on Earth based on the analysis of meteorological          Thomas (2019) show that snow accumulation over the EAIS
records (Steig et al., 2009; Bromwich et al., 2013) and ice       has steadily increased during the 20th century, despite a de-
cores (Steig et al., 2013; Stenni et al., 2017). Bromwich et      crease since 1979.
al. (2013) reported for central West Antarctica an increase in       Hence, there is no conclusive evidence about general
annual air temperature by more than 2 ◦ C since the end of the    trends in near-surface air temperature and accumulation rates
1950s. The rapid warming in West Antarctica at the end of         in Antarctica. In summary, the detection and assessment of
the last century is anomalous but seems to not be unprece-        trends in climate variables, such as air temperature and pre-
dented in the past 300 years (Thomas et al., 2013) and even       cipitation (accumulation), for the three Antarctic regions –
in the past two millennia (Steig et al., 2013), respectively.     AP, WAIS and EAIS – is challenging, due to the shortness
The significant increase in near-surface air temperatures is      of available instrumental records and the incompatibility be-
accompanied by regionally different trends in accumulation        tween climate model simulations and in situ observations
rates. Snow accumulation in coastal regions of the eastern        (Jones et al., 2016; Stenni et al., 2017). In addition, deter-
WAIS has experienced a dramatic increase during the 20th          mined trends are often regionally and/or seasonally contra-
century that is unprecedented in the past 300 years (Thomas       dicting on interannual to decadal or multiannual timescales,
et al., 2015; Medley and Thomas, 2019). In contrast, statis-      and they are at the same order of magnitude as the associated
tically significant negative trends have been found across the    uncertainties.
central and western parts of the WAIS (Burgener et al., 2013;        Factors affecting mechanisms that force the anomalously
Medley and Thomas, 2019).                                         strong and rapid warming of the AP and the WAIS with the
   For the AP, time series of near-surface air temperature        associated precipitation changes as well as the contrasting
from weather stations (Vaughan et al., 2003; Turner et al.,       constant air temperatures on the EAIS have been widely dis-
2005a) as well as from ice-core stable water isotope records      cussed. For the AP the significant warming and increase in
(Thomas et al., 2009; Abram et al. 2011; Stenni et al.,           snow accumulation has been linked to a shift of the South-
2017) provide evidence of a significant warming over the last     ern Annular Mode (SAM) towards its positive phase during
100 years reaching more than 3 ◦ C since the 1950s. Contem-       the second half of the 20th century (Thompson and Solomon,
poraneously, precipitation and snow accumulation have sig-        2002; Turner et al., 2005b; Gillett et al., 2006; Marshall et al.,
nificantly increased during the 20th century at a rate that is    2006; Marshall, 2007; Thomas et al., 2008). The recently ob-
exceptional in the past 200–300 years (Turner et al., 2005b;      served decrease in air temperature has in turn been attributed
Thomas et al., 2008, 2017; Medley and Thomas, 2019). The          to an increased cyclonic activity in the northern Weddell Sea
rapidity of the 20th century warming of the AP is unusual but     (Turner et al., 2016). The SAM is the principal zonally sym-
not unprecedented in the context of late Holocene natural cli-    metric mode of atmospheric variability in extratropical re-
mate variability (i.e. 2000 years BP; Mulvaney et al., 2012).     gions of the Southern Hemisphere (Limpasuvan and Hart-
Furthermore, Turner et al. (2016) revealed that air tempera-      mann, 1999; Thompson and Wallace, 2000; Turner, 2004).
tures on the AP have decreased since the late 1990s, contrast-    During its positive phase the mid-latitude westerlies are
ing the warming of previous decades.                              strengthened and shifted poleward over the Southern Ocean,
   Contrary to the AP and the WAIS, the EAIS has expe-            leading to increased cyclonic activity and advection of warm
rienced a cooling or constant climate conditions in recent        and moist air towards Antarctic coastal regions (Thompson
decades (Turner et al., 2005a; Nicolas and Bromwich, 2014;        and Wallace, 2000; Thompson and Solomon, 2002; Turner,
Smith and Polvani, 2017; Goursaud et al., 2017). However,         2004; Gillett et al., 2006). Consequently, a positive SAM is

The Cryosphere, 14, 881–904, 2020                                                       www.the-cryosphere.net/14/881/2020/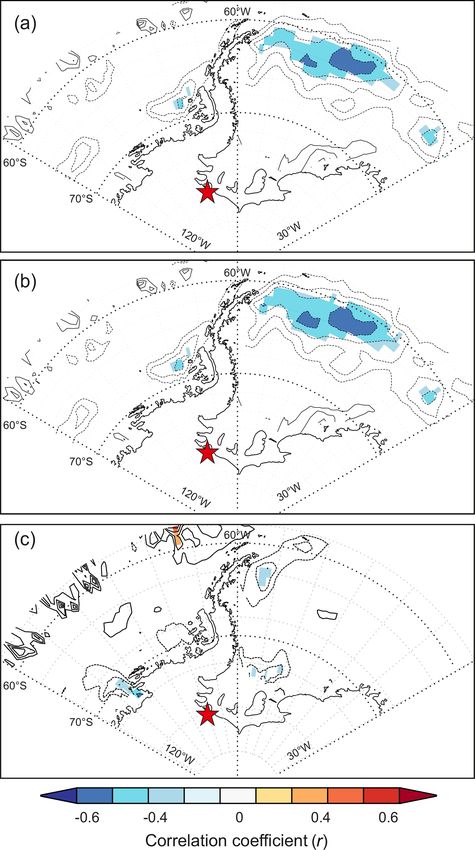
K. Hoffmann et al.: Stable water isotopes and accumulation rates in the Union Glacier region 883
associated with a warming on the AP and anomalously low This study aims at improving our understanding of re-
air temperatures over eastern Antarctica and the Antarctic gional climate variability at the intersection of the AP, the
plateau (EAIS). For a negative SAM the opposite is true, WAIS and the EAIS based on firn core stable water iso-
i.e. a cooling on the AP and exceptionally high air temper- tope data from Union Glacier (UG), located in the Ellsworth
atures over the EAIS. Hence the slight cooling of the EAIS Mountains at the northern edge of the WAIS (79◦ 460 S,
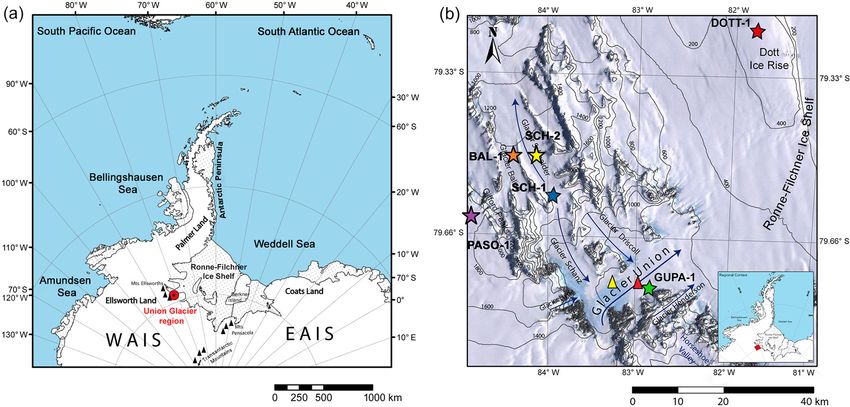
during recent decades is connected to a more positive SAM 83◦ 240 W; 770 m a.s.l., metres above sea level; Fig. 1a).
(Turner et al., 2005a; Stenni et al., 2017). The UG region has not been intensively investigated be-
The rapid warming of the WAIS and the contemporane- fore. Rivera et al. (2010, 2014) mapped the surface and sub-
ous precipitation trends have been suggested to be driven by glacial topography and determined ice-dynamical and ba-
sea surface temperature (SST) anomalies in the central and sic glaciological characteristics of UG. Meteorological and
western (sub)tropical Pacific (e.g. Ding et al., 2011; Schnei- stake measurements yielded a mean daily air temperature
der et al., 2012; Steig et al., 2013; Bromwich et al., 2013). of −20.6 ◦ C (2008–2012) and a mean snow accumulation
Furthermore, the near-surface air temperature and precipita- of 0.12 m w.e. a−1 (2008–2009), respectively. However, the
tion trends observed on the WAIS seem to be linked to the re- available data records are very short and do not allow con-
cent deepening of the Amundsen Sea Low (ASL) influencing clusions on long-term trends.
meridional air mass and heat transport towards West Antarc- In this study we use high-resolution density and stable wa-
tica (Genthon et al., 2003; Bromwich et al., 2013; Hosking et ter isotope data of six firn cores drilled at various locations
al., 2013; Burgener et al., 2013; Raphael et al., 2015; Thomas in the UG region for reconstructing accumulation rates and
et al., 2015). Changes in the absolute depth of the ASL are inferring connections to recent changes in meteorological pa-
strongly related to the El Niño–Southern Oscillation (ENSO) rameters, such as air temperature, on local to regional scales.
and the SAM (Raphael et al., 2015). ENSO is the largest cli- We further investigate how these variables are related to tem-
matic mode on Earth on decadal and sub-decadal timescales, poral changes of moisture source regions, sea ice extent and
originating in the tropical Pacific. ENSO directly influences concentration (SIE and SIC), and atmospheric modes such
the weather and oceanic conditions across tropical, mid- and as SAM and ENSO. Backward trajectory analysis is applied
high-latitude areas on both hemispheres (Karoly, 1989; Diaz to determine potential source regions and transport path-
and Markgraf, 1992, 2000; Turner, 2004; L’Heureux and ways of precipitating air masses reaching the UG region. We
Thompson, 2006). The near-surface air temperature variabil- aim to characterize the UG region with isotope geochemi-
ity of both East and West Antarctica has been linked to the cal methods in order to place it in the regionally diverse pat-
variability of ENSO, although not showing any consistent tern of Antarctic climate variability. The main focus of this
trend on interannual timescales (Rahaman et al., 2019). study lies in the following questions. Do the UG region and
Current trends in Antarctic climate and their drivers are surrounding areas experience the same strong and rapid air
still not completely understood, especially on regional scales. temperature and accumulation increases as observed for the
Consequently, there is a strong need for extended observa- neighbouring AP and WAIS and, if yes, to what extent? Or
tions and monitoring in all regions of Antarctica. Therefore, does the UG region follow the rather constant air temper-
data on meteorological parameters such as air temperature, ature and accumulation conditions as observed for most of
precipitation (accumulation), moisture sources and transport the EAIS?
pathways of precipitating air masses are vital to assess past
and recent changes of Antarctic climate. Direct observations
of these parameters are lacking for most of Antarctica. Thus, 2 Data and methodology
proxy data derived from firn and ice cores, e.g. stable wa-
ter isotopes, provide important information on past and re- 2.1 Fieldwork, sample processing and analysis
cent climate variability on local to regional scales (Thomas
and Bracegirdle, 2015). For the region at the intersection of Two field campaigns were conducted in the UG region in
the AP, the WAIS and the EAIS data are especially sparse austral summers 2014 and 2015. UG is one of the major out-
as little or no long-term meteorological records are available let glaciers within the Ellsworth Mountains and flows into
for this part of the Antarctic continent (Stenni et al., 2017; the Ronne–Filchner Ice Shelf in the Weddell Sea sector of
Thomas et al., 2017). The region is located at the transition Antarctica (Fig. 1a and b). It is composed of several glacier
to the Ronne–Filchner Ice Shelf, for which a recent mod- tributaries covering a total area of 2561 km2 . UG has a total
elling study suggests a high susceptibility to destabilization length of 86 km, a maximum ice thickness of 1540 m and a
and disintegration under a warming climate (Hellmer et al., maximum depth of the snow–ice boundary layer of 120 m.
2012, 2017). A similar situation has been already observed The subglacial topography of the glacier valley is smooth
for ice shelves around the AP and the WAIS (e.g. Pritchard with U-shaped flanks. The bedrock is located below sea level
and Vaughan, 2007; Cook and Vaughan, 2010, Joughin and (−858 m; Rivera et al., 2014).
Alley, 2011; Scambos et al., 2014; Rignot et al., 2014). We examine six firn cores (GUPA-1, DOTT-1, SCH-1,
SCH-2, BAL-1 and PASO-1) retrieved at different loca-
www.the-cryosphere.net/14/881/2020/ The Cryosphere, 14, 881–904, 2020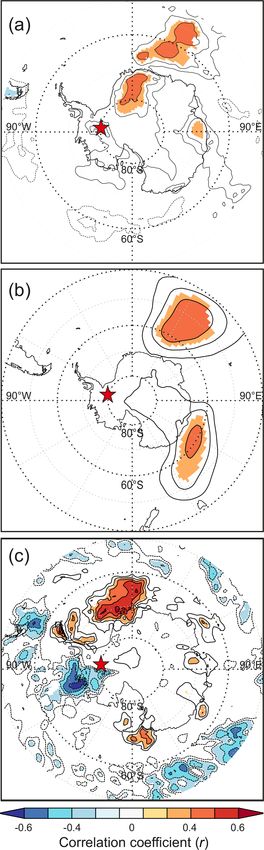
884                          K. Hoffmann et al.: Stable water isotopes and accumulation rates in the Union Glacier region

Figure 1. Location of the UG region within Antarctica (a) and location of the drill sites of the six firn cores (GUPA-1, DOTT-1, SCH-1, SCH-
2, BAL-1, PASO-1) within the UG region (b). The triangles in (b) denote the location of two AWSs on UG (yellow: station Wx7; red: station
Arigony; further explanations in the text). The background image in (b) was extracted from the Landsat Image Mosaic of Antarctica (LIMA),
and the contour lines were obtained from the Radarsat Antarctic Mapping Project Digital Elevation Model, Version 2 (Liu et al., 2015).

tions (Fig. 1b), ranging between 760 m a.s.l. (GUPA-1 and               reported in per mil (‰) versus VSMOW2. The precision of
DOTT-1) and 1900 m a.s.l. (PASO-1) in altitude, using a                 the measurements is ±0.08 ‰ for δ 18 O and ±0.5 ‰ for δD.
portable solar-powered and electrically operated ice-core                  For firn cores GUPA-1, DOTT-1, SCH-1 and SCH-2, den-
drill (Backpack Drill; icedrill.ch AG). GUPA-1 was drilled              sity profiles were constructed by section-wise determining
near the ice-landing strip on UG. DOTT-1 originates from                the core volume and weight. Accordingly, the average res-
an ice rise towards the Ronne–Filchner Ice Shelf. SCH-                  olution of density profiles is 0.25 m for GUPA-1, 0.4 m for
1 was retrieved from the ice divide between the glaciers                DOTT-1, 0.27 m for SCH-1 and 0.78 m for SCH-2. Cores
Schneider and Schanz. SCH-2 and BAL-1 were both taken                   GUPA-1, DOTT-1 and SCH-1 were sampled at 0.05 m res-
in U-shaped glacial valleys (Schneider Glacier and Balish               olution for stable water isotope analysis carried out at the
Glacier). PASO-1 originates from a plateau west of the Gif-             Stable Isotope Laboratory of the Universidad Nacional An-
ford Peaks. Details on the drill locations and basic core char-         drés Bello (UNAB) in Viña del Mar, Chile. For the mea-
acteristics are given in Table 1.                                       surements an off-axis integrated cavity output spectrome-
   For firn cores BAL-1 and PASO-1, high-resolution                     ter (TLWIA 45EP; Los Gatos Research) was used with a
(< 1 mm) density profiles were obtained using X-ray micro-              precision of 0.1 ‰ for δ 18 O and 0.8 ‰ for δD (Fernandoy
focus computer tomography (ICE-CT; Freitag et al., 2013) at             et al., 2018). Each sample was measured twice in different
the ice-core-processing facilities of the Alfred Wegener In-            days using 10 repeated injections, from which the first four
stitute (AWI), Helmholtz Centre for Polar and Marine Re-                were discarded on each measurement. Stable water isotope
search, in Bremerhaven, Germany. The cores were sam-                    raw data were corrected for linear drift and memory effects
pled at 0.025 m resolution and analysed for stable water iso-           and then normalized to the VSMOW2–SLAP2 scale using
topes using a cavity ring-down spectrometer (L2130-i; Pi-               the software LIMS (Laboratory Information Management
carro Inc.) coupled to an autosampler (PAL HTC-xt; CTC                  System; Coplen and Wassenaar, 2015). For data normaliza-
Analytics AG) at the Stable Isotope Laboratory of the AWI               tion, three different in-house standards and one USGS stan-
in Potsdam, Germany. Stable water isotope raw data were                 dard (USGS49) calibrated to the VSMOW2–SLAP2 scale
corrected for linear drift and memory effects following the             were used.
procedures suggested by van Geldern and Barth (2012) us-                   Core SCH-2 was analysed at the British Antarctic Survey
ing six repeated injections per sample, from which the first            (BAS) in Cambridge, UK. Stable water isotopes were deter-
three were discarded. The drift- and memory-corrected sta-              mined at 0.05 m resolution using a Picarro L2130-i analyser
ble water isotope compositions were calibrated with a linear            with measurement precision of 0.08 ‰ for δ 18 O and 0.5 ‰
                                                                                                               2−
regression analysis using four different in-house standards             for δD. Major ions (Cl− , NO−                  −    +
                                                                                                         3 , SO4 , MSA , Na , K ,
                                                                                                                                  +

that have been calibrated to the international VSMOW2 (Vi-              Mg2+ , Ca2+ ) were measured at 0.05 m resolution using a
enna Standard Mean Ocean Water) –SLAP2 (Standard Light                  Dionex reagent-free ion chromatography system (ICS-2000).
Antarctic Precipitation) scale. Stable water isotope ratios are         Furthermore, longitudinal subsections of the core (32 mm ×

The Cryosphere, 14, 881–904, 2020                                                              www.the-cryosphere.net/14/881/2020/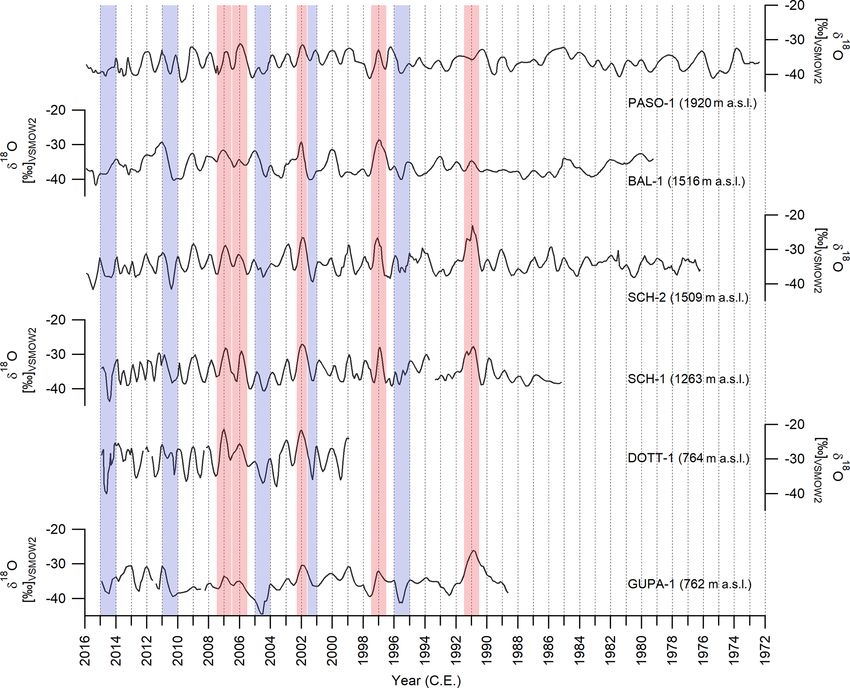
K. Hoffmann et al.: Stable water isotopes and accumulation rates in the Union Glacier region                                                           885

Table 1. Details on drill locations and basic statistics of the stable water isotope composition and accumulation rates of the six firn cores
retrieved from UG. In addition, minimum, mean and maximum values of stable oxygen isotope annual means and accumulation rates are
given for the period covered by all cores (1999–2013). Mean values of stable water isotopes and accumulation rates are highlighted in bold.

  Firn core                           GUPA-1               DOTT-1                 SCH-1                SCH-2                BAL-1               PASO-1
  Coordinates                 79◦ 460 07.0000 S,   79◦ 180 38.8400 S,   79◦ 310 14.0200 S,   79◦ 330 17.7600 S,   79◦ 310 27.6900 S,   79◦ 380 00.6800 S,
                              82◦ 540 33.4400 W    81◦ 390 09.3300 W    84◦ 080 56.4800 W    84◦ 030 11.4600 W    84◦ 260 32.0900 W    85◦ 000 22.5100 W
  Altitude (m a.s.l.)                     762                  764                1263                 1509                 1516                 1920
  Depth (m)                              9.58                 9.57               14.13                20.25                17.28                15.04
  Drilling date                    Nov 2014             Nov 2014             Nov 2014             Nov 2015             Nov 2015             Nov 2015
  Age (period/years)          1989–2014 (26)       1999–2014 (16)       1986–2014 (29)       1977–2015 (39)       1980–2015 (36)       1973–2015 (43)
  Coordinates and elevation         79◦ 300 S            79◦ 300 S            79◦ 300 S            79◦ 300 S            79◦ 300 S            79◦ 300 S
  (m a.s.l.) of nearest            83◦ 150 W            81◦ 450 W            84◦ 000 W            84◦ 000 W            84◦ 450 W            84◦ 450 W
  ERA-Interim grid point               911.3                641.5              1061.2               1061.2               1208.4               1208.4
  δ 18 O (‰)
  Min                                    −44.5                −40.0                −43.7                −41.6                −41.7                −42.3
  Mean                                   −35.6                −29.9                −35.0                −34.1                −36.2                −36.6
  Max                                    −26.1                −21.3                −27.1                −23.1                −28.5                −31.1
  SD                                       3.1                  3.9                  3.1                  2.8                  2.5                  2.3
  δD (‰)
  Min                                  −352.1               −314.6               −346.6               −331.2               −330.7               −333.7
  Mean                                 −278.6               −233.1               −273.3               −268.0               −284.1               −285.9
  Max                                  −202.5               −163.9               −211.2               −187.1               −222.3               −240.2
  SD                                     25.0                 31.6                 24.6                 23.2                 20.3                 19.2
  d excess (‰)
  Min                                     −0.2                 −2.3                 −2.3                 −5.6                 −0.4                   0.3
  Mean                                     5.8                  5.8                  6.5                  4.9                  5.5                   7.0
  Max                                     11.8                 10.5                 15.5                 17.2                  9.7                  11.5
  SD                                       2.6                  2.2                  2.6                  3.7                  1.6                   1.7
  Slope of co-isotopic                     7.94                 8.09                 7.95                 8.19                 8.05                 8.24
  relationship
  n (samples)                              190                  189                  280                  418                  675                  596
  δ 18 O (‰) of annual means for 1999–2013
  Min                                    −41.1                −33.4                −37.7                −36.0                −38.0                −38.4
  Mean                                   −35.7                −29.7                −34.7                −34.1                −35.4                −36.3
  Max                                    −32.5                −27.0                −32.3                −31.7                −31.5                −33.8
  Accumulation                     1989–2013            1999–2013            1986–2013            1977–2014            1980–2014            1973–2014
  (m w.e. a−1 )
  Min                                    0.111                0.203                0.142                0.159                0.121                0.096
  Mean                                   0.180                0.284                0.247                0.285                0.253                0.181
  Max                                    0.364                0.378                0.390                0.472                0.378                0.283
  SD                                     0.061                0.052                0.064                0.078                0.079                0.039
  Accumulation (m w.e. a−1 ) for 1999–2013
  Min                                    0.111                0.203                0.142                0.159                0.130                0.148
  Mean                                   0.158                0.284                0.219                0.229                0.231                0.198
  Max                                    0.284                0.378                0.333                0.295                0.353                0.283

www.the-cryosphere.net/14/881/2020/                                                                          The Cryosphere, 14, 881–904, 2020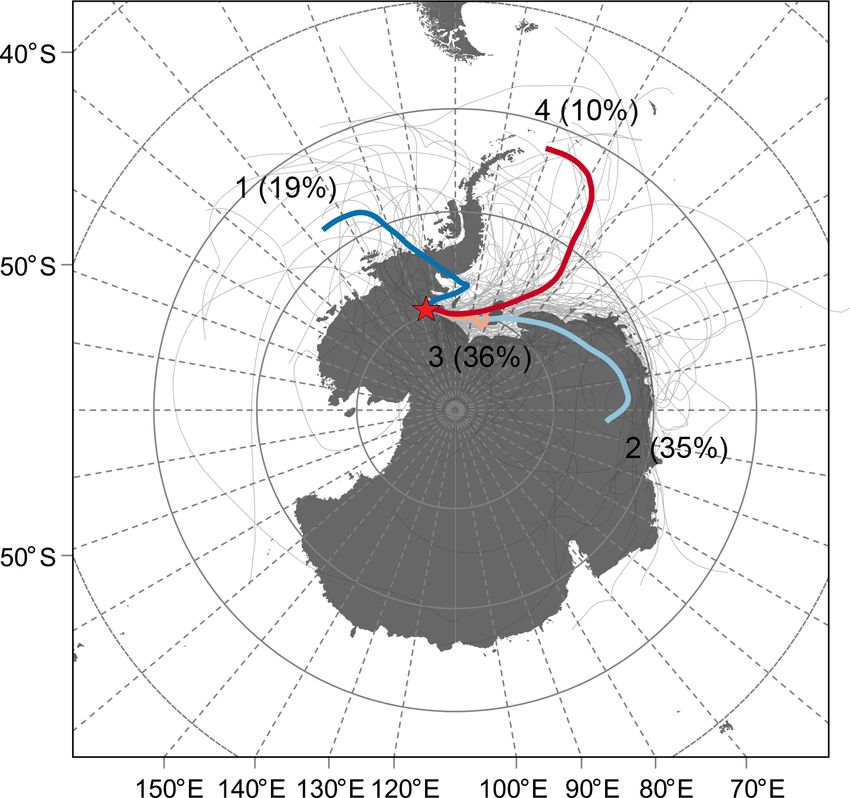
886                         K. Hoffmann et al.: Stable water isotopes and accumulation rates in the Union Glacier region

32 mm in size) were melted continuously on a chemically            observed in the well-dated ice cores PIG2010, DIV2010
inert, ultra-clean melt head to measure electrical conductiv-      and THW2010 from West Antarctica (Pasteris et al., 2014).
ity, dust and H2 O2 at high resolution (∼ 1 mm; continuous         Hence, the signal attributed to the Mt. Pinatubo eruption was
flow analysis, CFA; McConnell et al., 2002). In addition,          used as an additional tie point for the age model construc-
core PASO-1 was analysed for liquid conductivity, H2 O2 ,          tion of PASO-1. For cores GUPA-1, DOTT-1, SCH-1 and
NO−         +
     3 , NH4 , black carbon and various chemical elements at       BAL-1 we applied ALC of stable water isotopes and then
the Trace Chemistry Laboratory of the Desert Research In-          matched the preliminary age–depth relationships to the SCH-
stitute (DRI) in Reno, Nevada, USA, according to methods           2 age scale.
described by Röthlisberger et al. (2000) and McConnell et             Snow accumulation rates at the firn core sites were deter-
al. (2002, 2007). Chemical elements were measured using            mined and converted to metres of water equivalent per year
two Thermo Finnigan Element2 inductively coupled plasma            (m w.e. a−1 ) based on measured densities (Fig. S2).
mass spectrometers (ICP-MS). Subsequently, values of ssNa             Composite stable water isotope and accumulation records
(sea-salt Na) and nssS (non-sea-salt S), which are used for        were constructed for the entire UG region by combining time
the core chronology of PASO-1, were calculated from Na and         series of annually averaged stable water isotopes and accu-
S concentrations according to Röthlisberger et al. (2002) and      mulation rates of the individual firn cores. In order to assign
Sigl et al. (2013), respectively, applying relative abundances     each firn core the same weight and to not over-represent a
from Bowen (1979; Eqs. S1a–S1d in the Supplement).                 certain firn core drill site, annually averaged data were stan-
   The corrected and calibrated δ 18 O and δD values were          dardized before stacking (Stenni et al., 2017; Eq. S2). Lin-
used to calculate the d excess (d excess = δD−8·δ 18 O; Dans-      ear trends were calculated and tested for their statistical sig-
gaard, 1964) and to derive a co-isotopic relationship (δD =        nificance using the non-parametric Mann–Kendall tau and
m · δ 18 O + n) for each core. Since there are no stable wa-       Sen slope (s) estimator trend test (Mann, 1945; Sen, 1968;
ter isotope data of recent precipitation available for the UG      Kendall, 1975) with correction for autocorrelation accord-
region, a Local Meteoric Water Line (LMWL) was inferred            ing to Yue and Wang (2004). Signal-to-noise ratios for stable
from the co-isotopic relationship of all cores. Based on find-     water isotope and accumulation rate time series of the UG
ings by Fernandoy et al. (2010) we believe that this compos-       firn cores were estimated according to Fisher et al. (1985;
ite co-isotopic relationship – at a first approximation – can be   Eq. S3).
referred to as LMWL at UG.
                                                                   2.3   Meteorological database and backward trajectory
2.2   Dating of firn cores and time series construction                  analysis

Recent studies have used the seasonality of stable water iso-      Meteorological data from an automatic weather station
topes and chemical parameters to reliably date firn cores          (AWS) located at the UG ice runway (station: Wx7; 79◦ 460 S,
from Antarctica (e.g. Vega et al., 2016; Caiazzo et al., 2016).    83◦ 160 W; 705 m a.s.l.; Fig. 1b) cover the 4-year period from
Stable water isotope profiles (δ 18 O and δD) of the six firn      1 February 2010 to 8 February 2014. The AWS records near-
cores are displayed with respect to depth in Fig. S1 in the        surface air temperature (2 m), wind speed, wind direction,
Supplement. Data gaps in GUPA-1, DOTT-1 and SCH-1 are              relative humidity and air pressure every 10 min. Additionally,
due to leaking sample bags (GUPA-1: 2 samples; DOTT-1:             hourly resolved data of the same meteorological parameters
3 samples; SCH-1: 2 samples). Firn cores for which glacio-         are available from a second AWS operated on UG (station:
chemical data are available, i.e. SCH-2 and PASO-1, were           Arigony; 79◦ 460 S, 82◦ 540 W; 693 m a.s.l.; Fig. 1b) covering
dated using annual layer counting (ALC) of stable water iso-       the period from 14 December 2013 to 29 March 2018. Since
topes and chemical parameters focusing on H2 O2 for SCH-           differences between the Wx7 and the Arigony records are
2 (Fig. 2) and nssS for PASO-1 (Fig. 3). H2 O2 and nssS            small throughout the overlapping period (14 December 2013
exhibit both clear seasonal alternations between the high-         to 8 February 2014; e.g. the mean differences in air tempera-
est and lowest values, since the former parameter is directly      ture and air pressure are 0.74 ◦ C and 5.76 hPa, respectively),
linked to the annual insolation cycle (Lee et al., 2000; Stew-     the two datasets were combined in order to expand the mete-
art, 2004) and the latter to marine biogenic activity (phyto-      orological record.
plankton; Kaufmann et al., 2010). In addition, for the age            The meteorological data from the two AWSs (air temper-
model construction of SCH-2 methanesulfonic acid (MSA),            ature and air pressure) along with measured surface densi-
SO2−4 and the Cl/Na ratio were used for corroborating the          ties (Fig. S2) and derived accumulation rates (Fig. 6 and Ta-
years identified by ALC of H2 O2 and stable water isotopes         ble 1) were used to model depth-dependent diffusion lengths
(Vega et al., 2018). For the dating of PASO-1 the signal of        for each firn core across the entire length following the ap-
the Mt. Pinatubo eruption (1991) could be found via the co-        proach described by Münch and Laepple (2018) and Laep-
incidence of an above-average peak in the nssS/ssNa record         ple et al. (2018), respectively. Local near-surface air temper-
with a lacking winter minimum in the nssS record at 9.5–           atures at the firn core drill sites were estimated from the AWS
9.7 m depth (Fig. 3). Similar changes in wintertime nssS were      measurements by rescaling using the altitude of the respec-

The Cryosphere, 14, 881–904, 2020                                                       www.the-cryosphere.net/14/881/2020/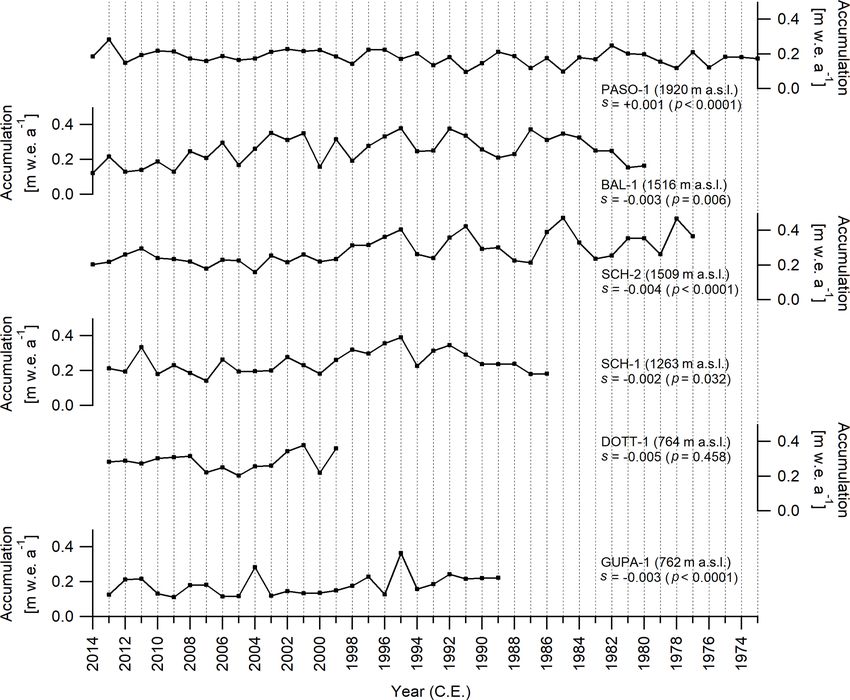
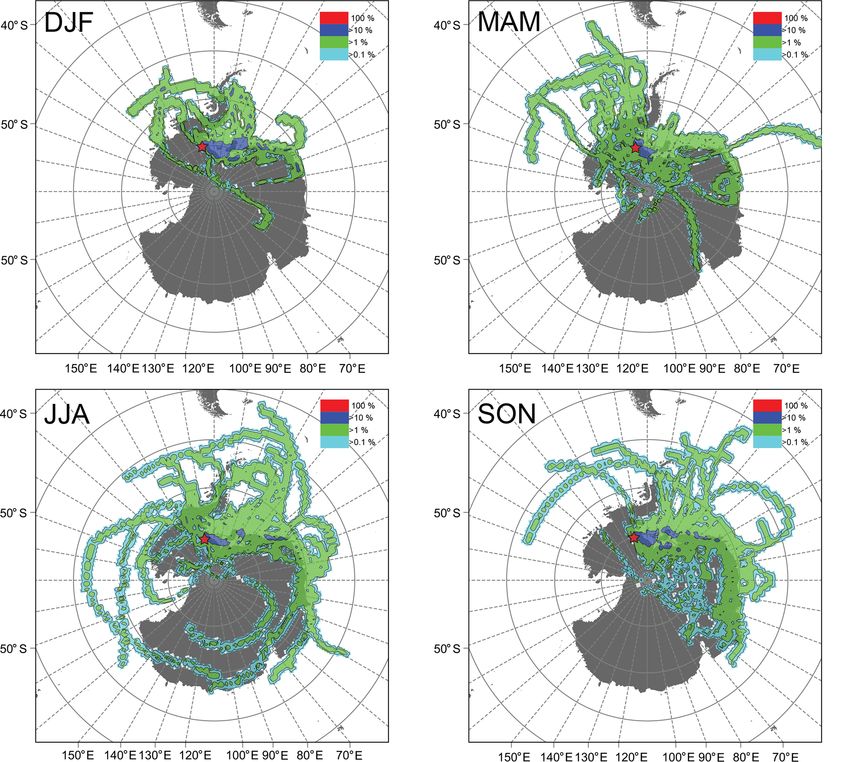
K. Hoffmann et al.: Stable water isotopes and accumulation rates in the Union Glacier region                                      887

Figure 2. Age scale for firn core SCH-2 constructed by counting and inter-matching of maximum peaks (dashed lines) in CFA-derived
profiles of stable water isotope composition (δD) and different chemical parameters (H2 O2 , Cl/Na, MSA and SO2−  4 ). Smoothed 2P is a
two-point running average. Note that the maxima of the chemical parameters do not necessarily coincide with the respective maxima in δD
due to the different seasonality of the proxies.

tive site and a lapse rate of 1 ◦ C per 100 m. Local surface          ter (NSIDC). The dataset NSIDC-0079 – Bootstrap Sea Ice
air pressures were estimated from the barometric height for-          Concentrations from Nimbus-7 SMMR and DMSP SSM/I-
mula.                                                                 SSMIS, Version 3 – with a spatial resolution of 25 km×25 km
   Furthermore, we use fields of near-surface air tem-                was used (Comiso, 2017; available at: https://nsidc.org/data/
perature (2 m), precipitation–evaporation and geopoten-               nsidc-0079, last access; 1 October 2019). Furthermore, we
tial heights (850 mbar) from the European Centre for                  use the Marshall SAM index as an indicator for the pre-
Medium-Range Weather Forecasts (ECMWF) Interim                        vailing SAM phase (Marshall, 2003; available at: https://
Reanalysis (ERA-Interim; 1979–2019, spatial resolu-                   legacy.bas.ac.uk/met/gjma/sam.html, last access: 5 Septem-
tion: 79 km, temporal resolution: 6 h; Dee et al., 2011;              ber 2019). The multivariate ENSO index (MEI) serves as an
available at: https://www.ecmwf.int/en/forecasts/datasets/            indicator for the occurrence and strength of El Niño and La
reanalysis-datasets/era-interim, last access: 1 October 2019)         Niña events (Wolter and Timlin, 1993, 1998; available at:
for comparison with UG composite records of stable water              https://www.esrl.noaa.gov/psd/enso/mei/table.html, last ac-
isotopes and accumulation rates. ERA-Interim reanalysis               cess: 5 September 2019).
data were aggregated to daily, monthly or annual values.                 Spatial and cross-correlation analyses between UG com-
   Annually averaged stable water isotope compositions and            posite time series of stable water isotopes and accumula-
accumulation rates were also related to time series of climate        tion rates and time series of ERA-Interim reanalysis data,
modes such as SAM and ENSO as well as to SIE and SIC in               SIE, SIC, the Marshall SAM index and the MEI, respec-
order to identify potential dominant drivers of climate vari-         tively, were carried out calculating Pearson correlation co-
ability in the UG region.                                             efficients (r) and p values (p) at the 95 % confidence level
   For comparison with the UG stable water isotope and                (i.e. α = 0.05). For calculating spatial correlations all time
accumulation records, mean monthly SIE for different                  series were detrended.
Antarctic sectors (Weddell Sea: 60◦ W–20◦ E; Indian Ocean:               We performed backward trajectory analysis using the Hy-
20–90◦ E; Western Pacific: 90–160◦ E; Ross Sea: 160◦ E–               brid Single Particle Lagrangian Integrated Trajectory (HYS-
130◦ W; Bellingshausen–Amundsen Sea: 130–60◦ W) was                   PLIT) model (Draxler and Hess, 1998; Stein et al., 2015;
obtained from the National Aeronautics and Space Ad-                  available at: https://ready.arl.noaa.gov/index.php, last access:
ministration (NASA; Cavalieri et al., 1999, 2012; available           24 September 2019) in order to determine potential mois-
at: https://neptune.gsfc.nasa.gov/csb/index.php, last access:         ture source regions and transport pathways of precipitating
5 September 2019). Note that these data are only avail-               air masses for the UG region. The drill site of firn core
able for the period 1979–2012. Satellite-derived SIC data             SCH-1 was taken as initial point for the calculation of 5 d
were acquired from the National Snow and Ice Data Cen-                backward trajectories. This location was selected as it is

www.the-cryosphere.net/14/881/2020/                                                            The Cryosphere, 14, 881–904, 2020
888                        K. Hoffmann et al.: Stable water isotopes and accumulation rates in the Union Glacier region

less influenced by post-depositional processes as well as         years, 1973–2015) the longest record. Note that for the age
wind-induced redistribution and removal of snow. Thus, it         model construction of GUPA-1 and BAL-1, 2 and 3 years, re-
is among all available firn core drill sites the most repre-      spectively (1990 and 2001 for GUPA-1; 1981, 1983 and 1994
sentative for snowfall events in the UG region. ERA-Interim       for BAL-1), were identified from linear interpolation only
time series of daily precipitation extracted from the nearest     and are not clearly visible in the stable water isotope records
grid point at 1061 m a.s.l. (Table 1) for the period 2010–2015    due to smoothing in the respective core sections. Further-
(resolution: 0.75◦ × 0.75◦ ; available at: http://apps.ecmwf.     more, for SCH-1 the first year (1986) was identified by linear
int/datasets/data/interim-full-daily/levtype=sfc/, last access:   extrapolation at the lowest end of the core using the depth–
24 September 2019) served as input to identify precipita-         age relationship between the previous two clearly identifiable
tion events on a daily scale. We used a minimum threshold         peaks (years 1987 and 1988). For all cores the last year (ei-
corresponding to 1 % of the mean annual snow accumula-            ther 2014 or 2015) was excluded from further analyses as it
tion at UG (see below), a value that in terms of percentage       is incomplete.
is equivalent to the one applied by Thomas and Bracegir-
dle (2009). Based on input data from the Global Data As-          3.3   Firn core stable water isotopes and accumulation
similation System (GDAS-1; available at: https://www.ready.             rates
noaa.gov/archives.php, last access: 24 September 2019) 121
backward trajectories were calculated corresponding to daily      The mean stable oxygen isotope composition of the six firn
precipitation events occurring in the period 2010–2015. They      cores ranges from −36.6 ‰ (PASO-1) to −29.9 ‰ (DOTT-
were then subdivided into their respective seasons (DJF,          1) with standard deviations varying between 2.3 ‰ (PASO-
MAM, JJA and SON). Individual backward trajectories were          1) and 3.9 ‰ (DOTT-1; Table 1). Absolute minimum δ 18 O
combined to four different clusters that group precipitation      (δD) values are found in GUPA-1 and absolute maximum
events with statistically similar transport pathways according    δ 18 O (δD) values in DOTT-1. Note that the results for GUPA-
to their spatial variance (Stein et al., 2015).                   1 have to be handled with caution as this core was drilled
                                                                  next to the UG field camp and ice-landing strip. Therefore,
                                                                  snow relocation effects due to wind drift and/or human ac-
3     Results                                                     tivities (e.g. runway maintenance) might have biased its sta-
                                                                  ble water isotope composition. This is also indicated by less
3.1    Meteorological data
                                                                  pronounced seasonal alternations in the GUPA-1 stable wa-
The mean daily air temperature for the composite record of        ter isotope records (Fig. S1). Despite different drill loca-
near-surface air temperature (2010–2018; Fig. 4) is −21.3 ±       tions and altitudes, the range in mean d-excess values of
8.5 ◦ C with an absolute minimum of −46.8 ◦ C recorded on         the six firn cores is small (from 4.9 ‰ for SCH-2 to 7.0 ‰
17 July 2017 and an absolute maximum of +3.3 ◦ C mea-             for PASO-1). The slope of the co-isotopic relationship (Ta-
sured on 21 February 2013. Daily air temperatures are the         ble 1 and Fig. S3a–f) is close to that of the Global Meteoric
highest during December and January, with mean values of          Water Line (GMWL; Craig, 1961) for all cores ranging be-
−9.2 ± 2.9 ◦ C and −9.1 ± 3.0 ◦ C, respectively, and lowest       tween 7.94 (GUPA-1) and 8.24 (PASO-1). Hence, the orig-
from April to September, with mean values below −25 ◦ C.          inal (oceanic) stable water isotope signal is preserved dur-
The coldest month of the whole composite record period is         ing moisture transport and snow deposition at the study site
July, with a mean air temperature of −28.8 ± 5.6 ◦ C. Daily       (Clark and Fritz, 1997). For all cores δ 18 O and δD values are
wind speeds have a mean value of 6.9 ms−1 ±5.1 ms−1 with a        highly correlated (R 2 ≥ 0.98), with the largest variation in
predominant direction from SW (220◦ ). The maximum wind           d excess observed for SCH-2 (values range from −5.6 ‰ to
speed recorded is 29.7 ms−1 . Wind speeds are higher than         17.2 ‰). The LMWL of the UG region was determined as
1.2 ms−1 in > 75 % of all data. The observations are in line      δD = 8.02 · δ 18 O + 6.57 (R 2 = 0.99, p = 0; Fig. 5).
with those made by Rivera et al. (2014) for the period 2008–         Time-series analysis of δ 18 O annual means (Fig. S4)
2012 and imply the possibility of substantial redistribution of   reveals statistically significant trends only for cores
snow due to wind drift.                                           SCH-1 (s = +0.039 ‰ a−1 , p < 0.05) and BAL-1 (s =
                                                                  +0.054 ‰ a−1 , p < 0.0001). Statistically significant pos-
3.2    Firn core age model                                        itive trends of d-excess annual means (Fig. S5) have
                                                                  been found for GUPA-1 (s = +0.085 ‰ a−1 , p < 0.01),
The results of firn core dating are given in Table 1. The         SCH-2 (s = +0.085 ‰ a−1 , p < 0.0001) and PASO-1 (s =
estimated dating uncertainty is ±1 year for cores dated           +0.016 ‰ a−1 , p < 0.01), whereas for DOTT-1 (s =
with stable water isotopes and glacio-chemistry (SCH-2 and        −0.110 ‰ a−1 , p < 0.05) and SCH-1 (s = −0.052 ‰ a−1 ,
PASO-1) and ±2 years for cores dated with stable water            p < 0.0001) the d-excess trend is negative. The BAL-1 d-
isotopes only and subsequent matching to the SCH-2 age            excess record exhibits no trend.
scale (GUPA-1, DOTT-1, SCH-1 and BAL-1). Core DOTT-1                 Mean annual accumulation rates vary between
(16 years, 1999–2014) exhibits the shortest and PASO-1 (43        ∼ 0.18 m w.e. a−1      (GUPA-1       and       PASO-1)     and

The Cryosphere, 14, 881–904, 2020                                                      www.the-cryosphere.net/14/881/2020/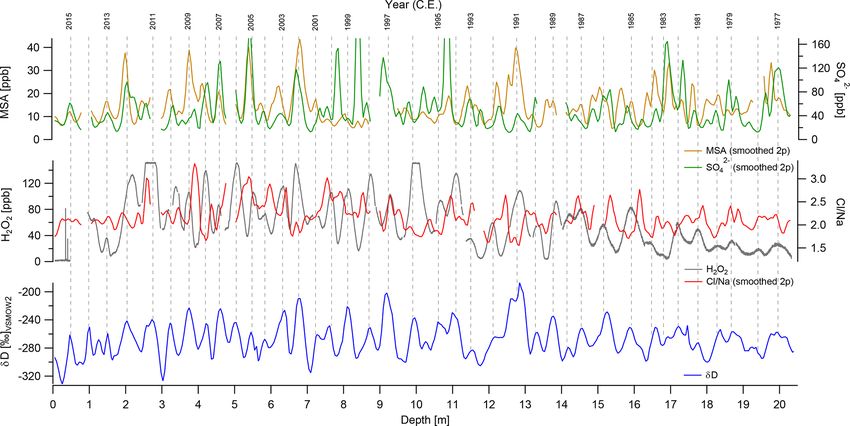
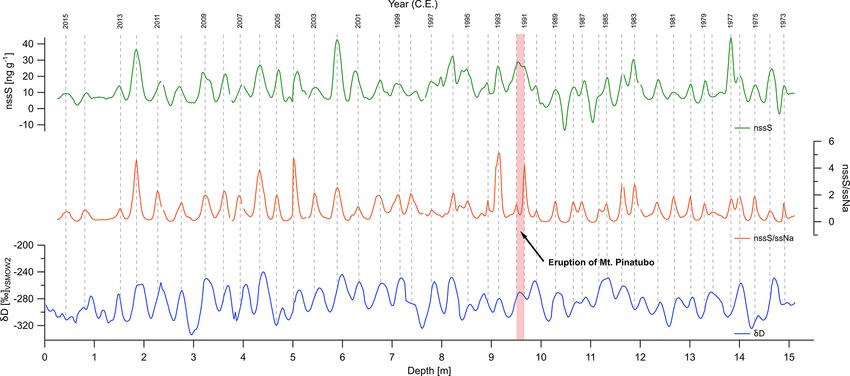
K. Hoffmann et al.: Stable water isotopes and accumulation rates in the Union Glacier region                                              889

Figure 3. Age scale for firn core PASO-1 constructed by counting and inter-matching of maximum peaks (dashed lines) in profiles of
stable water isotope composition (δD) as obtained from discrete sample measurements and in CFA-derived profiles of nssS and nssS/ssNa,
respectively. The year of the eruption of Mt. Pinatubo (1991) that is used as tie point for annual layer counting is highlighted. Note that the
maxima of nssS and nssS/ssNa do not necessarily coincide with the respective maxima in δD due to the different seasonality of the proxies.

Figure 4. Composite record of mean daily and mean monthly air temperatures recorded at two nearby UG AWS sites (stations: Wx7,
Arigony) from February 2010 to March 2018. The mean daily air temperature for the entire composite record period (−21.3 ◦ C; dashed
black line) and the period overlapping with UG firn core records (February 2010 to November 2015; grey bar) are also indicated.

∼ 0.29 m w.e. a−1 (SCH-2), with the lowest standard                       0.098 m w.e. a−1 at the PASO-1 site (Fig. 6). At the GUPA-1
deviations found at the DOTT-1 and PASO-1 sites (∼ 0.04–                  and BAL-1 sites snow accumulation decreased at the same
0.05 m w.e. a−1 ) and the highest ones exhibited by cores                 rate of −0.003 m w.e. a−1 (p < 0.01). At the SCH-1 and
SCH-2 and BAL-1 (∼ 0.08 m w.e. a−1 ; Table 1). An-                        SCH-2 sites the decrease in snow accumulation amounts
nual minimum accumulation ranges between 0.1 and                          to −0.002 m w.e. a−1 (p < 0.05) and −0.004 m w.e. a−1
0.2 m w.e. a−1 . Annual maximum accumulation reaches                      (p < 0.0001), respectively. In contrast, snow accumulation
– except at the PASO-1 site – values of higher than                       exhibits a slight albeit statistically significant increase at the
0.3 m w.e. a−1 , with the absolute maximum found at                       PASO-1 site (s = +0.001 m w.e. a−1 , p < 0.0001).
the SCH-2 site in 1985 (0.47 m w.e. a−1 ). In the same
year, snow accumulation reaches a local minimum of

www.the-cryosphere.net/14/881/2020/                                                                 The Cryosphere, 14, 881–904, 2020
890                           K. Hoffmann et al.: Stable water isotopes and accumulation rates in the Union Glacier region

                                                                         climate modelling (Lenaerts et al., 2012; Lenaerts and van
                                                                         den Broeke, 2012) provide evidence for a drifting snow fre-
                                                                         quency (defined as the fraction of days with drifting snow) of
                                                                         about 15 %–30 % in the UG region. Also, studies from close-
                                                                         by areas such as Patriot Hills (Casassa et al., 1998) and the
                                                                         Ronne–Filchner Ice Shelf (Graf et al., 1988) as well as from
                                                                         DML (Schlosser and Oerter, 2002; Kaczmarska et al., 2004)
                                                                         revealed that wind drift and random sastrugi formation are
                                                                         the main reasons for large spatial and temporal variations in
                                                                         accumulation rates. However, linkages between the different
                                                                         firn core drill sites at UG are speculative, e.g. the potential
                                                                         uptake of snow at the PASO-1 drill site (local minimum accu-
                                                                         mulation) and its redistribution towards the lower-altitudinal
                                                                         core sites (SCH-2; absolute maximum accumulation) by the
Figure 5. Composite co-isotopic relationship (δ 18 O vs. δD) based       predominantly south-westerly winds in 1985. The calcula-
on all individual samples (n = 2348; white dots) of the six firn cores
                                                                         tion of signal-to-noise ratios for stable water isotopes and
from UG with the equation, the coefficient of determination (R 2 )
                                                                         accumulation rates can help to further assess the extent to
and the p value (p) of the linear regression (red dashed line). The
GMWL is indicated in blue. The composite co-isotopic relationship        which the UG firn cores are influenced by noise-inducing
is referred to as the LMWL of the UG region.                             processes such as wind drift and diffusion. In the following,
                                                                         firn core GUPA-1 is excluded from statistical evaluation due
                                                                         to the likely biasing and smoothing of its stable water iso-
4     Discussion                                                         tope and accumulation records as a consequence of its posi-
                                                                         tion near the UG ice-landing strip. Based on the two-by-two
4.1    Potential noises influencing UG firn core records                 signal-to-noise ratios between the individual cores (Tables S2
                                                                         and S3), we obtained for the UG firn cores a δ 18 O signal-to
In order to properly assess the environmental signals in stable          noise ratio of 0.60 for the entire record period (1973–2014)
water isotope and accumulation data of the UG firn cores,                and of 0.78 when referring to the overlapping period (1999–
several aspects that could potentially induce noise need to              2013). The signal-to-noise ratios are similar when consid-
be taken into account: the intermittency of precipitation, the           ering only the three neighbouring cores BAL-1, SCH-1 and
redistribution of snow by wind drift and the diffusion in firn.          SCH-2 situated within 10 km distance in similar valley po-
   The analysis of diffusion lengths for the maximum depth               sitions. They yield 0.60 for 1973–2014 and 0.86 for 1999–
of the UG firn cores revealed values between 0.07 m (PASO-               2013. The signal-to-noise ratios of δ 18 O in the UG region
1) and 0.11 m (GUPA-1), which are much lower than the                    of between 0.6 and 0.86 are quite high – i.e. they are simi-
mean annual layer thicknesses ranging between 0.35 m                     lar or slightly higher than signal-to-noise ratios of δ 18 O on
(PASO-1) and 0.60 m (DOTT-1; Table S1 in the Supple-                     the WAIS for interannual timescales (∼ 0.5–0.7) – and much
ment). Therefore, we assume diffusion to be of minor impor-              higher than those in DML (< 0.2) for multiannual to decadal
tance for inducing noise to the stable water isotope records             timescales (Münch and Laepple, 2018).
of the UG firn cores.                                                       Calculation of the signal-to-noise ratio for accumulation
   In contrast, wind drift and redistribution of snow certainly          rate time series of the UG firn cores revealed a value of
play an important role in the UG region, which is supported              0.27 for the entire record period and 0.33 for the overlap-
by data on wind speed (on average 7 ms−1 ) and wind direc-               ping period, respectively. Compared to the signal-to-noise
tion (predominantly from SW) from the two AWSs. The lo-                  ratios of δ 18 O, these values are much lower, probably reflect-
cation of the individual firn cores at different altitudes as well       ing the strong influence of the site-specific characteristics on
as in different topographic positions (near the ice-landing              accumulation rates (e.g. the different exposure to wind drift
strip, valley vs. plateau) causes site-specific differences in the       and the subsequent relocation of snow). The signal-to-noise
susceptibility towards wind drift and thus to the reallocation           ratio increases significantly when referring to the close-by
of snow. However, as there are AWS data from only one loca-              cores BAL-1, SCH-1 and SCH-2 or to SCH-1 and SCH-2
tion, i.e. the GUPA-1 drill site, for the period February 2010–          only (Tables S2 and S3). It yields 0.79 and 1.67, respec-
March 2018 available, we have no reliable meteorological in-             tively, when referring to the entire record period. This might
formation for the other firn core drill sites in order to assess         be due to the proximity of the drill sites (within 10 km dis-
the local effects of wind drift in detail. Rivera et al. (2014)          tance) and the similarity of the site-specific characteristics
report that in the UG region katabatic winds can cause strong            of the three cores, i.e. the location in northwest–southeast-
snow drift due to acceleration by the slope of the glacial val-          oriented, U-shaped glacial valleys, leading to similar accu-
leys feeding UG. Studies of drifting snow in Antarctica us-              mulation patterns. When referring to the overlapping period
ing satellite remote sensing (Palm et al., 2011) and regional            only, the signal-to-noise ratio stays at a low value of 0.24

The Cryosphere, 14, 881–904, 2020                                                             www.the-cryosphere.net/14/881/2020/
K. Hoffmann et al.: Stable water isotopes and accumulation rates in the Union Glacier region 891
Figure 6. Annual accumulation rates at the drill sites of the six firn cores from UG for the period covered by the respective firn core. Sen
slopes (s in m w.e. a−1 ) and p values (p) are given for all firn cores, indicating that snow accumulation has decreased at most sites since the
beginning of the respective record period.
for the three cores but remains high for SCH-1 and SCH- 4.2 Spatial and temporal variability of firn core stable
2 (1.2; Tables S2 and S3). In summary, the signal-to-noise water isotope composition and relation to
ratios of accumulation rates at UG are consistent with those near-surface air temperatures, sea ice and climate
determined by Schlosser et al. (2014) and Altnau et al. (2015) modes
for firn cores from Fimbul Ice Shelf, DML, and much higher
than those found in low-accumulation areas of the Amund- 4.2.1 Spatial and temporal variability of stable water
senisen mountain range, DML (Graf et al., 2002; Altnau et isotopes
al., 2015). Generally, the higher the accumulation rates at a
specific site are, the higher the signal-to-noise ratios for sta- From the inter-comparison of minimum, mean and maxi-
ble water isotopes and accumulation rates are (Hoshina et mum values of δ 18 O annual means for the overlapping pe-
al., 2014; Münch et al., 2016). Hence, the UG region with riod (1999–2013, excluding GUPA-1; Table 1 and Fig. S4),
higher accumulation rates as compared to low-accumulation generally a depletion of the stable water isotope compo-
sites on the EAIS (e.g. Oerter et al., 2000) exhibits rela- sition with increasing height (“altitudinal effect”) and dis-
tively high signal-to-noise ratios for both stable water iso- tance from the sea (“continentality effect”) has been detected
topes and accumulation rates, despite the likely influence by as expected for a Rayleigh distillation process (Clark and
post-depositional processes, in particular the redistribution of Fritz, 1997). Core PASO-1 situated at the highest altitude and
snow due to wind drift. Hence, we conclude that the UG firn greatest distance from the sea shows the lowest mean δ 18 O
core records allow one to deduce temporal changes in stable values (−36.3 ‰). In contrast, the low-altitude core DOTT-
water isotopes and accumulation rates on a regional scale. 1, which is situated closest to the sea, displays a distinctly
higher mean stable water isotope composition (−29.7 ‰).
However, core SCH-2 exhibits less depleted mean δ 18 O val-
ues (−34.1 ‰) than SCH-1 (−34.7 ‰), although located at
about 250 m higher altitude. This inverted pattern, which
is also visible in the minimum, mean and maximum δ 18 O
(δD) values derived from all samples of the respective core
(Table 1), might originate from snow reallocation processes
www.the-cryosphere.net/14/881/2020/ The Cryosphere, 14, 881–904, 2020892 K. Hoffmann et al.: Stable water isotopes and accumulation rates in the Union Glacier region Figure 7. Profiles of the stable water isotope composition (δ 18 O) of the six firn cores from UG with respect to time. Years with prominent maxima and minima in δ 18 O time series – although not visible in all cores – are highlighted by red and blue shading, respectively. The peak in summer 2002 is the only maximum found in all cores. within the glacial valley due to katabatic winds. Nonethe- can be drawn. As a result we found only a negligible positive less, the existence of an altitudinal effect is confirmed by trend in δ 18 O, which is statistically not significant. Thus, we the δ 18 O–altitude relationship calculated from δ 18 O annual infer that at UG regional changes in δ 18 O values must have means for the overlapping period (excluding GUPA-1) yield- been negligible during the last 35 years. This is in line with ing altitude = −152.7·δ 18 O–3803.4 with R 2 = 0.85 and p < findings from ice cores retrieved from the nearby Ronne– 0.05 (Fig. S6). Filchner Ice Shelf and the Weddell Sea sector, respectively, The individual firn cores are generally well correlated with that show no statistically significant trends in their stable wa- each other for δ 18 O and δD, for both the maximum overlap- ter isotope time series (e.g. Foundation Ice Stream, Graf et ping period between two individual cores and the overlap- al., 1999; Berkner Island, Mulvaney et al., 2002, and Stenni ping period (1999–2013; Tables S2 and S3). All cores dis- et al., 2017). However, it is worth mentioning that stacking play a common δ 18 O maximum in summer 2002 (Fig. 7). firn core δ 18 O time series without previous standardization Correlation coefficients are highest for nearby cores such as (excluding GUPA-1) yields a statistically significant positive SCH-1 and SCH-2, reaching up to r = 0.66 (1999–2013: trend of +0.054 ‰ a−1 (p < 0.0001; Fig. 8). This trend most r = 0.58) for δ 18 O (p < 0.05) and r = 0.71 (1999–2013: likely results from the dominance of SCH-1 and BAL-1 as r = 0.66) for δD (p < 0.01). Only core BAL-1 shows rela- these are the only cores showing statistically significant (pos- tively low correlations with all other cores except for SCH- itive) trends in their δ 18 O records (Fig. S4). 1 (r = 0.44 for δ 18 O and r = 0.43 for δD, p < 0.05; 1999– In order to detect possible changes in the origin of pre- 2013: r = 0.49 for δ 18 O and r = 0.50 for δD, p < 0.1; Ta- cipitating air masses reaching the UG region, d-excess time bles S2 and S3). The results of the cross-correlation anal- series of individual firn cores have been inter-compared ysis, the negligible influence of diffusion and the relatively (Fig. S5). In line with δ 18 O, the d excess does not show clear high signal-to-noise ratios allowed us to construct a com- trends or similar contemporaneous changes among the firn posite δ 18 O record (UG δ 18 O stack) based on standardized cores, suggesting little change in the main moisture sources annually averaged data spanning the period that comprises and the origin of air masses precipitating over the UG region at least three core records per year (1980–2014, excluding at least during the last four decades. The composite d-excess GUPA-1; Fig. 8). From the UG δ 18 O stack a more regional record (UG d-excess stack; excluding GUPA-1), which has picture of the isotopic characteristics of precipitation at UG been calculated despite the individual firn cores showing no The Cryosphere, 14, 881–904, 2020 www.the-cryosphere.net/14/881/2020/
K. Hoffmann et al.: Stable water isotopes and accumulation rates in the Union Glacier region 893
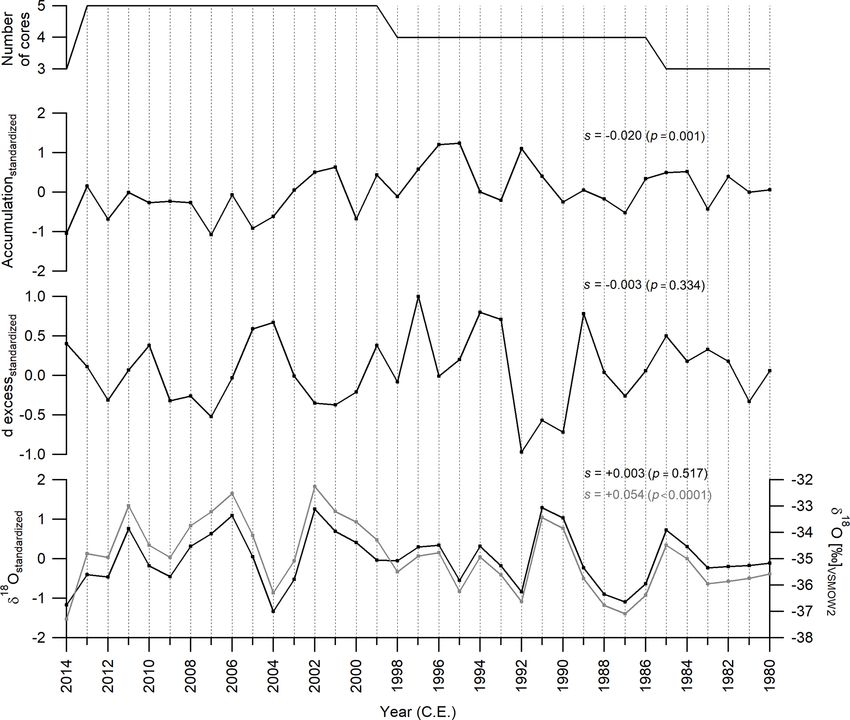
Figure 8. Composite records of mean annual δ 18 O, d excess and snow accumulation in the UG region for the period 1980–2014 derived from
standardized data (black; excluding firn core GUPA-1). Sen slopes (s) and p values (p) are given for each record. For δ 18 O, the composite
record derived from non-standardized annually averaged data (grey) is also displayed as it exhibits a statistically significant positive trend
that is worth mentioning (s in ‰ a−1 ).
Table 2. Results of cross-correlation analysis for stable water isotope and accumulation composite records from UG and time series of the
SAM index, multivariate ENSO index (MEI) and sea ice extent (SIE) in five different Antarctic sectors (annual means). Cross-correlations
were calculated considering the record period that is covered by a minimum of three firn cores (1980–2014; excluding firn core GUPA-1).
Prominent correlations with a low p value (p < 0.1) are marked in bold and if statistically significant (p < 0.01, α = 0.05) in bold and italic.
SIE SIE SIE
SAM SIE Bellingshausen– Indian Western SIE
1980–2014 δ 18 O δD d excess Accumulation index MEI Weddell Amundsen Ocean Pacific Ross
δ 18 O 1 0.995 −0.214 0.192 −0.089 −0.200 −0.247 −0.116 −0.036 0.061 0.116
p 0 0.000 0.217 0.269 0.613 0.249 0.165 0.521 0.841 0.737 0.520
δD 1 −0.128 0.188 −0.054 −0.214 −0.264 −0.106 −0.003 0.085 0.119
p 0 0.464 0.279 0.758 0.218 0.138 0.559 0.985 0.639 0.511
d excess 1 −0.051 0.376 0.024 −0.205 0.103 0.315 0.169 −0.068
p 0 0.772 0.026 0.890 0.253 0.570 0.074 0.348 0.707
Accumulation 1 −0.110 0.055 −0.056 0.127 −0.295 −0.005 −0.140
p 0 0.531 0.753 0.759 0.482 0.095 0.980 0.438
SAM index 1 −0.101 −0.223 −0.213 0.629 0.403 0.390
p 0 0.563 0.211 0.233 0.000 0.020 0.025
MEI 1 0.165 0.171 −0.411 0.025 –0.512
p 0 0.358 0.343 0.018 0.891 0.002
www.the-cryosphere.net/14/881/2020/ The Cryosphere, 14, 881–904, 2020894 K. Hoffmann et al.: Stable water isotopes and accumulation rates in the Union Glacier region
cross-correlations in the d excess (Tables S2 and S3), corrob-
orates this finding. It shows no statistically significant trend
for the period 1980–2014 (Fig. 8). Dissimilarities between
d-excess trends of individual firn cores might be partly ex-
plained by the presence of orographic barriers that separate
the different drill sites from each other. This might lead to
dissimilarities in moisture sources, even though the drill sites
are located within an only 50 km horizontal distance.
4.2.2 Relation of stable water isotopes to near-surface
air temperature records
Linear regression between stacked seasonal means of non-
standardized firn core δ 18 O and seasonal means of AWS-
derived near-surface air temperature for the overlapping pe-
riod February 2010–November 2015 (Fig. S7) revealed a sta-
tistically significant positive δ 18 O−T relationship (δ 18 O =
0.175 · T –31.6, R 2 = 0.21, p < 0.05). In order to test the
δ 18 O−T relationship for the entire period covered by the UG
δ 18 O stack (1980–2014), monthly means of ERA-Interim
near-surface air temperature were correlated with those de-
rived from the AWS records for the period February 2010–
November 2015. We used ERA-Interim near-surface air tem-
peratures extracted for the grid point which is nearest to the
GUPA-1 drill site (Table 1) as this is the firn core site clos-
est to the two AWSs. Monthly mean air temperatures from
both datasets are highly and statistically significantly cor-
related (R 2 = 0.99, p < 0.0001). This allows one to calcu-
late a δ 18 O−T relationship for the period 1980–2014 based
on seasonal means of ERA-Interim near-surface air tempera-
tures and stacked seasonal means of non-standardized UG
δ 18 O. The latter yields δ 18 O = 0.128 · T –31.7 (R 2 = 0.22,
p < 0.0001) that is very similar to the δ 18 O−T relation-
ship calculated based on AWS data for the period 2010–
2015 (Fig. S7). Thus, independent of the period considered
we conclude that increasing air temperatures are generally
linked with increasing δ 18 O values. However, as this rela-
tionship is only weak, a proper inference of near-surface air
temperatures from δ 18 O values of precipitation is not yet pos-
sible for the UG region. This is due to (1) the shortness of
the available near-surface air temperature record and (2) the
arbitrary calculation of δ 18 O seasonal means assuming that
precipitation at the study site is evenly distributed through-
Figure 9. Spatial correlations (r) of annually averaged ERA- out the year.
Interim (a) near-surface air temperatures (2 m), (b) geopotential In order to further test the δ 18 O−T relationship, the UG
18
δ O stack was spatially correlated with ERA-Interim near-
heights (850 mbar) and (c) precipitation–evaporation with standard-
ized mean annual (a) δ 18 O, (b) d excess and (c) snow accumulation surface air temperatures for the period 1980–2014 (Fig. 9a).
in the UG region (red star) for the period 1980–2014 (excluding No correlation was found with ERA-Interim-based near-
firn core GUPA-1). All time series were detrended before calcu- surface air temperatures at the UG site but instead with those
lating spatial correlations. Only statistically significant correlations further to the east (Coats Land and DML; up to r > 0.4,
(p < 0.05) are displayed. For (a) and (c) December–November an- p < 0.05; Figs. 1a and 9a). This might be due to the ERA-
nual averages (calendar year) were used, whereas for (b) August– Interim model not properly capturing the local small-scale
July annual averages (winter–winter) were considered as spatial
orography of the Ellsworth Mountains. Hence, the ERA-
correlations appear more significant than for December–November
annual averages.
Interim model does not truly reflect the local climate at the
UG site but rather the regional climate along the Weddell
The Cryosphere, 14, 881–904, 2020 www.the-cryosphere.net/14/881/2020/You can also read