Aircraft measurements of aerosol and trace gas chemistry in the eastern North Atlantic
←
→
Page content transcription
If your browser does not render page correctly, please read the page content below
Atmos. Chem. Phys., 21, 7983–8002, 2021
https://doi.org/10.5194/acp-21-7983-2021
© Author(s) 2021. This work is distributed under
the Creative Commons Attribution 4.0 License.

Aircraft measurements of aerosol and trace
gas chemistry in the eastern North Atlantic
Maria A. Zawadowicz1,d , Kaitlyn Suski1,c , Jiumeng Liu1,b , Mikhail Pekour1 , Jerome Fast1 , Fan Mei1 ,
Arthur J. Sedlacek2 , Stephen Springston2 , Yang Wang3,a , Rahul A. Zaveri1 , Robert Wood4 , Jian Wang3 , and
John E. Shilling1
1 Atmospheric  Sciences and Global Change Division, Pacific Northwest National Laboratory, Richland, WA 99352, USA
2 Environmental  and Climate Sciences Department, Brookhaven National Laboratory, Upton, NY 11973, USA
3 Department of Energy, Environmental and Chemical Engineering, Washington University in St. Louis,

Saint Louis, MO 63130, USA
4 Department of Atmospheric Science, University of Washington, Seattle, WA 98195, USA
a now at: Department of Civil, Architectural and Environmental Engineering,

Missouri University of Science and Technology, Rolla, MO 65409, USA
b now at: School of Environment, Harbin Institute of Technology, Harbin, Heilongjiang, China
c now at: JUUL Labs, San Francisco, CA 94107, USA
d now at: Environmental and Climate Sciences Department, Brookhaven National Laboratory, Upton, NY 11973, USA

Correspondence: John E. Shilling (john.shilling@pnnl.gov)

Received: 25 August 2020 – Discussion started: 5 November 2020
Revised: 25 February 2021 – Accepted: 11 April 2021 – Published: 26 May 2021

Abstract. The Aerosol and Cloud Experiment in the East-         of 0.6 µg m−3 in the summer and 0.1 µg m−3 in the win-
ern North Atlantic (ACE-ENA) investigated properties of         ter, measured by the AMS. Average concentrations of the
aerosols and subtropical marine boundary layer (MBL)            trace reactive gases methanol and acetone were 1–2 ppb;
clouds. Low subtropical marine clouds can have a large effect   benzene, toluene and isoprene were even lower, < 1 ppb.
on Earth’s radiative budget, but they are poorly represented    Mass fractions of sulfate, organics, ammonium and nitrate
in global climate models. In order to understand their radia-   in the boundary layer were 69 %, 23 %, 7 % and 1 % and re-
tive effects, it is imperative to understand the composition    mained largely similar between seasons. The aerosol chem-
and sources of the MBL cloud condensation nuclei (CCN).         ical composition was dominated by sulfate and highly pro-
The campaign consisted of two intensive operation peri-         cessed organics. Particulate methanesulfonic acid (MSA),
ods (IOPs) (June–July 2017 and January–February 2018)           a well-known secondary biogenic marine species, was de-
during which an instrumented G-1 aircraft was deployed          tected, with an average boundary layer concentration of
from Lajes Field on Terceira Island in the Azores, Portu-       0.021 µg m−3 , along with its gas-phase precursor, dimethyl
gal. The G-1 conducted research flights in the vicinity of      sulfide (DMS). MSA accounted for no more than 3 % of
the Atmospheric Radiation Measurement (ARM) Eastern             the submicron, non-refractory aerosol in the boundary layer.
North Atlantic (ENA) atmospheric observatory on Graciosa        Examination of vertical profiles of aerosol and gas chem-
Island. An Aerodyne high-resolution time-of-flight aerosol      istry during ACE-ENA reveals an interplay of local marine
mass spectrometer (HR-ToF-AMS) and Ionicon proton-              emissions and long-range-transported aged aerosol. A case
transfer-reaction mass spectrometer (PTR-MS) were de-           of transport of biomass burning emissions from North Amer-
ployed aboard the aircraft, characterizing chemistry of non-    ican fires has been identified using back-trajectory analy-
refractory aerosol and trace gases, respectively. The eastern   sis. In the summer, the non-refractory portion of the back-
North Atlantic region was found to be very clean, with an       ground CCN budget was heavily influenced by aerosol asso-
average non-refractory submicrometer aerosol mass loading       ciated with ocean productivity, in particular sulfate formed

Published by Copernicus Publications on behalf of the European Geosciences Union.
7984        M. A. Zawadowicz et al.: Aircraft measurements of aerosol and trace gas chemistry in the E North Atlantic

from DMS oxidation. Episodic transport from the conti-            and carbohydrates (Quinn and Bates, 2011). However, it has
nents, particularly of biomass burning aerosol, periodically      also been shown that sea salt contributes only 30 % to the
increased CCN concentrations in the free troposphere. In the      CCN budget in midlatitudes, and secondary, possibly DMS
winter, with ocean productivity lower, CCN concentrations         derived, non-sea-salt sulfate can dominate most MBL CCN
were overall much lower and dominated by remote trans-            budgets (Quinn et al., 2017). This secondary source of CCN
port. These results show that anthropogenic emissions per-        has been shown to be important in the ENA region (Zheng et
turb CCN concentrations in remote regions that are sensi-         al., 2018). Because the emissions of marine VOCs and chem-
tive to changes in CCN number and illustrate that accurate        istry of both primary and secondary marine organic aerosol
predictions of both transport and regional aerosol formation      are controlled by ocean ecosystems, they are likely impacted
from the oceans are critical to accurately modeling clouds in     by climate change. Sea surface temperatures drive marine
these regions.                                                    phytoplankton diversity, and the distributions of phytoplank-
                                                                  ton species in the warming ocean are likely to shift in the
                                                                  near future (Flombaum et al., 2013; Righetti et al., 2019). A
                                                                  recent modeling study by Wang et al. (2018) found signifi-
1   Introduction                                                  cant radiative effects from such broad community shifts. Un-
                                                                  derstanding complex relationships between ocean diversity,
Interactions of atmospheric aerosols with clouds and precip-      aerosol chemistry and MBL clouds is of critical importance
itation are a vital, yet uncertain, part of the climate system.   in the changing climate.
Indirect aerosol radiative forcing effects are associated with       Apart from local oceanic sources of aerosols, such as
large uncertainties in global climate models (Boucher et al.,     DMS oxidation and ejection of sea salt, the remote MBL
2013), and they are poorly constrained, with a factor of 5        can also be impacted by long-range continental transport.
variation across different models (Quaas et al., 2009). An        Biomass burning plumes can be effectively transported be-
effect that is especially relevant to these clouds is the first   tween the continents (Brocchi et al., 2018), as the aerosols
indirect or Twomey effect (Twomey, 1974), which accounts          are injected into the free troposphere or the stratosphere. Sec-
for changes to cloud albedo resulting from perturbations in       ondary aerosols of continental origins, such as secondary or-
aerosol concentration and therefore the cloud condensation        ganic aerosol (SOA) produced by oxidation of VOCs, can
nuclei (CCN) availability. Remote marine clouds are partic-       also potentially reach the remote atmosphere. Recent stud-
ularly susceptible to perturbations in aerosol concentrations     ies have shown that SOA may be more resistant to evapora-
because they are relatively optically thin, and the background    tion than previously thought, increasing the SOA lifetime and
aerosol concentrations in the remote MBL are low (Bony            the distances it can be transported (Shrivastava et al., 2013,
and Dufresne, 2005; Carslaw et al., 2013; Quaas et al., 2009;     2015; Vaden et al., 2010, 2011; Zelenyuk et al., 2012). Fur-
Wood, 2005). However, by itself, the Twomey effect is insuf-      thermore, recent research has shown that while the lifetime
ficient in explaining all indirect effects (Wood, 2007). Fac-     of most biogenic SOA is shorter than their mechanical re-
tors such as aerosol suppression of precipitation can also be     moval timescales, there exists a fraction of non-photolabile
important (Wood, 2005; Wood et al., 2015), highlighting the       SOA that could potentially have long lifetimes and be ef-
need for measurement of aerosol and cloud properties in the       fectively transported into the remote regions (O’Brien and
remote MBL.                                                       Kroll, 2019; Zawadowicz et al., 2020). In summary, the
   Sources of CCN in the MBL have been at the center of           MBL CCN budget is composed of primary ocean emis-
much research for several decades. Early studies have hy-         sions (sea salt and primary organics), secondary aerosols de-
pothesized that dimethyl sulfide (DMS), a volatile organic        rived from ocean biogenic VOCs and aerosols transported
compound (VOC) produced by phytoplankton, is a major              remotely from the continents. The specific local variations of
source of secondary sulfate aerosols, which then dominate         those sources, their seasonality, and the exact mixing states of
the marine CCN budget (Charlson et al., 1987). This came          MBL aerosols are difficult to predict due to a lack of detailed
to be known as the CLAW hypothesis, which posits a feed-          chemical measurements of aerosol in remote marine regions
back loop between ocean biochemistry, marine cloud prop-          yet crucial for understanding cloud properties and radiative
erties and climate (Charlson et al., 1987). More recently, it     forcing in these areas.
has been shown that there are factors, such as additional sea        This study focuses on chemical measurements of non-
salt sources of CCN in the MBL or complex interactions            refractory aerosol and trace gas composition vertical profiles,
between CCN and aerosol–cloud interactions, that prevent          from the Aerosol and Cloud Experiment in the Eastern North
DMS-derived sulfate from being directly involved in a cli-        Atlantic (ACE-ENA), a US Department of Energy (DOE)
mate feedback mechanism (Quinn and Bates, 2011). Sea salt         airborne measurement campaign. The site of these measure-
sources of CCN that compete with DMS-derived sulfate in-          ments is the Azores archipelago in the eastern North At-
clude primary organic species emitted together with sea salt      lantic (Fig. 1), which is uniquely suited for characterization
upon bubble bursting, which is a mixture of fragments of ma-      of both marine and long-range-transported aerosol proper-
rine biota, their exudates, and other simple proteins, lipids,    ties and various meteorological conditions favorable to both

Atmos. Chem. Phys., 21, 7983–8002, 2021                                             https://doi.org/10.5194/acp-21-7983-2021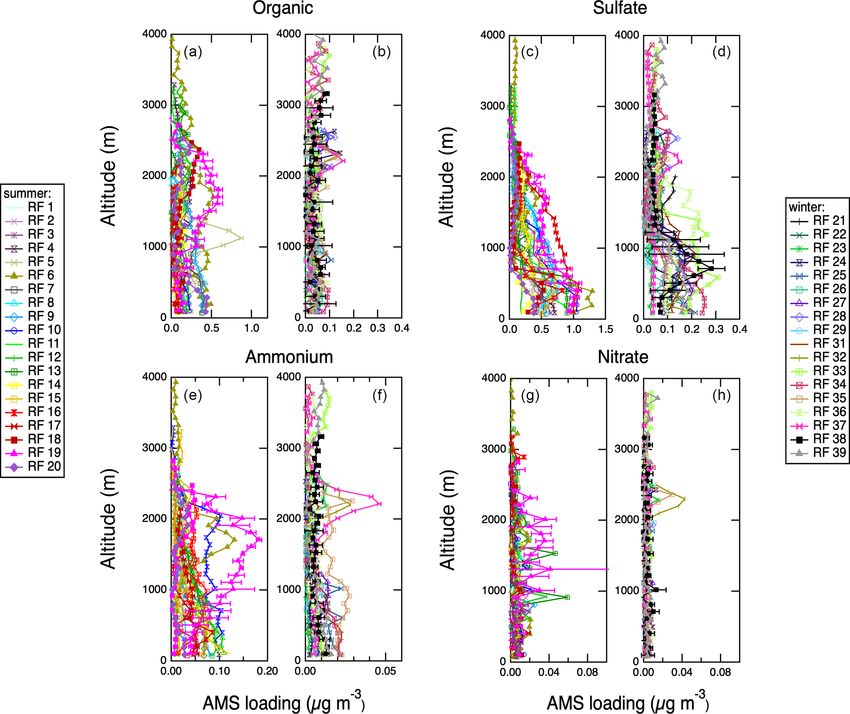
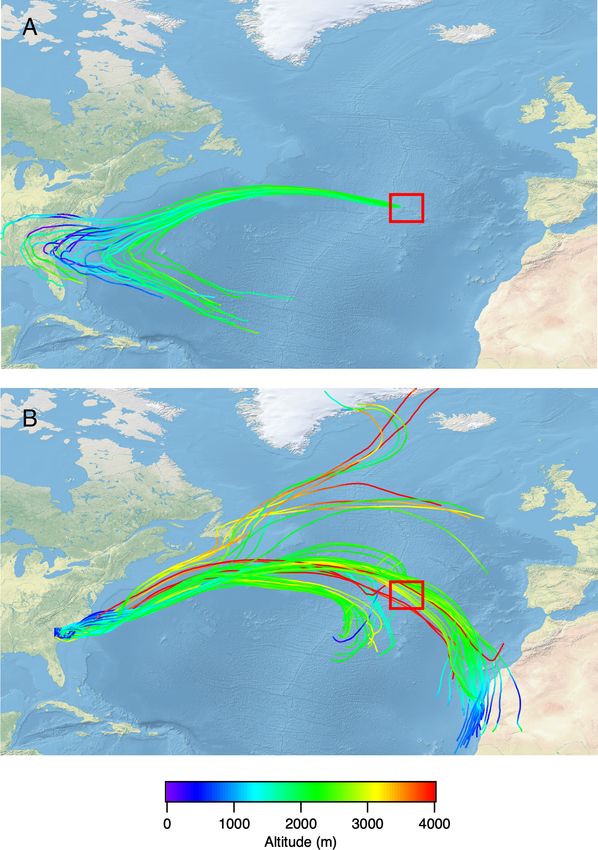
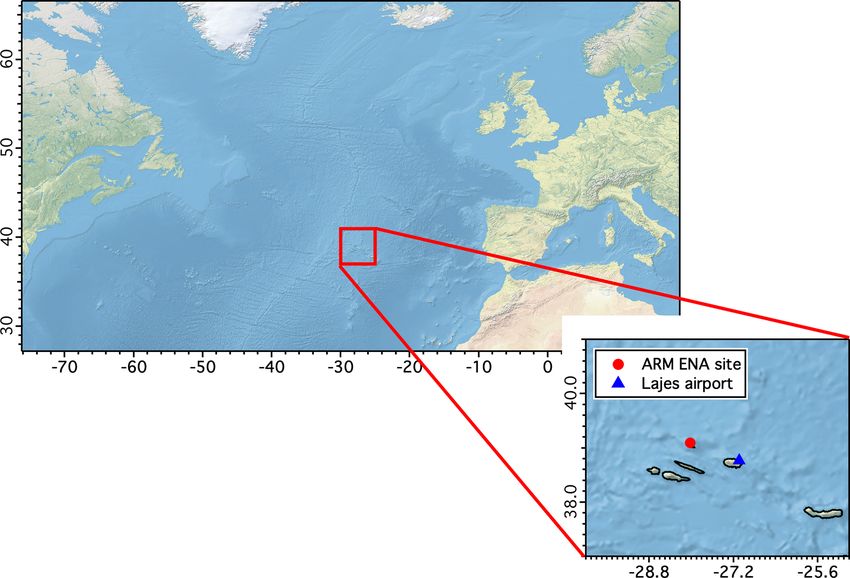
M. A. Zawadowicz et al.: Aircraft measurements of aerosol and trace gas chemistry in the E North Atlantic                     7985

of these CCN composition regimes. Graciosa Island in the
Azores is also the location of a permanent DOE Atmospheric
Radiation Measurement (ARM) user facility measurement
site. Because the Azores straddle the boundary between sub-
tropics and midlatitudes, they experience a wide range of
meteorological conditions throughout the year (Wood et al.,
2015). There is a marked seasonality in the wind patterns
near the Graciosa site: in the winter, there is a strong gra-
dient of surface pressure between the Icelandic low and the
Azores high-pressure systems, and the winds tend to have
high average speeds and come from the southwest (Wood et
al., 2015). In the summer, the Icelandic low disappears and
the Azores high-pressure system strengthens, which is asso-
ciated with winds predominantly from the northwest with
lower average wind speeds (Wood et al., 2015). The high          Figure 1. Geographical location of the Azores archipelago, the site
wind speeds are responsible for higher sea salt contribu-        of the ACE-ENA campaign. The map was created using public
tions to the ENA CCN budget in the winter (Zheng et al.,         domain map data on Natural Earth (https://www.naturalearthdata.
2018). This pattern is also responsible for the seasonal peak    com/, last access: 12 March 2020) and the GSHHG database (https:
in total cloud fraction, which occurs the winter (Wood et al.,   //ngdc.noaa.gov/mgg/shorelines/, last access: 12 March 2020).
2015). This dynamic complexity makes it difficult to attribute
sources of aerosols in the ENA region because the MBL
air masses are continually diluted with free-tropospheric air    CLES), which included aircraft deployments of a suite of in-
on a timescale of several days (Wood et al., 2015). As ob-       struments, including the aerosol mass spectrometer (AMS),
served during the Clouds, Aerosol, and Precipitation in the      in the southeastern Atlantic. The AMS has a long field de-
Marine Boundary Layer (CAP-MBL) campaign, marine air             ployment history on a variety of platforms (Zhang et al.,
masses can have continental features due to the entrainment      2007), but particle composition measurements in remote
from the free troposphere (Wood et al., 2015). Previous mea-     marine environments are of recent interest. Between 2011
surements on Pico Island also indicate a seasonal summer         and 2012, an AMS was deployed aboard the German re-
peak in carbon monoxide due to long-range transport from         search vessel Polarstern during four cruises in the Atlantic
North America (Val Martin et al., 2008). Additionally, single-   Ocean (Huang et al., 2017, 2018). The average aerosol com-
scattering albedo measurements during CAP-MBL indicate           position was found to be ∼ 50 % sulfate and ∼ 20 % organic
that the aerosols are more absorbing during springtime, also     (Huang et al., 2018). The organic component was further
consistent with transport of North American biomass burning      analyzed with positive matrix factorization, and it was de-
aerosols (Logan et al., 2014).                                   termined to be a mixture of primary and secondary (DMS-
   The atmospheric chemistry of the North Atlantic region,       and amine-derived) marine aerosol and aerosol transported
including the Azores, has been studied in previous oceano-       from North America (Huang et al., 2018). Between 2016
graphic cruises (Andreae et al., 2003) and aircraft cam-         and 2017, AMS was also deployed aboard the NASA DC-8
paigns. Early work on sulfur cycle in the eastern North At-      aircraft during the Atmospheric Tomography (ATom) mis-
lantic has been summarized by Galloway et al. (1992). No-        sions in the remote atmosphere, including the North At-
table campaigns in the region include the Atlantic Stratocu-     lantic region (Hodshire et al., 2019). In 2015, AMS was
mulus Transition Experiment/Marine Aerosol and Gas Ex-           also deployed on aircraft as a part of the Network on Cli-
change (ASTEX/MAGE) (Blomquist et al., 1996) and the             mate and Aerosols: Addressing Key Uncertainties in Remote
second Aerosol Characterization Experiment (ACE-2) (Raes         Canadian Environments (NETCARE) project in the Cana-
et al., 2000). Of note are also studies on the west coast of     dian high Arctic (Abbatt et al., 2019; Willis et al., 2019). A
Ireland at the Mace Head observatory, which frequently en-       unique feature of the ACE-ENA aircraft deployments is the
counter North Atlantic air masses, as described in Dall’Osto     seasonally resolved measurements during summer and win-
et al. (2010) and Ovadnevaite et al. (2014).                     ter in the eastern North Atlantic region.
   More recent field measurements focusing on the aerosol           In this study, we focus on chemical characterization of
chemistry of the North Atlantic region include the               aerosol and trace gases during ACE-ENA. We present av-
NASA North Atlantic Aerosols and Marine Ecosystems               erage concentrations of sulfate, total organics, ammonium,
Study (NAAMES), which included both aircraft and ship-           and nitrate aerosol components and mixing ratios of trace
borne observations focused on marine biological productiv-       gases such as methanol, acetone, DMS, isoprene, toluene
ity of the western North Atlantic (Behrenfeld et al., 2019),     and benzene. In addition, concentrations of particle-phase
and the African biomass-burning-focused NASA Observa-            methanesulfonic acid (MSA), an oxidation product of DMS,
tions of Aerosols above Clouds and their Interactions (ORA-      were derived using aircraft measurements and laboratory cal-

https://doi.org/10.5194/acp-21-7983-2021                                           Atmos. Chem. Phys., 21, 7983–8002, 2021
7986        M. A. Zawadowicz et al.: Aircraft measurements of aerosol and trace gas chemistry in the E North Atlantic

ibrations. We also discuss vertical profiles of these quan-           The AMS sampled from two G-1 inlets, an isokinetic
tities in context of other G-1 measurements, meteorology           aerosol inlet and a counterflow virtual impactor (CVI) in-
and Hybrid Single-Particle Lagrangian Integrated Trajectory        let. Sample streams between two inlets were switched by
model (HYSPLIT) (Stein et al., 2015) back trajectories to          the instrument operator aboard the aircraft based on the pres-
elucidate the sources of ENA aerosols.                             ence of clouds. This paper limits the discussion to data ob-
                                                                   tained during the isokinetic inlet sampling. The isokinetic
                                                                   inlet transmission efficiency is greater than 95 % for 0.01–
2     Experimental                                                 5 µm diameter particles. It should be noted that this study is
                                                                   not sensitive to sea salt because AMS, which uses thermal
The ACE-ENA campaign was conducted around the Azores
                                                                   desorption as a component of its ionization system, is not
archipelago in the eastern North Atlantic from 1 June 2017 to
                                                                   sensitive to refractory particle compositions.
28 February 2018. During this period, the DOE G-1 research
                                                                      Apart from regular calibrations with monodisperse ammo-
aircraft, based out of Lajes Field on Terceira Island (Fig. 1),
                                                                   nium nitrate, AMS was also calibrated for MSA in the labo-
was deployed for two intensive operation periods (IOPs),
                                                                   ratory after the campaign. The details of this calibration are
consisting of flights around the Graciosa Island ENA ARM
                                                                   discussed in the Supplement.
research site. The first aircraft deployment period occurred
in the summer, from 1 June to 31 July 2017, and the second
                                                                   2.2   Trace gas mass spectrometry
occurred in the winter, from 1 January 2018 to 28 Febru-
ary 2019. During the summertime deployment period, the
                                                                   An Ionicon quadrupole high-sensitivity proton-transfer-
aircraft completed 20 research flights, and during the win-
                                                                   reaction mass spectrometer (abbreviated as PTR-MS here-
ter, it completed 19 research flights (Table S1 in the Supple-
                                                                   after) was used to measure selected gas-phase VOC concen-
ment). Figure S1 in the Supplement shows flight tracks for all
                                                                   trations. The PTR-MS was run in ion monitoring mode in
research flights. In general, the flight plans were focused on
                                                                   which signals of a limited number of pre-selected m/z values
multiple L-shaped transits at different altitudes with the ENA
                                                                   are sequentially measured, with one measurement cycle tak-
site as the focal point, with occasional excursions to other
                                                                   ing 3.5 s. Drift tube temperature, pressure and voltage were
cloud layers. Each research flight also typically included at
                                                                   held at 60 ◦ C, 2.22 hPa and 600 V, respectively. The PTR-MS
least one spiral profile through the atmosphere to character-
                                                                   sampled air through a dedicated inlet that consisted of ap-
ize the boundary layer structure. The locations of spiral pro-
                                                                   proximately 6 in. (15.24 cm) of 1/4 in. (6.35 mm) o.d. stain-
files are shown in Fig. S1c and d and included in Table S1.
                                                                   less steel with 0.035 in. (0.89 mm) wall thickness, followed
This study uses the vertical profiles to explore the marine and
                                                                   by approximately 46 in. (116.84 cm) of 1/4 in. (6.35 mm)
continental influences on aerosol composition.
                                                                   o.d. (3/16 in. (4.76 mm) i.d.) Teflon tubing, including a
2.1    Aerosol mass spectrometry                                   Teflon filter, and 36 in. (91.44 cm) of 1/16 in. (1.59 mm)
                                                                   o.d. (0.055 in. (1.40 mm) i.d.) PEEK tubing. To assess the
An Aerodyne high-resolution time-of-flight aerosol mass            PTR-MS background, air was periodically diverted through
spectrometer (DeCarlo et al., 2006) (abbreviated as AMS            a stainless-steel tube filled with a Shimadzu platinum catalyst
hereafter) was deployed aboard the G-1 to measure non-             heated to 600 ◦ C, which removed VOCs from the airstream
refractory aerosol chemical composition. The AMS operated          without perturbing the water vapor content. The PTR-MS
only in the standard “V” mass spectrometer mode with 13 s          was calibrated by introducing known concentrations of cal-
data averaging intervals and equal chopper open and closed         ibration gases into the instrument with variable dilution by
periods of 3 s. The particle sizing mode was not used. The         VOC-free air. Two different calibration tanks were used: one
standard aerodynamic lens was used, and the AMS vaporizer          in the field and one in the lab before and after the IOPs. Much
was set to 600 ◦ C. Before and after the flights, air was di-      of the summer IOP PTR-MS data were affected by a loss of
verted through a HEPA filter to remove the particulates, and       sensitivity resulting from a faulty electrical connection in the
these periods were used to account for gas-phase interfer-         quadrupole. Additionally, DMS backgrounds throughout the
ences with isobaric particulate signals. The AMS was regu-         summer campaign were found to be elevated, even with the
larly calibrated in the field using monodisperse ammonium          flow diverted through the catalyst. This could be due to an
nitrate particles quantified with a TSI condensation particle      isobaric interference or incomplete removal of DMS by the
counter (CPC), as described in the literature (Canagaratna et      catalyst. Absolute concentrations of DMS, especially during
al., 2007; Jayne et al., 2000). A collection efficiency of unity   the summer intensive period, are biased high due to these
is applied to data collected here, due to high acidity of the      factors and should be regarded as largely qualitative.
marine environment (Middlebrook et al., 2012). AMS data
were processed using the ToF-AMS analysis toolkit Squirrel         2.3   Supporting measurements
version 1.60N and ToF-AMS HR analysis toolkit Pika ver-
sion 1.20N.                                                        Ozone was measured with a Thermo Scientific Model 49i
                                                                   ozone analyzer based on measurement of UV absorption at

Atmos. Chem. Phys., 21, 7983–8002, 2021                                              https://doi.org/10.5194/acp-21-7983-2021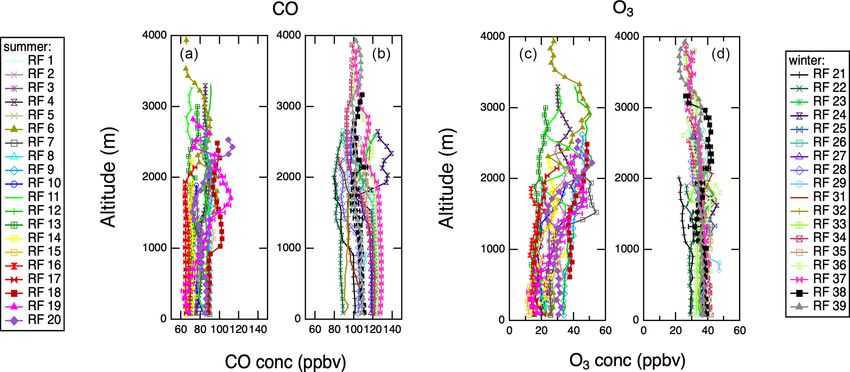
M. A. Zawadowicz et al.: Aircraft measurements of aerosol and trace gas chemistry in the E North Atlantic                   7987

254 nm. The instrument was regularly calibrated in flight by     Table 1. Summary of AMS measurements aboard the G-1 during
displacement of known quantities of ozone and zeroed in          ACE-ENA.
flight using ozone-scrubbed ambient air. CO was measured
using a Los Gatos Research CO–N2 O–H2 O analyzer based                                   IOP 1, summer      IOP 2, winter
on cavity-enhanced near-IR absorption and was also cali-                                Mean    Median     Mean    Median
brated regularly in flight. Refractory black carbon concentra-
                                                                      Altitudes < 1000 m
tion was measured using a Droplet Measurement Technolo-
gies (DMT) single-particle soot photometer (SP2). The SP2             Organic           0.175   0.142      0.040    0.039
was calibrated at the beginning, during and at the end of the         Sulfate           0.548   0.529      0.111    0.090
deployment using fullerene soot in order to closely mimic the         Ammonium          0.051   0.050      0.009    0.007
morphology of ambient black carbon. CCN concentrations                Nitrate           0.005   0.004      0.003    0.003
were measured with the Droplet Measurement Technologies               MSA               0.021   0.019      0.002    0.001
CCN-200 cloud condensation nuclei counter. A CCN counter              Altitudes 1000–3000 m
draws ambient aerosol through a column with supersaturated
                                                                      Organic           0.115   0.088      0.032    0.029
water vapor, where it can activate into cloud droplets. The           Sulfate           0.182   0.129      0.056    0.042
instrument then sizes and counts activated ambient aerosol            Ammonium          0.029   0.019      0.005    0.003
as a function of supersaturation (Roberts and Nenes, 2005).           Nitrate           0.005   0.003      0.002    0.002
A two-column CCN counter was used on the G-1, with one                MSA               0.003   0.002      0.001      0
column at 0.1 % supersaturation and the other at 0.3 % super-
                                                                      All altitudes
saturation. The instrument was calibrated with size-selected
ammonium sulfate. G-1 position and altitude and wind direc-           Organic           0.146   0.116      0.036    0.034
tion and velocity were measured using an Aventech AIMMS-              Sulfate           0.375   0.328      0.078    0.056
20 probe.                                                             Ammonium          0.040   0.030      0.007    0.004
                                                                      Nitrate           0.005   0.004      0.003    0.002
                                                                      MSA               0.012   0.008      0.001    0.001

3     Results

3.1     Background aerosol and trace gas composition in          GoAmazon 2014/15 in the central Amazon basin, a remote
        the eastern North Atlantic                               continental location, during the wet season were 0.91, 0.16,
                                                                 0.05 and 0.02 µg m−3 respectively (Shilling et al., 2018).
3.1.1    Aerosol chemistry                                       AMS measurements of organics, sulfate, ammonium and ni-
                                                                 trate from the NEAQS 2002 campaign measured from a
Figure 2 and Table 1 summarize AMS measurements ob-              ship in the vicinity of the NE USA, a likely source region
tained during the 39 ACE-ENA research flights. In the            of transported aerosol, were 5.0, 2.1, 0.65 and 0.30 µg m−3
summer MBL, mean loadings for organics, non-sea-salt             respectively (de Gouw et al., 2005; Zhang et al., 2007).
sulfate, ammonium and nitrate were 0.18, 0.55, 0.05 and          AMS measurements of the same species aboard research
0.01 µg m−3 , respectively (Table 1). These are low concen-      ship Polarstern during the North Atlantic transect along
trations, illustrating clean conditions in the remote ENA re-    the coast of Europe and Africa were 0.53, 1.38, 0.29 and
gion. The low abundance of nitrate is expected given the         0.09 µg m−3 , respectively, in the spring and 0.47, 0.76,
minor influence of anthropogenic pollution over the remote       0.20 and 0.07 µg m−3 , respectively, in the winter (Huang et
North Atlantic. Low ammonium is also expected, given the         al., 2018). The NAAMES cruises in the western North At-
distance from ammonia emissions. In the summer free tropo-       lantic provide another point of comparison: in the winter, the
sphere, mean loadings of the same species were 0.12, 0.18,       loadings of organics, non-sea-salt sulfate, ammonium and ni-
0.03 and 0.01 µg m−3 , respectively (Table 1). In the MBL,       trate were 0.14/0.56, 0.15/0.48, < 0.01/0.01 and 0.01/0.03,
mean winter loadings for organics, non-sea-salt sulfate, am-     respectively, and in the late spring they were 0.61/1.62,
monium and nitrate were 0.04, 0.11, 0.01 and 0.003 µg m−3 ,      0.44/0.64, < 0.01/0.13 and 0.02/0.14, respectively, for ma-
respectively (Table 1). In the free troposphere, mean win-       rine/continental air mass origin (Saliba et al., 2020). Thus,
ter loadings for the same species were 0.03, 0.06, 0.01 and      the AMS measurements during ACE-ENA represent some
0.002 µg m−3 , respectively (Table 1). Apart from low average    of the cleanest conditions measured with AMS, and they are
abundance, these measurements also show strong seasonality       broadly consistent with other measurements in marine envi-
with significantly lower concentrations of all aerosol species   ronments.
observed in the winter campaign. For both organics and non-         Figure 3 shows a flight-by-flight summary of AMS-
sea-salt sulfate, abundances during the summer were 4 times      derived MSA measurements obtained using a laboratory cal-
larger than in the winter. For comparison, mean organic,         ibration, as outlined in the Experimental section. MSA mea-
sulfate, ammonium and nitrate concentrations measured in         surements shown in Fig. 3 are for altitudes below 1000 m,

https://doi.org/10.5194/acp-21-7983-2021                                              Atmos. Chem. Phys., 21, 7983–8002, 2021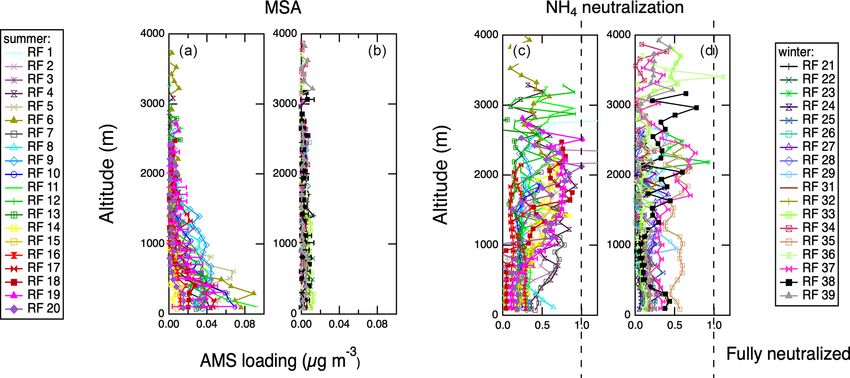
7988         M. A. Zawadowicz et al.: Aircraft measurements of aerosol and trace gas chemistry in the E North Atlantic

Figure 2. Summary of aerosol chemistry measurements acquired with the HR-ToF-AMS aboard the G-1 aircraft during ACE-ENA. Boxes
are centered on daily medians, box boundaries extend between the 25th and 75th percentile, and whiskers extend between the 10th and
90th percentile. (a, c) IOP 1 measurements. (b, d) IOP 2 measurements. Panels (a)–(d) are for and altitude window of 1000–3000 m.

Figure 3. Summary of methanesulfonic acid (MSA) measurements derived from the AMS mass spectra collected during ACE-ENA and
laboratory calibrations as described in the Experimental section, expressed as total particle-phase MSA (a, b) and percentage of total AMS
sulfate signal (c, d). Boxes are centered on daily medians, box boundaries extend between the 25th and 75th percentile, and whiskers extend
between the 10th and 90th percentile. (a, c) IOP 1 measurements. (b, d) IOP 2 measurements. Panels (a)–(d) are for an altitude window
< 1000 m.

which are expected to show the strongest marine influence.              tions measured during ACE-ENA is comparable to other
Campaign averages for MSA are also summarized in Ta-                    MSA measurements over the eastern North Atlantic; for
ble 1. Average MSA concentrations for altitudes < 1000 m                example, Huang et al. (2017) reports 0.04 µg m−3 in the
during the summer period were 0.021 µg m−3 , compared to                spring and 0.01 µg m−3 in the fall, measured with an AMS
0.002 µg m−3 during the winter. The range of concentra-                 aboard a research ship in the North Atlantic. Similarly, dur-

Atmos. Chem. Phys., 21, 7983–8002, 2021                                                    https://doi.org/10.5194/acp-21-7983-2021
M. A. Zawadowicz et al.: Aircraft measurements of aerosol and trace gas chemistry in the E North Atlantic                              7989

Figure 4. Relative contributions of four non-refractory components of aerosol chemistry: organic, sulfate, ammonium and nitrate to boundary
layer AMS observations shown in Fig. 2 and Table 2 at two different altitude ranges. The hatched portions of organic and sulfate observations
represent contributions of MSA. Also shown are relative contributions of different functional groups to the total organic budget. (a) 1000–
3000 m, IOP 1. (b) 1000–3000 m, IOP 2. (c) < 1000 m, IOP 1. (d) < 1000 m, IOP 2.

ing the NAAMES cruises, MSA concentrations measured                      parable to AMS measurements reported here. In particular,
with ion chromatography were reported as 0.07 µg m−3 in                  because the filter samples can measure larger particles than
the late spring and 0.01 µg m−3 in both March and Septem-                the AMS, this might suggest that some of the MSA was
ber (Quinn et al., 2019; Saliba et al., 2020). MSA concentra-            present on coarse aerosols, such as sea salt.
tions strongly vary by season as well; MSA is about 10 times                Despite strong seasonality in abundance, relative contribu-
less abundant during the winter compared to the summer. In               tions of non-refractory aerosol compositions are similar be-
Fig. 3c and d, total particulate MSA loadings are expressed as           tween summer and winter. Figure 4 shows relative contribu-
fractions of AMS sulfate signal as described in the Supple-              tions of sulfate, organics, ammonium and nitrate to the total
ment. Even during the summer, MSA accounts for a small                   non-refractory aerosol budget measured by the AMS during
(< 10 %) fraction of the total particulate sulfate. The small            both measurement periods. In both IOPs, the fractional con-
fraction of particulate MSA does not, however, indicate that             tribution of organics, sulfate, ammonium and nitrate were
DMS is not a significant source of sulfate mass in the region,           23 %, 69 %, 6 % and 1 %, respectively. Sulfate is the dom-
as DMS oxidation also produces inorganic sulfate.                        inant contribution to the non-refractory aerosol mass in the
   The MSA-to-non-sea-salt-sulfate ratio (MSA : SO4 ) mea-               ACE-ENA region. This in contrast to the dominance of or-
sured during ACE-ENA in the summer was 0.02 on average                   ganics at most continental sites in the Northern Hemisphere
in the MBL (< 1000 m), which is lower than historical esti-              midlatitudes (Zhang et al., 2007). We observe a trend of de-
mates of the ratio. For example, Pszenny et al. (1990) reports           creasing contribution of sulfate with increasing altitude. Sul-
the ratio as 0.05 in the North Atlantic in August–September,             fate contributes 51 %–58 % to the total non-refractory aerosol
Berresheim et al. (1991) reports 0.033 in the western North              at altitudes between 1000 and 3000 m and 68 %–70 % at al-
Atlantic in September, and Savoie et al. (2002) reports 0.06 in          titudes below 1000 m. Figure 4 also shows an estimate of av-
Bermuda in September and 0.05 in Mace Head in August.                    erage relative MSA contributions to sulfate and organic com-
Huebert et al. (1996) found 0.07 in marine air masses and                ponents, which do not exceed 1 % and 2 %, respectively.
0.02 in continental air masses in June in the Azores. The                   Unlike sulfate, there is no strong trend of decreasing am-
measurements reported in these earlier studies are based on              monium with altitude, and as a result, boundary layer sulfate
analysis of filter samples, and they may not be directly com-            aerosol is more acidic than sulfate in the free troposphere.

https://doi.org/10.5194/acp-21-7983-2021                                                   Atmos. Chem. Phys., 21, 7983–8002, 2021
7990 M. A. Zawadowicz et al.: Aircraft measurements of aerosol and trace gas chemistry in the E North Atlantic
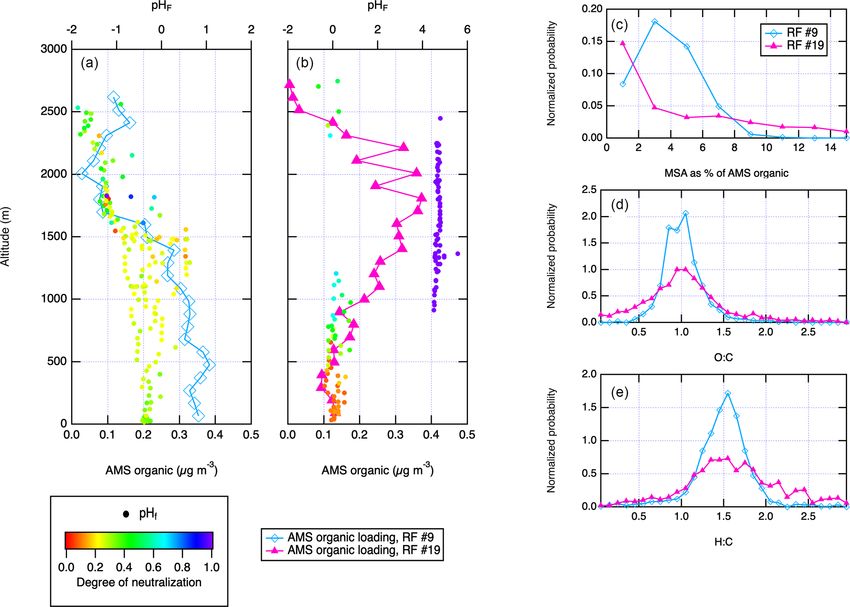
Figure 5. Overview of organic chemistry for IOP 1 using AMS measurement periods where [Org] > 0.15 µg m−3 . All elemental ratios were
calculated using the Canagratna et al. (2015) method. (a) AMS O : C ratios for boundary layer and free-troposphere altitudes. (b) AMS
H : C ratios for boundary layer and free-troposphere altitudes.
AMS measurements can be used to calculate the degree of in Fig. 5a and b, < 1000 and 1000–3000 m. This suggests a
aerosol neutralization as similar degree of oxidation of the organic aerosol through-
[NH4 ] /18 out the marine boundary layer, further pointing to a lack of
Degree of neutralization = . (1) strong local sources of organic aerosol.
2[SO4 ]
96 + [NO 3] [Cl]
62 + 35.5 To further test this, two representative research flights,
Neutralization below 1 indicates acidic aerosol. Note that this RF no. 9 and no. 19, were selected to represent condi-
analysis is based solely on quantities measured by the AMS tions with lower (RF no. 9) and higher (RF no. 19) influ-
and therefore neglects certain common marine cations such ence from long-range transport on the basis of concentra-
as Na+ or K+ . Chloride salts of Na or K will also be unde- tions of black carbon, ammonium, methanol and acetone in
tected by the AMS. Due to the acidity of marine boundary the free troposphere, which are all markers for long-range
layer sulfate, the bulk biogenic sulfate is likely sulfuric acid, transport. The vertical profiles of total AMS organic loading
which is produced from oxidation of SO2 , another oxidation from those two research flights are shown in Fig. 6. During
product of DMS (Hoffmann et al., 2016). A thermodenuder RF no. 9, MSA accounts for 3 % of the total particulate or-
heated to 300 ◦ C in front of an aerosol sizing instrument ganic signal, but during RF no. 19, its contribution is < 1 %
aboard the G-1 aircraft during the ACE-ENA campaign was (Fig. 6c). However, the distributions of O : C and H : C ra-
used to infer that the AMS observations are of non-sea-salt tios on those 2 d are very similar (Fig. 6d and e). This sug-
submicron marine aerosol. The analysis also neglects organic gests two likely possibilities for the source of organic aerosol
acids, such as oxalic acid or MSA, but the concentrations of in the ENA region: (1) the majority of the boundary layer
these in clean MBL are low. MSA, for example, was shown particulate organic aerosol is made up of oxidized conti-
to account for only 1 %–2 % of the non-refractory aerosol nental emissions that were transported and are now mixed
mass. into the boundary layer, and (2) fresh ocean primary or-
Relative contributions of different functional groups dif- ganic aerosol that is highly oxidized and indistinguishable
ferentiated by AMS to the total bulk organic loading are also from long-range-transported organic aerosol by O : C and
indicated in Fig. 4. In all cases, CxHyOz components con- H : C ratios. During the International Chemistry Experiment
tribute over 50 % of total organic aerosol, as would be ex- in the Arctic Lower Troposphere (ICEALOT) O : C of sub-
pected for photochemically aged aerosol transported into the micron particles was quantified using both Fourier-transform
remote region. Figure 5 shows a further overview of organic infrared spectroscopy (FTIR) and AMS aboard a research
aerosol chemistry during the summer, when organics were ship (Frossard et al., 2011; Russell et al., 2010). The aver-
most abundant. O : C and H : C ratios were computed from age O : C during the cruise was 0.94, and it was 1.07 for the
AMS measurements using the “improved ambient” method North Atlantic leg (Russell et al., 2010). This high O : C ra-
of Canagaratna et al. (2015) and averaged using a 11-point tio was linked to an abundance of highly oxidized hydroxyl
moving average. The O : C ratio of 1.1 for MBL and 1.0 for functional groups similar to those found in biogenic carbohy-
free troposphere suggests that the organic aerosol is highly drates found in seawater (Russell et al., 2010). Bubble burst-
processed by the time it is sampled at the ACE-ENA re- ing on the ocean surface was identified as a likely source of
gion. For comparison, the mean O : C and H : C ratios dur- such primary aerosols (Russell et al., 2010).
ing GoAmazon 2014/15 were 0.6 and 1.65 during the wet Figure 6 also shows aerosol pHF (i.e., pH based on only
season (Shilling et al., 2018). No strong trends in elemen- the free-H+ molality; Pye et al., 2020) calculated using the
tal ratios are observed for the two altitude bins considered MOSAIC aerosol model (Zaveri et al., 2008) and the web-
Atmos. Chem. Phys., 21, 7983–8002, 2021 https://doi.org/10.5194/acp-21-7983-2021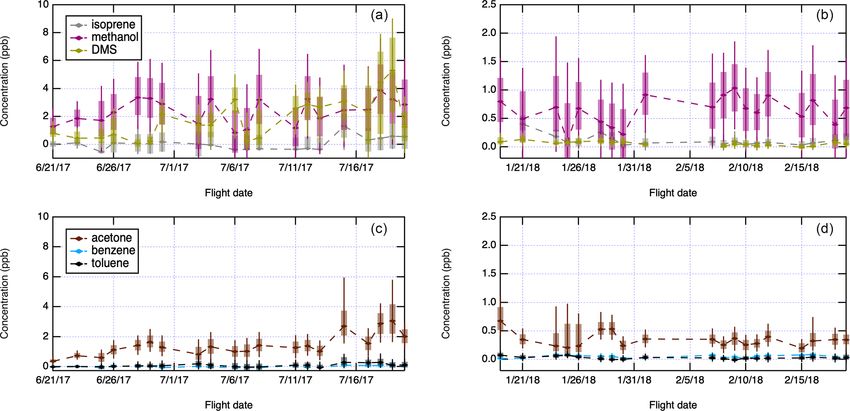
M. A. Zawadowicz et al.: Aircraft measurements of aerosol and trace gas chemistry in the E North Atlantic 7991
Figure 6. Vertical profiles of AMS organic loading for two research flights representative of different (local vs. remote) transport conditions,
overlaid with the calculated pHF during the vertical profile, (a) RF no. 9 and (b) no. 19. (c) Percentage of total AMS organic signal accounted
for by MSA during RF no. 9 and no. 19, (d) AMS O : C ratios during RF no. 9 and no. 19, and (e) AMS H : C ratios during RF no. 9 and
no. 19. Panels (a) and (b)show only the vertical profiles, while panels (c)–(e) are for the entire flight.
based E-AIM model IV (Friese and Ebel, 2010; Wexler and all altitudes during the summer (Table 2). Methanol concen-
Clegg, 2002) for the two limiting cases of local vs. remote trations were higher above the boundary layer (> 1000 m)
emissions, respectively. This provides a more accurate con- but lower near the ocean surface, while DMS showed the op-
straint on the aerosol pH than the neutralization obtained posite trend of high concentrations at the surface and low
from AMS, but it agrees with the earlier conclusion that the concentrations at high altitudes. In the winter, the average
submicron aerosol in the MBL at ENA is very acidic. In methanol concentration was 0.6 ppb, and the average DMS
the case of clean MBL, during RF no. 9, pH is between 0 concentration was 0.1 ppb (Table 2). Isoprene, benzene and
and −2, depending on the presence of liquid water in the par- toluene concentrations are very low throughout the cam-
ticles. Even during RF no. 19, which contained a clear remote paign, with average concentrations below 0.5 ppb for iso-
transport plume, pH is 0 everywhere outside of the plume. prene and below 0.1 ppb for benzene and toluene, which is
This raises the possibility of a third source of organic aerosol near the detection limit. The measurements of these anthro-
at ENA – fresh SOA produced through acid-catalyzed reac- pogenic and biogenic VOCs again indicate that emissions
tive uptake of oxidized isoprene and monoterpene emitted of SOA-forming precursors in the region are low. The three
from the ocean. While the isoprene concentrations measured major trace gas components (DMS, methanol and acetone)
during ACE-ENA were low and close to the detection limit all show seasonality, but the reduction in concentration from
of 0.1 ppb (Table 2), SOA formation from acid-catalyzed summer to winter is 3–4 times for methanol and acetone and
IEPOX chemistry has been shown to be significantly more 20-fold for DMS. Note that there is a potential interference
efficient than from a non-IEPOX photochemical mechanism for summer DMS, which produced higher absolute concen-
(Surratt et al., 2010). trations than expected, though we expect trends in relative
concentration to be accurate.
3.1.2 Trace gas chemistry
3.2 Vertical profiles of aerosol and trace gases
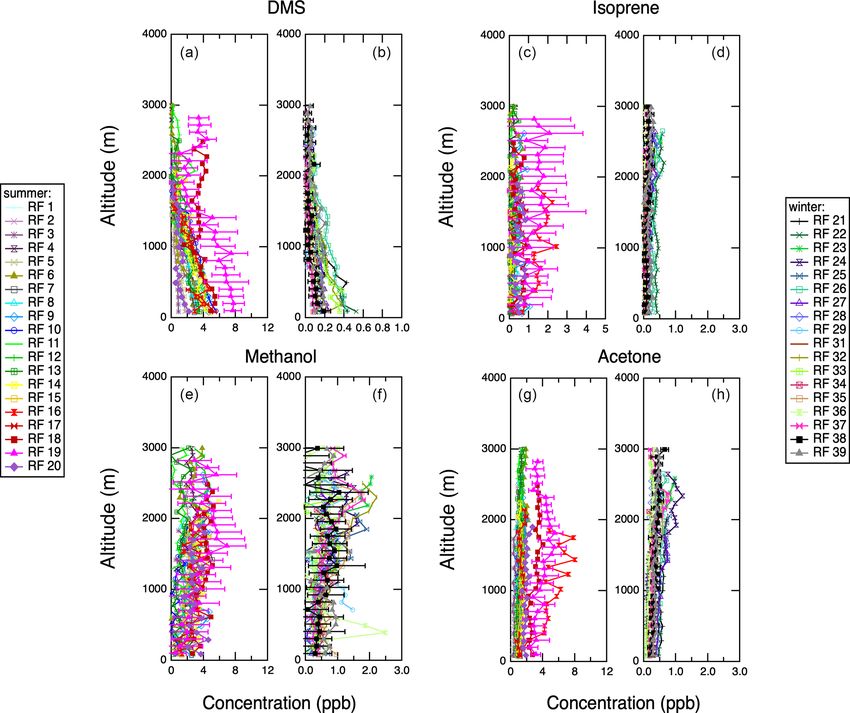
Figure 7 and Table 2 summarize the PTR-MS measurements
for trace gases during ACE-ENA. The most abundant trace Vertical profiles for each of the research flights are summa-
gas is methanol, with average concentrations around 2 ppb at rized in Table S1. Most flights included at least two verti-
https://doi.org/10.5194/acp-21-7983-2021 Atmos. Chem. Phys., 21, 7983–8002, 2021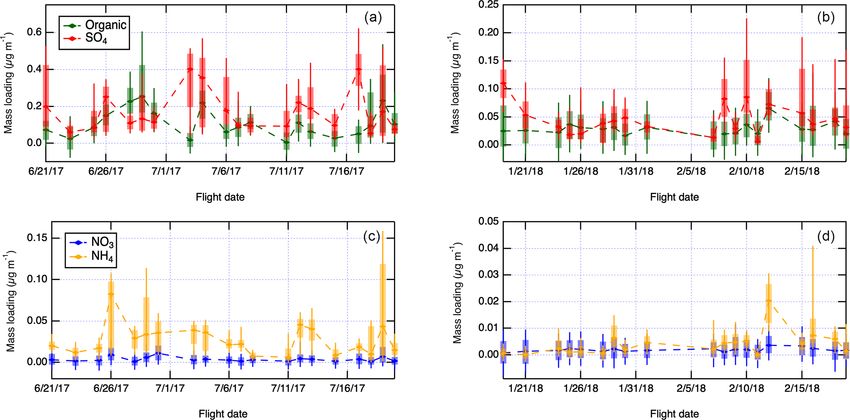
7992         M. A. Zawadowicz et al.: Aircraft measurements of aerosol and trace gas chemistry in the E North Atlantic

Figure 7. Summary of trace gas chemistry measurements acquired with the PTR-MS aboard the G-1 aircraft during ACE-ENA. Measure-
ments at altitudes from 1000 to 3000 m. Boxes are centered on daily medians, box boundaries extend between the 25th and 75th percentile,
and whiskers extend between the 10th and 90th percentile. (a, c) IOP 1 measurements. (b, d) IOP 2 measurements.

Table 2. Summary of PTR-MS measurements aboard the G-1 dur-           cal profiles, and if there were multiple vertical profiles per
ing ACE-ENA.                                                          flight, they were averaged together. Vertical profile locations
                                                                      are shown in Fig. S1; the majority were located close to the
                       IOP 1, summer       IOP 2, winter              coast of Graciosa Island. Figure 8 shows vertical profiles of
                       Mean   Median      Mean    Median              aerosol chemistry measured with the AMS. Examination of
                                                                      vertical profiles can reveal the boundary layer structure and
       Altitudes < 1000 m                                             aerosol sources. Because all the vertical profiles were carried
       Methanol        1.65    1.45       0.38      0.38              out over the ocean, the surface sources are marine in origin.
       Acetone         1.14    0.95       0.25      0.23              The vertical profiles of organics and nitrate are relatively con-
       DMS             3.31    2.81       0.20      0.18              stant on most flights, indicating that these species are well
       Isoprene        0.21    0.03       0.11      0.08              mixed through the troposphere. Organics display a slight in-
       Benzene         0.05    0.03       0.06      0.05              crease in concentration at high altitudes in the winter, though
       Toluene         0.13    0.07       0.03      0.03              this layer is relatively weak. Ammonium aerosol components
       Altitudes 1000–3000 m                                          have both weak marine sources and stronger influences at
                                                                      > 1000 m in the summer. Similar to organics, ammonium
       Methanol        2.51    2.28       0.65      0.63
                                                                      shows weak high-altitude layers above 2000 m in the win-
       Acetone         1.67    1.34       0.36      0.32
       DMS             2.06    1.74       0.07      0.05
                                                                      ter, likely representing transport from North America. Sulfate
       Isoprene        0.31    0.05       0.13      0.10              aerosol has two distinct sources: a marine source seen be-
       Benzene         0.05    0.03       0.05      0.05              low 1000 m in the summer and a high-altitude source above
       Toluene         0.11    0.07       0.03      0.03              1000 m present in both seasons. Figure 9 shows additional
                                                                      vertical profiles of quantities derived using AMS aerosol
       All altitudes
                                                                      chemistry measurements, MSA concentration and acidity.
       Methanol        2.06    1.85       0.57      0.54              MSA shows a strong surface source during the summer mea-
       Acetone         1.39    1.14       0.32      0.29              surement period but falls below the detection limit during the
       DMS             2.67    2.34       0.12      0.09              winter measurement period. It is also especially clear during
       Isoprene        0.26    0.04       0.13      0.09              the summer that the surface-derived marine aerosol tends to
       Benzene         0.05    0.03       0.05      0.05              be strongly acidic, but the higher-altitude aerosol tends to be
       Toluene         0.12    0.07       0.03      0.03
                                                                      more neutralized, further supporting two distinct sources of
                                                                      sulfate at different altitudes. Figure 10 shows vertical pro-
                                                                      files of refractory black carbon (rBC) measured by the SP-
                                                                      2. Consistently with clean, remote conditions, concentrations

Atmos. Chem. Phys., 21, 7983–8002, 2021                                                  https://doi.org/10.5194/acp-21-7983-2021
M. A. Zawadowicz et al.: Aircraft measurements of aerosol and trace gas chemistry in the E North Atlantic 7993 Figure 8. Vertical profiles of AMS aerosol chemistry measurements acquired during spiral profiles shown in Fig. S1. Representative error bars (1σ standard deviations) are shown on 1 d only for clarity. (a) Organic, IOP 1. (b) Organic, IOP 2. (c) Sulfate, IOP 1. (d) Sulfate, IOP 2. (e) Ammonium, IOP 1. (f) Ammonium, IOP 2. (g) Nitrate, IOP 1. (h) Nitrate, IOP 2. Figure 9. Vertical profiles of AMS-derived MSA and AMS-derived degree of NH4 neutralization (a proxy for aerosol acidity) acquired during spiral profiles shown in the Supplement Fig. S1. Representative error bars (1σ standard deviations) are shown on 1 d only for clarity. (a) MSA, IOP 1. (b) MSA, IOP 2. (c) NH4 neutralization, IOP 1. (d) NH4 naturalization, IOP 2. https://doi.org/10.5194/acp-21-7983-2021 Atmos. Chem. Phys., 21, 7983–8002, 2021
7994 M. A. Zawadowicz et al.: Aircraft measurements of aerosol and trace gas chemistry in the E North Atlantic
40 ppb, respectively. During the winter, however, their con-
centrations are consistently higher, 80–140 and 20–50 ppb,
respectively. This can indicate both continental influence and
more efficient removal of CO during the summer due to
photochemistry. Recently, concentrations of hydroxyl radi-
cal have been quantified during the summer and winter in
the remote troposphere, indicating a column average for the
Northern Hemisphere of 4.4×10⁶ molec cm−3 in the summer
and 0.9 × 10⁶ molec cm−3 in the winter, which could explain
the seasonal differences in photochemical removal (Travis et
al., 2020). In the Amazon, the CO background was found
to be about 80 ppb absent any urban influence (Shilling et
al., 2018). A similar background CO concentration was also
found in the remote southeast Atlantic (Zuidema et al., 2018).
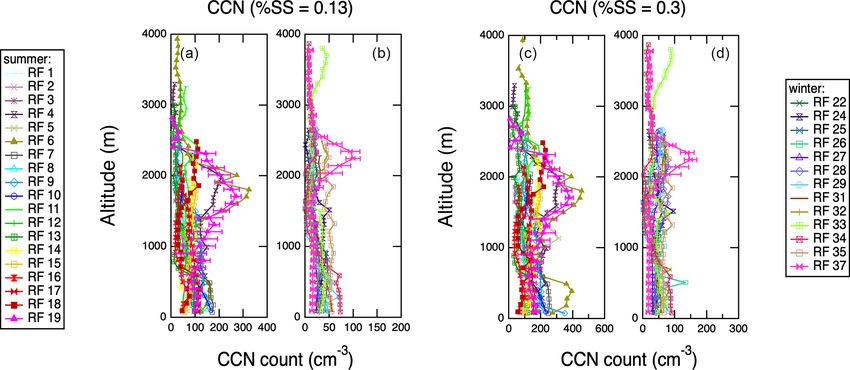
Figure 13 shows vertical profiles of CCN concentrations
Figure 10. Vertical profiles of refractory black carbon (rBC) ac-
quired with SP2 during spiral profiles shown in Fig. S1. Represen-
measured with the CCN counter aboard the G-1. During both
tative error bars (1σ standard deviations) are shown on 1 d only for seasons, but especially in the summer, CCN profiles corre-
clarity. (a) IOP 1. (b) IOP 2. late with high-altitude layers of organics, ammonium and
rBC, which are markers for long-range transport of aerosols,
as described above. This trend is apparent for both 0.13 %
and 0.3 % supersaturations. Campaign-wide correlations be-
of rBC are low in both measurement periods, but during the tween aerosol chemical composition and CCN concentra-
summer several profiles show very clear layers at altitudes tions are also shown in Figs. S3 and S4. At both supersat-
higher than 1000 m. Profiles of rBC are consistent with oc- urations, CCN concentration correlate best with ammonium
casional transport of polluted air from the continent at high at high altitudes (> 1000 m), R 2 = 0.8 for 0.1 % supersatu-
altitude to the region. ration and R 2 = 0.7 for 0.3 % supersaturation, which tends
Figure 11 shows vertical profiles of four of the trace gases to be transported from the continents.
measured with the PTR-MS. Two of these gases, DMS and
isoprene, are expected to have local sources: marine bio-
genic emissions in the case of DMS and both marine and 4 Discussion
island biogenic emissions for isoprene. The source for DMS
emissions is decidedly marine, but the isoprene profiles do Examination of average concentrations of trace gases and
not show a strong surface source, suggesting a lack of lo- aerosols, their vertical profiles, and external factors such as
cal isoprene emissions. Phytoplankton have been shown to meteorology, back trajectories and biological productivity re-
emit isoprene in the laboratory (Colomb et al., 2008; Ex- veals an interplay of local and transported emissions giving
ton et al., 2013; Meskhidze et al., 2015; Shaw et al., 2010), rise to CCN in the ENA region. Two tracers of biological
and trace isoprene and its oxidation products have been de- ocean productivity were measured during ACE-ENA: DMS
tected in ocean research cruises (Hackenberg et al., 2017; and particulate MSA. Both of these tracers are prominent in
Hu et al., 2013; Kim et al., 2017; Mungall et al., 2017). the marine boundary layer but generally only in the summer.
Generally, the phytoplankton species that emit isoprene are The synchronization in concentrations of DMS and MSA is
different from those that are primary DMS producers, and expected, as MSA is produced through atmospheric oxida-
their respective geographical distributions are anti-correlated tion of DMS. In the marine boundary layer, DMS is a by-
(Dani and Loreto, 2017). Methanol and acetone are both product of metabolism of some phytoplankton species, such
expected to be tracers for continental transport, and they as coccolithophores and dinoflagellates (Keller et al., 1989).
tend to show layers at altitudes higher than 1000 m during Because its production is biogenic in nature, it undergoes
both measurement periods. Figure 12 shows vertical pro- seasonal cycles, which tend to be strongly latitude depen-
files of two additional atmospheric gases whose concentra- dent (Galí and Simó, 2015; Polimene et al., 2012). At polar
tions were also measured aboard the G-1, carbon monoxide and subpolar latitudes, which are light-limited in the winter,
and ozone. Both of those gases are tracers for long-range concentrations of ocean DMS peak synchronously with phy-
transport of anthropogenic pollution and/or biomass burn- toplankton biomass, but at subtropical latitudes, peak DMS
ing. They show similar high-altitude layers to methanol and emissions lag behind peak biomass by as much as a few
acetone, but CO in particular is less susceptible to wet re- months (Galí and Simó, 2015; Lana et al., 2012; Polimene
moval by clouds and precipitation because of its low wa- et al., 2012). The cause of this lag is the way seasonality
ter solubility. Summertime marine boundary layer concen- in solar irradiation drives diversity of phytoplankton taxa,
trations for carbon monoxide and ozone are 60–100 and 10– with the DMS-producing species preferring more irradiated
Atmos. Chem. Phys., 21, 7983–8002, 2021 https://doi.org/10.5194/acp-21-7983-2021M. A. Zawadowicz et al.: Aircraft measurements of aerosol and trace gas chemistry in the E North Atlantic 7995 Figure 11. Vertical profiles of PTR-MS trace gas chemistry measurements acquired during spiral profiles shown in Fig. S1. Representative error bars (1σ standard deviations) are shown on 1 d only for clarity. (a) Dimethyl sulfide, IOP 1. (b) Dimethyl sulfide, IOP 2. (c) Isoprene, IOP 1. (d) Isoprene, IOP 2. (e) Methanol, IOP 1. (f) Methanol, IOP 2. (g) Acetone, IOP 1. (h) Acetone, IOP 2. Figure 12. Vertical profiles of carbon monoxide and ozone measurements acquired during spiral profiles shown in Fig. S1. Representative error bars (1σ standard deviations) are shown on 1 d only for clarity. (a) CO, IOP 1. (b) CO, IOP 2. (c) Ozone, IOP 1. (d) Ozone, IOP 2. https://doi.org/10.5194/acp-21-7983-2021 Atmos. Chem. Phys., 21, 7983–8002, 2021
7996        M. A. Zawadowicz et al.: Aircraft measurements of aerosol and trace gas chemistry in the E North Atlantic

Figure 13. Vertical profiles of CCN concentration measurements at two supersaturations (0.13 % and 0.3 %) acquired during spiral profiles
shown in Fig. S2. Representative error bars (1σ standard deviations) are shown on 1 d only for clarity. (a) CCN concentration at 0.13 %
supersaturation, IOP 1. (b) CCN concentration at 0.13 % supersaturation, IOP 2. (c) CCN concentration at 0.3 % supersaturation, IOP 1.
(d) CCN concentration at 0.3 % supersaturation, IOP 2.

conditions (Galí and Simó, 2015; Polimene et al., 2012).               (Fig. 13). There is evidence from analysis of ENA site data
Figure S5 shows distributions of ocean chlorophyll a mea-              that accumulation-mode particles entrained from the free tro-
sured by MODIS aboard the Aqua satellite (NASA God-                    posphere, as well as growth of Aitken-mode particles into
dard Space Flight Center, 2018) during the two intensive pe-           accumulation mode in the MBL, are the largest contribu-
riods during ACE-ENA. While the summer coincides with                  tors to the CCN budget in the ENA region (Zheng et al.,
greater biological productivity at the subpolar latitudes north        2018). In particular, the latter source can represent as much
of the Azores, the chlorophyll a concentrations at the ENA             as 60 % of the CCN budget in the summer (Zheng et al.,
site are higher in the winter (0.27 mg m−3 ) than in the sum-          2018). Aitken-mode particles, in this case, are entrained from
mer (0.12 mg m−3 ), which is an opposite trend to the aircraft         the free troposphere, and they continue to grow by conden-
DMS and MSA measurements. This could be due to the lag                 sation of DMS oxidation products, such as MSA and sul-
in seasonal production of DMS in the Azores, which strad-              furic acid, into CCN-relevant sulfate particles (Zheng et al.,
dle midlatitude and subtropical regimes. The anti-correlation          2018). Annual mean contributions of sea salt to accumulation
between phytoplankton biomass and ocean DMS concen-                    and Aitken modes have been found to be 21 % and less than
trations has been shown to persist in the −20 to 40◦ lati-             10 %, respectively (Zheng et al., 2018), which suggests that
tude band in both hemispheres, which includes the Azores               AMS is sensitive to the majority of the ENA CCN budget
(Lana et al., 2012). The seasonal surface DMS concentration            composition.
has been shown to peak in the summer in the eastern North                 Vertical profiles presented in Figs. 8–10 show strong strat-
Atlantic using a global model (Kloster et al., 2006). Previ-           ification in aerosol chemistry. Below ∼ 1000 m, the parti-
ous measurements of surface seawater DMS concentrations                cles are MSA-influenced and strongly sulfate dominated and
compiled in the Global Surface Seawater DMS Database                   acidic; at 1000–3000 m, the particles contain no MSA, are
(https://saga.pmel.noaa.gov/dms/, last access: 2 May 2020)             more neutralized (though still acidic), and can contain or-
(Kettle et al., 1999) also indicate higher concentration around        ganics, ammonium and black carbon. HYSPLIT back trajec-
the Azores in the summer (mean 2 ± 2 nM L−1 ) than in the              tories in Fig. S7 corroborate the low-altitude air masses as
winter (0.5 ± 0.4 nM L−1 ) (Fig. S6). An alternative explana-          strongly influenced by marine conditions. The high-altitude
tion is transport of DMS-rich air masses north of the site, but        features are also consistent with long-rage transport of North
the HYSPLIT (Stein et al., 2015) back trajectories shown in            American continental emissions. Research flight no. 19 on
Fig. S7 do not suggest strong transport from the north at low          19 July 2017 shows the strongest continental transport in-
altitudes where DMS signal is most prominent.                          fluence at altitudes between 1000 and 2500 m. The peak in
   Local production of MSA and sulfate from oceanic emis-              aerosol abundance, organic and black carbon concentrations,
sions is a major source of aerosol mass in the summer. Sul-            and higher pH (Fig. 6) is accompanied by a peak in CO,
fate is highly hygroscopic, and therefore this aerosol will be         methane and acetone concentrations (Figs. 11 and 12). Those
efficient as CCN, which explains higher on average CCN                 characteristics suggest a biomass burning plume, but the lack
concentrations close to the ocean surface in the summer                of an AMS m/z 60 levoglucosan marker points to highly

Atmos. Chem. Phys., 21, 7983–8002, 2021                                                  https://doi.org/10.5194/acp-21-7983-2021
M. A. Zawadowicz et al.: Aircraft measurements of aerosol and trace gas chemistry in the E North Atlantic                      7997

                                                                       emissions, was used to start 10 d forward trajectories in HYS-
                                                                       PLIT in Fig. 14. Those reach the Azores at the correct time
                                                                       and altitude, which suggest that southeastern US could be
                                                                       the location for biomass burning emissions seen in the ENA
                                                                       region on 19 July 2017. A similar back-trajectory analysis
                                                                       was carried out for the southwestern Canadian fire location
                                                                       (Fig. S9), and those trajectories do not appear to reach the
                                                                       correct location. However, uncertainties in trajectory analy-
                                                                       sis and factors such as rapid mixing of free-tropospheric and
                                                                       MBL air (Wood et al., 2015) do not allow ruling it out as
                                                                       a source completely. Anthropogenic emissions such as traf-
                                                                       fic also cannot be ruled out completely as a source of 19
                                                                       July elevated aerosol concentrations, other polluted layers
                                                                       at ENA, or the highly oxidized background organic aerosol.
                                                                       Such polluted layers were observed relatively frequently dur-
                                                                       ing the campaign, and they were often accompanied by large
                                                                       increases in CCN concentrations (Fig. 13). This shows that
                                                                       periodic long-range transport of pollution into the ENA re-
                                                                       gion can significantly perturb the local CCN budget.
                                                                          Long-range-transported aerosols (organic, ammonium,
                                                                       rBC) and reactive gases (methanol, acetone) at ENA show
                                                                       strong seasonality with high concentrations in the summer
                                                                       and low in the winter. This can be partially attributed to the
                                                                       seasonality of North American wildfires, which occur in the
                                                                       summer and winter. However, Fig. 12 suggests an opposite
Figure 14. HYSPLIT trajectory analysis for the case study of
                                                                       trend for CO, a non-reactive, water-insoluble gas, which on
RF no. 19 (19 July 2017). (a) A 27-member ensemble of 14 d
back trajectories was started from the first vertical profile loca-
                                                                       average shows higher concentrations in the winter. Analysis
tion (39.172◦ N, 28.379◦ W) at 2000 m altitude. Each member of         of 3 years of data at the ENA ARM site suggests a peak of CO
the trajectory ensemble is calculated by offsetting the meteorologi-   and ozone concentrations occurring in the spring (March)
cal data by a fixed grid factor (one grid meteorological grid point    and a minimum during the summer (July) (Zheng et al.,
in the horizontal and 0.01σ units in the vertical). (b) A matrix       2018). This trend coincides with the CO and ozone season-
of 80 10 d forward trajectories was started from an evenly spaced      ality seen during ACE-ENA. One explanation is that CO un-
grid bounded by (34◦ N, 81.75◦ W), (34◦ N, 79.5◦ W), (32.6◦ N,         dergoes more photolytic destruction in the summer due to
81.75◦ W) and (32.6◦ N, 79.5◦ W) at 500 m altitude. In both cases,     higher OH concentrations. Another is that continental trans-
GDAS 0.5◦ meteorology and isentropic vertical motion were used.        port into the Azores might actually be more prominent during
The red box indicates the location of the Azores. The map was          the winter, but the particles and reactive gases are maybe lo-
created using public domain map data on Natural Earth (https:
                                                                       cally scavenged by clouds. Figure S5 shows MODIS Aqua
//www.naturalearthdata.com/, last access: 12 March 2020) and the
GSHHG database (https://ngdc.noaa.gov/mgg/shorelines/, last ac-
                                                                       observations of cloud fraction over the North Atlantic during
cess: 12 March 2020).                                                  the two intensive observation periods during the ACE-ENA
                                                                       campaign. The mean cloud fraction over the Azores is 0.56
                                                                       and 0.77 during summer and fall, respectively. Additionally,
                                                                       Fig. S10 shows that on average the winds were stronger in the
processed biomass burning aerosol or anthropogenic emis-               winter, and the HYSPLIT back trajectories in Fig. S7 show
sions. In order to constrain the source of the emissions, HYS-         more long-range transport during the winter at all altitudes.
PLIT back-trajectory analysis of this flight was carried out           The seasonal trend in CO can also be attributed to local emis-
as shown in Fig. 14. An ensemble of 14 d back trajecto-                sions to some extent, as higher emissions in the winter coin-
ries was generated from the site of the first vertical profile         cide with residential heating and power use. The EDGAR-
(Table S1) at 2000 m altitude. The back trajectories reach             HTAP V2 (https://edgar.jrc.ec.europa.eu/htap_v2/, last ac-
> 500 m altitude over the east of the United States on 12–             cess: 4 May 2020) gridded emissions inventory (Janssens-
15 July. The Fire Inventory from NCAR (FINNv1) (Wiedin-                Maenhout et al., 2015) was used to estimate local CO emis-
myer et al., 2011) was then used to provide locations of ma-           sions in the Azores (Fig. S11), showing increased emissions
jor fires on these 4 d, as shown in Fig. S8. Two fire clusters         in the power and residential sectors. However, local Azores
on those days occur in southwestern Canada and the south-              anthropogenic emissions are still rather low, and the trends
eastern United States. The southeastern US location in South           in local emissions and transported pollution are likely super-
Carolina, where FINN predicts the highest biomass burning              imposed.

https://doi.org/10.5194/acp-21-7983-2021                                               Atmos. Chem. Phys., 21, 7983–8002, 2021
You can also read


