Development of a laser-photofragmentation laser-induced fluorescence instrument for the detection of nitrous acid and hydroxyl radicals in the ...
←
→
Page content transcription
If your browser does not render page correctly, please read the page content below
Atmos. Meas. Tech., 14, 6039–6056, 2021
https://doi.org/10.5194/amt-14-6039-2021
© Author(s) 2021. This work is distributed under
the Creative Commons Attribution 4.0 License.

Development of a laser-photofragmentation laser-induced
fluorescence instrument for the detection of nitrous acid
and hydroxyl radicals in the atmosphere
Brandon Bottorff1 , Emily Reidy1 , Levi Mielke2,a , Sebastien Dusanter2,b , and Philip S. Stevens1,2
1 Department of Chemistry, Indiana University, Bloomington, IN 47405, USA
2 O’Neill School of Public and Environmental Affairs, Indiana University, Bloomington, IN 47405, USA
a now at: Department of Chemistry, University of Indianapolis, Indianapolis, IN 46227, USA
b now at: IMT Lille Douai, Institut Mines-Télécom, Univ. Lille, Centre for Energy and Environment, 59000 Lille, France

Correspondence: Philip S. Stevens (pstevens@indiana.edu)

Received: 21 April 2021 – Discussion started: 23 April 2021
Revised: 14 August 2021 – Accepted: 16 August 2021 – Published: 16 September 2021

Abstract. A new instrument for the measurement of atmo-         troposphere (Rohrer and Berresheim, 2006), several studies
spheric nitrous acid (HONO) and hydroxyl radicals (OH)          have indicated that the photolysis of nitrous acid (HONO)
has been developed using laser photofragmentation (LP)          (Reaction R1) is a significant, if not dominant, source of OH
of HONO at 355 nm after expansion into a low-pressure           in several environments (Kleffmann et al., 2005; Acker et al.,
cell, followed by resonant laser-induced fluorescence (LIF)     2006; Dusanter et al., 2009b; Volkamer et al., 2010; Ren et
of the resulting OH radical fragment at 308 nm similar to       al., 2013; Griffith et al., 2016).
the fluorescence assay by gas expansion technique (FAGE).
                                                                HONO + hv (300 nm < λ < 400 nm) −→ OH + NO                (R1)
The LP/LIF instrument is calibrated by determining the
photofragmentation efficiency of HONO and calibrating the       As the dominant oxidant in the lower troposphere, OH ini-
instrument sensitivity for detection of the OH fragment. In     tiates reactions with carbon monoxide and a wide variety of
this method, a known concentration of OH from the photo-        volatile organic compounds (VOCs) leading to the formation
dissociation of water vapor is titrated with nitric oxide to    of the hydroperoxy radical (HO2 ) and organic peroxy radi-
produce a known concentration of HONO. Measurement              cals (RO2 ). In the presence of nitrogen oxides (NOx = NO +
of the concentration of the OH radical fragment relative to     NO2 ) reactions of these peroxy radicals regenerate OH rad-
the concentration of HONO provides a measurement of the         icals, establishing a fast radical-propagation chain that can
photofragmentation efficiency. The LP/LIF instrument has        produce harmful pollutants including ozone and secondary
demonstrated a 1σ detection limit for HONO of 9 ppt for a       organic aerosols. Attempts to develop effective control strate-
10 min integration time. Ambient measurements of HONO           gies for these secondary pollutants necessitate a thorough
and OH from a forested environment and an urban setting are     understanding of OH radical chemistry. Due to its impor-
presented along with indoor measurements to demonstrate         tance as a radical precursor, a more complete understanding
the performance of the instrument.                              of HONO sources and sinks is critical to understanding the
                                                                oxidative capacity of the atmosphere.
                                                                   HONO is produced in the gas phase from the reaction
                                                                of OH radicals with NO (Reaction R2). In addition to pho-
1   Introduction                                                tolysis (Reaction R1), reaction of HONO with OH radicals
                                                                (Reaction R3) is another important loss mechanism in the
Although the photolysis of ozone followed by the reaction       gas phase. Considering Reaction (R2) as the only source of
of excited oxygen atoms with water vapor has been recog-        HONO, its gas-phase concentration can be calculated from a
nized as an important source of hydroxyl radicals (OH) in the   steady-state expression (Eq. 1).

Published by Copernicus Publications on behalf of the European Geosciences Union.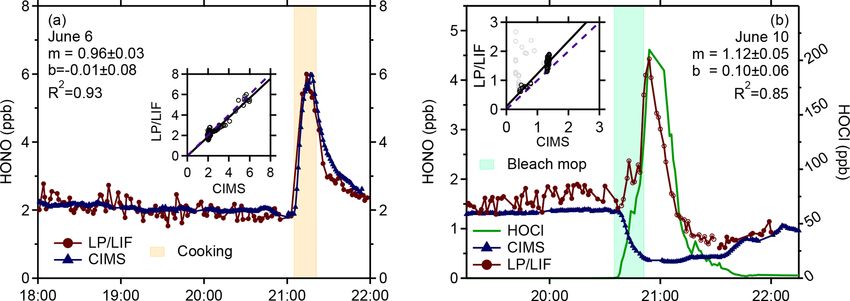
6040                B. Bottorff et al.: Development of a laser-photofragmentation laser-induced fluorescence instrument

                                                                  vant not only due to the adverse health effects caused by in-
                                                                  halation (Beckett et al., 1995; van Strien et al., 2004; Jarvis
OH + NO + M −→ HONO + M                                   (R2)    et al., 2005), but also due to the potential for OH production
  HONO + OH −→ H2 O + NO2                                 (R3)    indoors from HONO photolysis. OH concentrations were
                                                                  thought to be negligible indoors due to reduced light inten-
                                                                  sity, especially at short wavelengths and lower ozone mixing
                  kOH+NO [OH] [NO]                                ratios, but several studies have indicated that photolysis of el-
[HONO]PSS =                                                (1)    evated indoor HONO can produce OH concentrations similar
                JHONO + kOH+HONO [OH]
                                                                  to those found outdoors, even at reduced photolysis frequen-
In this equation, kOH+NO is the rate constant for Reac-           cies (Gómez Alvarez et al., 2013; Bartolomei et al., 2015;
tion (R2), JHONO is the photolysis rate constant for Re-          Kowal et al., 2017).
action (R1), and kOH+HONO is the rate constant for Reac-             As a result of these observations, a clear understanding
tion (R3). Compared to other photolytic sources of OH, the        of HONO sources is an important step in understanding the
longer wavelengths at which HONO photolyzes to produce            overall oxidation capacity of both the outdoor and the in-
OH can result in HONO photolysis dominating OH produc-            door environments. However, detailed mechanisms and de-
tion during the morning hours in some environments (Volka-        pendence on variables such as surface type and chemical
mer et al., 2010), but it decreases in importance during the      composition are still lacking for both heterogeneous HONO
day as the concentration of HONO decreases. However, in           sources and photo-enhanced surface reactions. Thus, addi-
several instances HONO photolysis has been shown to be            tional measurements of HONO in various environments and
a significant OH source through the day (Kleffmann et al.,        from laboratory experiments are still needed for the devel-
2005; Acker et al., 2006; Ren et al., 2013; Griffith et al.,      opment of a more complete understanding of both HONO
2016; Xue et al., 2020). This is mainly due to higher-than-       formation mechanisms and its potential to initiate the radical
expected daytime HONO mixing ratios that cannot be at-            chain that leads to secondary pollutant formation.
tributed to gas-phase Reactions (R1)–(R3) (Tang et al., 2015;        Several different measurement techniques have been em-
Lee et al., 2016; Meusel et al., 2016; Xue et al., 2020).         ployed to measure HONO, beginning with differential op-
   Other HONO sources include direct emission from vehi-          tical absorption spectroscopy (DOAS) (Perner and Platt,
cles or other combustion sources (Kirchstetter et al., 1996;      1979). DOAS is based on the UV–visible absorption of
Kurtenbach et al., 2001; Li et al., 2008; Xu et al., 2015), di-   HONO in the atmosphere across path lengths of several kilo-
rect photolysis of some species (Bejan et al., 2006; Zhou et      meters and provides a direct measurement that does not re-
al., 2011), photo-enhanced surface reactions (George et al.,      quire external calibration. The open-path nature of DOAS
2005; Stemmler et al., 2006), and release from soil due to        also eliminates potential impacts from inlet or surface chem-
biological processes (Su et al., 2011; Oswald et al., 2013;       istry that could result in interferences or loss of HONO, but
Weber et al., 2015; Meusel et al., 2018). Lastly, several pro-    the long path length required also limits its spatial resolution
duction pathways involving the heterogeneous conversion of        (Tsai et al., 2018). Incoherent broadband cavity-enhanced
NO2 to HONO on soil, leaf canopies, aerosols, and other sur-      absorption spectroscopy (IBBCEAS) is another optical tech-
faces have been suggested to explain higher-than-expected         nique that is capable of measuring HONO and several other
HONO mixing ratios observed during some field campaigns           trace gases. A long path length, similar to that used in
(Kleffmann et al., 1998; Ramazan et al., 2004; Stutz et al.,      DOAS instruments, is maintained within a short cavity of
2004; Xue et al., 2020).                                          0.5–2.0 m using two highly reflective mirrors (Nakashima
   HONO is also an important pollutant within the indoor          and Sadanaga, 2017; Jordan and Osthoff, 2020; Tang et al.,
environment. While outdoor mixing ratios during the day-          2020). Detection limits from IBBCEAS have improved in re-
time are typically within the range of tens to hundreds of        cent years to as low as 118 ppt for a 60 s integration time but
parts per trillion (Huang et al., 2002; Oswald et al., 2015),     still may not be sufficient for ambient measurements in less
and can range from hundreds of parts per trillion up to sev-      polluted environments (Duan et al., 2018).
eral parts per billion at night or during morning rush hour in       Several wet chemical techniques are also capable of de-
urban environments (Stutz et al., 2010; Young et al., 2012;       tecting HONO, including but not limited to wet denuder–
Xu et al., 2015; Lee et al., 2016), indoor HONO measure-          ion chromatography (IC) (Neftel et al., 1996), mist
ments have shown background levels of several parts per bil-      chamber–IC (Dibb et al., 2004), 2,4-dinitrophenylhydrazone
lion and elevated mixing ratios as high as 20–90 ppb during       (DNPH) derivatization and high-performance liquid chro-
cooking or other combustion events (Brauer et al., 1990; Ve-      matography (HPLC) (Zhou et al., 1999), derivatiza-
cera and Dasgupta, 1994; Zhou et al., 2018; Liu et al., 2019;     tion with sulfanilamide/N-(1-naphthyl)-ethylenediamine and
Wang et al., 2020a). In two studies, average outdoor mix-         high-performance liquid chromatography (Afif et al., 2016),
ing ratios were 0.9 and 0.3 ppb compared to 4.6 and 4.0 ppb       and long optical path absorption photometry (LOPAP) (He-
in nearby suburban homes (Leaderer et al., 1999; Lee et al.,      land et al., 2001). These techniques offer low detection lim-
2002). Elevated concentrations of HONO indoors are rele-          its and integration times, often below 5 ppt and a few min-

Atmos. Meas. Tech., 14, 6039–6056, 2021                                            https://doi.org/10.5194/amt-14-6039-2021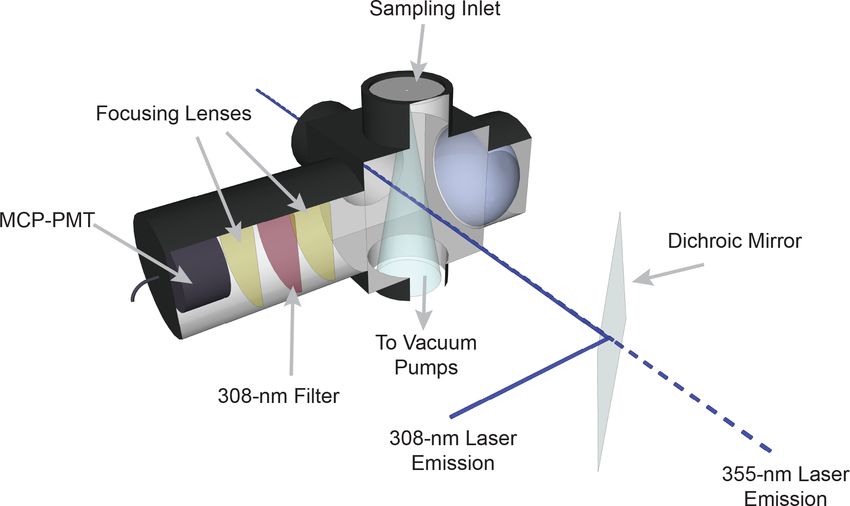
B. Bottorff et al.: Development of a laser-photofragmentation laser-induced fluorescence instrument                         6041

utes respectively, but indirectly measure gaseous HONO by           ment of both HONO and OH. In this approach, photofrag-
conversion to nitrite anion or a dye within a liquid solution.      mentation of HONO and detection of the OH fragment oc-
This conversion introduces the potential for sampling arti-         cur after sampling ambient air at low pressure, similar to
facts or chemical interferences where other species may also        the fluorescence assay by gas expansion (FAGE) technique
be converted and interpreted as HONO. For example, mea-             currently used to measure ambient concentrations of the OH
surements of HONO using LOPAP have been shown to have               radical in the atmosphere (Heard and Pilling, 2003). Excita-
high sensitivity and limits of detection less than 1 ppt but        tion and detection of OH occurs at 308 nm as this wavelength
suffer from interferences from atmospheric concentrations           is much less susceptible to interference from laser-generated
of NO2 and O3 (Heland et al., 2001). In addition, perox-            OH from Reactions (R4) and (R5) because the ozone absorp-
yacetyl nitrate (PAN) and peroxynitric acid (HO2 NO2 ) can          tion cross section is only 4 % of that at 282 nm (Heard and
be partially observed as HONO in these instruments (Villena         Pilling, 2003; Burkholder et al., 2019), and sampling at low
et al., 2011; Legrand et al., 2014). LOPAP instruments typ-         pressure reduces the concentration of ozone and water va-
ically utilize two stripping coils connected in series to cor-      por in the detection cell. In addition to a description of the
rect for these and other unknown interferences. In the first        instrument, a calibration method for HONO based on a mea-
coil, HONO is trapped efficiently along with some interfer-         surement of the photofragmentation efficiency is described,
ing species. These interferences are similarly trapped in the       and examples of measurements of HONO concentrations by
second coil, which allows a true HONO signal to be deter-           this instrument in both outdoor and indoor environments are
mined by subtraction (Heland et al., 2001; Legrand et al.,          presented.
2014). More recently, chemical ionization mass spectrometry
(CIMS) has been used to measure HONO along with other
inorganic acids. Iodide ion (I− ) and acetate ion (CH3 COO− )       2     Experimental section
CIMS have both been used with reported detection limits of
30 ppt (Roberts et al., 2010; Veres et al., 2015; Collins et al.,   2.1    Instrument description
2018).
   Other methods to measure ambient HONO include laser              The Indiana University laser-photofragmentation/laser-
photolysis into OH and NO fragments and subsequent de-              induced fluorescence (LP/LIF) instrument consists of four
tection of OH by laser-induced fluorescence at atmospheric          primary components: (1) a photolysis laser that fragments
pressure (Liao et al., 2006a). This method was used success-        HONO into OH and NO; (2) a 308 nm laser for the excitation
fully to detect ambient HONO at the South Pole in 2003              of the OH radicals; (3) a low-pressure sampling cell; and
(Liao et al., 2006b). Although this instrument exhibited a          (4) a sensitive gated detection system that synchronizes
low detection limit of 15 ppt for a 1 min integration time, the     photofragmentation of HONO, excitation of OH, and detec-
wavelength of 282 nm used for excitation of OH made it less         tion of the resulting OH fluorescence. A schematic of the
suitable for environments with higher ozone and water-vapor         instrumental configuration is shown in Fig. 1.
mixing ratios due to the potential for laser-generated OH in-          The absorption spectrum of HONO is shown in Fig. S1 in
side the detection cell from the photolysis of ozone followed       the Supplement (Burkholder et al., 2019). The strong peak
by reaction of O(1 D) with water vapor (Reactions R4 and            near 355 nm was chosen for photofragmentation because it
R5) (Wennberg et al., 1994). This interference can impact           coincides with the third harmonic of a Nd:YAG laser. A
the detection limit of HONO by increasing the measured OH           Spectra Physics Navigator II YHP40-355HM laser is used
background signal.                                                  for photofragmentation of HONO, producing approximately
                                                                    3–4 W of radiation at 355 nm and at a repetition rate of
O3 + hv (λ < 340 nm) −→ O(1 D) + O2                         (R4)    10 kHz with a pulse width of approximately 20 ns. The OH
  1
O( D) + H2 O −→ 2OH                                         (R5)    excitation laser system consists of a Spectra Physics Nav-
                                                                    igator II YHP40-532 Nd:YAG laser that produces approxi-
More recently, Dyson et al. (2021) report the detection of          mately 7–8 W of radiation at 532 nm at a repetition rate of
HONO in a laboratory setting using laser photolysis of              10 kHz and a pulse width of approximately 20 ns. This laser
HONO at 355 nm and subsequent detection of OH at 308 nm             pumps a dye laser (Sirah Credo, 255 mg L−1 of rhodamine
in a low-pressure detection cell, reporting a detection limit of    610 and 80 mg L−1 of rhodamine 101 in ethanol) to pro-
12 ppt for a 50 s average.                                          duce approximately 40–100 mW of radiation at 308 nm. A
   Despite the importance of measuring HONO in the at-              small portion of the 308 nm emission is diverted to a low-
mosphere, recent instrument intercomparisons have revealed          pressure reference cell for wavelength calibration (Dusanter
significant discrepancies in measurements of HONO be-               et al., 2009a). In this cell, a high concentration of OH radi-
tween various instrumental techniques (Pinto et al., 2014;          cals is produced by the thermal dissociation of water vapor
Ródenas et al., 2013; Crilley et al., 2019). In this paper we       using a hot alumel filament. The resulting OH fluorescence is
describe a new laser-photofragmentation/laser-induced fluo-         collected by a Hamamatsu photomultiplier tube (H6180-01)
rescence instrument capable of near-simultaneous measure-           equipped with a band-pass filter centered at 308 nm (Esco

https://doi.org/10.5194/amt-14-6039-2021                                             Atmos. Meas. Tech., 14, 6039–6056, 2021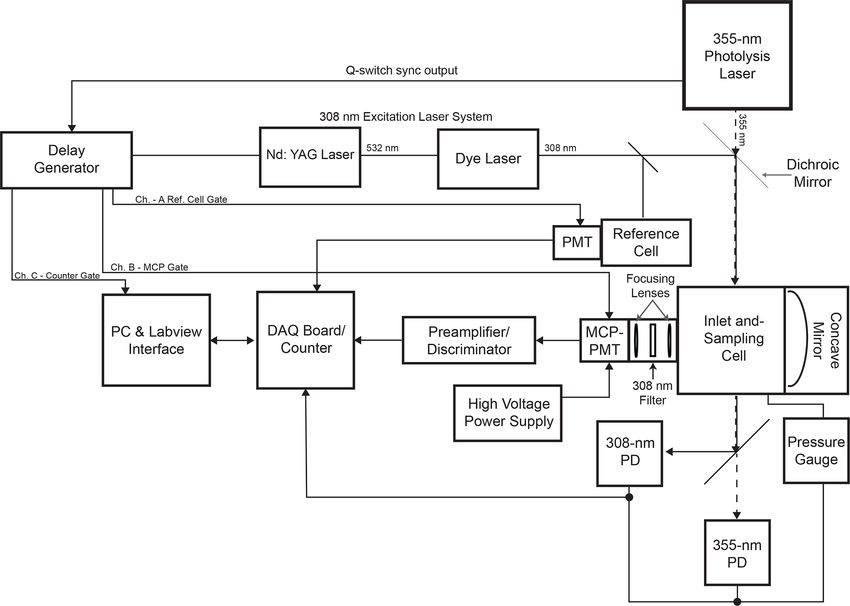
6042                B. Bottorff et al.: Development of a laser-photofragmentation laser-induced fluorescence instrument

Figure 1. Schematic diagram of the LP/LIF instrument.

Optics). Using the OH fluorescence signal from this cell, the
excitation laser is tuned to the Q1 (3) transition of OH at
308.1541 nm, a transition that exhibits one of the strongest
absorption cross sections around 308 nm (Dusanter et al.,
2009a).
   The sampling cell is shown in Fig. 2. Ambient air is drawn
into the sampling cell through a flat 1 mm diameter pinhole
inlet by means of two scroll pumps (Edwards XDS35i) con-
nected in parallel. The cell is maintained at a pressure of
0.25 kPa to reduce quenching of the OH fluorescence by am-
bient air and thus increase the OH radical fluorescence life-
time. As the sampled air passes through the inlet, it expands
into a central aluminum cube and is intersected by the frag-
mentation and excitation laser emissions. The 355 nm laser       Figure 2. Diagram of the LP/LIF sampling cell.
emission is propagated to the sampling cell through a 12 m
long, 1000 µm fiber-optic patch cord (OZ Optics), which re-
sults in approximately 1.5 W of laser power at the entrance      cell, the beams are spatially separated by a second dichroic
of the sampling cell. The excitation laser emission is propa-    mirror, and the power of each beam is monitored using a pho-
gated to the cell through a 12 m long, 200 µm fiber-optic ca-    todiode (UDT-555UV, OSI Optoelectronics) equipped with
ble (Thorlabs, FG200AEA), which results in approximately         interference filters (Esco Optics, Thorlabs).
1–4 mW of 308 nm radiation into the sampling cell. After            The fluorescence from the OH radical fragment is col-
exiting their respective fiber-optic cables, both the 355 and    lected by an optical train orthogonal to the excitation beam.
308 nm laser emissions are spatially combined by a dichroic      Two lenses (f = 75 mm, CVI Laser Optics) focus the flu-
mirror (Rocky Mountain Instrument Co.) that reflects greater     orescence onto the detector, and a band-pass filter centered
than 90 % of the 308 nm laser beam and transmits greater         at 308 nm (Barr Associates, transmission 65 %, bandwidth
than 90 % of the 355 nm laser beam. The beams are tempo-         5 nm, o.d. > 5 at other wavelengths) selectively passes OH
rally separated, with the 308 nm pulse entering the detection    fluorescence to the detector and reduces the detection of so-
cell 100 ns after the 355 nm pulse. Upon exiting the detection   lar scatter, potential broadband fluorescence of other species,

Atmos. Meas. Tech., 14, 6039–6056, 2021                                           https://doi.org/10.5194/amt-14-6039-2021
B. Bottorff et al.: Development of a laser-photofragmentation laser-induced fluorescence instrument                           6043

                                                                 Figure 4. Sample measurement cycle from the LP/LIF instrument
                                                                 during measurement of OH and HONO during laboratory calibra-
                                                                 tions. The raw signal has not been normalized for the power of the
                                                                 excitation laser or the total radical concentration produced by the
                                                                 calibrator. Sbkg is the average of the offline signals S1 and S3 .

                                                                 cence signals due to HONO photofragmentation from fluo-
                                                                 rescence due to ambient OH radicals, the 355 nm fragmenta-
Figure 3. Timing schematic depicting one photofragmenta-         tion laser is cycled on and off with the use of a diaphragm
tion/excitation/detection cycle.
                                                                 shutter (Thorlabs). When combined with dye-laser wave-
                                                                 length modulation, this creates a complete measurement se-
                                                                 quence that allows near-simultaneous measurement of both
and scatter from the 355 nm laser. A concave mirror (100 mm      ambient OH and HONO. Figure 4 shows an example of a typ-
diameter, 40 cm focal length, Melles Griot) opposite the op-     ical measurement sequence. Each measurement cycle con-
tical train effectively doubles the solid angle of collection.   sists of four 15 s steps: (1) a background signal is established
   The detection system consists of a time-gated micro-          where HONO is photolyzed but the 308 nm laser is tuned
channel plate photomultiplier tube (MCP-PMT) (Photek             off resonance (S1 ), (2) both ambient OH and the OH frag-
PMT325), a preamplifier/discriminator (F-100T, Advanced          ment from HONO are excited by tuning the 308 nm laser to
Research Instruments), and a high-speed counter (National        on resonance (S2 ), (3) the 355 nm photolysis laser is blocked
Instruments, 6024E). A delay generator (Berkeley Nucle-          by a shutter and background signal is re-established by tun-
onics Model 575) triggers both laser emissions, separated        ing the 308 nm laser off resonance (S3 ), and (4) the 355 nm
by 100 ns, and also increases the MCP-PMT gain after the         laser is still blocked but ambient OH is excited by tuning the
308 nm laser pulse (Fig. 3). Turning on the detector after the   308 nm laser on resonance (S4 ). The net HONO signal is ob-
308 nm laser pulse reduces the detection of the intense scat-    tained from the difference between the signals from cycles 2
tered radiation from the laser pulse while allowing the de-      and 4 (NetHONO = S2 − S4 ), while the net ambient OH sig-
tection of the OH fluorescence. The gain of the detector is      nal (NetOH ) is obtained from the difference between the sig-
reduced during the laser pulse and switched to the highest       nals from cycles 4 and the background signal (Sbkg ) which is
gain approximately 70 ns after the laser pulse. The gain is      the average of cycles 3 and 1 (NetOH = S4 − Sbkg ). Because
kept high for approximately 550 ns in order to collect most      the band-pass filter rejects scatter from the 355 nm laser, the
of the OH fluorescence and then is reduced until the next        background signal with and without the fragmentation laser
laser pulse. The signal from the MCP is amplified and fil-       is not significantly different and only varies with fluctuations
tered by a pulse-height discriminator (F100T) that delivers      in the 308 nm laser power.
TTL pulses for each detected photon. The photon counter is          In addition to the sequence described above, chemical
set with a timing gate to count the fluorescence photons dur-    modulation cycles can be used to test for potential interfer-
ing a 400 ns window while the gain of the detector is high,      ences in the measurement of ambient OH as performed on
avoiding potential noise associated with the increase and de-    FAGE instruments (Mao et al., 2012; Novelli et al., 2014;
crease in detector gain (Fig. 3).                                Rickly and Stevens, 2018). Due to the single-pass laser
   Wavelength modulation is used to tune the 308 nm dye-         design of the LP/LIF sampling cell, signals due to laser-
laser excitation emission on and off resonance with the Q1 (3)   generated OH from Reactions (R4) and (R5) are small and
transition of OH at 308.1451 nm. The net signal from the         are calibrated as a function of laser power, ozone, and water
OH fluorescence is derived by subtracting the off-resonance      concentrations (Griffith et al., 2016). However, Criegee in-
signal, consisting primarily of solar scatter and some scat-     termediates formed from the ozonolysis of alkenes (Rickly
tered laser radiation that extends into the detection window,    and Stevens, 2018), the decomposition of ROOOH species
from the on-resonance signal. To differentiate OH fluores-       (Fittschen et al., 2019), or other unknown interferences could

https://doi.org/10.5194/amt-14-6039-2021                                            Atmos. Meas. Tech., 14, 6039–6056, 2021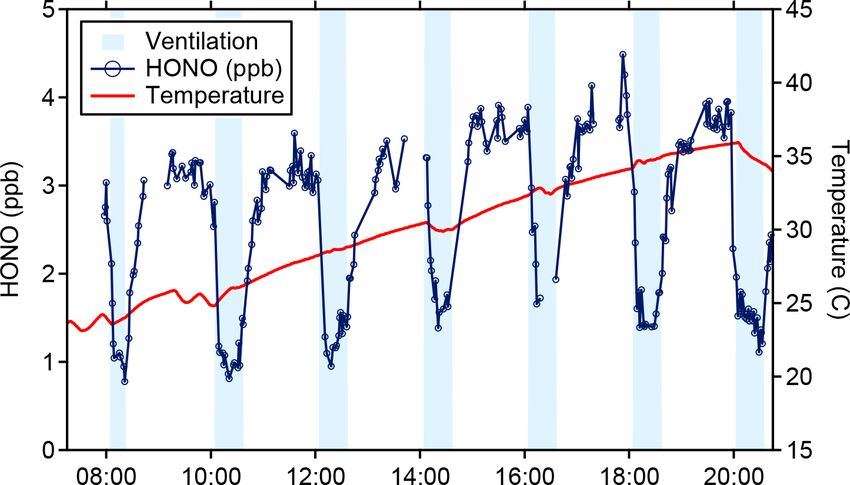
6044                B. Bottorff et al.: Development of a laser-photofragmentation laser-induced fluorescence instrument

lead to the formation of OH radicals inside the detection cell.   sitivity of the instrument to the measurement of the OH frag-
Removal of ambient OH through external reaction with a            ment (ROH ).
scrubbing agent, such as perfluorpropylene (C3 F6 ) (Griffith
et al., 2016; Rickly and Stevens, 2018), allows quantification    RHONO = ROH × PE                                           (2)
of all OH formed within the detection cell. The remaining
OH signal would be a measurement of the interference that         The instrumental sensitivity towards OH (ROH ) is deter-
can be subtracted from the total OH signal when the ambi-         mined using the water-vapor photolysis technique, which has
ent OH is not removed. While the LP/LIF instrument can            previously been described in detail (Dusanter et al., 2008).
incorporate chemical modulation cycles to measure potential       Briefly, this method relies on the photolysis of water vapor at
interferences, the technique was not used in the HONO and         184.9 nm to produce a known amount of OH (and HO2 ).
OH measurements reported below in order to increase the
                                                                  H2 O + hv (184.9 nm) −→ OH + H                            (R7)
HONO measurement frequency.
   The LP/LIF instrument is automated using a National In-        H + O2 + M −→ HO2 + M                                     (R8)
struments multifunction DAQ board (NI USB 6024) and a
customized LabVIEW interface program that controls the
355 nm laser shutter and monitors the power of both the           [OH] = [HO2 ] = [H2 O] × σH2 O × ϕOH+H × (F × t)           (3)
355 nm fragmentation laser and the 308 nm excitation laser.
The 308 nm laser is controlled by the Indiana University          As shown in Eq. (3), the concentration of OH and HO2
laser-induced fluorescence – fluorescence assay by gas ex-        produced by the calibrator can be calculated from the
pansion (IU-FAGE) instrument as described previously (Du-         time-integrated photolysis of water vapor. In this equation,
santer et al., 2009a). The output of the 308 nm laser system      σH2 O is the absorption cross section of water at 184.9 nm
is split between the LP/LIF instrument and the IU-FAGE in-        (6.78 × 10⁻²⁰ cm2 per molecule), and ϕOH+H is the unity
strument, allowing simultaneous measurements of ambient           photo-dissociation quantum yield (Burkholder et al., 2019).
HONO and OH by the LP/LIF instrument with measure-                F is the photon flux and t is the photolysis exposure time.
ments of ambient concentrations of OH and HO2 by the IU-          The quantity (F × t) can be determined via O2 actinome-
FAGE instrument (Dusanter et al., 2009a).                         try experiments, as molecular oxygen is also photolyzed at
                                                                  184.9 nm to form O3 (P) and then O3 after reaction with O2 .
2.2    Instrument calibration                                     The concentration of ozone produced is also dependent on
                                                                  the product of (F × t).
Several of the previously mentioned measurement techniques
utilize a HONO generation source to characterize instru-          [O3 ] = [O2 ] × σO2 × ϕO3 × (F × t)                        (4)
mental response to a known concentration of HONO. Many
                                                                                   [O3 ]
sources are based on the design of Febo et al. (1995), in         (F × t) =                                                  (5)
which gaseous hydrochloric acid reacts with sodium nitrite                   2 × [O2 ] × σO2
to form HONO (Reaction R6).                                       In these equations, ϕO3 is the quantum yield of ozone from
HCl (g) + NaNO2 (s) −→ HONO(g) + NaCl(s)                  (R6)    oxygen photolysis (ϕO3 = 2) and σO2 is the effective absorp-
                                                                  tion cross section of oxygen at 184.9 nm. Thus, measure-
This method requires the reaction chamber to be heated            ments of ozone concentrations can be used to determine the
to 50 ◦ C and can produce mixing ratios of HONO over a            quantity (F × t) if the effective oxygen absorption cross sec-
wide range (5–20 000 ppb) (Febo et al., 1995) that often re-      tion is known. Previous studies have shown that the effective
quire large dilution flows to reach typical outdoor atmo-         oxygen absorption cross section at 184.9 nm is dependent on
spheric concentrations (Lao et al., 2020). Furthermore, the       operating conditions (O2 column density, lamp current, and
high HONO mixing ratios produced by this approach can dis-        lamp temperature), making it necessary to measure σO2 for
proportionate to form NO and NO2 (Febo et al., 1995; Stutz        each calibration system (Hofzumahaus et al., 1997; Lanzen-
et al., 2000; Gingerysty and Osthoff, 2020; Lao et al., 2020).    dorf et al., 1997). The dependence of the effective oxygen
As a result, this method typically requires an additional tech-   absorption cross section on the mercury lamp is the result of
nique to verify both the purity and output concentration of       the overlap between several features of the highly structured
HONO (Pérez et al., 2007; Gingerysty and Osthoff, 2020).          Schumann–Runge band and the lamp emission at 184.9 nm
While appropriate for a laboratory setting, these limitations,    that depends on the operating conditions due to line reversal
along with the long warmup times needed to ensure stability,      (Lanzendorf et al., 1997) and potential fluorescence of the
can make this method less suitable for calibration in a field     fused silica envelope (Cantrell et al., 1997).
setting.                                                             Using Eqs. (3)–(5), a known concentration of OH can be
   Instead, the sensitivity of the LP/LIF instrument to HONO      produced from known concentrations of water vapor and
(RHONO ) is determined from (1) the photofragmentation ef-        ozone, and the instrumental sensitivity towards OH (Eq. 6)
ficiency of HONO by the 355 nm laser (PE) and (2) the sen-        can be derived from the measured fluorescence signal (SOH )

Atmos. Meas. Tech., 14, 6039–6056, 2021                                            https://doi.org/10.5194/amt-14-6039-2021
B. Bottorff et al.: Development of a laser-photofragmentation laser-induced fluorescence instrument 6045
and normalized to the power of the 308 nm laser emis- light source relative to the exit of the calibrator (Dusanter
sion (P308 ) (Dusanter et al., 2008). Typical ROH values et al., 2008). These measurements indicate that 20 %–30 %
vary with ambient water-vapor concentrations due to col- of the OH and HO2 radicals produced are lost due to reaction
lisional quenching of excited OH radicals and range from with the calibrator surfaces as well as loss due to the OH +
1.5–4 × 10⁻⁸ counts s−1 (cm−3 mW)−1 (Fig. S3), with an es- HO2 reaction. Model simulations indicate that a first-order
timated uncertainty of 18 % (1σ ) (Dusanter et al., 2008). loss rate of 2.6 s−1 is needed to match this observed loss
Compared to the IU-FAGE instrument, the OH sensitivity of of OH radicals in the calibrator in the absence of NO, and
this detection cell is approximately a factor of 5–20 times this loss rate has been included in the simulations (Fig. 5a).
lower per milliwatt of laser power due to the multi-pass laser However, these simulations suggest that during photolysis ef-
design of the IU-FAGE instrument compared to the single- ficiency calibrations, the excess of NO is sufficient to ensure
pass design described here. However, while the single-pass that reaction with NO is the dominant radical sink, account-
design does not eliminate potential laser-generated interfer- ing for greater than 95 % of the total loss of OH, with less
ences, it significantly reduces laser-generated OH from Re- than 3 % of the OH radicals lost via surface reactions and
actions (R4) and (R5) as there is no beam overlap, and the less than 2 % lost by the OH + HO2 and other radical–radical
smaller beam size reduces the potential for double pulsing reactions. Model simulations of this chemistry also suggest
of the sampled air compared to the multi-pass design at the that after addition of NO, the OH and HO2 concentrations are
same laser power. This allows for higher laser powers to be negligible and the concentration of HONO is nearly equal to
employed in the single-pass instrument, improving the limit the total OH and HO2 concentrations produced by the cali-
of detection with significantly lower laser-generated interfer- brator (Fig. 5b).
ences. Figure 6 illustrates a typical measurement of the
SOH photofragmentation efficiency. The original signal from the
ROH = (6) initial amount of OH produced in the calibrator in the ab-
[OH] × P308
sence of added NO is shown in panel (a) (Sinitial OH ), and the
A schematic of the calibrator is shown in Fig. S2. The cal- remaining OH concentration after NO is added to the cal-
ibrator consists of a rectangular flow reactor made of alu- ibrator is shown in panel (b), with the 355 nm photofrag-
minum (1.27 × 1.27 × 30 cm) equipped with a quartz win- mentation laser blocked from entering the detection cell
dow on two sides (Dusanter et al., 2008). The light source is (Sremaining OH ). This remaining OH signal is likely due to
a low-pressure mercury lamp (UVP Inc) housed in an alu- reactant segregation in the turbulent flow of the calibrator
minum cartridge that is continuously purged with dry ni- preventing all of the OH from reacting with the added NO.
trogen to prevent light absorption by atmospheric gases as When the 355 nm photofragmentation laser is turned on, the
well as helping to stabilize the temperature of the lamp. A increase in the signal relative to the remaining OH reflects
10 SLPM flow of humidified air is used to create a turbulent the additional OH produced in the detection cell from HONO
flow in the reactor. Mixing ratios of water vapor and ozone photolysis (SHONO+remaining OH ) (Fig. 6c). Model simula-
are monitored in the flow exiting the calibrator using com- tions indicate that reformation of HONO from reaction of
mercial analyzers (Dusanter et al., 2008). the OH fragment with the added NO is negligible due to
Once a stable concentration of OH and HO2 is produced in the reduced concentrations of both OH and NO in the low-
the calibrator after the lamp flux and water-vapor concentra- pressure detection cell and the short reaction time between
tion have stabilized, the photofragmentation efficiency (PE) the photofragmentation and excitation laser pulses. Addition-
of HONO is determined by adding an excess of NO (approx- ally, impurities in the NO cylinder appear to be photolyzed by
imately 800 ppb) to the calibrator to convert the known con- the 355 nm photofragmentation laser, leading to a small pro-
centrations of OH and HO2 into HONO through the HO2 + duction of OH that is observed when the radical source in the
NO → OH + NO2 and OH + NO → HONO reactions. Fig- calibrator is turned off (Fig. 6d). This impurity must be sub-
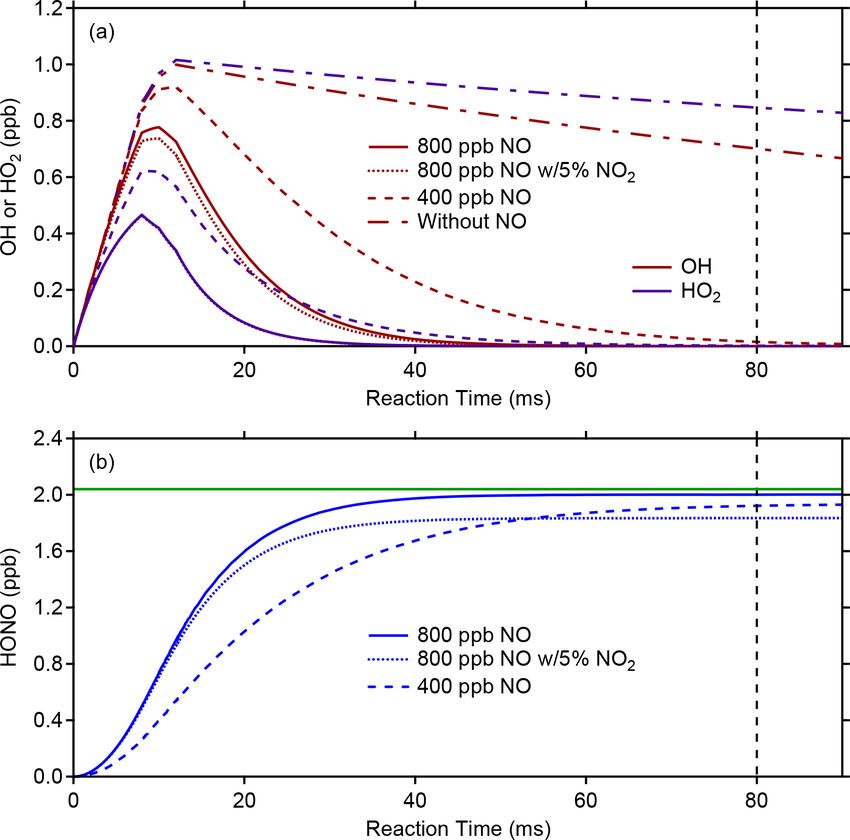
ure 5 illustrates model simulations of the conversion of OH tracted from the signal recovered as HONO and is measured
and HO2 into HONO using the RACM2 mechanism con- by turning the mercury lamp off but keeping the 355 nm laser
strained to the concentrations of water vapor and oxygen. emission on (Simpurity ). This impurity is not observed when
After production of OH and HO2 in the illuminated region the 355 nm laser is blocked from entering the detection cell.
of the calibrator (first 10 ms), reactions with NO lead to the The source of this impurity is not clear but could be the result
production of HONO after the approximate 80 ms residence of heterogeneous reactions of NO2 in the calibration system
time inside the calibrator. In these simulations, the photoly- leading to the production of impurity HONO. Experiments
sis of water vapor is adjusted to produce approximately 1 ppb employing the use of a scrubber to remove NO2 from the
of both OH and HO2 in the calibrator, which in the absence cylinder such as iron (II) sulfate heptahydrate (FeSO4 q7H2 O,
of NO decreases after illumination due to loss from radical– Fisher Scientific) did not appear to impact the OH signal due
radical reactions and surface loss (Fig. 5a). During typical to the impurity, suggesting that production of this impurity
OH sensitivity calibrations, the loss of radicals in the ab- may occur inside the NO cylinder. Additional experiments
sence of NO is measured by changing the location of the will be needed to identify this impurity.
https://doi.org/10.5194/amt-14-6039-2021 Atmos. Meas. Tech., 14, 6039–6056, 20216046 B. Bottorff et al.: Development of a laser-photofragmentation laser-induced fluorescence instrument
The HONO photolysis efficiency (PE) of the 355 nm laser
can be calculated as the ratio of OH signal recovered as
HONO to the net OH and HO2 concentrations produced in
the calibrator. This can also be written as the ratio of net
HONO signal to the initial OH signal, after corrections to
account for the 20 %–30 % OH radical loss due to the OH +
HO2 reaction and reaction on the walls of the calibrator based
on measurements in the absence of NO as described above
(Sinitial OH,corr ). Because the calibrator produces equal con-
centrations of OH and HO2 , the factor of 2 accounts for the
conversion of the produced HO2 to OH when NO is added.
SHONO+remaining OH − Sremaining OH − Simpurity
PE = (7)
2 Sinitial OH,corr − Sremaining OH
Photolysis efficiency measurements are typically performed
before and after ambient measurement periods, and vari-
ations between measurement periods are likely caused by
shifts in the alignment of the 355 nm photolysis laser. Typ-
ical PE values for the measurement periods described below
were between 0.25 % and 0.34 % for a 355 nm laser power of
approximately 1.5 W. Impurities in the added NO that react
Figure 5. Photolysis efficiency (PE) calibration modeling. The top quickly with OH and compete with reaction of NO, such as
plot illustrates the modeled evolution of OH (red lines) or HO2 (blue NO2 , could lead to apparent lower photofragmentation effi-
lines) in the presence of 400 (dashed line) or 800 ppb (solid line) of ciencies by reducing the amount of HONO produced in the
NO, while the bottom plot shows the modeled HONO production calibrator. Model simulations suggest that a 5 % NO2 im-
(blue lines). The vertical black dashed line represents the approx- purity could reduce the production of HONO by approxi-
imate reaction time between the onset of radical production from mately 10 % due to reaction of OH with NO2 instead of NO
184.9 nm photolysis of water and the exit of the calibration source (Fig. 5b). As a result, the NO added should be of high purity,
at a flow rate of 10 SLPM. The horizontal green line represents the
and chemical scrubbers designed to reduce impurities such
total radicals produced in the photolysis region in the absence of
NO. The dotted line represents a simulation with 800 ppb of NO
as NO2 should be used.
with a 5 % NO2 impurity (see text). For ambient measurements, the concentration of HONO is
determined from the net HONO signal (NetHONO , Fig. 4) and
the HONO sensitivity (RHONO ).
NETHONO NETHONO
[HONO] = = (8)
RHONO ROH × PE
For typical ROH values ranging from 1.5–
4 × 10⁻⁸ counts s−1 cm3 mW−1 and PE values between
0.25 %–0.34 %, minimum detectable HONO concentrations
(1σ ) are typically between 9 and 18 ppt for a 10 min average
in the absence of OH (laser power 1.5 W at 355 nm, 1–3 mW
at 308 nm). Because the limit of detection depends on the
ambient OH signal that is subtracted from the HONO signal,
the limit of detection reported here will be higher during
Figure 6. Example of photofragmentation efficiency measurements
the day compared to at night. For the highest sensitivity,
from an OH + NO → HONO calibration. (a) The signal observed
from total amount of OH produced in the calibrator (Sinitial OH ).
308 nm laser power, and photofragmentation efficiency
(b) Signal observed from remaining OH after the addition of NO described above, a daytime maximum concentration of
converts the majority of radicals to HONO (Sremaining OH ). (c) Sum OH of 4 × 106 cm3 would increase the HONO limit of
of signal from remaining OH and signal from OH produced in detection by approximately 20 % (10 min average). The
the detection cell after HONO photolysis (SHONO+remaining OH ). overall calibration uncertainty is estimated to be 35 %
(d) Signal from the 355 nm photolysis of impurities in the NO cylin- (1σ ), including the uncertainty associated with the OH
der observed when the radical source in the calibrator is turned off calibration (18 %, 1σ ), and depends on the precision of the
(Simpurity ). photofragmentation efficiency measurement. With the same
parameters, the OH limit of detection is typically between
Atmos. Meas. Tech., 14, 6039–6056, 2021 https://doi.org/10.5194/amt-14-6039-2021B. Bottorff et al.: Development of a laser-photofragmentation laser-induced fluorescence instrument 6047
1.1 and 2.2 × 106 cm−3 (S/N = 1, 10 min average, laser ble S1 in the Supplement). The first of two measurement
power 1–3 mW at 308 nm). periods occurred during the summer of 2019 at a forested
The limit of detection for HONO described above is sim- site within the Indiana University Research and Teaching
ilar to that reported by Dyson et al. (2021) in a labora- Preserve (IURTP) (39.1908◦ N, 86.502◦ W), located approxi-
tory setting using a similar instrument employing a 355 nm mately 2.5 km northeast of the IU campus (Lew et al., 2020).
laser operating at 10 Hz for photofragmentation of HONO, The mixed deciduous forest is dominated by emissions of
as well as detection of OH at 308 nm using a dye laser op- isoprene and monoterpenes and is approximately 1 km away
erating at 5 kHz (12 ppt, 50 s average). While the details of from the nearest high-traffic road. The LP/LIF sampling axis
the photofragmentation laser in this study were not provided, was placed in a small clearing 5 m from the IURTP field lab
the lower repetition rate of the 355 nm laser likely leads to building, and sampling occurred approximately 0.5 m above
a higher pulse energy and a higher photofragmentation effi- a grassy surface to measure potential HONO emissions from
ciency compared to the 10 kHz photofragmentation laser em- the soil. Additional measurements of NO and NO2 were con-
ployed in this study. However, the higher pulse energy could ducted using a commercial chemiluminescence instrument
lead to photolysis of other ambient species that produce OH (Thermo Environmental Instruments Inc. Model 42C), and
and interfere with the measurements of HONO (see below). measurements of the photolysis rate constant for NO2 (JNO2 )
However, these potential interferences can be minimized in a were conducted using a radiometer.
laboratory setting. An average of HONO measurements from 4–8 Septem-
As mentioned above, the large uncertainty associated with ber 2019 is presented in Fig. 7a. At this site, average mixing
the photofragmentation measurements is likely due to shifts ratios of NO2 varied from less than 500 ppt at night up to ap-
in the overlap between the two laser beams as a result of proximately 1 ppb during morning rush hour, while mixing
temperature fluctuations impacting the optical alignment. Al- ratios of NO were below the detection limit of the instrument
though this uncertainty is currently large, measurements of but estimated to be less than 300 ppt based on previous mea-
HONO were in good agreement with an acetate CIMS instru- surements of the NO2 /NO ratio at this site (Lew et al., 2020).
ment during the recent HOMEChem (House Observations At night, HONO mixing ratios ranged from approximately
of Microbial and Environmental Chemistry) indoor measure- 35 ppt to 75 ppt. Maximum observed HONO mixing ratios
ment campaign (Wang et al., 2020a). Overall, the measure- of approximately 150 ppt occurred during the day, indicat-
ments of HONO by the LP/LIF instrument agreed with the ing the presence of strong HONO sources that can compete
CIMS measurements to within ±20 %, on average, suggest- with the loss of HONO due to photolysis during the day-
ing that variations of the photofragmentation efficiency over time. Measurements of OH radical concentrations for these
the entire month-long campaign were less than the overall days by this instrument using spectral modulation to deter-
instrumental uncertainty reported here. An example of the mine the instrument background reached a maximum value
measurements during the intercomparison is illustrated be- of 6–8 × 106 cm−3 , similar to that observed previously by
low, and a detailed analysis of the intercomparison, includ- the IU-FAGE instrument at this site after measured interfer-
ing an analysis of the spatial distribution of indoor HONO ences were subtracted (Lew et al., 2020). While it is possible
emissions, will be presented in a future publication. that the LP/LIF instrument is also subject to unknown OH in-
terferences, the single-pass laser system minimizes the effect
of laser-generated interferences compared to the multi-pass
3 Results and discussion system utilized by the IU-FAGE instrument. In addition, un-
known interferences observed using chemical modulation by
3.1 Outdoor measurements the IU-FAGE instrument correlated with increases in temper-
ature. Average temperatures during the measurement period
The LP/LIF instrument was deployed in two locations on were lower than the summer measurement period described
the Indiana University campus in Bloomington to measure in Lew et al. (2020), suggesting that any unknown interfer-
outdoor concentrations of HONO as a test of the instru- ences may not have been detectable.
ment. As HONO was the focus of these measurement pe- Nevertheless, because measurements of potential inter-
riods, chemical modulation cycles were not performed, and ferences using chemical modulation were not conducted
the OH measurements presented may be impacted by un- during these days, the measured OH concentrations rep-
known interferences. During the outdoor measurement pe- resent an upper limit to the actual OH concentrations
riods described below the instrumental sensitivity to OH and the [HONO]/[OH] ratio a lower limit. The measured
was ∼ 3 × 10⁻⁸ counts s−1 (cm−3 mW)−1 , and the measured [HONO]/[OH] ratio was relatively constant during the
photolysis efficiency was 0.25 % for a laser power of ap- day, resulting in an average value of approximately 1000
proximately 1.5 W at 355 nm, resulting in a limit of de- at this site. These values are greater than the estimated
tection for HONO of approximately 18 ppt (10 min aver- [HONO]/[OH] ratio assuming steady-state production and
age, 1σ ) and a limit of detection for OH of approximately loss using Reactions (R2) and (R1) and assuming the loss of
5 × 105 cm−3 (1 h average, 1σ , 1–3 mW at 308 nm) (Ta- HONO by Reaction (R3) is negligible compared to loss by
https://doi.org/10.5194/amt-14-6039-2021 Atmos. Meas. Tech., 14, 6039–6056, 20216048 B. Bottorff et al.: Development of a laser-photofragmentation laser-induced fluorescence instrument
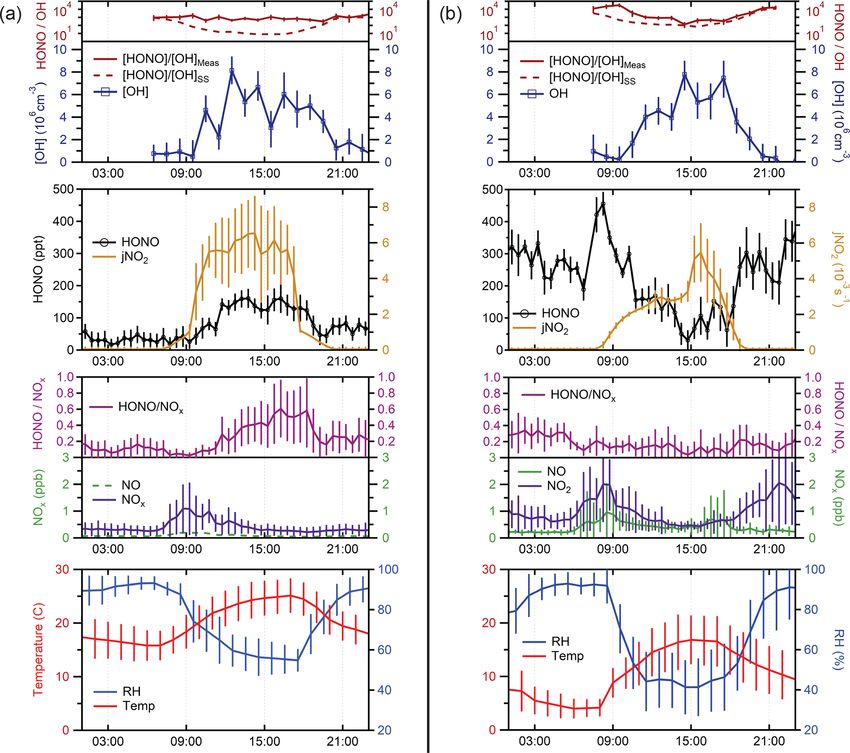
Figure 7. Average measurements of HONO, OH, HONO/OH, JNO2 , temperature, RH, NOx , and HONO/NOx from (a) the forested site
and (b) the urban site. Mixing ratios of NO at the forested site were estimated based on previous measurements of the NO/NO2 ratio at this
site (dashed green line). During the measurement period conducted at the urban site, the detection cell was partially shaded by the building
during the morning and early afternoon, resulting in the observed peak in JNO2 at 15:00. Error bars represent the standard deviation of the
diurnal average measurements (1σ ).
photolysis (Reaction R1). due to soil emissions mediated by the microbial community
structure at this site (Mushinski et al., 2019).
[HONO] kOH+NO [NO] A second outdoor measurement period occurred on the
≈ (9) roof of the Multidisciplinary Science Building II near the
[OH] SS JHONO
center of the Indiana University Bloomington campus. Sam-
Because the mixing ratio of NO was below the detection pling occurred at a height of approximately 12 m above
limit of the instrument (less than approximately 500 ppt), the ground and 1–5 m away from building surfaces. This
the concentration of NO used in this equation was estimated measurement site is adjacent to local roads and is influ-
based on previous measurements of the NO/NOx ratio at enced by direct emissions from traffic and other anthro-
this site. The value of JHONO was calculated as a function pogenic sources. Average measurements from 14 and 15 Oc-
of solar zenith angle (Jenkin et al., 1997) and corrected for tober 2019 are shown in Fig. 7b. At this location, mixing ra-
cloud coverage according to measured JNO2 values. As illus- tios of NO were typically 0.25 ppb at night and increasing
trated in Fig. 7a, the estimated [HONO]/[OH] ratio using this to approximately 0.7–1 ppb during the morning and evening
equation agrees with the measured ratio in the morning and rush hours. NO2 varied from 0.5 to 2 ppb during the day and
evening but decreased in the afternoon to a value of approx- night, higher than that observed at the IURTP site. Overall,
imately 10 as photolysis of HONO increased, returning to a HONO mixing ratios were higher than those observed at the
value of approximately 1000 in the evening. The difference IURTP, with maximum mixing ratios of 350–400 ppt at night
between the measured and modeled ratio reflects the magni- decreasing to 50–100 ppt during the day. Measured OH con-
tude of the missing HONO source in this environment, likely centrations by the instrument were similar to that observed
Atmos. Meas. Tech., 14, 6039–6056, 2021 https://doi.org/10.5194/amt-14-6039-2021B. Bottorff et al.: Development of a laser-photofragmentation laser-induced fluorescence instrument 6049
at the forested site, with maximum observed concentrations
of 6–8 × 106 cm−3 . As at the forest site, chemical modula-
tion experiments to measure unknown interferences were not
done during these days; thus these OH measurements repre-
sent an upper limit to the actual OH measurements. In con-
trast to the forest site, the measured [HONO]/[OH] ratio at
the urban site varied during the course of the day, decreasing
from a value of approximately 104 during the morning to a
value of approximately 100 during the afternoon and increas-
ing to a value of 104 in the evening. This trend is similar to
that estimated by the steady-state [HONO]/[OH] ratio using
Eq. (9). While the ratio estimated by this equation reproduces
the measured ratio in the afternoon and evening, it underes-
Figure 8. HONO (blue) and temperature (red) data from the 4 June
timates the measured ratio in the morning, again suggesting ventilation experiment during the HOMEChem study. Shaded areas
that there is an additional source of HONO at this site either represent ventilation periods (open doors and windows).
from direct emissions or heterogeneous production.
3.2 Indoor measurements to minimize variations due to the on–off cycling of the sys-
tem. As a result, the indoor temperature of the house slowly
In 2018, the LP/LIF instrument was deployed inside a test increased until the unit was turned on at the end of the exper-
house in Austin, Texas, as part of the HOMEChem study iment. The observed increase in HONO as the temperatures
(Farmer et al., 2019). HOMEChem was a collaborative increased within the house during the experiment suggests
field study intended to investigate how household activities that the equilibrium is temperature dependent (Fig. 8).
influence emissions and chemistry of gases and particles Figure 9a illustrates an example of the LP/LIF mea-
within the indoor environment. During the campaign HONO surements and the University of Toronto CIMS instrument
was measured by the Indiana University LP/LIF instrument (Collins et al., 2018) during a cooking event using a gas stove
as well a high-resolution time-of-flight chemical ionization during HOMEChem. During this experiment, mixing ratios
mass spectrometer (HR-ToF-CIMS) from the University of of HONO were approximately 2 ppb for several hours prior
Toronto (Collins et al., 2018). Several cooking and cleaning to the cooking episode. When the gas stove was turned on,
perturbation experiments were performed from 5–28 June. mixing ratios of HONO quickly increased to approximately
During this period the instrumental sensitivity to OH was 6 ppb before slowly decaying after the gas stove was turned
∼ 2.75 × 10⁻⁸ counts s−1 (cm−3 mW)−1 , and the measured off. As illustrated in this figure, the LP/LIF measurements of
photolysis efficiency was 0.34 % (1.5 W at 355 nm), result- HONO were in excellent agreement with the CIMS measure-
ing in a limit of detection for HONO of approximately 9 ppt ments during this event, with the measurements agreeing to
(10 min average, 1σ , 1–3 mW at 308 nm) (Table S1). Re- less than 20 %, and are representative of the overall agree-
sults from these experiments are summarized in Wang et ment during the intercomparison, which will be presented
al. (2020a). in a future publication. These results provide confidence in
The LP/LIF sampling axis was placed in the living area the accuracy of the LP/LIF instrument and the calibration
of a 111 m2 manufactured home, adjacent to two westward- method.
facing windows. Results from a repeated set of enhanced
ventilation experiments, where all of the windows and doors 3.3 Potential interferences
of the house were opened, are presented in Fig. 8. During
the ventilation periods the HONO mixing ratio was reduced Potential interferences with outdoor measurements of
to approximately 1 ppb due to mixing with outdoor air and HONO include species that photolyze at 355 nm, leading
returned to a steady state of 3–4 ppb within 20–30 min af- to both prompt and secondary production of OH in the de-
ter ventilation was stopped. The fast return to steady-state tection cell. Possible prompt interferences include HNO3 ,
concentrations after ventilation ceased indicates that gas- H2 O2 , and organic peroxides, while potential secondary in-
phase HONO is in equilibrium with a reservoir of HONO terferences include species that could produce OH precursors
precursors on interior surfaces (Collins et al., 2018). These from photolysis, such as HO2 from the photolysis of HCHO
values are similar to those measured by the University of and HO2 NO2 , which could react to produce OH. A previous
Toronto CIMS instrument during this experiment (Wang et analysis of the impact of these species on the atmospheric
al., 2020b), and a more complete instrumental intercompar- pressure LP/LIF instrument by Liao et al. (2006a) suggested
ison of the HOMEChem HONO measurements will be pre- that the photolysis of typical ambient mixing ratios of these
sented in a future publication. Additionally, during this ex- species would not lead to the production of significant OH
periment, the air conditioning unit in the house was turned off concentrations at a photofragmentation laser pulse energy
https://doi.org/10.5194/amt-14-6039-2021 Atmos. Meas. Tech., 14, 6039–6056, 20216050 B. Bottorff et al.: Development of a laser-photofragmentation laser-induced fluorescence instrument Figure 9. Measurements of HONO by the LP/LIF instrument (red points) and the University of Toronto CIMS instrument (blue points) from a cooking experiment (a) and a bleach mopping experiment (b) during the HOMEChem study illustrating the interference in the LP/LIF instrument from HOCl (green line) measured by the Colorado State University CIMS instrument. The correlation coefficients for the bleach mopping experiment exclude the LP/LIF measurements when HOCl was elevated (grey points). of approximately 700 mJ at 355 nm, with 1 ppb of HCHO experiment during HOMEChem that resulted in the produc- and 1 ppb HO2 NO2 together estimated to produce 0.16 ppt of tion of approximately 100–200 ppb of HOCl measured by OH, 1 ppb of H2 O2 estimated to produce 1.1 ppt of OH, and the Colorado State University CIMS instrument (Farmer et 1 ppb of HNO3 estimated to produce 0.03 ppt of OH (Liao et al., 2019). During several of these episodes, measurements al., 2006a). Given that the LP/LIF instrument described here of HONO by the LP/LIF increased and were correlated with utilizes a much lower pulse energy (0.2 mJ) and the mixing the HOCl measurements while the HONO measurements ratios of potential interfering species are reduced upon sam- by the University of Toronto CIMS instrument decreased as pling at low pressure, it is likely that any OH produced by expected during these bleach mopping episodes, as the in- photolysis of these species would be significantly less than crease in pH likely impacted the surface equilibrium produc- that estimated by Liao et al. (2006a) and would not signif- tion of HONO (Collins et al., 2018; Wang et al., 2020b). icantly interfere with outdoor HONO measurements. In ad- Although the absorption cross section of HOCl is approx- dition, the short time interval between the 355 and 308 nm imately a factor of 40–50 times lower than that of HONO laser pulses likely minimizes these and other secondary in- (1.2 × 10⁻²⁰ cm2 ) (Burkholder et al., 2019), the indoor mix- terferences. ing ratios of HOCl during several of these mopping episodes During HOMEChem, measurements of gas-phase organ- were 50–100 times greater than the mixing ratios of HONO ics were generally higher indoors than outdoors across a during these experiments. Bleach mopping experiments that broad range of species that were further enhanced during produced lower mixing ratios of HOCl (less than 12 ppb) re- cooking events (Farmer et al., 2019). The cooking events sulted in lower interferences in the LP/LIF instrument and likely increased the concentration of formaldehyde, as com- better agreement with the CIMS instrument. This interfer- bustion from gas stoves can be a significant source of ence will be examined in more detail in a future publication. formaldehyde, resulting in indoor mixing ratios potentially It appears unlikely that outdoor mixing ratios of HOCl would greater than 10 ppb (Salthammer et al., 2010; Logue et al., be a significant interference given that HOCl mixing ratios in 2014). The agreement of the LP/LIF instrument with the marine environments are generally less than 1 ppb (Lawler et CIMS instrument during these events such as that illustrated al., 2011), much lower than the level of indoor HOCl that in Fig. 9a suggests that interferences from the photolysis of produced an interference during HOMEChem. While the ab- formaldehyde or the potential reduction of the photofrag- sorption cross sections of HOBr and HOI are factors of ap- mentation efficiency due to absorption of the 355 nm laser by proximately 10 and 30 times greater than that of HOCl at formaldehyde are likely minimal. Unfortunately, formalde- 355 nm (Burkholder et al., 2019), outdoor ambient mixing hyde concentrations were not quantified during HOME- ratios of HOBr and HOI are much lower than ambient HOCl, Chem, and additional measurements together with quantifi- with measured values of HOBr less than 26 ppt in the arctic cation of formaldehyde concentrations will be needed to con- marine boundary layer (Liao et al., 2012) and measured mix- firm these results. ing ratios of HOI less than 70 ppt in the marine boundary However, higher concentrations of other species that pho- layer (Tham et al., 2021). Thus, it is unlikely that outdoor tolyze at 355 nm, leading to the formation of OH, could in- mixing ratios of HOBr and HOI would significantly inter- terfere with measurements of HONO. One possible indoor fere with LP/LIF measurements of HONO. However, these interference is HOCl, which can be produced during chlorine and other potential interferences, both prompt and secondary, bleach mopping episodes. Figure 9b shows a bleach mopping will need to be tested in the laboratory. Atmos. Meas. Tech., 14, 6039–6056, 2021 https://doi.org/10.5194/amt-14-6039-2021
You can also read


