Spatio-temporal associations between deforestation and malaria incidence in Lao - PDR - eLife
←
→
Page content transcription
If your browser does not render page correctly, please read the page content below
RESEARCH ARTICLE

                                    Spatio-temporal associations between
                                    deforestation and malaria incidence in Lao
                                    PDR
                                    Francois Rerolle1,2*, Emily Dantzer1, Andrew A Lover3, John M Marshall4,
                                    Bouasy Hongvanthong5, Hugh JW Sturrock1,2, Adam Bennett1,2
                                    1
                                      Malaria Elimination Initiative, The Global Health Group, University of California,
                                    San Francisco, San Francisco, United States; 2Department of Epidemiology and
                                    Biostatistics, University of California, San Francisco, San Francisco, United States;
                                    3
                                      Department of Biostatistics and Epidemiology, School of Public Health and Health
                                    Sciences, University of Massachusetts Amherst, Amherst, United States; 4Division of
                                    Epidemiology and Biostatistics, School of Public Health, University of California,
                                    Berkeley, Berkeley, United States; 5Center for Malariology, Parasitology and
                                    Entomology, Ministry of Health, Vientiane, Lao People’s Democratic Republic

                                    Abstract As countries in the Greater Mekong Sub-region (GMS) increasingly focus their malaria
                                    control and elimination efforts on reducing forest-related transmission, greater understanding of
                                    the relationship between deforestation and malaria incidence will be essential for programs to
                                    assess and meet their 2030 elimination goals. Leveraging village-level health facility surveillance
                                    data and forest cover data in a spatio-temporal modeling framework, we found evidence that
                                    deforestation is associated with short-term increases, but long-term decreases confirmed malaria
                                    case incidence in Lao People’s Democratic Republic (Lao PDR). We identified strong associations
                                    with deforestation measured within 30 km of villages but not with deforestation in the near (10 km)
                                    and immediate (1 km) vicinity. Results appear driven by deforestation in densely forested areas and
                                    were more pronounced for infections with Plasmodium falciparum (P. falciparum) than for
*For correspondence:                Plasmodium vivax (P. vivax). These findings highlight the influence of forest activities on malaria
francois.rerolle@ucsf.edu           transmission in the GMS.
Competing interests: The
authors declare that no
competing interests exist.
                                    Introduction
Funding: See page 20                Engaging in forest activities, such as logging, hunting, or spending the night in the forest, is consid-
Received: 16 March 2020             ered a primary risk factor for malaria infection in the Greater Mekong Sub-region (GMS)
Accepted: 19 February 2021          (Chaveepojnkamjorn and Pichainarong, 2004; Das et al., 2004; Lansang et al., 1997;
Published: 09 March 2021            Erhart et al., 2005; Trung et al., 2004) with recent outbreaks attributed to deforestation activities
                                    (Lyttleton, 2016). This is most likely the result of increased human exposure to the forest dwelling
Reviewing editor: Ben S
Cooper, Mahidol University,
                                    Anopheles dirus and Anopheles minimus, the most efficient and widespread malaria vectors in the
Thailand                            GMS (Obsomer et al., 2007; Obsomer et al., 2013). However, deforestation may also alter this ‘for-
                                    est malaria’ (Sharma and Kondrashin, 1991) ecosystem and eventually reduce malaria incidence, as
   Copyright Rerolle et al. This
                                    is generally accepted to be the case in Southeast Asia (Guerra et al., 2006). Several previous studies
article is distributed under the
                                    have assessed the relationship between deforestation and malaria, but the majority focused outside
terms of the Creative Commons
Attribution License, which          of the GMS, most notably in the Amazonian forest (Wayant et al., 2010; Olson et al., 2010;
permits unrestricted use and        Hahn et al., 2014a; Valle and Clark, 2013; Terrazas et al., 2015) where the evidence has been met
redistribution provided that the    with conflicting interpretations (Tucker Lima et al., 2017). As national malaria programs across the
original author and source are      GMS target forest-going populations for prevention and treatment efforts (Guyant et al., 2015;
credited.                           WHO, 2016), improved understanding of the relationship between deforestation and malaria is

Rerolle et al. eLife 2021;10:e56974. DOI: https://doi.org/10.7554/eLife.56974                                                        1 of 45
Research article Epidemiology and Global Health
eLife digest Biting mosquitos spread the malaria parasite to humans. Along the Mekong River
in Southeast Asia, spending time in the surrounding forest increases a person’s risk of malaria. This
has led to a debate about whether deforestation in this area, which is called the Greater Mekong
Sub-region (GMS), will increase or decrease malaria transmission. The answer to the debate is not
clear because some malaria-transmitting mosquitos thrive in heavily forested areas, in particular in
the GMS, while others prefer less forested areas.
Scientists studying malaria in the Amazon in South America suspect that malaria transmission
increases shortly after deforestation but decreases six to eight years later. Some studies have tested
this ‘frontier malaria’ theory but the results have been conflicting. Fewer studies have tested this
theory in Southeast Asia. But deforestation has been blamed for recent malaria outbreaks in the
GMS.
Using data on malaria testing and forest cover in the GMS, Rerolle et al. show that deforestation
around villages increases malaria transmission in the first two years and decreases malaria rates
later. This trend was driven mostly by a type of malaria called Plasmodium falciparum and was less
strong for Plasmodium vivax. The location of deforested areas also mattered. Deforestation within
one to 10 kilometer of villages did not affect malaria rates. Deforestation further away in about a 30
kilometer radius did affect malaria transmission. Rerolle et al. suggest this may be because villagers
have to spend longer times trekking through forests to hunt or harvest wood when the wider area is
deforested.
Currently, National Malaria Control Programs in the GMS focus their efforts on reducing forest-
related transmission. This study strengthens the evidence supporting this approach. The results also
suggest that different malaria elimination strategies may be necessary for different types of malaria
parasite. Using this new information could help malaria control programs better target resources or
educate villagers on how to protect themselves. The innovative methods used by Rerolle et al.
reveal a more complex role of deforestation in malaria transmission and may inspire other scientists
to think more carefully about environmental drivers of malaria.
critical for programs to assess and meet national 2030 malaria elimination goals (World Health
Organization, 2016; WHO, 2018).
In the Amazon, the ‘frontier malaria’ hypothesis (Sawyer, 1988) posits that malaria temporarily
increases following deforestation efforts to open a human settlement area in the forest. Subse-
quently, after approximately 6–8 years, settlements become more urbanized and isolated from the
surrounding forest, and less suitable for malaria vectors, resulting in reduced malaria transmission
(de Castro et al., 2006). Recent work has challenged this hypothesis, however, and found that some
older settlements were also likely to have high malaria incidence (Ilacqua et al., 2018), highlighting
the importance of assessing the relationship between deforestation and malaria at different spatio-
temporal scales (Singer and de Castro, 2006).
A recent review of the literature on deforestation and malaria in the Amazon (Tucker Lima et al.,
2017) recommended the integration of multiple socio-economic, demographic and ecological mech-
anisms to disentangle the relationship between deforestation and malaria. The complexity of land-
use changes driving deforestation such as urbanization, agriculture, irrigation or resource mining can
alter the environment in different ways. For example, deforestation in the Amazon has been shown
to increase mosquitoes’ larval habitat (Vittor et al., 2009) through the creation of areas with abun-
dant sunlight and pooling water, resulting in increased human biting activity (Vittor et al., 2006).
Alternatively, immigration and rapid population movements, stirring human-vector interactions, are
other mechanisms affecting malaria transmission in frontier areas (Moreno et al., 2007). A modeling
study (Baeza et al., 2017) showed that the temporal pattern of increased incidence followed by a
decrease can vary depending on ecological and socio-economic parameters in frontiers areas.
The importance of addressing complex confounding structures influencing the relationship
between deforestation and malaria was also highlighted by Bauhoff and Busch, 2020. Variables
such as temperature (Beck-Johnson et al., 2013; Mordecai et al., 2013), precipitation (Parham and
Michael, 2010; Parham et al., 2012), or seasonality Hay et al., 1998 are known environmental
Rerolle et al. eLife 2021;10:e56974. DOI: https://doi.org/10.7554/eLife.56974 2 of 45Research article Epidemiology and Global Health
predictors of malaria, although the spatio-temporal scale of those effects often varies across differ-
ent areas (Teklehaimanot et al., 2004). Furthermore, remote areas may experience higher malaria
rates because of poor access to public health services, but also have denser forest cover or lower
deforestation rates (Busch and Ferretti-Gallon, 2017). Finally, forest-going populations in the GMS
are also at higher risk for malaria (Parker et al., 2017) due to poor adherence to protective meas-
ures against mosquitoes such as insecticide-treated bed nets (ITNs) or long-lasting insecticidal ham-
mocks (LLIHs) (Peeters Grietens et al., 2010; WHO, 2016) and inadequate access to treatment
(Guyant et al., 2015).
Bauhoff and Busch, 2020 identified only 10 empirical studies that assessed the relationship
between deforestation and malaria with appropriate adjustments for confounding. Of these, seven
reported a positive association (Austin et al., 2017; Wayant et al., 2010; Olson et al., 2010;
Terrazas et al., 2015; Pattanayak et al., 2010; Garg, 2015; Fornace et al., 2016), two did not find
any associations (Bauhoff and Busch, 2020; Hahn et al., 2014a), and one disputed study found a
negative association (Valle and Clark, 2013; Hahn et al., 2014b; Valle, 2014). Most recently, a
study found deforestation to increase malaria risk and malaria to decrease deforestation activities in
the Amazon, using an instrumental variable analysis to disentangle any reverse causality loop
(MacDonald and Mordecai, 2019). However, only half of the above-mentioned studies used high-
resolution forest data, with most studies using spatially aggregated data and exploring only a limited
range of spatial and temporal scales. Only three of these studies were conducted in Southeast Asia
(Pattanayak et al., 2010; Garg, 2015; Fornace et al., 2016), and none in the GMS. Importantly, all
three found that malaria increases after deforestation, but all had limitations. The two studies in
Indonesia Pattanayak et al., 2010; Garg, 2015 used coarsely aggregated forest data and poten-
tially biased self-reported malaria data. The third study, in Malaysia (Fornace et al., 2016), focused
on a specific and geographically confined malaria parasite, Plasmodium knowlesi, whose primary
host is the long-tailed macaque and whose presence in the GMS, where P. falciparum and P. vivax
dominate, is limited.
In this analysis, we examined the relationship between deforestation and malaria incidence by
combining high-resolution forest coverage data (Hansen et al., 2013) and monthly malaria incidence
data from 2013 to 2016 from two separate regions in the GMS: northern Lao People’s Democratic
Republic (PDR) with very low malaria transmission and southern Lao PDR where P. falciparum and P.
vivax are seasonal. By conducting the analysis at the village level, we were able to explore a wide
range of spatial scales (1, 10, and 30 km around villages) that might be relevant in characterizing the
relationship between deforestation and malaria. In addition, we leveraged the longitudinal nature of
both the incidence data collected and the forest data produced from annual remote sensing imagery
(Hansen et al., 2013) to explore the most relevant temporal scales. Finally, we considered alterna-
tive definitions of deforestation, restricted to areas with at least certain levels of forest cover, to
investigate the type of deforestation driving the relationship with malaria.
To date, no prior studies have quantified the relationship between deforestation and malaria inci-
dence in the GMS. Understanding this relationship is especially important in the GMS, where forest-
going activities are a main source of income generation (Lao PDR, 2016) and malaria clusters in for-
est-going populations (World Health Organization, 2016; WHO, 2016). To assess the relationship
between deforestation and malaria incidence, we modeled the monthly village-level malaria inci-
dence in two regions of Lao PDR using health facility surveillance data and evaluated the most rele-
vant spatio-temporal scale.
Results
Forest and environmental data
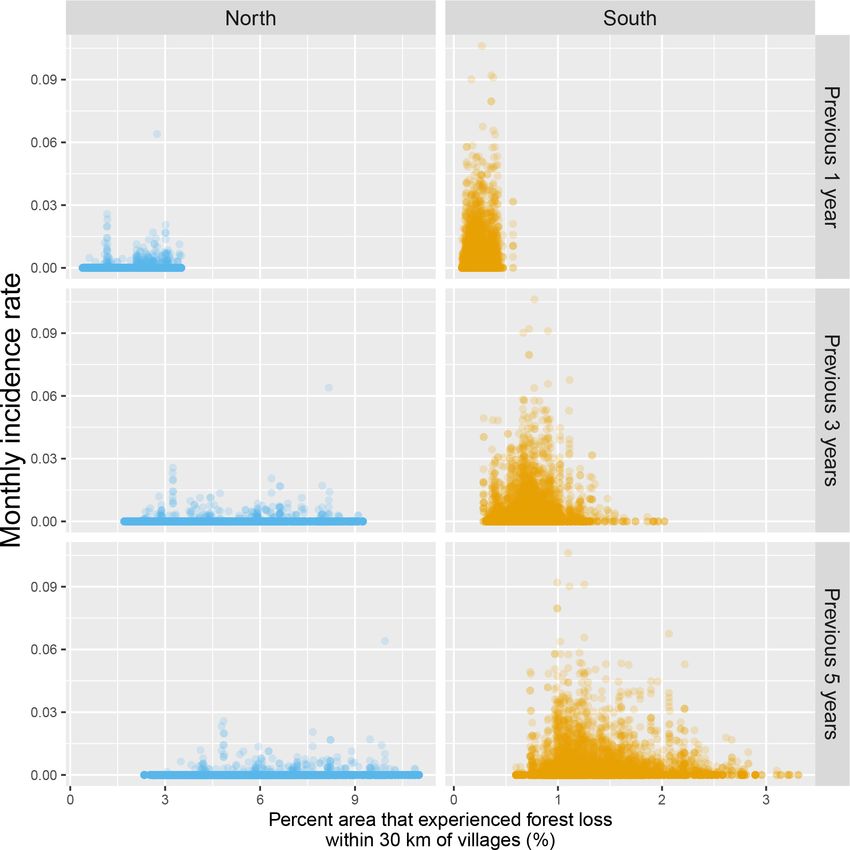
Figure 1 shows the average tree crown cover within 10 km for the year 2016 and the percent area
within 10 km that experienced forest loss between 2011 and 2016 in two regions of southern and
northern Lao PDR. Overall, the forest cover was denser in the north than in the south and deforesta-
tion over this period was higher in the north than in the south. Appendix 1—figure 6 and Appen-
dix 1—figure 7 show the distribution of forest and deforestation variables as the temporal scales
and spatial scales around study villages were varied. For example, the cumulative percent area within
30 km of a village that experienced forest loss between 2011 and 2016 ranged from 0 to 10% in the
Rerolle et al. eLife 2021;10:e56974. DOI: https://doi.org/10.7554/eLife.56974 3 of 45Research article Epidemiology and Global Health
0 20 40 60 80 100 0 5 10 15 20 25
Average tree crown cover (%) within 10 km in
(a) (b)Percent area within 10 km with forest loss be-
2016 in northern Lao PDR. tween 2011 and 2016 in northern Lao PDR.
0 20 40 60 80 100 0 5 10 15 20 25
Average tree crown cover (%) within 10 km in
(c) (d)Percent area within 10 km with forest loss be-
2016 in southern Lao PDR. tween 2011 and 2016 in southern Lao PDR.
Figure 1. Average tree crown cover (%) in 2016 (left) and percent area that experienced forest loss between 2011 and 2016 (right) within a 10 km radius
in northern (top) and southern (bottom) Lao PDR. See Materials and methods for details on forest and deforestation metrics. Upper right indent maps
northern and southern (Champasak province) Lao PDR regions.
north, whereas it rarely exceeded 2.5% in the south. Deforestation rate in 2015 within 10 km of a vil-
lage was of about 1% in the south and 2.5% in the north. The average tree crown cover increased
with increasing buffer radius around villages (1, 10, and 30 km). However, the relationship with the
Rerolle et al. eLife 2021;10:e56974. DOI: https://doi.org/10.7554/eLife.56974 4 of 45Research article Epidemiology and Global Health
percent area that experienced forest loss was less clear because both the area that experienced for-
est loss (numerator) and the area around villages (denominator) increased. Appendix 1—figure 15
and Appendix 1—figure 16 show the raw time series of forest cover and percent area with forest
loss.
The 284 villages in the north were overall less populated (mean 2015 population size: 498, IQR:
[241; 548]) than the 207 villages in the south (2015 mean: 1095, IQR: [584; 1384]), but with some
highly populated outliers. As expected, altitude differed substantially between villages of the moun-
tainous northern region (mean: 557 m, IQR: [378; 679]) and the lowlands of the south (mean: 120 m,
IQR: [98; 130]). Although both regions exhibited similar seasonal trends in precipitation and temper-
ature, with a rainy season spanning from April to October, villages in the south experienced higher
monthly precipitation and temperature than in the north over the study period (Appendix 1—figure
8).
Treatment-seeking data
For villages with an estimated travel time of 0 hr to the closest health facility (same 300 m2 pixel),
the predicted probability of seeking treatment for fever was 0.87 (95% CI: [0.79; 0.92]) in the north
and 0.78 (95% CI: [0.63; 0.89]) in the south. A 1 hr increase in travel time to the closest health facility
was associated with a similar 0.79 (95% CI: [0.55; 1.13]) reduction in the odds of seeking treatment
in the north and 0.76 (95% CI: [0.43; 1.34]) in the south, almost reaching statistical significance when
pooling data from both regions: 0.77 (95% CI: [0.56; 1.04]). See detailed results in Appendix 1 - S2.
Malaria case data
Malaria infections
A total of 63,040 patient records were abstracted from the malaria registries of all public health facil-
ities in four southern districts between October 2013 and October 2016 and 1754 from all health
facilities in four northern districts between January 2013 and December 2016.
In the south, 91.2% of the patients in the registries were tested for malaria, of which 78.1% were
tested by RDT and 26.2% by microscopy. Overall test positivity was 33.2% for any infection, 16.4%
for P. falciparum and 18.2% for P. vivax. Monthly incidence peaked to about six cases per 1000 peo-
ple in the 2014 rainy season, eventually decreasing to below one case per 1000 in 2016. Incidence
and test positivity were similar between P. falciparum and P. vivax in the south (Figure 2).
In the north, 92.1% of the patients in the registries were tested for malaria, of which 96.3% were
tested by RDT and 9.6% by microscopy. Overall test positivity was 23.8% for any infection, 2.8% for
P. falciparum and 22.5% for P. vivax. Monthly malaria incidence in the north was very low, never
exceeding 0.3 per 1000 people. Most infections in the north were P. vivax cases with only a few sea-
sonal P. falciparum cases (Figure 2).
Appendix 1—figure 9 shows the number of patients and cases recorded per month in health
facility malaria registries as well as how the smoothed test positivity rates varied over time.
Socio-demographics
Age, gender, and occupation of patients seeking treatment at health facilities were also recorded in
the malaria registries. On average, patients in the south were older than patients in the north with
mean age of 28 years and 23 years, respectively. In the north, about half of the patients were male
(53.1%), while most patients in the south were male (71.1%). Finally, the vast majority (68.2%) of
patients in the south were farmers, whereas only 8% of patients in the north were farmers. Most
patients in the north reported being unemployed (41.7%) or a student (31.2%) (Appendix 1—figure
10).
Geo-referencing
Overall, 88.1% of malaria records were matched to one of the 491 villages in study districts. The
remaining (11.7% in the south and 17.3% in the north) were removed from the analysis because of
ambiguous village names, local nicknames for small villages and dissolving and grouping of villages
over time. Test positivity in the south was similar in matched (33.1%) and unmatched (34.2%) records
but higher in matched (26.5%) than unmatched (10.5%) records in the north. No substantial differ-
ence was found in the distribution of socio-demographic variables available in malaria registries
Rerolle et al. eLife 2021;10:e56974. DOI: https://doi.org/10.7554/eLife.56974 5 of 45Research article Epidemiology and Global Health
North South
6
0.3
Incidence (per 1000)
0.2
4
0.1
2 0.0
13
4
14
5
15
6
16
01
01
01
20
20
20
20
r2
r2
r2
ct
ct
ct
ct
Ap
Ap
Ap
O
O
O
O
Species
0
Overall
80 Pf
Pv
Test positivity (%)
60
40
20
0
ct 3
Ap 13
ct 4
Ap 14
ct 5
Ap 15
ct 6
16
13
4
14
5
15
6
16
01
01
01
01
01
01
01
20
20
20
20
20
20
20
20
r2
r2
r2
r2
r2
r2
r2
ct
ct
ct
ct
Ap
Ap
Ap
Ap
O
O
O
O
O
O
O
O
Time
Figure 2. Malaria incidence (per 1000) and test positivity (%) over time. Upper left boxed indent zooms in malaria incidence in the North to better show
the temporal variation (see y axis for scale).
The online version of this article includes the following source data for figure 2:
Source data 1. Data for Figure 2.
Rerolle et al. eLife 2021;10:e56974. DOI: https://doi.org/10.7554/eLife.56974 6 of 45Research article Epidemiology and Global Health
between matched and unmatched records (Appendix 1—figure 11). Fewer than 0.3% of matched
malaria records were missing dates and also removed from the analysis.
Spatio-temporal analysis
Deforestation
Table 1 and Figure 3 show the adjusted incidence rate ratio (IRR) associated with deforestation,
measured by a 0.1% increase in the percent area that experienced forest loss, in the previous 1–5
years within 1, 10, and 30 km of villages. Models controlled for various environmental factors and
accounted for the probability of seeking treatment and the spatio-temporal structure of the data.
Deforestation within 1 or 10 km of a village was not associated with malaria incidence rate in
either the south or the north, regardless of the temporal lag. However, in the south, deforestation
within 30 km of a village in the previous 1 and 2 years was associated with higher malaria incidence
rates (e.g. 1 year lag, IRR = 1.16, 95% CI: [1.10; 1.22]). In the north, where incidence was much lower,
the results were not as clear, but a similar trend was observed with wide confidence intervals com-
patible with a short term increased risk. On the other hand, deforestation within 30 km of a village in
the previous 3, 4, or 5 years was associated with approximately a 5% lower malaria incidence rate
both in the south (e.g. 5 year lag, IRR = 0.94, 95% CI: [0.91; 0.97]) and in the north (e.g. 5 year lag,
IRR = 0.96, 95% CI: [0.93; 0.98]).
These results suggest deforestation around villages, but not in the near vicinity (1 or 10 km), is
associated with higher risk of malaria in the first 2 years and lower risk of malaria beyond. There was
stronger evidence of associations with deforestation in the south than in the north.
The IRR effect estimates in Table 1 assume a linear relationship between deforestation and
malaria. Appendix 1—figure 5 shows a few of these relationships when such linearity isn’t assumed
in the models. The functional forms reveal that they can be reasonably well summarized linearly,
especially in the south. In the north, the functional forms highlight potential non-linearities for long-
term temporal lags but come with wide confidence intervals at extreme levels of deforestation.
Table 1. IRR between malaria incidence and a 0.1% increase in the area that experienced deforestation within 1, 10, or 30 km (left-
right) of a village in the previous 1– 5 years (top-down) in northern and southern Lao PDR.
Adjusted for the probability of seeking treatment, the spatio-temporal structure of the data, the environmental covariates selected in
the model and forest cover within 30 km in the year before the deforestation temporal scale considered as well as for malaria inci-
dence in the previous 1 and 2 years. See Materials and methods for details.
South North
Time lag Buffer radius Buffer radius
1 km 10 km 30 km 1 km 10 km 30 km
Previous 1 1.01 1.16 1 1.03 1.01
1 year [0.99; 1.01] [0.99; 1.04] [1.10; 1.22] [1; 1.01] [0.99; 1.06] [0.94; 1.08]
Previous 1 1 1.08 1 1.01 0.99
2 years [0.99; 1.01] [0.98; 1.01] [1.04; 1.13] [1; 1.01] [0.99; 1.04] [0.95; 1.03]
Previous 0.99 0.98 0.93 1 1.01 0.96
3 years [0.99; 1] [0.97; 1] [0.90; 0.97] [1; 1.01] [0.99; 1.02] [0.94; 0.99]
Previous 0.99 0.98 0.94 1 1 0.97
4 years [0.99; 1] [0.97; 0.99] [0.92; 0.97] [1; 1.01] [0.99; 1.02] [0.94; 0.99]
Previous 1 0.97 0.94 1 1.01 0.96
5 years [0.99; 1] [0.96; 0.99] [0.91; 0.97] [1; 1.01] [0.99; 1.02] [0.93; 0.98]
The online version of this article includes the following source data for Table 1:
Source data 1. Data for Table 1.
Rerolle et al. eLife 2021;10:e56974. DOI: https://doi.org/10.7554/eLife.56974 7 of 45Research article Epidemiology and Global Health
P. falciparum and P. vivax
In addition to different overall levels of transmission in the north and south, the relative species com-
position also differs by region. In the north, P. vivax is more prevalent with only a few sporadic and
seasonal P. falciparum infections, whereas P. falciparum and P. vivax are co-endemic in the south
Region South North
1km 10km 30km
1 year
2 years
3 years
4 years
5 years
0.9 1.0 1.1 1.2 1.3 0.9 1.0 1.1 1.2 1.3 0.9 1.0 1.1 1.2 1.3
Incidence rate ratio (95% CI)
Figure 3. Associations between malaria incidence and a 0.1% increase in the area that experienced deforestation within 1, 10, or 30 km (left-right) of a
village in the previous 1–5 years (top-down) in Lao PDR. Adjusted for the probability of seeking treatment, the spatio-temporal structure of the data, the
environmental covariates selected in the model and forest cover within 30 km in the year before the deforestation temporal scale considered as well as
for malaria incidence in the previous 1 and 2 years. See Materials and methods for details.
The online version of this article includes the following source data for figure 3:
Source data 1. Data for Figure 3.
Rerolle et al. eLife 2021;10:e56974. DOI: https://doi.org/10.7554/eLife.56974 8 of 45Research article Epidemiology and Global Health
(Figure 2). We used the co-endemicity and the larger amount of malaria case data collected in the
south to assess the relationship between deforestation and malaria for both species separately.
Table 2 and Figure 4 show that the pattern of adjusted spatio-temporal associations identified in
Table 1 is primarily driven by P. falciparum, with no associations for deforestation in the near vicinity
of villages (1 or 10 km) but a short-term increase (e.g. 1 year lag, IRR = 1.27, 95% CI: [1.18; 1.36])
and long-term decrease (e.g. 5-year lag, IRR = 0.83, 95% CI: [0.80; 0.87]) in P. falciparum malaria
incidence for deforestation within 30 km of villages.
On the other hand, all the associations were attenuated for P. vivax infections. In the previous 2
years and within 30 km of villages, deforestation is still associated with a higher incidence of P. vivax
(e.g. 1 year lag, IRR = 1.07, 95% CI: [1.01; 1.13]) but less so than for P. falciparum. However, regard-
less of the temporal lag or spatial scale, deforestation was no longer associated with lower P. vivax
malaria risks.
Appendix 1—figure 17 plots the species-specific relationships when not assuming linearity in the
models.
Alternative definitions of deforestation and interaction with forest cover
In previous models, our definition of deforestation did not distinguish between forest losses in
densely forested areas and less forested areas. To explore potential interactions between deforesta-
tion and baseline forest cover, Table 3 and Figure 5 show how the adjusted IRR estimates vary as
we consider deforestation in more densely forested pixels only (tree crown cover over 68% and 87%
– see Materials and methods for rationale on thresholds). We conducted this secondary analysis only
for the non-null relationships previously identified, that is, when considering a 30 km buffer radius
around villages.
The associations with deforestation became more pronounced as we restricted forest losses to
more forested areas: the adjusted IRR for deforestation in the previous 1 year, within 30 km of south-
ern villages, increased from 1.16 (95% CI: [1.10; 1.22]) to 1.28 (95% CI: [1; 1.64]) when considering
deforestation in areas with more than 0% and 87% tree crown cover respectively. On the other
hand, the adjusted IRR for deforestation in the previous 5 years, within 30 km of southern villages,
decreased from 0.94 (95% CI: [0.91; 0.97]) to 0.83 (95% CI: [0.76; 0.90]) when considering deforesta-
tion in areas with more than 0% and 87% tree crown cover, respectively. A similar trend was
observed in the north, although statistical significance was not reached as frequently as in the south.
These evidence strengthen our previous results and suggest that deforestation in deep and dense
forests is more closely associated with malaria incidence in villages than deforestation in less for-
ested areas.
Discussion
Based on a large dataset of health facility surveillance records in two regions of Lao PDR, we found
evidence that deforestation around villages is associated with higher malaria incidence over the
short-term but lower incidence over the long-term (e.g, in the south, within 30 km of villages:
IRR = 1.16 [1.10; 1.22] for deforestation in the previous year and IRR = 0.93 [0.90; 0.97] for defores-
tation in the previous 3 years). Our evaluation of alternative spatial scales identified strong associa-
tions for deforestation within a 30 km radius around villages but not for deforestation in the near (10
km) and immediate (1 km) vicinity. Our results incorporated correction for the probability of seeking
treatment, modeled as a function of distance to the closest health facility, as well as adjustment for
several environmental covariates. Results appear driven by deforestation in densely forested areas
and the patterns exhibited are clearer for infections with P. falciparum than for P. vivax.
The wide availability and longitudinal nature of malaria surveillance records collected routinely by
the national program enabled exploration of the relationship between deforestation and malaria
incidence over multiple spatio-temporal scales and across different levels of forest density. The spa-
tio-temporal variability highlighted here provides insights into the causal mechanisms driving local-
scale malaria incidence in the GMS. This approach not only quantified the deforestation-malaria inci-
dence association in the GMS, but also strengthened the evidence for the key influence of forest-
going populations on malaria transmission in the GMS.
This study’s results echo the frontier malaria hypothesis from the Amazon region, which posits an
increase in malaria incidence in the first few years following deforestation and a decrease over the
Rerolle et al. eLife 2021;10:e56974. DOI: https://doi.org/10.7554/eLife.56974 9 of 45Research article Epidemiology and Global Health
Species P. falciparum P. vivax
1km 10km 30km
1 year
2 years
3 years
4 years
5 years
0.8 1.0 1.2 1.4 0.8 1.0 1.2 1.4 0.8 1.0 1.2 1.4
Incidence rate ratio (95% CI)
Figure 4. Associations between malaria incidence and a 0.1% increase in the area that experienced deforestation within 1, 10, or 30 km (left-right) of a
village in the previous 1–5 years (top-down) in southern Lao PDR, differentiated by malaria species. Adjusted for the probability of seeking treatment,
the spatio-temporal structure of the data, the environmental covariates selected in the model and forest cover within 30 km in the year before the
deforestation temporal scale considered as well as for malaria incidence in the previous 1 and 2 years. See Materials and methods for details.
The online version of this article includes the following source data for figure 4:
Source data 1. Data for Figure 4.
Rerolle et al. eLife 2021;10:e56974. DOI: https://doi.org/10.7554/eLife.56974 10 of 45Research article Epidemiology and Global Health
Table 2. IRR between malaria incidence and a 0.1% increase in the area that experienced deforestation within 1, 10, or 30 km (left-
right) of a village in the previous 1–5 years (top-down) in southern Lao PDR, differentiated by malaria species.
Adjusted for the probability of seeking treatment, the spatio-temporal structure of the data, the environmental covariates selected in
the model and forest cover within 30 km in the year before the deforestation temporal scale considered as well as for malaria inci-
dence in the previous 1 and 2 years. See Materials and methods for details.
P. falciparum P. vivax
Time lag Buffer radius Buffer radius
1 km 10 km 30 km 1 km 10 km 30 km
Previous 1 1.04 1.27 1 1 1.07
1 year [0.99; 1.02] [1.01; 1.07] [1.18; 1.36] [0.99; 1.01] [0.97; 1.02] [1.01; 1.13]
Previous 1 1.01 1.15 1 1 1.06
2 years [0.99; 1.01] [0.99; 1.03] [1.08; 1.22] [0.99; 1.01] [0.98; 1.01] [1.01; 1.11]
Previous 0.99 0.99 0.85 1 0.99 1.02
3 years [0.98; 1] [0.97; 1.01] [0.80; 0.90] [0.99; 1.01] [0.98; 1.01] [0.97; 1.06]
Previous 0.99 0.98 0.85 1 0.99 1.01
4 years [0.98; 1] [0.96; 0.99] [0.81; 0.88] [0.99; 1] [0.98; 1.01] [0.98; 1.04]
Previous 1 0.97 0.83 1 0.99 1.01
5 years [0.99; 1] [0.95; 0.98] [0.80; 0.87] [1; 1.01] [0.98; 1] [0.98; 1.04]
The online version of this article includes the following source data for Table 2:
Source data 1. Data for Table 2.
long term. However, we found an earlier inflexion point, 1–3 years after deforestation compared to
6–8 years in the Amazon (de Castro et al., 2006), most likely because of very different underlying
human processes. Indeed, the frontier malaria hypothesis considers non-indigenous human settle-
ments sprouting deeper and deeper in the forest whereas forest-going populations in the GMS are
primarily members of established forest-fringe communities who regularly tour the forest overnight
to hunt and collect wood (Dysoley et al., 2008). Industrial and agricultural projects or lucrative for-
est-based activities also attract mobile and migrant populations (MMPs) Guyant et al., 2015 in
remote forested areas of the GMS but not on the same scale as the politically and economically
driven unique colonization of the Amazon (de Castro et al., 2006).
Our results are also consistent with the three previous multivariable empirical studies (Garg, 2015;
Pattanayak et al., 2010; Fornace et al., 2016) that assessed the effect of deforestation on malaria
in Southeast Asia. Our study builds on these findings by using higher resolution forest data and
exploring additional spatio-temporal scales. Using biennial village census data from Indonesia
between 2003 and 2008 and district-aggregated remote sensing forest data, Garg, 2015 reported a
2–10.4% increase in the probability of a malaria outbreak in each village of districts that lost 1000
hectares of their forest cover in the same year. Using data from a 1996 cross-sectional household
survey conducted in a quasi-experimental setting around a protected area in Indonesia,
Pattanayak et al., 2010 found a positive association between disturbed forest (vs undisturbed) and
malaria in children under 5, again using no temporal lag. Our analysis plan was largely inspired by
Fornace et al., 2016, which used similar high-resolution forest data (Hansen et al., 2013) and 2008–
2012 incidence data from Sabah, Malaysia. They reported a 2.22 (95% CI: [1.53; 2.93]) increase in
the P. knowlesi incidence rate for villages where more than 14% (Research article Epidemiology and Global Health
Region South North
0% 68% 87%
1 year
2 years
3 years
4 years
5 years
0.75 1.00 1.25 1.50 1.75 0.75 1.00 1.25 1.50 1.75 0.75 1.00 1.25 1.50 1.75
Incidence rate ratio (95% CI)
Figure 5. Associations between malaria incidence and a 0.1% increase in the area that experienced deforestation within 30 km of a village in the
previous 1–5 years (top-down) and within areas with tree crown cover density above 0%, 68%, and 87% (left-right) in Lao PDR. Adjusted for the
probability of seeking treatment, the spatio-temporal structure of the data, the environmental covariates selected in the model and forest cover within
30 km in the year before the deforestation temporal scale considered as well as for malaria incidence in the previous 1 and 2 years. See
Materials and methods for details.
The online version of this article includes the following source data for figure 5:
Source data 1. Data for Figure 5.
deforestation variables, corrected incidence for treatment-seeking probability, and most importantly
focused on P. falciparum and P. vivax, the dominant malaria parasites in the GMS.
Rerolle et al. eLife 2021;10:e56974. DOI: https://doi.org/10.7554/eLife.56974 12 of 45Research article Epidemiology and Global Health
Table 3. IRR between malaria incidence and a 0.1% increase in the area that experienced deforestation within 30 km of a village in
the previous 1–5 years (top-down) and within areas with tree crown cover density above 0%, 68%, and 87% (left-right) in Lao PDR.
Adjusted for the probability of seeking treatment, the spatio-temporal structure of the data, the environmental covariates selected in
the model and forest cover within 30 km in the year before the deforestation temporal scale considered as well as for malaria inci-
dence in the previous 1 and 2 years. See Materials and methods for details.
South North
Deforestation within areas Deforestation within areas
with tree crown cover density above with tree crown cover density above
Time lag 0% 68% 87% 0% 68% 87%
Previous 1.16 1.32 1.28 1.01 1.04 1.34
1 year [1.10; 1.22] [1.14; 1.53] [1; 1.64] [0.94; 1.08] [0.96; 1.14] [0.99; 1.81]
Previous 1.08 1.18 1.35 0.99 0.98 0.94
2 years [1.04; 1.13] [1.08; 1.28] [1.15; 1.59] [0.95; 1.09] [0.93; 1.03] [0.80; 1.11]
Previous 0.93 0.93 0.89 0.96 0.96 0.86
3 years [0.90; 0.97] [0.89; 0.97] [0.81; 0.99] [0.94; 0.99] [0.92; 0.99] [0.76; 0.98]
Previous 0.94 0.94 0.87 0.97 0.96 0.87
4 years [0.92; 0.97] [0.91; 0.97] [0.80; 0.94] [0.94; 0.99] [0.93; 0.99] [0.78; 0.96]
Previous 0.94 0.93 0.83 0.96 0.95 0.83
5 years [0.91; 0.97] [0.90; 0.96] [0.76; 0.90] [0.93; 0.98] [0.92; 0.98] [0.75; 0.92]
The online version of this article includes the following source data for Table 3:
Source data 1. Data for Table 3.
Engaging in forest activities, such as logging, hunting or spending the night in the forest, has
been reported as a major risk factor by many studies in the region (Chaveepojnkamjorn and Pichai-
narong, 2004; Das et al., 2004; Lansang et al., 1997; Erhart et al., 2005; Trung et al., 2004). As
countries of the GMS work toward malaria elimination, the literature stresses the key role of forest-
going populations (Guyant et al., 2015; Nofal et al., 2019; Bannister-Tyrrell et al., 2019;
Wen et al., 2016; Smith and Whittaker, 2014), although research programs highlight the chal-
lenges of accessing them (Bennett et al., 2021 ; Lover et al., 2019) as well as their diversity
(Nofal et al., 2019; Bannister-Tyrrell et al., 2019). To our knowledge, no previous study has lever-
aged geo-spatial statistical analyses to characterize the importance of forest-going populations in
the GMS. Our results suggest that deforestation in dense forests (Table 3) around villages, particu-
larly areas further from the village (Table 1), is a driver of malaria in Lao PDR. We argue that this is
indicative of the existence of a key high-risk group linking the deforestation patterns identified to
malaria in the villages, namely a forest-going population. Deforestation captured by remote sensing
in this setting likely reflects locations and times of heightened activity in the forest areas near vil-
lages, and therefore greater human-vector contact. We suspect longer and deeper trips into the for-
est result in increased exposure to mosquitoes, putting forest-goers at higher risk.
We conducted this study in northern and southern Lao PDR, where the malaria species composi-
tion differs, and assessed species-specific relationships in the south where P. falciparum and P. vivax
are co-endemic. Our results highlight the challenges ahead of national programs with P. vivax elimi-
nation after successful P. falciparum elimination, as increasingly mentioned in the literature
(Cotter et al., 2013; Kaehler et al., 2019). This study identified a clear pattern of spatio-temporal
associations between P. falciparum and deforestation, but these were not apparent for P. vivax
(Table 2). The increase in P. vivax incidence in the first 2 years following deforestation was identified
as well but the associations were smaller than for P. falciparum. Importantly, deforestation was never
associated with lower risks of P. vivax. A recent study in the Amazon MacDonald and Mordecai,
Rerolle et al. eLife 2021;10:e56974. DOI: https://doi.org/10.7554/eLife.56974 13 of 45Research article Epidemiology and Global Health
Figure 6. Map of study’s districts.
2019 reported a similar attenuation of the effects of deforestation on P. vivax compared to P. falci-
parum, most likely because of P. vivax parasites’ ability to relapse months or even years after infec-
tion, which decouples the association between transmission and incidence data. These species-
specific differences may also explain why the pattern of spatio-temporal associations between
malaria and deforestation were markedly clearer in the south than in the north where P. vivax
dominates.
Rerolle et al. eLife 2021;10:e56974. DOI: https://doi.org/10.7554/eLife.56974 14 of 45Research article Epidemiology and Global Health
Tree crown cover density (%) Tree crown cover density (%)
in pixel 1 in pixel 2
100 100
92 % = tree crown cover density in 2000
90 90
80 80
70 70
60 60
54 % = tree crown cover density in 2000
50 50
40 40
30 30
20 20
10 2013 = year 10 2005 = year
of forest loss of forest loss
0 0
2000 2002 2004 2006 2008 2010 2012 2014 2016 2000 2002 2004 2006 2008 2010 2012 2014 2016
Year Year
Pixel 1
r
Village
Pixel 2
30 m
30 m
Figure 7. For every 30 m Landsat pixel within a buffer radius r (1, 10, and 30 km) of study’s villages, the tree crown cover density in 2000 and the year of
forest loss were combined to derive the deforestation and forest cover variables. The two upper plots highlight the raw data at two example pixels
from the lower plot.
Rerolle et al. eLife 2021;10:e56974. DOI: https://doi.org/10.7554/eLife.56974 15 of 45Research article Epidemiology and Global Health
Health
Household Villages Malaria
facilities
surveys coordinates registries
coordinates
Roads &
waterways 12% missing
GPS excluded
Travel time
between Geo-localized
Travel time
Land cover villages malaria
surface
and health registries
facilities
Elevation Village
Treatment
population 0.3% missing
seeking
seeking date excluded
model
treatment
Precipitation
Monthly incidence in
geo-localized villages
Geospatial
Temperature model of
malaria
incidence
Forest cover Association
between
Hansen Data deforestation
and malaria
Deforestation incidence
Figure 8. Conceptual model for our analysis showing how the raw input data (blue boxes) were combined via intermediate data (white boxes) and
models (white diamonds) to produce our estimated outputs (red circle).
Our results did have some inherent limitations based upon routine health facility surveillance
data. First, reliability of such records varies across and within countries of the GMS and may depend
on malaria incidence level. This could lead to unmeasured residual confounding, further exacerbated
by the lack of available data on malaria control activities in the region. Another challenge with these
data is obtaining an accurate denominator for incidence, as not everyone attends a public health
center when febrile. We addressed this issue by modeling the probability of seeking treatment as a
function of travel time to the closest health facility using data from two cross-sectional surveys. Last,
the village-level geo-referencing of malaria registries ignores the possibility that patients may
become infected elsewhere. Unfortunately, these surveillance records did not include information
about patients’ forest-going trips. Research to track and analyse micro-scale movements of forest-
goers is needed to understand how they interact with the forest and where are the foci of infection.
The forest data we used has also been criticized, in particular for not distinguishing tropical for-
ests from agroforestry (Tropek et al., 2014; Hansen et al., 2014) or man-made from natural causes
of deforestation. The lack of temporal resolution for the forest gain variable (2000–2017 aggregate)
as well as the assumption that forest loss happens all in 1 year are additional limitations of these
data. Finally, our relative measure of deforestation, key to consistently compare the effects across
different spatial scales, also implies that a 0.1% of the area that experienced forest loss within 30 km
of a village is a much larger area (~280 hectares) than within 1 km (~0.3 hectare) and should be inter-
preted cautiously.
In conclusion, this study assessed the relationship between deforestation and malaria in Lao PDR.
Our approach leveraged surveillance records collected by the national malaria program and high-
Rerolle et al. eLife 2021;10:e56974. DOI: https://doi.org/10.7554/eLife.56974 16 of 45Research article Epidemiology and Global Health
resolution forest data and rigorously explored the spatio-temporal pattern of associations. As coun-
tries of the GMS work toward malaria elimination, our results highlight the challenges to transition
from P. falciparum to P. vivax elimination, confirm and characterize the importance of high-risk popu-
lations engaging in forest activities and suggest malaria programs may benefit from monitoring
areas of on-going deforestation using remotely sensed data.
Materials and methods
Study site and population
Lao PDR has seen a 92% reduction in cases between 2000 (280,000) and 2010 (23,000) (Lao PDR,
2016). Much of this progress has been attributed to heightened funding and better testing and
treatments (Okayas, 2018).
This study was conducted in eight districts (Figure 6) to leverage the ecological and epidemiolog-
ical diversity of Lao PDR. Four districts (Moonlapamok, Pathoomphone, Sanasomboon, and
Sukhuma) are situated in the southern province of Champasak where both P. falciparum and P. vivax
are endemic. The four other districts (Et, Paktha, Nambak, and Khua) each come from one of four
northern provinces (Bokeo, Huaphanh, Phongsaly, Luang-Prabhang) where P. vivax is endemic but P.
falciparum has reached historical lows (Lao national malaria database (dhis2), 2018).
The four districts in the north were chosen in consultation with district and provincial level malaria
staff to represent the epidemiology of malaria in the region. They were selected as part of a cross-
sectional survey designed to assess the prevalence and risk factors for malaria in northern Lao PDR
(Lover et al., 2018). This region is very mountainous and characterized by a diverse climate, low-
population density and limited road access (UNFPA, 2016). Land clearing using fires for agriculture
is customary.
The four districts in the south were selected within a larger cluster randomized controlled trial
(RCT) study designed to assess the effectiveness of high-risk group targeted active case detection in
southern Lao PDR (Lover et al., 2019), where more than 95% of the country malaria burden is con-
centrated (Lao national malaria database (dhis2), 2018). This region is characterized by a moder-
ately hilly and forested terrain and a workforce primarily engaged in forest-based and agricultural
activities (Bennett et al., 2021).
When designing the study, in collaboration with the national control program, we purposefully
excluded regions where we knew large programmatic activities where being implemented.
Malaria data
Malaria case data
We conducted a retrospective review of malaria registries recorded at all health centers in the study
districts between January 2013 and December 2016 in the north and between October 2013 and
October 2016 in the south. The registries included information on every patient that was tested
(RDT and/or microscopy) for malaria at the health center. Date, species-specific test results, demo-
graphic variables (age, gender, and occupation) and the village of residence of the patient were
recorded in the registries. With help from local Lao experts, village names were matched to a geo-
registry of all villages in Lao PDR compiled from the 2005 and 2015 national census Lao national
census, 2020 and provided by the Center for Malariology, Parasitology and Entomology (CMPE).
The geo-registry contains GPS coordinates and population of Lao PDR’s villages. Unmatched records
and records with missing date were removed from the analysis. Finally, these data were aggregated
to extract the monthly village-level malaria incidence.
Treatment-seeking data
One issue with using passive surveillance data is that not everyone will seek treatment at a public
health facility for a febrile illness, which can lead to an underestimate of the true incidence, if not
accounted for. To correct for that, we modeled the probability that an individual in a given village of
the study’s district would seek treatment at a public health facility when febrile. We assumed that
such probability is essentially driven by the travel time to the closest health facility. See Appendix 1 -
S1 for methods used to calculate travel times to closest health facilities.
Rerolle et al. eLife 2021;10:e56974. DOI: https://doi.org/10.7554/eLife.56974 17 of 45Research article Epidemiology and Global Health
To model the probability of seeking treatment, we used data from two cross-sectional household
surveys conducted in the eight districts where registries were collected. In the north, 1480 house-
holds across 100 villages were surveyed in September-October 2016 (Lover et al., 2018). In the
south, 1230 households across 56 villages were surveyed in the baseline assessment of the RCT
(Lover et al., 2019) in December 2017. In particular, survey respondents were asked whether or not
they would seek treatment at the closest health facility for a febrile illness and GPS coordinates of
their household were recorded.
We then used the cross-sectional surveys to model the probability of seeking treatment (at a pub-
lic health facility, implicit from now on), , as a function of travel time to the closest health facility, t
(Equation 1). To account for the correlation structure induced by the stratified sampling approach
used in the surveys, we modeled the number of successes (febrile patients seeking treatment), Sh;v ,
at the household level and included a random intercept for village in the logistic regression.
Sh;v ~ Binðh;v ; Nh;v Þ
(1)
logitðh;v Þ ¼ a0 þ a1 t h;v þ av
where Nh;v is the number of febrile individuals in household h of village v and av ~ N ð0; sa Þ.
We fit the models separately in the north and in the south and used the region-specific model to
predict the probability of seeking treatment at all villages of the study districts based on their dis-
tance to the closest health facility. The population who seek treatment was then calculated by multi-
plying the village population by the probability of seeking treatment. See Appendix 1 - S2 for travel
times and treatment-seeking probabilities results.
Forest data
For every 30 m pixel in Lao PDR, tree crown cover density for the year 2000 and year of forest loss
between 2000 and 2017, were obtained from Hansen et al., 2013. These layers were produced
using decision tree classifiers on Landsat remote sensing imagery (Hansen et al., 2013). Trees are
defined as ‘all vegetation taller than 5 m in height’ (Hansen et al., 2013) and forest loss as ‘the
removal or mortality of all tree cover in a Landsat pixel’ (Hansen et al., 2014). For example, as
depicted in Figure 7, the Hansen data indicates that the tree crown cover in 2000 in pixel 1 is 54%,
meaning that 54% of the 30 m pixel is covered by vegetation taller than 5 m. The Hansen data also
indicates that forest loss occurred in pixel in 2013, meaning that all of the tree canopy disappeared
in 2013.
Deforestation variable
To define our primary exposure variable, for all villages in the study districts and year of the study
period, we calculated the percent area within a buffer radius of 1, 10, and 30 km that experienced
forest loss in the previous 1, 2, 3, 4, and 5 years (Figure 7). These distances were chosen to explore
a range of spatial scales at which the forest environment may be differentially relevant for village-
based populations and forest-goers. To explore potential interactions between deforestation and
forest cover, we computed an alternate exposure variable, restricting to areas that both experienced
forest loss and had a tree crown cover density above 68% and 87%. Those thresholds are limits of
the inter-quartile range (IQR) of the distribution of tree crown cover density in any 30 m pixels within
10 km of study’s villages that experienced forest loss between 2000 and 2017. This alternate defini-
tion captures deforestation activities occurring in areas with denser forest cover.
Forest cover variable
We also combined the two Hansen layers to produce annual tree crown cover maps of the study dis-
tricts, assuming no changes prior to the year of forest loss but setting to 0 the pixel tree crown cover
density afterwards (Figure 7). For all villages in the study districts and year of the study period, we
calculated the average tree crown cover density within a buffer radius of 1, 10, and 30 km and for 0,
1, 2, and 3 year lags. This is a secondary exposure, adjusted for in the primary analysis.
Environmental covariates
Village population sizes were needed to estimate monthly malaria incidence. 2005 and 2015 popula-
tion estimates for the 491 villages of study districts were obtained from the national census
Rerolle et al. eLife 2021;10:e56974. DOI: https://doi.org/10.7554/eLife.56974 18 of 45Research article Epidemiology and Global Health
Lao national census, 2020. The annual population growth rate (3.7%) was used to impute popula-
tion values for two villages missing 2005 estimates and for two villages missing 2015 estimates.
Then, village-level population growth rates were used to estimate villages’ population per year
between 2008 and 2016, assuming linear annual growth rate (median = 1.7%, IQR = [0%; 4.5%]).
Altitude, temperature, rainfall, and access to health care were considered as potential village-
level confounders of the relationship between malaria and forest cover factors. Travel time to closest
health facility, computed for the treatment-seeking model, was used as a proxy for health care
access and villages’ remoteness. Altitude was extracted from SRTM (Jarvis et al., 2008) 1 km resolu-
tion layers. Monthly average day and night temperature were extracted from MODIS 1 km resolution
product (MOD11C3 Wan et al., 2015). Finally, monthly total rainfall was extracted from CHIRPS
(Funk et al., 2014) 1 km resolution publicly available data. The average and standard deviation of
the annual total precipitation and the average monthly temperature from the monthly time series
was computed over the 2008–2012 period, which corresponds to the 5 year time period directly
before our malaria data (2013–2016). This ‘long-term’ aggregation of the climatic variables is
included in the model to capture the spatial differences in overall climate between the villages of
our study area. To account for the seasonal effect of these climatic variables, monthly temperatures
and precipitation in the previous 1, 2, and 3 months were also extracted, as well as the average tem-
peratures and total precipitation over the previous 1, 2, and 3 months (seven ‘short-term’ variations:
in current month, in previous 1, 2, or 3 months and aggregated over current and previous 1, 2, or 3
months). See ‘Details on covariates’ below.
Altitude was missing for one village and we used an online elevation finder tool (FreeMapTools)
for imputation. Temperature was missing for 2.4% of the village-months over the study period, most
likely because of cloud coverage of the MODIS imagery. Monthly temperature was never missing
more than 2 years in a row at villages of the study’s districts and we imputed the temperature of the
same month of the following year (or prior year when needed), adjusting for average district-level
monthly temperature differences between the 2 consecutive years. Monthly rainfall was not missing
at any of the villages.
Statistical analysis
Statistical model
To model malaria incidence (Equation 2), the number of positive cases Yv;t at village v over month t
was modeled using a generalized additive model (GAM) (Wood, 2017). To account for overdisper-
sion, a negative binomial distribution was used, including an additional variance parameter n. The
probability of seeking treatment v , estimated from the treatment-seeking model, was multiplied by
the village population Popv;t to derive the population seeking treatment, Popseek
v;t . This was included as
an offset term in the incidence model. Spatial autocorrelation was accounted for by the bivariate
thin plate spline smoothing function on coordinates, f ðLat; LongÞ and village random intercepts were
included. A non-linear temporal trend was also included with the smoothing function on month, f ðtÞ.
Finally, the primary exposure, deforestation, and potential environmental confounders, including for-
i
est cover, were modeled with splines in f ðXv;t Þ. Splines add up polynomial basis functions in between
knots and allow to control for very flexible relationships with covariates and spatio-temporal trends.
Regularization was used to integrate model selection into the model fitting step by adding an extra
penalty to each term so that the coefficients for covariates can be penalized to zero, also meaning
that splines can be kept minimal if the data does not support more flexibility. See Figure 8 for a
graphical visualization of our conceptual model for this analysis.
Yv;t ~ NegBinðE½Yv;t ; nÞ
seek
logðE½Yv;t Þ ¼ logðv;t Popv;t Þ ¼ logðv;t Þ þ logðPopv;t v Þ
X (2)
logðv;t Þ ¼ bi f ðXv;t
i
Þ þ f ðtÞ þ f ðLat; LongÞ þ bv
i
with bv ~ N ð0; sb Þ.
We ran 15 models separately in the north and the south, each varying the buffer radius (1, 10,
and 30 km) and temporal scale for deforestation (previous 1, 2, 3, 4, and 5 years). The coefficients of
the linear effect for deforestation were extracted and exponentiated to get the incidence rate ratio
Rerolle et al. eLife 2021;10:e56974. DOI: https://doi.org/10.7554/eLife.56974 19 of 45You can also read